lorelie a. lenaour
TRANSCRIPT

IMPROVING TECHNOLOGY PROFESSIONAL DEVELOPMENT
LORELIE A. LENAOUR
B.Ed., University of Lethbridge, 1984
A Project Submitted to the School of Graduate Studies
of the University of Lethbridge in Partial Fulfillment of the
Requirements for the Degree
MASTER OF EDUCATION
FACULTY OF EDUCATION
LETHBRIDGE, ALBERTA
June 2004

Dedication
I dedicate this work to my husband Michael and my children Danielle and Taylor for their
constant love, support and encouragement throughout. You are my inspiration.
Ill

Abstract
The purpose of this project is to identify effective technology professional development
practices and to provide direction for future professional development in the Holy Spirit
School Division as it relates to integration of ICT Outcomes. Factors considered in
identifying effectiveness of professional development activities included teachers'
perceptions of:
1. appropriateness in content and applicabihty
2. relevance to their teaching assignment and their dehvery of the Alberta ICT
Outcomes
3. sustainability and support for review and further learning in the area
An online survey was administered to teachers in the Holy Spirit School District during the
spring of 2004. Five recommendations emerged based on the findings:
1. facilitate ongoing technology infiised curriculum meetings,
2. develop and support District and school based leadership,
3. provide for a variety of technology professional development opportunities,
4. budget effectively for evergreening of technology, and
5. focus technology integration on the improvement of student leaming.
IV

Acknowledgements
I would like to acknowledge the support and guidance of my supervisor, Mario Steed
and committee member, Lorraine Beaudin. Thank you for ensuring that I did my best.
Thank you to the teachers in Holy Spirit School District for your support of this
project, through opeimess and honesty in your survey responses.
Thank you to the Holy Spirit TLC team; Lee Koran, Gina Troskot and Ken Hakstol
for your dedication to life long leaming as we continue to break new ground in the area of
educational technology.

Table of Contents
Dedication iii
Abstract iv
Acknowledgements v
Table of Contents vi
List of Tables ix
List of Figures x
Chapter 1: Introduction 1
Background 1
Chapter 2: Literature Review 3
Pedagogical Perspective 3
Technology Professional Development 4
Obstacles to Effective Technology Professional Development 10
Chapter 3: Method and Procedures 13
Research Question 13
Sub Questions 13
The Survey Instrument 14
Definition of Terms 16
Teacher 17
Technology Skill Development Workshop 17
Technology Focused Courses 17
Technology Focused Conferences 18
Online Courses and Online Tutorials 18
VI

E-Mail Groups and Listserves 18
Intemet Resources and Web Sites 18
Books, Journals and Other Educational Technology Print Resources 19
Technology Coordinator 19
Teacher Guide 19
TELUS Leaming Connection (TLC) Team 20
Grade Level and Subject Area Meetings 21
Telecollaborative Intemet Projects 21
Youth Initiatives Project 21
Class Release Time 23
Peer Tutoring or Mentoring 23
Observing Other Classes 23
Chapter 4: Findings and Analysis 24
Participation 24
Comparison of Current and Previous Technology Surveys 24
2004 Technology Survey 27
Teacher Technology Competence 31
Student Uses of Techno logy 41
Technology Professional Development 44
"Effective" forms of Technology Professional Development 46
"Unpopular" forms of Technology Professional Development 55
"Least Favored" Technology Professional Development 59
Vll

Chapter 5: Discussion 61
Technology Professional Development Needs 61
Class Release Time 61
Integration Strategies 62
Human Resources 64
Barriers to Integrating Technology Outcomes into Curricular Areas 66
Time 66
Access to Technology 66
Evergreening of Technology 67
Addressing Technology Professional Development Needs 71
Integration of Technology into Classroom Practice 71
School Based Leadership 72
School District Leadership 72
Variety of Technology Professional Development Opportunities 73
Chapter 6: Conclusions 77
References 79
Appendices 82
A: Technology Professional Development Needs Survey 82
B: Crosstabulation Tables for Professional Development Ratings 89
Vlll

List of Tables
Table
1. Participation rates by division level for the 1996, 2000 and 2004 technology
surveys 26
2. Crosstabulation for newness of home computer and home Intemet access
with skill levels 33
3. Computer uses by teachers for division levels 37
4. Computer uses by students for division levels 42
5. Student to computer ratios by school 70
IX

List of Figures
Figure
1. Participation by school 29
2. Participation by division level 30
3. Teacher self assessment of technology skill level 32
4. Number of computer uses for personal skill levels 36
5. Weekly hours of computer use for skill levels 39
6. Histogram of reported teacher technology competence 40
7. Effectiveness of technology professional development by type 45
8. Bar charts for effective professional development by division level 51
9. Bar charts for unpopular professional development by division level 57
10. Bar charts for unfavored professional development by division level 60

Chapter 1: Introduction
Over the past 5 years, the Holy Spirit School Division has been involved in the
planning and delivery of various technology professional development activities for
teachers within the district. During this time, all areas of teacher preparedness in the
delivery of the Information and Communication Technology (ICT) Outcomes have
shown growth. In this project, teachers in Holy Spirit Schools were surveyed in order to
identify effective professional development practice as it relates to integration of the ICT
Outcomes. Factors taken into account include demographic information such as grade
level, school and subjects taught; ways in which teachers use technology themselves;
ways in which teachers use technology with students and effectiveness ratings of various
types of technology professional development. The analysis of the survey data will
provide direction and focus for future professional development in the Holy Spirit School
Division.
Background
In June of 1998, Alberta Education released. Information and Communication
Technology, Kindergarten to Grade 12: An Interim Program of Studies. This document
reflected feedback received fi^om parents, school councils, school boards, school
superintendents, the Alberta Teachers' Association (ATA), business and other interested
citizens in response to an initial draft ICT Program of Studies. Mandatory partial
implementation of the new ICT Outcomes began in September 2001 with the goal of
having all classrooms in the province of Alberta achieve full implementation by
September 2003. Between 1996 and 2003, Holy Spirit School Division provided a variety
of opportunities for professional leaming for teachers in the area of technology, including

school based workshops, division-wide grade level and subject area sessions as well as
support for workshops, conferences and courses offered through the Southem Alberta
Professional Development Consortium, the University of Lethbridge, the Lethbridge
Community College and various professional organizations. In January of 1996 and
January of 2000, the school division conducted technology surveys to assess the progress
and needs of all stakeholders in the area of integration of technology into classroom
practice. This report will study current realities and future direction for technology
integration, teacher preparedness and professional development needs within the Holy
Spirit School Division. The survey used in previous years was rewritten to accurately
reflect current realities and to focus more specifically on analyzing the professional
development needs of teachers within the school division.

Chapter 2: Literature Review
The purpose of this section is to examine literature related to technology
integration and technology professional development. The first topic considered is
pedagogy underlying successful infusion of technology into classroom practice. The
second topic discussed is effective technology professional development that is built on
research of adult leaming and the change process involved in adopting new teaching tools
and practices. Finally, some of the obstacles to effective technology professional
development will be discussed.
Pedagogical Perspective
In Alberta Learning's Professional Development For Teaching Technology
Across The Curriculum: Best Practices For Alberta Schools (1999), it is acknowledged
that "technology across the curriculum" (p. 3) requires teachers to "significantly change
the way they work with students and facilitate leaming."(p. 1) Constmctivism is
identified as a key concept in teaching with the new technologies. "Constructivism must
be student-centered and authentic. Students no longer simply study "about science;
they "do" science. They do not merely memorize historical facts; they research, think
and write as young historians." (p. 7) Scheffler & Logan expand by stating that,
"knowing how to access information, evaluate knowledge sources, and apply knowledge
to issues and problems are primary leaming expectations for students in today's schools."
(1999) Professional development for teachers, then, goes far beyond how to run the
computer to encompass whole new approaches to teaching and leaming. If technology is
to facilitate the leaming of higher order skills and knowledge, it may require teachers to
examine their teaching practices. The "best practices" document recognizes that it is

natural for teachers to feel less effective before seeing the positive effects of new
teaching practices. FuUan (2001) describes this "dip in performance and confidence as
one encounters an iimovation that requires new skills and new understandings" (p. 40) as
the implementation dip.
At the heart of integration of ICT outcomes is the hope of improved student
leaming. Simply adding technology into the curriculum will not produce guaranteed
benefits to student leaming. The technology movement is coupled with definite shifts in
pedagogy fi-om behaviorist models to constmctivist models of leaming encompassing
student-driven, student-centered, project based, hands-on leaming (Alberta Leaming,
1999; Byrom, 1998; Carvin, 1999; Corcoran, 1995; Liebemian, 1996; Peck, Cuban 8c
Kirkpatrick, 2002 and Scrim, 1996). Teachers need to know more than just how to do
technology. They need strategies and practices that will help them to alter rather than
support their existuig teacher-centered practices (Peck et al., 2002). Beaudin (1998)
describes technology and educational change as a complex issue involving much more
than mere technological expertise. Sound pedagogical practice was found to be one
significant factor underlying successful change. Rodriguez (2000) states that "educational
technology is not, and never will be transformative on its own.... It requires the
assistance of educators who integrate technology into the curriculum, align it with student
leaming goals, and use it for engaged leaming projects." (Issue section, para. 1)
Technology Professional Development
There are various kinds of leaming, teachers will engage in, including developing
technology skills, using technology to enhance student leaming, and integrating
technology in subject areas. All of these areas work together in motivating teachers to

seek professional development. For instance, a teacher may first need to see how student
leaming can be enhanced through the use of technology before desiring to use it. As a
result, the teacher would seek technology skill development to effectively faciUtate
student leaming. "Comparison of competency studies since the 1980s indicate that
proficiencies essential to new technology implementation tend to transition fi-om
awareness, to knowledge and practice in basic operational skills, to building the skill into
routine classroom instmctional and management tasks." (Sheffler & Logan, 1999,
Comparison section, para. 1) The teacher, then, integrates technology into classroom
practice in increments as new technology skills are acquired.
Parr (1999) confirms the importance of "incremental integration into classrooms"
(p.7) in noting the gap between teachers' ability to use technology productively for
personal and professional use and their willingness to incorporate technology within their
classroom curriculum. Following intensive professional development over a four year
period, teachers reported significant increases in their "ability to operate a computer
system in order to successfully utilize software," and demonstrate "skills in using
productivity tools for professional and personal use" (Parr, 1999, p. 6). Similar increases
were not reported in "designing and developing student leaming activities that integrate
computing and technology for a variety of student grouping strategies and diverse
populations" (Parr, 1999, p. 6). Eifler, Green and Carroll (2001) reiterate this concem in
stating that many professional development activities in the area of technology are led by
people with business, computer science or math backgrounds. "These otherwise
knowledgeable people are not necessarily the best equipped to provide the assistance

teacher educators need to imagine the possibilities for integrating technology
meaningfully into their instmction" (Eifler et al., 2001, p.368).
Carvin (1999) points out that "teaching an educator how to use Netscape or
conduct an Intemet search only scratches the surface of what he or she needs to know in
order to successfully utilize the Intemet in the classroom" (p. 4). He goes on to point out
that teachers need to be exposed to "constmctivist teaching styles or community-building
professional development opportunities among their peers" (Carvin, 1999, p. 4) in order
to carry this over into their classroom practice. Byrom (1998) found that "when
professional development and technical assistance start with a particular teaching or
leaming strategy that the teachers believe will benefit their students.. .and then help
teachers discover ways technology is a tool that supports the strategy, teachers are usually
eager to try both the new instmctional strategy and the technology." (5* Factor section,
para. 1) It has been this researcher's experience that teachers need to take a creative leap
in using technology in new and meaningful ways with their students. Teachers "must
become 'fearless in their use of technology' and empowered by the many opportunities it
offers" (Rodriguez, 2000, Overview section, para.l). "We must begin to think of
ourselves as designers" (Clark, 1992, p.77)
Guskey (2002) points out that teachers are motivated to participate in professional
leaming when they can see that their efforts will be rewarded with improved student
leaming. Teachers need to believe that professional development "will expand their
knowledge and skills, contribute to their growth, and enhance their effectiveness with
students." (Guskey, 2002, p. 382) Guskey (2002) argues that changing teachers' beliefs
and attitudes involves a cyclical process where they leam through professional

development, try it out in their classrooms, see changes in student leaming and thereby
change their beliefs and attitiides. DuFour's (2002) concept of Professional Learning
Communities supports this position in that he believes that the focus of effective school
reform and professional development should first be on students leaming needs. The goal
of stiident leaming should be the guiding light for professional development. The focus,
shifts away from teaching to what are the learning needs of our students and how can we
ensure that our students learn? Strahan (2003) describes a spiral of reform activity which
involves teachers working together to develop stronger instmctional sfrategies. This in
turn enhances student achievement and strengthens collaborative bonds between teachers.
Teachers need to know that professional development will help them to create better
leaming opportunities for their students.
The best practices document states that new approaches to teacher professional
development are necessary for success in the area of technology. Professional
development needs to be systematic, systemic and sustained. One-time workshops are
not sufficient in bringing about long term effective change in teaching practices. In
Bloom's taxonomy of leaming, effective technology integration would involve multiple
levels of abstraction. Teachers need to feel comfortable in the area of knowledge or basic
understandings before they are able to effectively operate at the application level. Eifler
et al. (2001) echo this point in referring to the importance of teacher's ability to imagine
the possibilities in the development of lessons utilizing technology.
Best Practices identifies effective types of professional development for Alberta
Teachers in the area of technology. Workshops generally involve small focused topics in
which participants leam a bit of how to use the tools of technology along with classroom

8
applications. Often, the downfall of technology based workshops is that there is little
opportunity for teacher reflection, planning, follow up with workshop presenters or
collaboration with colleagues.
Mentoring and peer support projects involve teachers working in small groups
over a longer period of time in order to support one another in their professional
development. Some examples would be the Galileo Teacher Secondment Project,
Summer Institutes and the Shaw Teaching and Leaming with Technology Initiative.
In Holy Spirit Schools, grade level and subject area meetings provide stmcture
and support for mentoring. These recurring meetings provide professional development
activities that "enhance teachers' curriculum, leaming, and assessment competencies and
skills as well as classroom and instmctional management competencies." (Rodriguez,
2000, Curriculum specific section, para. 1) This is accomplished through teachers
forming partnerships with others who have similar teaching assignments and working
together to share, develop, implement and reflect on curriculum based technology infused
lessons. Corcoran (1995) affirms that, "if teachers are to teach for deep understanding,
they must be intellectually engaged in their disciplines and work regularly with others in
their field." (Guiding practices section, bullet 5)
Technology can also be used to facilitate professional leaming. Calgary Catholic
School District has developed self-guided booklets to assist teachers in their independent
leaming. Online courses and tutorials support anytime, anywhere leaming. E-mail
groups provide mutual support for ongoing interaction and problem solving. Video and
integrated media can allow teachers to observe model teaching practices or view and
analyze their own teaching. Videoconferencing is opening new possibilities for

connecting and collaborating with worid renowned presenters from home-based
locations.
Best Practices highlights two long-term, more comprehensive projects categorized
by tiie authors as Innovative. They are the Pegasus Project and the TELUS Leaming
Coimection (TLC). The Pegasus project focuses on Action Research for teachers while
the TLC uses a province wide cascade model for professional development.
The Pegasus project utilized an inquiry approach for teachers focusing on student
leaming. Teachers developed a "practical theory about how leaming is affected when
technology is used as a leaming and teaching tool." (Alberta Leaming, 1999, p. 79)
Teachers identified areas of concem with teaching and technology, developed a
hypothesis, then, planned, implemented, observed, reflected and revised their strategy
based on observed results. One of the main strengths of this approach to technology
professional development is that the process models that which teachers are expecting of
their students in an inquiry-based classroom.
TLC provides in-service to 240 Teacher-Leaders selected from all school districts
within the province. The Teacher-Leaders, in tum provide leadership and direction for
professional development opportunities for teachers within their school district. This is
supported by a world class, Alberta based web site. It has grown exponentially through
teacher submitted web sites, lesson plans and telecollaborative projects based on Alberta
curriculum. One particularly successful component of the TLC website has been support
for telecollaborative projects. Taking advantage of grassroots funding, teachers in
Alberta have participated in and initiated numerous telecollaborative projects over the
past 6 years. Harris and Grandgenett (2002) found that in addition to demonstrated

10
evidence of enhanced leaming opportunities for students, teachers who participated ui
curriculum-based onUne projects with their students "report authentic professional
development to a considerable degree." (p.54) Teachers reported that through engaging
their students in telecollaborative projects, they were enhancing their own leaming in the
areas of teaching practices; technology, presentation and communication skills;
classroom management; organization, instmctional design and lesson planning and
variety of teaching and leaming strategies.
Alberta teachers are now expected to submit annual professional growth plans to
help provide direction and stmcture to their ongoing leaming. In the past 3-5 years, the
need to leam skills associated with technology integration have dominated many teachers
plans. Teachers' desire to improve their skills in effectively integrating technology into
classroom practice requires both the development of baseline technology skills as well as
the exploration and development of sound pedagogical practices for integration into
subject areas.
Obstacles to Effective Technology Professional Development
Leaming new technologies takes time. Leaming new ways of teaching takes time.
Teachers have a very busy and demanding professional life. New curriculums are
introduced every year, new programs are introduced and new initiatives for school
improvement are developed. Teachers' time outside of the classroom is devoted to
planning, marking, reading, collaborating with other teachers, professional development,
extra-curricular work with students, communication with parents, and committee
meetings with school staff Unfortunately, the public and policy makers tend to believe
that teachers are only working when they are with their students.(Grant, n.d.) When

11
working to meet expectations of educational reforms such as integration of technology
into teaching and leaming, teachers "need more time to work with colleagues, to
critically examine the new standards being proposed, and to revise the curriculum. They
need opportunities to develop, master and reflect on new approaches to working with
children." (Corcoran, 1995, para. 2) The need for teachers to be able to step back and
reflect on their leaming requires time. Take, for example a full time teacher who attends a
traditional sage on the stage professional development workshop. They plan for a
substitute teacher to cover their classes for the day, attend the workshop and hear dozens
of wonderful new ideas and approaches and then retum the next day to their classroom to
unravel what happened while they were away, mark student work and plan for the next
days' lessons. There is no time to stop and reflect on what has been leamed or how to
incorporate it into their regular classroom. Reflection time needs to be built into the
professional development, time to think and time to discuss and plan for incorporation of
new ideas with colleagues. "On the whole, most researchers agree that local professional
development programs typically have weak effects on practice because they lack focus,
intensity, follow-up, and continuity." (Corcoran, 1995, Impact section, para. 2)
Rodriguez (2000) discusses altemative ways to find time for professional
development through scheduling teacher preparation times to allow for collaboration,
block scheduling, and banking time by adding minutes of instmction onto the school day
to free up non-instmctional days during the school year. Grant (n.d.) describes an
innovative program used in the Monterey Califomia Model Technology Schools where
"SuperSubs" were hired. These substitute teachers came in equipped with a technology
infused lesson for students that the regular classroom teacher teachers did not have to

12
plan. They provided release time for the classroom teacher work with other teachers to
improve their own technology skills, while giving students technology-based leaming
experiences.
Based on this review of the literatijre, the implications for technology professional
development are clear. Time and time again, research reminds us that effective
professional development needs to be an ongoing process rather than an event. (Cook,
1997; Fullan, 2001; Grant, n.d.; Guskey, 2002) This is especially trae with educational
technology due to rapidly changing technologies and the necessary pedagogical shifts for
many teachers. Sheffler & Logan affirm that, "instmctional content for technology
training programs cannot be static. Competencies must be reviewed constantly and
revised to address current technology." (1999, Conclusions section, para. 1) Effective
professional development also requires inquiry, interaction and problem solving
opportunities. Teachers need to leam in ways that they are being expected to teach m
order to intemalize both the processes and skills they expect of their students. "To create
inquiry-based environments for their students, teachers themselves need experience with
leaming in inquiry-based environments." (Grant, n.d.. Beyond section, para. 7) Time will
continue to be an issue for teachers and schools will need to continue to look for creative
ways to free up teachers for professional leaming and reflection. Technological advances
are beginning to facilitate new forms of delivery of professional development that enable
teachers to broaden their scope of leaming.

Chapter 3: Method and Procedures
Research Ouestion
This project examined the question: "What types of professional development
have been most effective in the past five years in helping teachers to effectively integrate
technology into classroom practice?" Factors considered in identifying effectiveness of
professional development activities were teachers' perceptions of:
4. appropriateness in content and applicability
5. relevance to their teaching assignment and their delivery of the Alberta ICT
Outcomes
6. sustainability and support for review and further leaming in the area
Sub Questions
In analyzing the results, numerous sub-questions were addressed to identify
relationships between demographic factors, professional development needs and how
teachers use technology with students. Sub questions include:
• Is there a relationship between computer familiarity and how teachers are using
technology with their students?
• Is there a relationship between the Division level taught and how teachers are
using technology with their students?
• Is technology being integrated more in some Division levels than others?
• Is there a relationship between computer famiUarity and technology professional
development needs?
• Is there a relationship between the Division level taught and the technology
professional development needs?
13

14
Questions relating to subject area and technology integration will only be touched on
witii caution due to problems associated with respondent interpretation of the question.
This will be discussed further in the Findings and Analysis section of this document.
• Is tiiere a relationship between subject area taught and how teachers are using
technology with their students?
• Is there a relationship between the number of different subjects taught and how
teachers are using technology with their students?
• Is technology being integrated more in some subject areas than in others?
• Is there a relationship between the number of different subjects taught and
technology professional development needs?
• Is there a relationship between subject area taught and technology professional
development needs?
Based on the teacher survey responses, fiature directions for professional development in
the area of ICT integration in Holy Spirit Schools will be recommended.
The Survey Instmment
During April of 2004, an online survey was sent to all 271 teachers in the Holy
Spirit School District. (See Appendix A) The survey included demographic information
such as school, grade and subject taught, baseline personal assessment of technological
skills, identification and assessment of ICT professional development experiences in the
past five years and recommendations for future ICT professional development. The
survey included multiple-choice, Likert-type rating and open-ended short answer
questions. Through the school district technology committee, school based technology
Teacher Guides were oriented to the survey and its purpose. They provided input and

15
helped to coordinate the adminisfration of the survey within their own school. School
principals provided input and approval of the survey at their regularly scheduled principal
meeting. With the support of school principals and school based technology Teacher
Guides, teachers were oriented to the purpose and significance of the survey. Each
teacher in the school distiict was invited to participate in the survey through e-mail and in
person by the researcher, the school principal and/or the school based technology Teacher
Guide. The survey was available online in electronic format. All responses are included
in the analysis of results.
The survey instrument was designed to address all teachers in the Holy Spirit
School District in Kindergarten to Grade 12. Despite all the attempts to acknowledge the
diversity of teaching assignments, some oversights occurred. Question #1 allowed
teachers to choose one of 5 grade level distinctions. Some teachers teach in more than
one division level and others teach in specialized areas such as principal, librarian and
special education. These choices were not provided on the survey instmment. A similar
problem occurred with question #2 where teachers were asked to identify their school.
Some teachers work in more than one school. In question #3, respondents were asked to
select the age of their home computer. Many teachers have more than one home
computer. However, this problem had an insignificant impact since it affected relatively
few respondents.
Questions # 7 and #8 were somewhat parallel in asking how much time teachers
spend per week on their computer at home and at school. The researcher did not ask how
much time was spent at work for personal computer use. The intent was to create some
sort of measure of computer famiUarity but it was naive to assume that there would be

16
negligible amount of time spent on school computers for personal use. The most
problematic question was question #13. Respondents were asked to select the average
tune per week their students spent using computers in class. They were asked to select
N/A if they did not teach the subject and none if they taught the subject and did not have
students using the computer in this class. Responses showed that this question was clearly
misinterpreted when elementary teachers reported using computers with students in
classes such as biology, chemistry and physics. In addition, many elementary teachers
who would logically teach 6- 8 different subjects left all subjects as N/A and reported a
time for 1 or 2 subject areas. With correct interpretation of the questions, they should
have selected none for all the subjects that they teach that they do not use computers in.
Based on these observations, results for question #13 need to be viewed with some
hesitancy.
Due to a glitch in the data collection, no results were collected for the open ended
question #17: What has been the most effective technology professional development you
have participated in? The researcher will rely on the effectiveness ratings given to
various types of professional development in the Likert scale responses of question #16
in order to answer this question. Please refer to Appendix A for a complete listing of
professional development types rated.
Definition of terms
Throughout the survey, a number of terminologies are used which require
clarification. The terms used in the survey are familiar to most respondents based on
shared history in the Holy Spirit School District and our common evolutionary
experiences in technology professional development.

17
Teacher. For the purposes of this sttidy, the term teacher referred to all practicing
teachers in the Holy Spirit School Division. It was intended to include classroom
teachers, specialist teachers, administrators and teacher librarians. It did not include
substitute teachers, nor did it include support staff.
Teachers were asked to rate the effectiveness of various types of technology
professional development. These types of technology professional development have all
been available to Holy Spirit teachers over the past 5 years to varying degrees.
Technology skill development workshop. A technology skill development
workshop is a workshop which focuses primarily on technology or a specific software. A
variety of technology skill development workshops have been offered within the school
district for such software programs as Microsoft Excel, Microsoft Word, Microsoft
Power Point, Kid Pix, Kidspiration, Inspiration and Macromedia Flash. Creation of web
pages would be another example of a technology skill development workshop. A
technology skill development workshop may or may not be a one shot affair.
Technology focused courses. Technology focused courses were courses offered
through the Lethbridge Community College and the University of Lethbridge. The
college courses tended to be business oriented, and were often focused on mastering one
or more software programs. University courses, were often more curriculum based such
as "Intemet and Education," "Computers in the Classroom," and the "Science and
Technology Summer Institutes." One of the main features of a technology focused course
would be that it is ongoing over a period of time and includes more than one session.

18
Technology focused conferences. A technology focused conference would be an
intense one to four day theme based workshop. Some examples are the annual Career and
Technology Studies and Computer Council Conferences.
Online courses and online tutorials. Online Courses in the area of educational
technology are readily available through many institutions throughout the world. Online
courses are led by a course instmctor and generally allow the student flexibility through
online, information sharing, discussions and assignment postings. They may or may not
include a face to face component but usually begin and end within a predetermined time
frame. In contrast, online tutorials are available through the Intemet to download and use
at any time. They usually do not involve interaction with an instmctor or classmates.
E- mail groups and listserves. E-mail groups and listserves are another variation
of onluie leaming. The key feature here is that there is interaction through information
sharing with others sharing a similar interest. Examples would include subscription to a
commercial electronic mailing list such as Macromedia, Jasc or Mailbox.com; or
professional organizations such as the Association for Supervision and Curriculum
Development, Alberta Teachers' Association specialist councils, or the Alberta Leaming
Technology Stakeholder group.
Intemet resources and web sites. Internet resources and web sites are meant to
refer to readily available online resources that support teaching and leaming in the area of
educational technology. This is a very broad category and could be further broken into
sub categories such as resources that support leaming technology skills, resources that
support curriculum areas, resources to support teachers, online resources for student use.

19
teacher or student created web resources, free and user pay resources, to name a few. For
the purposes of this sttidy, Intemet resources and web sites are lumped into one category.
Books, ioumals and other educational technology print resources. Books, journals
and other educational technology print resources are another source of professional
development available to teachers. Some of our schools hold current subscriptions to
technology related print material and some teachers utilize teacher guide books and
software print guides to enhance their technological expertise.
Technology Coordinator. During the 1999 - 2000 school years, the Holy Spirit
School District employed the full time services of a Technology Coordinator. This person
was responsible for coordinating technology related professional leaming opportunities
for all teachers in the district. The role included school visits, workshops and working
one on one with individual teachers. In addition, the current stmcture of school based
Teacher Guides and the TELUS Leaming Connection Team was initiated by the district
Technology Coordinator.
Teacher Guide. Each school has at least one teacher designated as the school
based Teacher Guide. Their primary role is to assist teachers in their school with the
integration of the ICT outcomes. In addition, school based Teacher Guides manage day-
to-day needs of teachers on technology integration and curriculum issues, act as contact
person to Network Operations/Equipment Technician(s), and identify and act on
professional development needs and plan for professional development. School based
Teacher Guides have also often taken on the role of technical supporter within their
schools. This role requires maintaining and managing the hardware and software of the
school, day to day technical maintenance, licensing of software, cleaning of hardware (in

20
conjunction with care-taking staff), addressing network issues or contacting Network
Operations/Equipment Technician(s) for guidance or assistance, and clearing out of
internal network systems, disposal of older equipment. The school based technology
Teacher Guide is usually a full time teacher. It is recommended that this person receive
compensation for their services through preparation time, release time from regular
classes and relief from supervision responsibilities.
TELUS Leaming Connection (TLC) team. The TELUS Learning Connection
(TLC) team consists of four members. The team has been in effect since 1998 working
initially under the direction of the technology coordinator. When the coordinator position
was not renewed in the 2000 - 2001 school year, the team continued to provide leadership
in technology professional development in consultation with the Deputy Superintendent
of schools and the school distiict Technology Committee. The role of the TLC team has
evolved over time and has included providing professional development for technology
integration for teachers within the school division, providing professional development
for technology integration for sttident teachers within the school division, preparing for
delivery of Teacher Guide workshops, working with teachers and adminisfrators,
individually and in groups. The TLC Teacher Leaders have stmctured professional
development delivery by designating each of the 4 Teacher Leaders to a particular
division level as well as designating each Teacher Leader a number of schools to liaison
with. Release time for the TLC Teacher Leaders has been provided through school
pooled fimding and the TELUS Leaming Connection provincial initiative. Currently, all
four of the TLC Teacher Leaders are assigned full time teaching or adminisfration duties
within their schools with one 40 minute preparation time per week to fulfill their TLC

21
roles, and up to 7 days per school year of substitute teacher costs. Over the past 3 years,
the release time provided to the TLC team through school pooled funding has been
gradually funneled back to the schools to support the development of leadership in school
based technology Teacher Guides.
Grade level and subject area meetings. Grade level and subject area meetings
were formally worked into the TLC team work plan during the 2000 - 2003 school years.
Over three school years, 5 half day sessions were held for each grade level in
Kindergarten to Grade 6 and each core subject area in Grade 7-12. Sessions focused on
presentation of knowledge, skills and ideas and group sharing of ideas and sfrategies on
the integration of information and communication technology outcomes into curricular
areas.
Telecollaborative Intemet projects. Telecollaborative Internet projects have been
used extensively by many teachers in Holy Spirit Schools over the past five years. Based
on informal information gathering by this researcher, teachers in Holy Spirit Schools
have initiated and received funding from Industry Canada for approximately 200 projects.
Since 1998, seventy different teachers in the school district have been involved as Project
Lead Teachers, bringing approximately $181,000 into their schools. All schools in the
district have been involved in telecollaborative projects to varying degrees. Evidence of
these projects is available online in the technology section of the Holy Spirit School
District website, www.holyspirit.ab.ca.
Youth initiatives project. The Youth Initiatives Project operated in the Holy Spirit
School District during the 2001 to 2004 school years. Each year, between 4 and 8
technology support workers were hired for up to 16 weeks each year through a grant from

22
hidusfry Canada. Technology sttidents from the Lethbridge Community College were
assigned to schools where they assisted the school based technology Teacher Guide with
the integration of the ICT Outcomes into cunicular areas. The youth worked largely in
one on one or small groups with teachers and students. The duties perfomied by these
youth in the area of technology were many and varied based on needs of individual
communities, schools, teachers and stiadents:
• Assisted with updating of district, school and classroom web sites,
• Assisted with workshops for groups of teachers in the area of telecollaboration and
project development,
• Worked with individual teachers during the school day and after school hours to
assist with development of skills in technology - word processing. Power Point,
Excel, Flash, Web Page Development, using e-mail,
• Assisted with class projects - an exfra pair of hands in a computer lab is a very
welcome enhancement to classroom climate,
• Worked with individuals and small groups of students to provide support in using
technology as a leaming tool - scanning, editing images, animation,
• Conducted on line research to find relevant web sites to support leaming for teachers
in the areas of student curriculum and teacher professional development,
• Provided technical assistance by loading programs, troubleshooting computer
hardware, software and networks,
• Provided assistance to staff as they worked on building their own material for
classroom use.

23
More details of the Youth Initiatives projects are available onUne at the Holy Spirit Web
site at http://www.holyspirit.ab.ca/~lorelie.lenaour/abouttlc.html.
Class release time. In some schools, teachers have used telecollaborative funds,
personal professional development funds and school funds to hire substitute teachers.
This has enabled them to use class release time to improve their technology skills. Often
teachers use this time to work together on telecollaborative projects or work one on one
or in small groups with TLC Teacher Leaders or the school based Teacher Guide.
Peer tutoring or mentoring. In some schools, the Teacher Guide to teacher or the
TLC Teacher Leader to teacher relationship has become formahzed to the point that it
could be classified as peer tutoring or mentoring. This has occurred where small groups
of teachers have worked together on areas of common interest over longer periods of
time. In some schools, teachers have used their preparation time or class release time to
observe other teachers with their classes.
Observing other classes. Observing other classes has occurred in computer lab
and classroom settings and is preceded and followed by peer discussion and mutual
sharing.

Chapter 4: Findings and Analysis
The research methods used in this study are descriptive and correlational. An
attempt has been made to examine and describe the current state of teacher preparedness
as well as teachers' daily practice in the infusion of ICT outcomes. In addition, we will
examine the level of effectiveness of various types of technology professional
development as rated and described in survey responses.
Participation
Comparison of current and previous technology surveys. The 2004 Holy Spirit
Technology Survey was administered entirely online. Every teacher in the Holy Spirit
School district has access to a reliable Intemet connection. Over the past 6 years, the
District Technology Committee and the Network Operations Specialists have worked
hard to ensure that connectivity is reliable and consistent between schools. The researcher
has assumed that all teachers in the Holy Spirit School District possess the technology
skills necessary to complete an online survey. Evidence from the 1996 and 2000
technology surveys show that the teacher response rate has remained very consistent
between the three surveys. In 1996, 140 teachers submitted responses to the paper and
pencil technology survey and in 2000, 145 teachers participated. The response rate for
this survey, administered online, was 146 out of 271 teachers. In 1996, 84% of teachers
reported owning a home computer and 16% had Intemet access at home. In 2000, 88%
of teacher respondents owned a home computer and 66.2% had Intemet access at home.
In 2004, 96.6% of respondents owned a home computer and 84% had Intemet access at
home. The obvious and expected trend is more teachers with home computers have
Intemet access and are gaining skills in the use of technology. The 2004 results.
24

25
however, could be slightly inflated due to what Howard (2004) refers to as the "subtle
selection bias" (p. xvi) associated with online survey administration. It could be that the
"sampling strategy presented a picture.. .that is far more wired than the population-at-
large." (Howard, 2004, p. xxxi) Respondents with home computers and Intemet access
would be more likely to be comfortable with the online survey format and more inclined
to submit their responses. It is possible that some teachers not proficient or
vmcomfortable with technology have been excluded due to inability to participate online.
Although the response rate over the three surveys remained constant, the nature of
who responded may have varied. The researcher encouraged all teachers to respond,
whether they had positive, negative or neutral comments to contribute. As will be seen in
the analysis of results, a range of satisfaction and proficiency levels were represented. As
far as sample selection is concemed, it is likely that those respondents who responded to
the survey have an interest in the area of technology professional development in the
school district and would, in tum be those most likely to participate in future professional
development opportunities. If this study indeed provides direction for future technology
professional development in the Holy Spirit School District, then the study sample is a
valid sample.
In reality, the most significant advantage to the online survey format was the ease
of adminisfration and collection of survey results for the researcher. "Web-based survey
also eliminates the time and expense of data entry because this is performed by the
respondents in the course of the survey." (Howard, 2004, p. xvii) During the testing phase
of the survey, it was discovered that the "submif' button was missing. The first 15
respondents printed their responses and the researcher later manually input them. Later a

26
fiorther four surveys were sent by facsimile to the researcher due to loss of the Intemet
connection while completing the survey. Respondents reported that the survey was
sfraightforward and quick and easy to complete.
Participation rates by division level have remained fairly constant through the three
adminisfrations of the technology survey as illustrated in Table 1.
Table 1.
Participation rates by division level for the 1996, 2000 and 2004 technology surveys
Division Level % Participation
1996 2000 2004
35% 33%
28% 28%
21% 22%
16% 16%
10% 1%
Total 100% 100% 100%
Division I
Division H
Division IH
Division IV
Undetermined
31%
22%
26%
8%
13%

27
2004 technology survey. This survey was promoted through word of mouth from
the researcher, the school principal and the school based technology Teacher Guide as
well as through e-mail messages. The Survey response rate varied between schools from
18.5% to 100% participation. The Holy Spirit School district had an overall response rate
of 53.9% or 146 of the total 271 teachers. Figure 1 illustrates the response rate for each of
the thirteen schools. Schools are represented by a number rather than name to ensure
anonymity.
The specific school by school differences in adminisfration of the survey were
reflected in participation rates. Survey administration was discussed personally with each
school principal. Based on the principal's direction, the survey was distributed to staff.
School 11,13 and 5 had all teachers complete the survey at one time during a scheduled
staff meeting or professional development day. (Some teachers were absent from school
that day) At school 4, the researcher met with all staff at a staff meeting to promote the
purpose and importance of participation in the survey. At 6 schools the researcher
obtained a list of all teachers and invited participation through personal e-mail messages
to all. At the remaining 7 schools, the school principal forwarded the personal invitation
from the researcher from his/her e-mail account. All school principals promoted
participation in the study through verbal encouragement and reminders to their teachers.
After the initial personal meeting with each school principal, the principals were
reminded of the time lines for survey completion in two follow up e-mail messages from
the researcher. The researcher extended a personal invitation through direct e-mail or face
to face contact with staff at schools 2, 3, 4, 5, and 13. The researcher has worked
personally with many teachers at schools 2, 3, 5, 11, 13 over the past 6 years as a TLC

28
Teacher Leader. This personal connection likely enhanced participation rates at the
schools.
Respondents represented all grade levels throughout the district. Figure 2 shows
the number of respondents by Division level. There is a comparable number of teachers
in the total population in each Division level except for the Kindergarten level which
would only include about 1/5 as many as each of the other categories. This is reflected in
the sample size. Kindergarten was kept as a separate category because curriculum,
computer use and especially hours in school vary significantly from the rest of Division I.

29
Participation by Scliool
100.00-
\ \ \ \ \ \ \ ^. % \ \ % %
\ % \„ \^ \ \ . \ , \„ \ \^ \ . \ \ V^ - V ^S -^& ^^ •̂V ^ > ^-9 ^/^ '^^ ^V -^^j '̂ ''̂ ^
Scliools
Figure 1. Participation by school

30
Number of Responses by Division Level
Kindergarten Grade 1-3 Grade 4-6 Grade 7-9 Grade 10-12
Figure 2. Participation by division level

31
Teacher Technology Competence
Teachers were asked to assess their personal skill level regarding computer
technology. Figure 3 shows that 1.4% of respondents claimed to have no interest in
technology, 16.6% rated themselves as beginners, 48.3% rated themselves as
intermediate, 29.7% chose above average and 2.8% rated themselves as expert computer
users.
Teachers' self reported skill level aligned with their reports of newness of home
computer, home Intemet access, number of different computer uses and number of hours
spent on the computer each week. For those respondents who had a home computer
newer than 2 years, 50% assessed their own skill level as above average or expert. In
confrast, 3.5% of respondents who had a home computer older than 5 years or no home
computer assessed their own skill level as above average or expert. Respondents with
home Intemet access assessed their personal skill level higher than respondents without
home Intemet access. Of those with home Intemet access, 35% ranked their skill level as
above average or expert while only 16% of those without home Intemet access ranked
their skill level as above average or expert. Table 2 summarizes the responses for
newness of home computer and home Intemet access with self reported skill levels.

Personal sl<ill level
32
T 1 r no interest just beginning Intermediate Above average
Personal skill level expert
Figure 3. Teacher self assessment of technology skill level

33
Table 2.
Crosstabulation for newness of home computer and home Internet access with skill levels
Personal skill level No Just Above
Interest Beginning Intermediate Average Expert Total Newness of Home Computer
Total
Home Intemet access
Total
don't own a home computer
more than 5 years
2-5 years
newer than 2 years
Count
% within Newness of Home Computer Count
% within Newness of Home Computer Count % within Newness of Home Computer Count
% within Newness of Home Computer Count % within Newness of Home Computer
yes
Count
% within Home Intemet access Count
% within Home Intemet access Count
% within Home Intemet access
0 1
10
24
1
.0% 16.7% 66.7% 16.7% .0% 100.0%
16
4.0% 16.0% 64.0% 12.0% 4.0%
32 13
1.7% 17.2% 55.2% 22.4% 3.4%
26
.0% 16.7% 33.3% 48.1% 1.9%
70 43
1.4% 16.8% 49.0% 30.1% 2.8%
12
5.3% 15.8% 63.2% 15.8%
21 58 39
S% 17.1% 47.2% 31.7%
24 70 42
1.4% 16.9% 49.3% 29.6%
0
.0%
4
3.3%
4
2.8%
25
100.0%
58
100.0%
54
100.0%
143
100.0%
19
100.0%
123
100.0%
142
100.0%

34
Teachers' number of different uses for computer technology reported also
supports their self assessed level of competence. Only 3 respondents out of the total 142
vahd responses rated themselves as expert. All 3 respondents vaUdated their claim by
stating that they used computers for 11 to 12 different uses. Above average computer
users selected 8, 9 or 10 different uses 51.3% of the time. Intermediate computer users
selected 8, 9 or 10 uses 65.7% of the time while beginners selected 8, 9 or 10 uses 45.9%
of the time. Only 2 respondents selected no interest in computers and they claimed to use
the computer for 5 and 6 different uses. The bar chart in Figure 4 summarizes the number
of computer uses for each personal skill level.
Table 3 shows the breakdown of types of computer use reported by teachers in
each division level. Class preparation; newsletters, memos and letters; professional e-
mail, chat groups and listserves; Intemet research; and location of web sites that match a
particular curriculum goal were the most popular forms of computer use. As will be seen
in the next section in the analysis of types of effective professional development, very
few teachers report participation in chat groups or listserves, therefore the high response
to this category reflects teachers' use professional e-mail a great deal.
Although a high number of teachers use computers for record keeping, this
activity is much more concentrated in the upper grades with 100% of senior high school
teachers using computer assisted record keeping, 96.9% of junior high teachers, 70% of
grade 4-6 teachers and 56.5% of Kindergarten to grade 3 teachers.
The least used computer appUcations were digital video, producing class web
pages and production of art or graphics. Both production of class web pages and
production of art and graphics were more prevalent in Kindergarten to grade 6. This is

35
evidence of the large number of teachers in Division I and E who have initiated
telecollaborative projects in which web pages are a requirement of the project completion
and funding. Other uses of computer technology identified by teachers included financial
planning, tessellations, simulations, online courses, data base and spreadsheet
applications.

36
1.00 I 3.00 2.00 4.00
Personal skill level • no iiKteiest 9 just beginning D Interimediate • Above average O expert
7.00 I 9.00 I 11.00 I 13.00 6.00 8.00 10.00 12.00
Number of computer uses
Figure 4. Number of computer uses for personal skill levels

37
Table 3.
Computer uses by teachers for division levels
Class Preparation
Record Keeping
Instmction for in-class demonsfrations Newsletters, memos, letters
Professional e-mail, chat groups, listserves Producing class web pages
Production of multimedia
Production of graphics or art
Intemet research
Location of web sites that match a particular curriculum goal Digital photography
Digital video
Other
Division Division Division Division Overall I II III IV
76.0% 87.8% 90.6% 95.7%
56.5% 70.7%
39.1% 61.0%
93.4%
84.7% 82.9% 84.4% 91.3%
28.2% 24.4% 12.5%
36.9% 29.3% 18.8% 34.8%
91.3% 95.1% 100% 91.3%
65.2% 73.2% 59.4% 78.35
85.9%
96.9%
31.3%
82.9% 71.9% 87.0% 84.5%
100% 76.8%
91.3% 52.1%
85.2%
17.4% 21.8%
43.4% 65.9% 56.3% 65.2% 56.3%
30.3%
94.4%
68.3%
39.1% 56.1% 31.3% 56.5% 45.1%
10.8% 7.3% 6.3% 21.7% 10.6%
4.3% 4.9% 3.1% 8.7% 5.0%

38
Teachers who report higher levels of computer skill competence spend more time
on the computer each week than teachers who report lower competence levels. Expert
users reported using the computer from 18 to 36 hours each week. Above average
computer users reported using the computer for 18 to 29 hours 53.5% of the time. Most
beginners (62.5%) use the computer between 6 and 12 hours each week, while 52.9% of
intermediate users use the computer between 6 and 12 hours each week. The bar chart in
Figure 5 summarizes the hours of computer use reported in the categories for home and
school work and personal computer use combined into 6 groupings.
Teacher technology competence, therefore, takes into account a number of related
variables. A numerical value of competence was tabulated for each respondent based on
the sum of positive responses to newness of home computer, access to the Intemet at
home, number of years using computers, personal ranking of technological skill level,
hours of computer use at school and at home for both work related and personal use and
number of different uses for computer technology. The highest score possible was 63
points and the lowest was 4. The responses submitted by Holy Spirit School teachers
ranged from 16 to 61 points. The histogram in Figure 5 shows the reported range and
distribution of teacher technology competence.

39
4 0 -
3 0 -
O 2 0 -
Personal skill level • no interest 8 just beginning D Intermediate • Above average O expert
..^ Ji Jl ji il i 0-5 6-12 18-23 30-36 12-17 24-29
Weekly hours of computer use
Figure 5. Weekly hours of computer use for skill levels

Histogram
40
20.00 40.00
competence
Mean = 32.7589 cl.Dev. = 10.22944
M = 141
60.00
Figure 6. Histogram of reported teacher technology competence

41
Student Uses of Technology
Teachers in Holy Spirit schools report using computers with students in a number
of different ways. Almost 61% of teachers reported using technology with students in 4
to 8 different ways. About 23% reported using technology with students in 3 or fewer
different ways and 16% reported using technology with students in 8 or more different
ways. A range of student uses appeared in every Division level. Using regression
analysis, a correlation coefficient of .597 and an R square value of .357 were obtained for
teacher number of uses and student number of uses for technology. A correlation
coefficient of .318 and an R square value of. 101 were obtained for teacher personal skill
level and student number of uses for technology. A correlation coefficient of .413 and an
R square value of. 171 were obtained for teacher hours of computer use per week and
student number of uses for technology. The overall teacher competence score had a
correlation coefficient of .464 and an R square value of .215 with number of student uses.
It appears, then that generally, the more competent the teacher is with computer
technology, the more likely they are to integrate a larger variety of student uses of
technology into their program.
As can be seen from Table 4, overall the most common use of technology for
students in all division levels is for word processing. Other common stiident uses were
Intemet use, keyboarding and reward games. Some student uses such as computer
assisted leaming, drawing and painting, keyboarding and participation in
telecollaborative projects were more popular in Division I and E, while activities such as
data gathering and analysis, e-mail use, presentation software use and creating web pages

42
were more common in Division m and W. This data supports the leamer outcomes as
described by division level in Alberta Leaming's ICT Outcomes.
Table 4.
Computer uses by students for division levels
Division Division Division Division Overall I II III IV
Publishing / Word Processing 67.3%
17.3% Data gathering and analysis (spreadsheet / database applications) Computer assisted leaming (leam 71.7% from software that teaches academic content, review, practice, reinforce basic skills E-mail use 19.5%
87.8% 81.3% 82.6% 78.9%
56.1% 31.3% 65.2% 39.4%
53.7% 28.1% 47.8% 52.8%
17.1% 31.3% 39.1% 24.6%
Intemet use 52.1% 85.4% 62.5% 82.6% 69.0%
Drawing and painting
Planning (e.g. mental mapping. organization, webbing. flowcharting, outlining) Presentation software (e.g. Power Point, Hyper studio) Information gathering/ resources (e.g. CD-ROM Encyclopedia) Drafting (CAD)
Keyboarding / Typing
Telecollaborative Projects
Creating web pages (producing work for online sharing) Reward (games)
Other
86.9%
8.6%
30.4%
13.0%
0%
71.7%
39.1%
15.2%
56.5%
2.1%
56.1%
19.5%
58.5%
43.9%
2.4%
65.9%
31.7%
9.8%
63.4%
14.6%
31.3%
6.3%
43.8%
43.8%
0%
21.9%
9.4%
15.6%
43.8%
6.3%
17.4%
17.4%
73.9%
47.8%
13.0%
30.4%
4.3%
26.1%
43.5%
4.3%
54.2%
12.7%
48.6%
34.5%
2.8%
52.1%
24.6%
15.5%
53.5%
7.0%

43
hi examining which subject areas teachers are using computers with their
students, it became apparent that the most commonly reported amount of time for any
subject area was 0-30 minutes per week, hi correlating these times with the comments
given to the open ended questions, access to current technologies, computer labs and
classroom technologies showed up as often cited difficulties. Teachers also expressed
fi^lsfration with the tight amount of time they have to cover the already challenging
subject area curriculums and the need to have technology outcomes inserted directly into
existing subject area curriculums. Some teachers are concemed that technology takes
more time than fraditional methods of completing assignments for students.
Difficulties arise when trying to compare the amount of time teachers devote to
technology when their teaching assignments vary greatly from teacher to teacher. In
Division I, it is not uncommon for the home room teacher to teach all eight subject areas.
As we move up the Division levels, more departmentalization tends to occur and one
teacher might teach anything from homeroom to specialization in one subject area. As
noted earlier, the survey question was met with some confusion from respondents and so
it is questionable whether the respondents meant none or N/A in regards to not integrating
technology into a subject area or not teaching the subject at all. In Division DI and IV,
numerous teachers noted their fhistration in not being able to book time for their students
in the computer lab. A teacher who teaches Language Arts all day is not able to book into
the computer lab for all their classes and this can make integration of ICT outcomes
difficult to impossible. In examining subject area integration of ICT outcomes, it is clear
that technology is being integrated in Language Arts, Math, Science and Social Studies to
higher degrees than in Religion, Physical Education, Art, Music, Drama, and French.

44
Technology Professional Development
Section 16 of the online survey had teachers rate the effectiveness of their
professional development experiences. Degree of effectiveness was to include
appropriateness in content and applicability; relevance to their teaching assignment and
the ICT curriculum; and sustainability of leaming. Teachers rated each of 18 types of
technology professional development on a scale that included highly effective, effective,
undecided, ineffective, highly ineffective and not applicable. In addition, teachers were
prompted to add and rate other types of professional development not included in the list.
Appendix B includes the crosstabulation tables for each question with a breakdown of
responses by division level. In most cases, there was not much difference between
division levels in responses to questions. Differences will be highlighted in cases where
they were apparent. The responses tended to cluster into three groupings including
effective, unpopular, and least favored technology professional development. Figure 7 is
a transposed box plot showing median, inter quartile range and total range of responses
for each technology professional development type. Professional development types will
be examined in reference to the three clusters.

45
Classroom Observations -
Peer Tutoring or Mentoring -
Youth Initiatives -
Telecollaborative Projects -
Class Release Time -
School Teacher Guide -
Grade Level/Subject Area Meetings -
TLC Teacher Leaders
Technology Coordinator -
Internet Resources and Web Sites -
Books, Journals, Print Resources -
Participation in E-mail Groups or _ Listserves
Online tutorials -
Online Courses -
Technology Focused Conferences -
Technology Focused Courses -
One Shot Workshops -
Technology Skill Development _ Workshops
O
O
o
o
—*
o
o
o
o *
o
o
o
o
o
o
o
o
Highly Effective
Effective Undecided Ineffective Highly
Ineffective
Figure 7. Effectiveness of technology professional development by type

46
"Effective" forms of technology professional development. Twelve of the
eighteen types of technology professional development will be discussed in this section.
The median for all of these groups fell in the effective range and a substantial percentage
of respondents reported participation in these form of technology professional
development. Figure 8 summarizes the findings for technology professional development
that was rated as effective.
Peer tutoring or mentoring was reported to be effective or highly effective for
86%) of respondents who had participated in this form of technology professional
development. Only 2.8% of those who had utilized this form of technology professional
development felt that it had been ineffective or highly ineffective professional
development. Nearly 21% of all respondents had not participated in peer tutoring or
mentoring.
Intemet resources and web sites were rated as effective or highly effective for
86% of respondents who had used this resource. Intemet resources and web sites were
rated ineffective or highly ineffective professional development for 4.1% of respondents
who had used the resource. Only 7.6% of all respondents had not used Intemet resources
or web sites for technology professional development. As can be seen from the
professional development box plots in Figure 7 the cluster of over 75% at the effective
rating leaves only a few outiiers for each of the other responses. It appears that there is
agreement at all grade levels in this school division that the Intemet is a valuable leaming
tool for teachers.
Class release time was reported to be an effective or highly effective form of
technology professional development by 70% of respondents who had participated in this

47
fonn of technology professional development. Only 6.2% of this same group reported
ineffective or highly ineffective and 22.9% reported undecided. Class release time was
rated as not applicable for 27.8% of all respondents as a form of technology professional
development. In the comments section of the survey, respondents mentioned class release
time as a need 35 times.
For respondents who had participated, 75.6% felt that technology skill
development workshops were effective or highly effective. Only 7.2% of this same group
reported technology skill development workshops as being ineffective or highly
ineffective. In comparing Grade Levels, 69.6% of teachers from Grade 1-3 reported
technology skill development workshops as effective or highly effective, while 75% of
Grade 4-6 teachers, 76.7% of Grade 7-9 teachers and 72.2% of Grade 10-12 teachers
reported technology skill development workshops as effective or highly effective.
Throughout the comments to the open ended questions, there were approximately 6
positive references made to this type of professional development. They included the call
for workshops in specific areas such as multimedia, spreadsheets, Ms Word, Excel, Power
Point, digital photography, SMART boards, electronic report cards, and digital video. In
addition, there were 22 specific references to the need to develop skills in web page
development.
In the area of classroom observations as a form of technology professional
development, 40.6% of respondents selected not applicable. Of those respondents who
had participated in classroom observations 65.8% reported effective or highly effective
professional development and 6.3% felt that the use of classroom observations had been
ineffective or highly ineffective professional development.

48
Almost 32% of all respondents selected not applicable for Telecollaborative
Projects as a form of technology professional development. By omitting the respondents
who chose not apphcable, 61.1% of those who had participated in telecollaborative
projects found it to be effective or highly effective form of technology professional
development. In the comment section of the survey, respondents mentioned a need to
develop skills in the area of telecollaborative projects 12 times.
Twenty two percent of all respondents selected not applicable for Youth Initiative
Program as a form of technology professional development. Of the respondents who had
utilized the youth initiative workers, 65.8% of those who had used the Youth Initiative
Workers found it to be effective or highly effective form of technology professional
development and 7.7% found them to be ineffective or highly ineffective.
The TELUS Leaming Coimection (TLC) Teacher Leaders were rated as
delivering effective or highly effective professional development by 60.4% of all
respondents. Only 8.2% reported not applicable, which is testament to the
comprehensiveness of this initiative. Of those who had utilized the TLC Teacher Leaders,
only 17.1% felt that the use of TLC Teacher Leaders had facilitated ineffective or highly
ineffective professional development. In comparing division levels, 66.7% of
Kindergarten teachers, 69.5% of Grade 1-3 teachers, 74.8% of Grade 4-6 teachers, 57.1%
of Grade 7-9 teachers and 43.8% of Grade 10-12 reported the use of TLC Teacher
Leaders as being effective or highly effective professional development.
Teachers' use of a School Based Teacher Guide was reported as effective or
highly effective professional development for 60.1% of respondents who had utilized
them. Only 15.9% felt that the use of School Based Teacher Guide had been ineffective

49
or highly ineffective professional development. Overall, 15.7% of all respondents had not
used their school based Teacher Guide for technology professional development.
In the comments section of the survey, there were over 40 comments relating to
increasing time and access for human resources and leadership in the area of technology
professional development. For the most part, respondents felt that Youth Workers,
Teacher Guides and TLC Teacher Leaders were doing a good job, but there were just not
enough of them to go around. School based Teacher Guides and TLC Teacher Leaders
often have full time teaching responsibilities and one respondent noted that "the tech
person in our school is often run off her feet helping others and takes away from their
teaching time." Another respondent said, "Our present Teacher guide is also our
Librarian and has an exhausting schedule meeting the needs of K-9." Numerous
respondents commented on the importance of having someone in the school with
technical and curricular expertise to be available to mentor or help others with technology
integration. Many teachers expressed fhistration with their own abilities to solve
technical problems and called for increased technical support. Some called for the fiiU
time placement of an experienced person in the computer lab to assist with curricular and
technical concems.
Eighty two percent of all respondents reported participating in grade level and
subject area meetings. Effectiveness seemed to vary somewhat based on division level.
Over half, or 56.3% of Grade 1-3 teachers, 69.7% of Grade 4-6 teachers, 52.1% of Grade
7-9 teachers and 46.6% of Grade 10-12 reported grade level and subject area meetings as
being effective or highly effective professional development. In addition, 83.4% of
Kindergarten teachers reported grade level and subject area meetings as being effective or

50
highly effective. This figure, however, needs to be viewed with caution since there were
only 6 respondents in the Kindergarten category. On the other end of the scale, 18.8% of
Grade 1-3 teachers, 12.1% of Grade 4-6 teachers, 13% of Grade 7-9 teachers and 20% of
Grade 10-12 reported grade level and subject area meetings as being ineffective or highly
ineffective professional development. No Kindergarten teachers felt that grade level and
subject area meetings were ineffective or highly ineffective. Respondents asked that
grade level and subject area meetings resume 23 times in the comment section of the
survey.
Fifty six percent of respondents who reported participation feh that books,
journals and other print resources about educational technology were effective or highly
effective. Books, journals and other print resources about educational technology were
reported as being ineffective or highly ineffective 15% of the time. High school teachers
reported books, journals and other print resources about educational technology as
effective or highly effective 78.5% of the time.
The use of a Technology Coordinator was reported as effective or highly effective
professional development by 54.4% of respondents. It appears that all but 11.9% of
respondents had utilized this resource. Since this position was last in effect during the
1999 school year, some of the respondents reporting not applicable may not have been
employed by the school district at during that time (for example newer teachers).
The bar charts in Figure 8 summarize the findings for technology professional
development that was rated as effective.

51
Divi-!on
7 b%nf aB
i^r::.it.-il!(.':
n I r
Internet Resources and Web Sites
HpQllr Lit'^'U.^ ijf 1. 1,1-,. in-tT-ifi.t Hir,nl>
Cliss Release Time
Divi'.iop • I' /itialj i|t,-'i • r.rn.l.' 1-,* D Gin 1̂ - I -• Ginl^ r-:J • Ui.-li- III-1.
:1H% -.ill l-'.pMI Vllt' I'-pnirril M' • Applli jt,:-
Figure 8. Bar charts for effective technology professional development by division level

52
Di VI SI on • h-ililv Ffl,. If, • r„a:|>- 1-1
I a Gi.T I- i-h ' • in-ltu 1,-,..
I ^- HI
' 4-t, Mf dli
.-pnt- ir iHt «pp̂ ^ ..iM-
" j l i l v blt>-L'i.- iJiiJe id-,||„-I1r i „ , ^,,|| E'--' iiv Ir-cttK Ir.H
Technel»sv Skill Oeveiepment Worlithopt
Classroom Observations
i I H% nf AW
H-,r- ^ndKlir-. -fllllTr-ll l i -Appll. j | - -
Hl.u-,1, Efl-. Irv-
Telecollaborative Projects
Figure 8 (continued). Bar charts for effective technology professional development by division level

53
pplii db l j
Hirnly C i t - i ' - - l.>i,i«,-,iit.il l i--«- I v - Hiahi'
Youth Initiatives
l-^p.ln.'-nt' i - p i i i t f i l M.,-
^:'.pli^ i M -
HhjMJv btt^ l i - IJnJ»-l0-t .i-T-i ri,» ^n|hl. En- t v - l r -« - I .
TLC Teacher Leaders
School Teacher Guide
Figure 8 (continued). Bar charts for effective technology professional development by division level
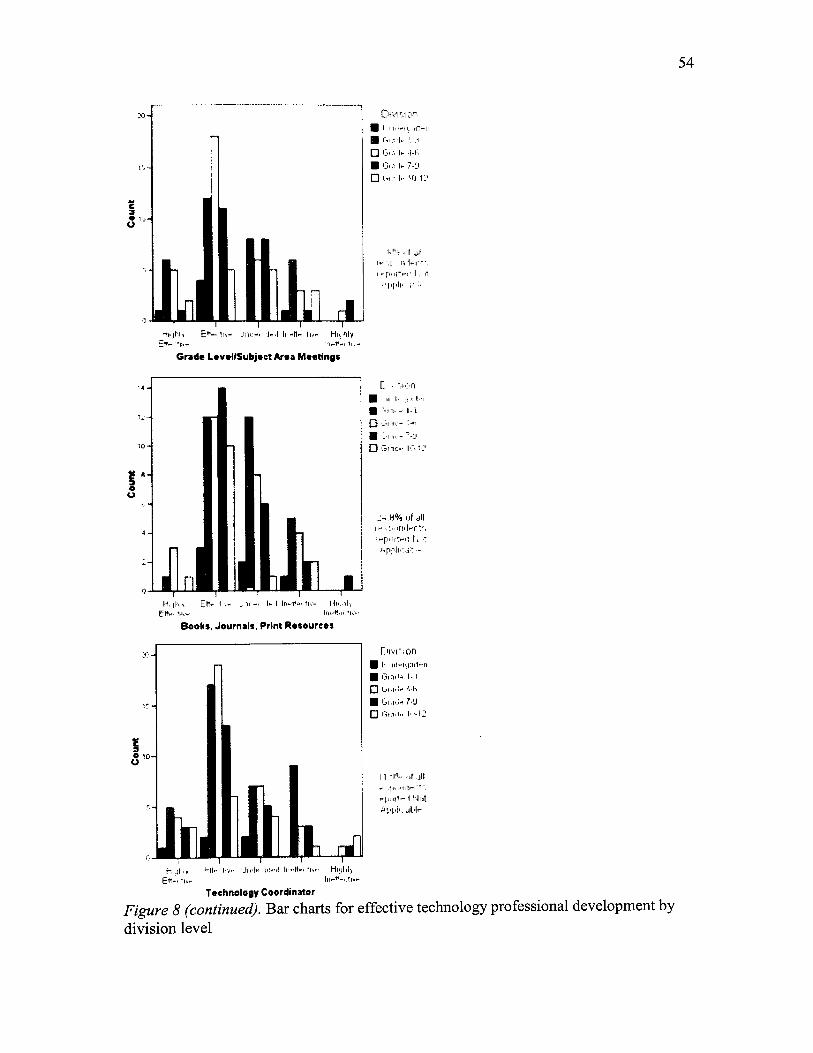
54
Divi'.i;:in
I I in.l«M: <,-•
D '-•• • I- i-i'
• Oi.-: 1^7-Li
D l ' i - I'- '•*! 1-
, - p , , i - e , . | . . t
-ti.ihi, E f - i n - Jilt— i-:i i i - t i - i i , - Hii-nrf
Grade Level /Subject Area Meet ings
E«». 1K'-
m l - T " .
Hppll . -aC -
H;.|h^ Ett- I ;- ^ 1 1 - ' I- I I r . - f - I IV- Ml., l i t In '̂fla
Books, Journals. Pr^nt Resources
Divi-ion
I I •!»•, .if J I I
-..p.,n,l.-i-^-. rpM|t.-lirJl<t Applh. j l l l r
H |l I irll.' I V" Uj.il.! lil.-iMi-ll... in- Hmlili 6tt-. - h - 111-"-' '<•'
Technology Coordinator
Figure 8 (continued). Bar charts for effective technology professional development by division level

55
"Unpopular" forms of technology professional development. Technology focused
courses, technology focused conferences, online courses, online tutorials and
participation in e-mail groups and listserves all had participation rates of less than 55%.
Forty five percent of all respondents had participated in technology focused courses,
43.8% for technology focused conferences, 41.5% for online courses, 54.5% for online
tutorials and 50.4% for participation in e-mail groups or listserves. For respondents who
reported participation in these types of professional development, 61% reported
technology focused courses as being effective or highly effective, 67.2% reported
technology focused conferences as being effective or highly effective, 53.4% reported as
online courses as being effective or highly effective, 53.4% reported online tutorials as
being effective or highly effective and 43.3% reported e-mail groups or listserves as
being effective or highly effective. Respondents reporting participation in these types of
professional development chose ineffective or highly ineffective 6.8% of the time for
technology focused courses, 6.3% for technology focused conferences, 12.3% for online
courses, 12.3% for onUne tiitorials and 14.9% for email groups and listserves. Ahnost
42% of respondents participating in e-mail groups and Ustserves were undecided about
their effectiveness. It appears that, for the most part, teachers who participate in these
types of professional development find them useful, but over half of the respondents in
this sttidy have chosen not to engage in technology focused courses, technology focused
conferences, online courses, e-mail groups or listserves. Figure 9 shows the distribution
by division level for each of the five professional development types that fall into the
unpopular category.

56
In the comments section of the survey, there were 5 positive references to online
courses, and technology focused courses. These respondents will likely pursue these
avenues individually without the assistance of school based support.

57
Hnihlf EH" l v« I'n.U. iiiH.- inuT-.»K- Hi.' i i l , F-«.'.:lw. |,i..||„. iv.
Tcchnelegv Focused Courses
-^iji ^ t n - I t - IJi J^M.Je.iilir-tl^.J;- " i\ ; E--1 'h - hi-lt- t l , .
Teehnolopy focused Conferences
5n''.% i.r j i i r-'.p 'illlr-l % -pi.It,-,I t. ,1 Apph. jr. ~
H .|P,v fc«-. IK- iJ i - l - . i.l.^.| : i - - - i ' n - riii.iil. Ef- . in ' - Iri-tl- 1 /•
Online Courses
Figure 9. Bar charts for high "unpopular" technology professional development by division level

58
l , i-, [ri-.,i [-,---,-i|.,--
Online tutorials
1.^-ii|-.r.-II
_Hlylll' e t | . - | i . - ;., l....^. (J.r.J ll.-H.. II,... h j l . ; . , -rt-<tp.- i i inn- i t i . -
Partlcipation in E-mail Groups or Listserves
Figure 9 (continued). Bar charts for high "unpopular" technology professional
development by division level

59
"Least favored" technology professional development. While no respondents felt
that one shot workshops were highly effective, 46.4% of those reporting participation feh
that they were effective. 33.6% were undecided and 20% felt that one shot workshops
were ineffective or highly ineffective. Interestingly, 50% of Grade 7-9 teachers were
undecided about the effectiveness of One Shot Workshops. Figure 10 shows the
distribution by division level for one shot workshops.

60
S,o. 1 1
1 L 1
l l n . l . . 1, -.1
One Shot
1 lc.«H.-i
Worksli
1
ops
1. « #,lv
In-n- l l . -
r i l ' . IMnr i
• 1 in.l.. ...il1~l
• G-.i'l.- I-)
D L-I. 1.T !-P
• i:.i,.ii.-^-j
D Gist)" V.-i.^
r.) • 0 • ii j i t i"".p.inf^nt'^. I.-P' i t - i l •li lt Apr Jhl..
Figure 10. Bar chart for least favored technology professional development by division level

61
Chapter 5: Discussion
Based on the survey findings, some trends emerge in relation to technology
professional development needs and barriers. This section will examine the needs and
barriers as well as some suggestions for addressing them.
Technology Professional Development Needs
Class Release Time. As has been previously discussed, about half of respondents
reported class release time as effective or highly effective professional development. In
addition, class release time was mentioned 34 times in the survey comments as a need.
Some schools in the district have managed to find ways to provide class release time to
teachers through creative timetabling, scheduling and budgeting. At one school, the
Teacher Guide is provided with a substitute teacher for at least two days per month. The
Teacher Guide has chosen to hire two substitute teachers on the same day to free up
themselves and another teacher. One substitute teacher covers the Teacher Guides'
classroom, while the second substitute teacher is scheduled to cover other teachers for
specified periods during the school day. At some schools, teachers regularly hire
substitute teachers to cover their classes using telecollaborative project funding to cover
the costs. This enables groups of two, three and four teachers to work together for part or
all of the day. Often these days revolve around mutual sharing and development of skills
and pedagogy involved in telecollaborative leaming.
Hiring substitute teachers is not always the best altemative for providing release
time for professional development. Planning for a substitute teacher is very time
consuming in and of itself and teachers tend to plan different types of student activities
for substittite teachers than they would for themselves. For example, most teachers would

62
choose to infroduce new topics and provide class instiiiction themselves leaving more
practice, follow up and skill and drill types of activities for substittite teachers. Although
this is not necessarily an ineffective use of student time, it can dismpt the regular flow of
teaching and leaming.
Integration Sfrategies. There were 41 comments submitted on the technology
survey that showed that teachers want to leam more about how to integrate technology
into subject areas. A few teachers called for Alberta Leaming to include technology
outcomes in the subject area curriculums since it is expected that the ICT Outcomes be
infused in the subject areas. The purchase of hardware and software needed to integrate
technology into teaching and leaming is a huge financial cost to schools and there needs
to be a good reason to justify the expenditure.
Teachers need to realize that teaching with technology not only enables, but also
requires changes in traditional teaching practice. (Alberta Leaming, 1999; Byrom, 1998;
Carvin, 1999; Corcoran, 1995; Liebemian, 1996; Peck, Cuban & Kirkpatiick, 2002 and
Serim, 1996.) For example, it is not reasonable to expect that you can take a class of 25 -
30 students to a computer lab and have them all go to the same web site and complete the
same online activity at the same time. A more valuable use of the resource would be to
differentiate instruction through having different students access different web sites,
perhaps on the same topic, (or better yet, student-selected topics) and then use the
technological tools available to share and present their findings in creative and innovative
ways.
Although teachers still feel the need to have technology workshops geared to the
operation of specific software (web page development, for example), over 40 teachers are

63
asking to leam new technologies in the context of optimal use with sttidents. The grade
level and subject area meetings are geared to provide professional development activities
that encourage collaboration and sharing among teachers with similar teaching
assignments Since the grade level and subject area meetings were held in 5 half day
sessions over a 3 year period, in many cases, teachers were able to form lasting
relationships with others that could be classified as teacher collaboratives (Grant, n.d.),
teacher networks (Corcoran, 1995; Lieberman, 1996; and Rodriguez, 2000) or
professional leaming communities (DuFour, 2004).
Teachers expressed interest in leaming more about how to plan and implement
telecollaborative projects at least 12 times in the survey comments. Telecollaborative
project work has enhanced technology integration in Holy Spirit Schools on a number of
different levels over the past 6 years. Teachers involved in telecollaboration have
enhanced their own leaming as noted earlier in Harris and Grandgenett's (2002) study of
unexpected teacher leaming outcomes. Telecollaboration lends itself well to more
subject-integrated, student-centered, constmctivist modes of teaching and leaming.
Teachers have also continued to form and sustain online leaming communities by
working with other teachers and students in the online environment. This researcher is
aware of numerous instances of teachers working together who did not meet face to face
until after significant online collaboration. The TELUS Leaming Connection has also
provided a financial incentive for teachers initiating telecollaborative projects. Rodriguez
(2000) affirms the importance of providing incentives for teachers to utilize technology.
Many teachers in Holy Spirit Schools, have used telecollaborative project funding to
enhance their skills and resources with technology. Most importantly, students have

64
benefited from participation in telecollaborative leaming. Students have been given the
opporttinity to use technology as a tool to enhance leaming in subject areas.
Human Resources. The final area which teachers expressed a definite need was
the area of human resources. At least 45 times, teachers expressed the need for increased
time and availabihty of then school based Teacher Guide, the TLC Teacher Leaders,
Youth Workers, a District Technology Coordinator and technical support. Byrom (1998)
found that "there seems to be a correlation between the amount and level of technical
assistance ... provide[d] and movement along the continuum of technology integration."
( 3^^ Lesson section, para. 1) In Holy Spirit Schools, the level of support for the
integration of technology is mainly a school-based decision. District-level support has
been downsized with the elimination of the position of District Technology Coordinator
in 2001 and the gradual decrease in school-pooled fiinds for the TLC Teacher Leaders.
The shift has been towards developing and sustaining school-based technology leadership
through the Teacher Guides. Schools have supported the role of the Teacher Guide to
different degrees, each reflective of the unique needs of the overall school culture and
student population. Teachers comments included, "Ensure that [Teacher Guides] have
time and $ to do the job effectively," "provide more support in numbers of people. Have
people available to support other teachers and classes. Have full time technology people
in each school," "you need people in each school that can be teachers/mentors to each
other," and "having someone with expertise in the school that I can talk to when I need
help or a question."
Teachers' comments also expressed support for the Youth Workers. Financially,
Youth Workers are a good investment because they bring to the school expertise in

65
frouble shooting technical problems as well as a varied background in different software
packages at a minimal financial cost. They can meet the technical needs of beginner to
advanced teacher expertise. The main drawback of hiring Youth Workers is that they are
not teachers with background in curriculum or pedagogy. As has been previously stated,
teachers are asking for more than just technology skill development alone. This needs to
be balanced with pedagogical best practices in technology integration.
Technical support is one of the most fhistrating issues for teachers. Peck et al.
(2002) report that one of the reasons technology is not being incorporated extensively in
classrooms is defects in technologies, such as computer freeze ups and crashes that cause
teachers to resort to backup plans. Holy Spirit teachers identified frusfrations with
availability of technical support with comments such as, "We need more people to be
able to be here when we need them to help us through frouble shooting and showing us
new programs," "computers freeze and not having tech support in the computer room to
help work with students," "teachers do not know how to fix computer problems.. .they
just want the technology to work when they need it." "We need to invest in more
personnel whose job it is to be on site, maintaining, upgrading and mentoring about
computers," and "the biggest problem I have to deal with is too many snags and
malfunctions in the computer lab, with the server [and] my classroom computer." Byrom
(1998) sums up these comments by stating that "teachers need on-site and on-demand
technical assistance with both the technology and the integration of technology into
teaching and leaming." (6* Lesson section, para. 1)

66
Barriers to Integrating Technology Outcomes into Curricular Areas
Time. Time was mentioned as a barrier to the integration of ICT outcomes at least
80 times in the survey comments. This is especially tme with professional development
in the area of technology. At least 12 respondents commented on the rapidly ever-
changing field of technology. Just when we think we might have begun to master a
software program or new piece of hardware, a new and better innovation is introduced. It
becomes easier and quicker to leam each subsequent innovation, but it is still time
consuming. It can be sfressful in and of itself just trying to stay knowledgeable about
what new iimovations are being developed and then entering into the decision making
process as to whether this is something that needs to be considered and purchased for
school use. In the Findings and Analysis section, it was discovered that only 12.7% of
teachers overall have incorporated technology for stiident planning. Teachers are not
encouraging their students to use mind mapping, organizational, webbing, flow charting
and outiining software. Although this type of leaming holds great promise for improving
higher order student leaming, many teachers are likely not familiar with it and do not
have access to it in then schools. Searching out usefiil relevant websites also requires a
large investinent of time and teachers find that the hitemet is also ever changing. Last
year's best web resource might not continue to be available, or there may be a user fee
attached and more interesting and interactive web sites are being posted each day. (Peck,
et al., 2002)
Arcess to technology. A second banier to integration of ICT outcomes is student
access to technology. This was mentioned 34 times in the survey comments and in ahnost
all cases came from Division m and Division IV teachers. The problem expressed is that

67
subject area teachers are expected to integrate technology but the computer lab is booked
solid with technology options classes. A teacher who teaches high school Language Arts
all day is not able to book a computer lab all day every day or even all day any day. This
makes integration of computer technology outcomes very challenging. The greatest
barrier in teachers' own words, "is sharing resources, rooms, and again, time allotment to
set up, teach and allow the sttidents to experience the technology fully on their own,"
"not enough lab time," "access to computer when you need it," and "sharing the
computer lab with the rest of the school." The issue of sharing a computer lab with the
whole school brings to mind the importance of creative and critical thinking to utilize the
tools that innovative technologies have to offer. Schools in southem Alberta are
beginning to experiment with altematives to the computer lab, with technologies such as
Personal Digital Assistants (PDAs), mobile laptop labs, wireless networking, SMART
boards and / or projectors in every classroom. Students in the Holy Spirit school distiict
are just beginning to bring their own laptops to school. The next obstacle then becomes
security issues in allowing them access to the network and the Intemet at school. Peck et
al, (2002), point out that "two traditional school stmctures - separate subject departments
and cellular classroom arrangements - work in tandem to forestall teachers' use of
technology." (Why so little impact section, para. 3) This might be a key to understanding
why the fiiistration of access to the lab becomes more apparent in Grade 7 - 1 2 than it is
in Kindergarten to Grade 3 where teachers, who teach numerous subjects to a home room
class can be more flexible in planning project work which integrates subject areas.
Evergreening of technology. In the Holy Spirit Technology survey, fhistrations
with outdated technologies were noted 33 times. One teacher even went so far as to say.

68
"Don't waste my time witii more workshops until the technology in the schools matches
our skills." Grant (n.d.) states that "teachers' mastery is dependent on their having
extensive hands-on time with the tools they are leaming to use." It is important that
teachers have access to computers that are reliable and can perform the tasks required.
Teachers in some schools in particular are outright fhistrated with the technology
available in their schools. Thirty three comments centered around teachers'
dissatisfaction with the technology available in their school. Another twenty four
respondents mentioned the high costs of technology. The purchase of technology
resources is a school-based decision and in some cases human resources are simply more
important than upgrading hardware and software. In Holy Spirit Schools, there is an
overall 3.49:1 ratio of students to computers and 6.92:1 ratio of students to modem
computers. Some schools, mainly due to financial constraints have very outdated
technology resources. Since modern technology in the district includes hardware that is
newer than 5 years, each school needs to set aside enough funding every year for ever
greening of technology. Within a 5 year time span, every piece of equipment should be
cycled through the system and replaced. In one school, 80% of respondents expressed
concem about outdated technology within their school, while 0 to 4 respondents from
other schools expressed concem. hi that same school, the ratio of students to modem
computers is 48.33 : 1 with 61 of the 67 student computers in the school older than 5
years. Teacher comments about ban-iers to technology integration included, "The fact that
most of the computers have problems with them (ex certain software doesn't work or
computer will freeze or shut down)," "The greatest banier is having programs that always
work. There is nothing more fi^strating than taking a group of 30 students to the

69
computer lab and having a third of the computers not work on whatever program we are
using," and "Our school has useless computers, ex. half dell 566mhz computers and half
are 10 year old Compaq 166." Table 5 illustrates the disparity in student to computer
ratios for schools in the Holy Spirit District.
The Computers for Schools program has been available to Alberta Schools for a
number of years, now. This program enables schools to purchase refurbished used
computer equipment at reduced costs. In Holy Spirit School district, technicians have
found that trying to install these computers of differing specifications on the school
system network causes more problems than benefits. The district has moved to a policy
of purchasing computers for the network of a certain quality and speed to enable more
consistency in operation of the technology.
In one Holy Spirit School, each teacher has been equipped with a laptop
computer. This allows them to load programs at school and then take them home to
practice and leam on. Teachers in this school were able to take home the elecfronic report
card program to work on student reports in the evening and on weekends in the comfort
of their own homes. "Hands on technology use at school and at home allows teachers to
develop confidence in their skills and a comfort level with the technology." (Rodriguez,
2000, Hands on technology use section, para. 2) The issue of fimding for sustainability of
technology will need to continue to be addressed in this school distiict and in the
province of Alberta in general.
Based on teachers' comments relating to technology professional development
needs and bamers to integration, it is clear that we need to continue to work toward the
dream of transparency in the use of technology to enhance teaching and leaming. Schools

70
will need to continue to explore creative ways to free up time for teachers to leam
together. This leaming needs to involve discussions about appropriate pedagogy as well
as development of technology skills and it needs to be scheduled at optimal leaming
times for teachers.
Table 5.
Student to computer ratios by school
School Total Number Number of Student to Student to of Student student Computer Ratio Modem Computers computers over Computer Ratio
5 years old School 1
School 2
School 3
School 4
School 5
School 6
School 7
School 8
School 9
School 10
School 11
School 12
School 13
Totals
250
67
93
120
96
47
112
67
92
108
53
81
116
1302
173
61
53
25
40
17
49
3*hardtotell
25
73
24
54
47
644
3.22
4.32
4.43
3.63
2.26
4.19
4.96
3.79
2.66
3.76
3.20
1.71
2.52
3.49
10.46
48.33
10.3
4.58
3.87
6.56
8.82
3.96
3.65
11.62
5.86
5.14
4.24
6.92

71
Addressing Technology Professional Development Needs.
Integration of technology into classroom practice. At least 40 respondents in the
Holy Spirit technology survey commented on the issue of working with colleagues to
invent, discover and create ways to effectively integrate technology into curriculum. As
noted in the Findings and Analysis section, 86% of teachers who had participated in peer
tutoring and mentoring found it to be effective or highly effective professional
development. Other effective practices related to working with colleagues included class
release time, class observations. Youth Initiatives Workers, school based Teacher Guides,
TLC Teacher Leaders and a distiict based Technology Coordinator. Teachers are asking
for grade level and subject area meetings for the purpose of leaming together. These
sessions were not meant to be workshops given or delivered to the participants. These are
not training sessions. The stmcture of these meetins has always been to promote
coUegiality among grade level peers and to "enable teachers to shape their own leaming."
(Grant, n.d.. Principles section, bullet 8) Based on the numerous comments from
respondents and support in the literature review, this researcher recommends that the
grade level and subject area meetings should be continued. But NOT as technology
meetings. They need to become curriculum meetings under the direction of the District
Coordinator of Curriculum. These meetings would then be curriculum based and
technology infused, rather than technology based. These meetings need to enable teachers
to experience inquiry-based leaming environments in order to intemahze its aims and
carry this into their classroom practice with students. (Grant, n.d.; Serim, 1996) The
meetings need to provide stmctures for teachers to continue to form partnerships.

72
collaboratives, and mentorship for one another. They need to be conducted in such a way
as to model exemplary teaching practice.
School based leadership. Over the past few years, the focus in the Holy Spirit
School District has shifted to working more intensely with school based Teacher Guides
to help develop leadership within each school. Human interaction was the underlying
theme of effectiveness in the survey results with 4 out of 6 of the most highly rated forms
of professional development involving direct human contact. Teachers said over and over
again in their survey comments that they needed more readily available help at the school
level. Teacher Guides have been welcomed and appreciated by teachers, but in order to
keep moving forward, schools will need to support the Teacher Guide stmcture through
providing release time for Teacher Guides and teachers to work together, preparation
time for the Teacher Guides and support for more than just one individual in each school
to assume the role. We risk bum out of our valuable Teacher Guide as a resource if
adequate supports are not put in place. School based Teacher Guides are school leaders
and are very likely to move on to other leadership roles, such as associate principals and
principals as opportunities become available. The distiict needs to plan for sustainabihty
of school based leadership through supporting more than just one technology leader in
each school.
School district leadership. Leadership in technology at the school district level
needs to continue. Many teachers would like to see the retum of the position of a
Technology Coordinator. If there is to be consistency across the distiict in teacher
technical competence, technology integration and adequacy of hardware and software,
there needs to be more district level leadership. All of the people who currently provided

73
leadership are doing so above their existing workload. A district Technology Coordinator
could help ensure levels of implementation through dedication to staying abreast of new
developments in the field of educational technology, networking with other district
leaders in the province and aroimd the world and assisting with important decision
making. Lack of funding has made this a bleak possibility.
In the absence of a district Technology Coordinator, district leadership needs to
continue through the district technology committee, the TELUS Leaming Connection
Teacher Leaders and the school based Teacher Guides with the support of Central Office
and Principals. School based support needs to be seriously considered in the selection of
potentially effective Teacher Guides, Youth Technology Support Workers and new staff
who are interested and knowledgeable in technology. The Holy Spirit Technology Survey
2004 demonsfrates that teachers are demanding on-site human technical and pedagogical
support for the integration of ICT Outcomes. Another altemative to improving human
support for technology in schools could be achieved by forming partnerships between
schools. High school students could perform work experience in elementary schools to
assist in the area of technology.
Variety of technology professional development opportunities. Teachers continue
to call for a variety of options for technology professional development. The box plot in
Figure 7 clearly illustrates that teachers support a variety of technology professional
development activities. We need to remember that teachers as learners have diverse
leaming styles and needs just as our students do. Professional development in the area of
technology needs to be ongoing and responsive to the needs of teachers. Fullan (2001)
reminds us that change is a process that can take a substantial amount of time. Grant,

74
(n.d.) refers to this as the long haul of change. Teachers want technology skill
development workshops at then own skill level. Of the teachers who had participated in
technology skill development workshops, 75.6% felt that they were effective or highly
effective. The main concem about this form of professional development expressed in the
comments was that this type of leaming should be geared to specific skill levels.
Teachers do not want workshops that go too slow while the leader helps beginners or so
quickly that they get lost. The Findings also provide some support for increasing
teachers' technical competence. The more ways a teacher could use technology was
moderately positively related to the number of ways they had their students use
technology for leaming. As teachers develop a broader knowledge base about ways to use
technology, they can begin to incorporate more variety into their teaching. In Language
Arts for example teachers can expect much more than simply word processing from their
students. The processes of planning, researching, organizing information, composing, and
publishing could all include different types of softwares.
Some teachers are eager to use the tools that technology has to offer through
online courses and tutorials, web based leaming, becoming involved in professional
development through videoconferencing, and telecollaborating with others around the
world. Although less than 55% of teachers had engaged in formal Intemet leaming
opportunities, those who had used these types of leaming felt that they were effective. In
addition, use of the Intemet for informal professional leaming was rated as effective or
highly effective by 86% of respondents who had used this resource for technology
professional development. This is a strength that the distiict can build on in planning
future professional activities. With the onset of Supemet and advances in

75
videoconferencing, teachers could tap into tremendous new and interactive fonns of
professional development, using technology as the tool to support their leaming
possibilities. This, in tum can be extended to classroom practices, where students can
acttialize the dream of the global classroom. Serim (1996), dreams of teachers who
embrace the concept of lifelong leaming and utilize the tools of technology to develop
professionally. Through a combination of online and face to face collaboration with like-
minded professionals, teachers could experience that which they hope to provide for our
students. Membership in professional communities could help teachers to: "(a) stay
connected to the most current knowledge in education, (b) engage in reflective dialogue
with other educators, (c) provide and receive emotional support, and (d) contribute to
what counts as knowledge in their field." (NCREL, 2004, Role of technology section, 4""
bullet) Technology offers us many new and different ways to leam and we are only just
beginning to tap into the possibiUties.
We have seen through the literature that teachers are motivated to participate in
professional leaming when they can see that their efforts will be rewarded with improved
student leaming. (Guskey, 2003) Many teachers are still waiting to see evidence of
improvement in student outcomes before they will fiilly commit to utilizing technology
for student leaming. One respondent stated, "I need to see the practicality and
overwhelming betterment of my teaching in using a specific process before I invest a
huge amount of time leaming it and refining it so that it is useable." This researcher sees
the answer as two fold. First, we must begin to document, measure and record changes in
student leaming due to the use of educational technology. Secondly, we need to help
teachers understand that it is not technology in and of itself that will enable student

76
improvement. The pedagogical shifts discussed throughout this document are key to
making changes and reaping the benefits that are available to us.

Chapter 6: Conclusions
Holy Spirit teachers have been involved in a wide variety of technology
professional development experiences over the past six years. Early on professional
development in the area of technology seemed to focus primarily on developing skills in
technology. Over time, the district has evolved to the point where teachers want to
discuss more pedagogical types of issues involved in incorporating technology. This is
not to say that there isn't a place for skill development workshops. Teachers still express
desire to develop a base knowledge of technological skills in order to be able to see
possibilities for improvement of teaching and leaming with technology. However, the
district is moving beyond the old training paradigm towards extending "a vision of
technology as an empowering tool for teachers and students." (Grant, n.d., Principles
section, bullet 1) Technology, then is not an end in itself, it is a tool that we use as
reflective educators in attempting to improve teaching and leaming.
The purpose of this study was to identify effective technology professional
development practices and to provide direction for ftiture professional development in the
Holy Spirit School Division as it relates to integration of ICT Outcomes. Five
recommendations have emerged based on the findings.
Technology professional development needs to create and support opportunities
for collaboration with colleagues. All of the professional development types that included
human interaction were highly rated by respondents in the survey. One of the most highly
supported forms of interaction was the peer tutoring and mentoring. Teachers are asking
for professional development stmctures that support peer interaction. The first
recommendation is to continue grade level and subject area meetings as technology
11

78
infused curriculum meetings that allow teachers with similar teaching assignments to
explore areas of common concem.
The second recommendation is that the distiict and individual schools continue
to develop and support District and school based leadership. This needs to be supported
through release time at the school level for Teacher Guides and teachers to work together.
Schools could benefit from having more than on Teacher Guide. Stronger District
direction could be achieved through the leadership of a district Technology Coordinator.
Thirdly, a variety of technology professional development opportunities need to
be offered. Teachers need and want to develop skills in both pedagogy and technology
skill development. Of the 18 different types of technology professional development
explored m this study, 12 were found to be effective. Another 5 types were found to be
effective by the 45% or fewer respondents who had used them. Not surprisingly, the only
type of technology professional development not favored by teachers was one shot
workshops.
Schools and the district must continue to budget effectively for evergreening of
technology. This could be enhanced through district budgeting rather than school based
decision making. The school district needs to be diligent in continuing to lobby the
province to provide financial support for the integration and maintenance of current
technologies in schools.
Finally, we need to focus technology integration on the improvement of student
leaming through measurable and observable improvements in student leaming. If we are
to continue to gamer support for technology in schools, the costs in teacher time and
effort and the schools' financial burden need to be offset by proven benefits to students.

79
References
Alberta Leaming. (1999). Professional development for teaching technology across the
curriculum: Best practices for Alberta schools. Edmonton, Alberta: Author.
Beaudin, L. (1998). Computer self-efficacy and classroom practice. (Masters Thesis,
University of Lethbridge, 1999). Pro Quest Digital Dissertations, AAT MQ38442.
Byrom, E. (1998). Factors influencing the effective use of technology for teaching and
learning: Lessons learned from SEIR-TEC intensive site schools. Retiieved May
31, 2004 from http://www.serve.org/seir-tec/publications/lessons6.0rtfdoc
Carvin, A. (1999, September 30). Teaching professional development for teachers:
overcoming a pedagogical digital divide. The Digital Beat, 1(16). Retrieved April
13, 2002, from http://www.benton.org/DigitalBeat/db.htm
Clark, CM. (1992). Teachers as designers in self-directed professional development. In
A. Hargreaves & M.G. Fullan (Eds.), Understanding Teacher Development (pp.
75-84). New York: Teachers College Press.
Cook, C. (1997). Critical Issue: Finding time for professional development. Retrieved
April 14, 2004 from
http://www.ncrel.org/sdrs/areas/issues/educatrs/profdevl/pd300.htm
Corcoran, T. (1995). Helping teachers teach well: Transforming professional
development. Retrieved May 31, 2004 from http ://www. ed. gov/pubs/CPRE/t61 /
DuFour. (2002). The learning-centered principal. Educational Leadership, 59(8), p. 12,
4p.
DuFour. (2004).What is a "Professional Leaming Community"? Educational Leadership,
61(8), p. 6-11.

80
Eifler, K.E., Greene, T.G., & Carroll, J.B. (2001). Walking the talk is tough: from a
single technology course to infiision. The Educational Forum, 65, 366-375.
Fullan, M. (2001). Leading in a culture of change. San Francisco, CA: Jossey-Bass.
Grant, C. M. (n.d.). Professional development in a technological age: New definitions,
old challenges, new resources. Retrieved April 14, 2004 from
httiJ://ra.terc.edu/publications/TERC pubs/tech-
infusion/prof dev/prof dev frame.html
Guskey, T. (2002). Professional development and teacher change. [Electronic version]
Teachers and Teaching, 8(3/4), p. 381, l ip.
Guskey, T. (2003). What makes professional development effective? [Electronic version]
Phi Delta Kappan, 84(10), p. 784, 3p.
Harris, J. & Grandgement, N. (2002). Teachers' Authentic E-Leaming . [Elecfronic
version] Leading and Learning with Technology, 30 54-58.
Howard, P. & Jones, S. (2004). Society online. Califomia: Sage.
Lieberman, A. (Ed.). (1996). Rethinking professional development. Retrieved June 4,
2004 from http://www.ed.gov/pubs/IASA/newsletters/profdev/ptl.html
North Central Regional Educational Laboratory. (2004). Indicator: Professional
Development. Retrieved June 4, 2004 from
http://www.ncrel.org/engauge/framewk/sys/dev/sysdevra.htm
Parr, J.M. (1999). Extending educational computing: a case of extensive teacher
development and support. [Electronic version] Journal of Research on Computing
in Education, 31(4), 280, 12p. Retrieved April 2, 2002, from Professional
Development Collection database.

81
Peck, C, Cuban, L. & Kirkpatiick, H. (2002). Techno-promoter dreams, student realities.
[Elecfronic version] Phi Delta Kappan, 83(6)
Rodriguez, G. (2000). Critical Issue: Providing professional development for effective
technology use. Retrieved May 31, 2004 from
http://www.ncrel.org/sdrs/areas/issues/methods/technlgy/telOOO.htm
Scheffler, F. & Logan, J. (1999). Computer technology in schools: What teachers should
know and be able to do. [Elecfronic Version] Journal of Research on Computing
in Education, 31(3), 305, 22p. Retiieved April 7, 2002, from Professional
Development Collection database.
Serim, F. (1996). Building virtual communities for professional development. Retrieved
June 4, 2004 from http://www.ed.gov/Technology/Futures/serim.html.
Sfrahan, D. (2003). Promoting a collaborative professional culture in three elementary
schools that have beaten the odds. [Electronic Version] The Elementary School
Journal, 104(2), p. 127-146. Retiieved June 28, 2004 from Academic Search
Premier Database.
82
Appendix A
Teachers and Teaching Administration Survey on Technology and Needs
The purpose of tiiis survey is to assess the effectiveness of various types of professional development in empowering teachers to integrate hiformation and Communication Technologies (ICT) outcomes into the curriculum in meaningful ways. It is being conducted as part of the 3-year Technology Plan for Holy Spirit Schools in conjunction with a Masters level Project for the University of Lethbridge.
Data will be reported in the Masters of Education final project report on a school-by-school basis as well as a division wide analysis. In this report, each school will be identified only by a letter and not by name. This document will be available through the University of Lethbridge Library and the Catholic Education Center. In addition, each school principal will receive their own school analysis along with the school division analysis. Senior administrators at the Catholic Education Center and the primary researcher will have access to the data with school names but not individual respondents identified. The researcher will likely publish and present the outcomes of this project at professional conferences and workshops. Schools and individuals will remain anonymous to the general public.
In keeping with the Freedom of Information and Protection of Privacy Act (FOIP), the utmost care and attention will be given to privacy and confidentiality issues. All names will be removed from the data. All responses will be dealt with in confidentiahty and used only to gamer frends or group responses. Original data will be kept in locked storage by the primary researcher for a period of five years. At such time, it will be desfroyed.
By completing this survey, you are giving your consent to participate in the research described above.
If you have any questions, please contact the primary researcher (see below). Access to the final project report can be obtained through the University of Lethbridge Library, the Catholic Education Center or direct contact with the primary researcher.
If you have any general questions about the project, you can contact my Faculty Advisor, Mario Steed, Faculty of Education (e-mail [email protected], phone (403) 329-2189), or Thehna Gunn, Chan, Faculty of Education Human Subjects Research Committee (e-mail [email protected], phone (403) 329-2455). Thank you for your help.
Primary Researcher: Lorelie Lenaour [email protected] St. Paul School 403-328-0611

83
1. What grade level do you represent? D K-Grade 3 n Grade 4-6 D Grade 7-9 D Grade 10-12
2. What school do you teach at? D Catholic Cenfral High School n Children of St. Martha School n Ecole St. Mary School n Father Leonard Van Tighem School D Our Lady of the Assumption School D St. Catherine School n St. Francis School n St. Joseph School n St. Mary School, Taber n St. Patrick Fine Arts Elementary School D St Patiick School, Taber D St. Paul School
3. My own home computer is n newer than 2 years n 2-5 years old D older than 5 years n I don't ovra a home computer
4. Do you have access to the Intemet at home? D Yes D No
5. How long have you been using computers? n 0-1 year n 1-3 years D 3-6 years D More than 6 years
6. Rank your personal skill level regarding computer technology, n no interest D just beginning D intermediate n above average D expert
7. How many minutes per week on average do you use a computer at school?

84
0 hours 1 hour 2 hours 5 hours 6 hours 7 hours
10 hours More than 10 hours
3 hours 8 hours
4 hours 9 hours
How many hours per week on average do you use a computer at home? Work related 0 hours 1 hour 2 hours 5 hours 6 hours 7 hours
10 hours More than 10 hours
Personal use 0 hours 1 hour 5 hours 6 hours
10 hours
2 hours 7 hours
More than 10 hours
3 hours 8 hours
3 hours 8 hours
4 hours 9 hours
4 hours 9 hours
9. I use computer technology for n class preparation using productivity tools (word processing, graphs) D record keeping (e.g. grades/marks, report cards) n instmction for in-class demonstrations D newsletters, memos, letters D professional e-mail, chat groups, listserves n producing class web pages (posting web based calendars and assignments) n production of multimedia (power point, digital video, slide show presentations) D production of graphics or art n Intemet research D locating web sites that match a particular curriculum goal n digital photography D digital video D other
10. Is professional development in the area of technology part of your personal professional development plan? D Yes D No
11. I have students using computers in class for D publishing/word processing D data gathering and analysis (spreadsheet / database applications) D computer assisted leaming (leam from software that teaches academic
content, review, practice, reinforce basic skills)
D e-mail use
D Intemet use
D drawing and painting
n planning (e.g. mental mapping, organization, webbing, flowcharting, outlining)

85
D presentation software (e.g. Power point. Hyper studio)
D information gathering/ resources (e.g. CD-ROM Encyclopedia) drafting (CAD)
n keyboarding/typing
n telecollaborative projects
D creating web pages - (producing work for online sharing)
D reward (games)
D other - please specify
12. Do you teach ICT Outcomes as a separate stand-alone class? D Yes D No
13. On average, how many minutes per week do you have students using computers in class? (Select N/A if you do not teach the subject) Language Arts N/A none 0-30 minutes 30-60 minutes 60-120 minutes 120-180 minutes 180-240 minutes more than 240 minutes
Math N/A none 0-30 minutes 30-60 minutes 60-120 minutes 120-180 minutes 180-240 minutes more than 240 minutes
Science N/A none 0-30 minutes 30-60 minutes 60-120 minutes 120-180 minutes 180-240 minutes more than 240 minutes
Social Studies N/A none 0-30 minutes 30-60 minutes 60-120 minutes 120-180 minutes 180-240 minutes more than 240 minutes
Religion N/A none 0-30 minutes 30-60 minutes 60-120 minutes 120-180 minutes 180-240 minutes more than 240 minutes
French N/A none 0-30 minutes 30-60 minutes 60-120 minutes 120-180 minutes 180-240 minutes more than 240 minutes
Biology N/A none 0-30 minutes 30-60 minutes 60-120 minutes 120-180 minutes 180-240 minutes more than 240 minutes

86
Chemistry N/A none 0-30 minutes 30-60 minutes 60-120 minutes 120-180 minutes 180-240 minutes more than 240 minutes
Physics N/A none 0-30 minutes 30-60 minutes 60-120 minutes 120-180 minutes 180-240 minutes more than 240 minutes
Art N/A none 0-30 minutes 30-60 minutes 60-120 minutes 120-180 minutes 180-240 minutes more than 240 minutes
Music N/A none 0-30 minutes 30-60 minutes 60-120 minutes 120-180 minutes 180-240 minutes more than 240 minutes
Drama N/A none 0-30 minutes 30-60 minutes 60-120 minutes 120-180 minutes 180-240 minutes more than 240 minutes
Physical Education N/A none 0-30 minutes 30-60 minutes 60-120 minutes 120-180 minutes 180-240 minutes more than 240 minutes
Integrated Subject lessons N/A none 0-30 minutes 30-60 minutes 60-120 minutes 120-180 minutes 180-240 minutes more than 240 minutes
14. How many minutes per week do you require students to use computers outside of class time? N/A none 0-30 minutes 30-60 minutes 60-120 minutes 120-180 minutes 180-240 minutes more than 240 minutes
15. How do you assess student achievement of the ICT Outcomes?
n Assessment of ICT Outcomes as stand-alone skills n Assessment of ICT Outcomes as part of subject area assignments n I do not assess student achievement of ICT Outcomes n Other:

87
Effective Professional Development in Technology should help you to become familiar and skilled in using and integrating technology into the curriculum.
Please consider "effectiveness" to include: • Appropriateness in content and applicability • Relevance to your teaching assignment and the ICT Curriculum • Sustainability of leaming
Rate the effectiveness of your experiences with Professional Development in Technology
Technology skill development workshops (i.e. a class on operating MS Word, Excel, Power Point...) One shot workshops Technology focused courses, institutes (i.e. summer institutes, semester courses) Technology focused conferences Online courses Online tutorials Participation in e-mail groups or listserves Books, journals and other print resources about educational technology Intemet resources and websites School district based support through district technology coordinator (1999 school year) School district based support through TELUS Leaming Connection Teacher Leaders School district based support through grade level / subject area meetings School based support through technology Teacher Guide School based support through classroom release time Participation in telecollaborative projects "Youth Initiatives" Student Workers Peer tutoring or mentoring Observing other classrooms Other - Please specify
5 Highly
Effective
4 Effective
3 Undecided
2 Ineffective
1 Highly
Ineffective
0 Not
Applicable

88
What has been the most effective technology professional development you have participated in? In what ways did it meet your specific needs?
What are your greatest needs with respect to technology professional development?
What are the greatest barriers to your use of technology with your students?
What technology professional development would you like to participate in over the next three years? (You may wish to refer to the checklist on previous page)
What suggestions do you have for how the school district might better support teachers in
integrating technology?

Appendix B
Crosstabulation tables for different types of Technology Professional Development
Technology Skill Development Workshops * Division Crosstabulation
Highly Effective
Effective
Undecided
Ineffective
Highly Ineffective
Total
Count
% within Division Count
% within Division Count
% within Division Count
% within Division Count
% within Division Count
% within Division
Kindergarten
0
.0%
5
83.3%
0
.0%
1
16.7%
0
.0%
6
100.0%
Grade 1-3
5
14.3%
19
54.3%
8
22.9%
2
5.7%
1
2.9%
35
100.0%
Division Grade
4-6
3
8.3%
24
66.7%
7
19.4%
2
5.6%
0
.0%
36
100.0%
Grade 7-9
2
6.7%
21
70.0%
5
16.7%
1
3.3%
1
3.3%
30
100.0%
Grade 10-12
2
11.1%
11
61.1%
4
22.2%
1
5.6%
0
.0%
18
100.0%
Total
12
9.6%
80
64.0%
24
19.2%
7
5.6%
2
1.6%
125
100.0%
* 7.4% of all respondents selected Not Applicable
One Shot Workshops * Division Crosstabulation
Highly Effective
Effective
Undecided
Ineffective
Highly Ineffective
Total
Count
% within Division Count
% within Division Count
% within Division Count
% within Division Count
% within Division Count
% within Division
Kindergarten
0
0%
3
50.0%
2
33.3%
1
16.7%
0
.0%
6
100.0%
Grade 1-3
0
0%
17
45.9%
10
27.0%
6
16.2%
4
10.8%
37
100.0%
Division Grade
4-6
0
0%
19
52.8%
10
27.8%
7
19.4%
0
.0%
36
100.0%
Grade 7-9
0
0%
9
30.0%
15
50.0%
4
13.3%
2
6.7%
30
100.0%
Grade 10-12
0
0%
10
62.5%
5
31.3%
1
6.3%
0
.0%
16
100.0%
Total
0
0%
58
46.4%
42
33.6%
19
15.2%
6
4.8%
125
100.0%
7.4% of all respondents selected Not Applicable
89

90
Technology Focused Courses * Division Crosstabulation
Highly Effective
Effective
Undecided
Ineffective
Highly Ineffective
Total
Count
% within Division Count
% within Division Count
% within Division Count
% within Division Count
% within Division Count
% within Division
Kindergarten
1
25.0%
3
75.0%
0
.0%
0
.0%
0
.0%
4
100.0%
Grade 1-3
2
12.5%
5
31.3%
7
43.8%
2
12.5%
0
.0%
16
100.0%
Division Grade
4-6
3
15.8%
10
52.6%
6
31.6%
0
.0%
0
.0%
19
100.0%
Grade 7-9
1
9.1%
5
45.5%
4
36.4%
0
.0%
1
9.1%
11
100.0%
Grade 10-12
4
44.4%
2
22.2%
2
22.2%
1
11.1%
0
.0%
9
100.0%
Total
11
18.6%
25
42.4%
19
32.2%
3
5.1%
1
1.7%
59
100.0%
55% of all respondents selected Not Applicable
Technology focused Conferences * Division Crosstabulation
Highly Effective
Effective
Undecided
Ineffective
Highly Ineffective
Total
* 52.6% of all
Count
% within Division Count
% within Division Count
% within Division Count
% within Division Count
% within Division Count
% within Division
respondent
Grade Kindergarten 1-3
0 1
.0% 5.3%
4 10
100.0% 52.6%
0 6
.0% 31.6%
0 2
.0% 10.5%
0 0
.0% .0%
4 19
100.0% 100.0%
:s selected Not Applicable
Division Grade
4-6
2
11.8%
10
58.8%
4
23.5%
1
5.9%
0
.0%
17
100.0%
Grade 7-9
2
13.3%
9
60.0%
3
20.0%
0
.0%
1
6.7%
15
100.0%
Grade 10-12
0
.0%
5
55.6%
4
44.4%
0
.0%
0
.0%
9
100.0%
Total
5
7.8%
38
59.4%
17
26.6%
3
4.7%
1
1.6%
64
100.0%

91
Online Courses * Division Crosstabulation
Highly Effective
Effective
Undecided
Ineffective
Highly Ineffective
Total
58.5% of all t
Count
% within Division Count
% within Division Count
% within Division Count
% within Division Count
% within Division Count
% within Division
•espondents
Kindergarten
0
.0%
2
66.7%
1
33.3%
0
.0%
0
.0%
3
100.0%
5 selected Not Api
Grade 1-3
1
5.9%
7
41.2%
5
29.4%
2
11.8%
2
11.8%
17
100.0%
plicable
Division Grade
4-6
3
20.0%
4
26.7%
5
33.3%
2
13.3%
1
6.7%
15
100.0%
Grade 7-9
1
8.3%
7
58.3%
3
25.0%
0
.0%
1
8.3%
12
100.0%
Grade 10-12
1
11.1%
6
66.7%
2
22.2%
0
.0%
0
.0%
9
100.0%
Total
6
10.7%
26
46.4%
16
28.6%
4
7.1%
4
7.1%
56
100.0%
Online tutorials * Division Crosstabulation
Highly Effective
Effective
Undecided
Ineffective
Highly Ineffective
Total
Count
% within Division Count
% within Division Count
% within Division Count
% within Division Count
% within Division Count
% within Division
Kindergarten
0
.0%
1
33.3%
2
66.7%
0
.0%
0
.0%
3
100.0%
Grade 1-3
1
4.5%
9
40.9%
8
36.4%
3
13.6%
1
4.5%
22
100.0%
Division Grade
4-6
0
.0%
11
47.8%
8
34.8%
3
13.0%
1
4.3%
23
100.0%
Grade 7-9
2
15.4%
6
46.2%
5
38.5%
0
.0%
0
.0%
13
100.0%
Grade 10-12
2
16.7%
7
58.3%
2
16.7%
1
8.3%
0
.0%
12
100.0%
Total
5
6.8%
34
46.6%
25
34.2%
7
9.6%
2
2.7%
73
100.0%
45.5% of all respondents selected Not Applicable

92
Participation in E-mail Groups or Listserves * Division Crosstabulation
Highly Effective
Effective
Undecided
Ineffective
Highly Ineffective
Total
*49.6% of all
Count
% within Division Count
% within Division Count
% within Division Count
% within Division Count
% within Division Count
% within Division
respondent
Kindergarten
0
.0%
4
80.0%
1
20.0%
0
.0%
0
.0%
5
100.0%
s selected Not At
Grade 1-3
1
5.3%
7
36.8%
9
47.4%
1
5.3%
1
5.3%
19
100.0%
Dpiicable
Division Grade
4-6
1
5.6%
5
27.8%
9
50.0%
1
5.6%
2
11.1%
18
100.0%
Grade 7-9
0
.0%
8
50.0%
7
43.8%
1
6.3%
0
.0%
16
100.0%
Grade 10-12
1
11.1%
2
22.2%
2
22.2%
4
44.4%
0
.0%
9
100.0%
Total
3
4.5%
26
38.8%
28
41.8%
7
10.4%
3
4.5%
67
100.0%
Books, Journals, Print Resources * Division Crosstabulation
Highly Effective
Effective
Undecided
Ineffective
Highly Ineffective
Total
Count
% within Division Count
% within Division Count
% within Division Count
% within Division Count
% within Division Count
% within Division
Kindergarten
0
.0%
3
50.0%
2
33.3%
1
16.7%
0
.0%
6
100.0%
Grade 1-3
1
3.3%
12
40.0%
12
40.0%
5
16.7%
0
.0%
30
100.0%
Division Grade
4-6
3
11.1%
12
44.4%
8
29.6%
4
14.8%
0
.0%
27
100.0%
Grade 7-9
0
.0%
14
60.9%
6
26.1%
2
8.7%
1
4.3%
23
100.0%
Grade 10-12
1
7.1%
10
71.4%
1
7.1%
2
14.3%
0
.0%
14
100.0%
Total
5
5.0%
51
51.0%
29
29.0%
14
14.0%
1
1.0%
100
100.0%
*24.8% of all respondents selected Not Applicable

93
Internet Resources and Web Sites * Division Crosstabulation
Highly Effective
Effective
Undecided
Ineffective
Highly Ineffective
Total
*7.6% of all r
Count
% within Division Count
% within Division Count
% within Division Count
% within Division Count
% within Division Count
% within Division
espondents
Kindergarten
2
33.3%
4
66.7%
0
.0%
0
.0%
0
.0%
6
100.0%
; selected Not Apr
Grade 1-3
6
17.1%
26
74.3%
2
5.7%
1
2.9%
0
.0%
35
100.0%
}licable
Division Grade
4-6
9
24.3%
19
51.4%
7
18.9%
2
5.4%
0
.0%
37
100.0%
Grade 7-9
5
18.5%
19
70.4%
2
7.4%
1
3.7%
0
.0%
27
100.0%
Grade 10-12
0
.0%
15
88.2%
1
5.9%
0
.0%
1
5.9%
17
100.0%
Total
22
18.0%
83
68.0%
12
9.8%
4
3.3%
1
.8%
122
100.0%
Technology Coordinator * Division Crosstabulation
Highly Effective
Effective
Undecided
Ineffective
Highly Ineffective
Total
*11.9% of all
Count
% within Division Count
% within Division Count
% within Division Count
% within Division Count
% within Division Count
% within Division
respondent
Kindergarten
1
20.0%
2
40.0%
2
40.0%
0
.0%
0
.0%
5
100.0%
s selected Not Ap
Grade 1-3
5
13.2%
17
44.7%
7
18.4%
9
23.7%
0
.0%
38
100.0%
)plicable
Division Grade
4-6
4
11.8%
19
55.9%
7
20.6%
3
8.8%
1
2.9%
34
100.0%
Grade 7-9
3
12.0%
13
52.0%
5
20.0%
3
12.0%
1
4.0%
25
100.0%
Grade 10-12
3
18.8%
6
37.5%
4
25.0%
1
6.3%
2
12.5%
16
100.0%
Total
16
13.6%
57
48.3%
25
21.2%
16
13.6%
4
3.4%
118
100.0%

94
TLC Teacher Leaders * Division Crosstabulation
Highly Effective
Effective
Undecided
Ineffective
Highly Ineffective
Total
Count
% within Division Count
% within Division Count
% within Division Count
% within Division Count
% within Division Count
% within Division
Kindergarten
1
16.7%
3
50.0%
1
16.7%
1
16.7%
0
.0%
6
100.0%
Grade 1-3
6
16.7%
19
52.8%
3
8.3%
7
19.4%
1
2.8%
36
100.0%
Division Grade
4-6
6
16.2%
23
62.2%
4
10.8%
3
8.1%
1
2.7%
37
100.0%
Grade 7-9
3
10.7%
13
46.4%
8
28.6%
2
7.1%
2
7.1%
28
100.0%
Grade 10-12
2
12.5%
5
31.3%
5
31.3%
4
25.0%
0
.0%
16
100.0%
Total
18
14.6%
63
51.2%
21
17.1%
17
13.8%
4
3.3%
123
100.0%
*8.2% of all respondents selected Not Applicable
Grade Level/Subject Area Meetings * Division Crosstabulation
Highly Effective
Effective
Undecided
Ineffective
Total
Count
% within Division Count
% within Division Count
% within Division Count
% within Division Count
% within
Kindergarten
1
16.7%
4
66.7%
0
.0%
1
16.7%
0
.0%
6
100.0%
Grade 1-3
6
18.8%
12
37.5%
8
25.0%
6
18.8%
0
.0%
32
100.0%
Division Grade
4-6
5
15.2%
18
54.5%
6
18.2%
3
9.1%
1
3.0%
33
100.0%
Grade 7-9
1
4.3%
11
47.8%
8
34.8%
1
4.3%
2
8.7%
23
100.0%
Grade 10-12
2
13.3%
5
33.3%
5
33.3%
3
20.0%
0
.0%
15
100.0%
Total
15
13.8%
50
45.9%
27
24.8%
14
12.8%
3
2.8%
109
100.0%
Division '18.0% of all respondents selected Not Applicable

95
School Teacher Guide * Division Crosstabulation
Highly Effective
Effective
Undecided
Ineffective
Highly Ineffective
Total
* 15.7% of all
Count
% within Division Count
% within Division Count
% within Division Count
% within Division Count
% within Division Count
% within Division
respondent
Kindergarten
0
.0%
5
71.4%
2
28.6%
0
.0%
0
.0%
7
100.0%
s selected Not At
Grade 1-3
5
14.3%
14
40.0%
10
28.6%
6
17.1%
0
.0%
35
100.0%
}pllcable
Division Grade
4-6
8
24.2%
16
48.5%
6
18.2%
2
6.1%
1
3.0%
33
100.0%
Grade 7-9
3
14.3%
8
38.1%
5
23.8%
3
14.3%
2
9.5%
21
100.0%
Grade 10-12
2
11.8%
7
41.2%
4
23.5%
3
17.6%
1
5.9%
17
100.0%
Total
18
15.9%
50
44.2%
27
23.9%
14
12.4%
4
3.5%
113
100.0%
Class Release Time * Division Crosstabulation
Highly Effective
Effective
Undecided
Ineffective
Highly Ineffective
Total
*27.8% of all
Count
% within Division Count
% within Division Count
% within Division Count
% within Division Count
% within Division Count
% within Division
respondent
Kindergarten
1
16.7%
3
50.0%
2
33.3%
0
.0%
0
.0%
6
100.0%
s selected Not Af
Grade 1-3
6
20.0%
16
53.3%
6
20.0%
2
6.7%
0
.0%
30
100.0%
}pllcable
Division Grade
4-6
13
44.8%
11
37.9%
4
13.8%
0
.0%
1
3.4%
29
100.0%
Grade 7-9
2
11.1%
7
38.9%
6
33.3%
1
5.6%
2
11.1%
18
100.0%
Grade 10-12
3
23.1%
6
46.2%
4
30.8%
0
.0%
0
.0%
13
100.0%
Total
25
26.0%
43
44.8%
22
22.9%
3
3.1%
3
3.1%
96
100.0%

96
Telecollaborative Projects * Division Crosstabulation
Highly Effective
Effective
Undecided
Ineffective
Highly Ineffective
Total
Count
% within Division Count
% within Division Count
% within Division Count
% within Division Count
% within Division Count
% within Division
Kindergarten
1
25.0%
3
75.0%
0
.0%
0
.0%
0
.0%
4
100.0%
Grade 1-3
5
18.5%
10
37.0%
11
40.7%
1
3.7%
0
.0%
27
100.0%
Division Grade
4-6
6
20.7%
15
51.7%
6
20.7%
1
3.4%
1
3.4%
29
100.0%
Grade 7-9
3
15.0%
6
30.0%
8
40.0%
1
5.0%
2
10.0%
20
100.0%
Grade 10-12
1
10.0%
5
50.0%
4
40.0%
0
.0%
0
.0%
10
100.0%
Total
16
17.8%
39
43.3%
29
32.2%
3
3.3%
3
3.3%
90
100.0%
*31.8% of all respondents selected Not Applicable
Youth Initiatives * Division Crosstabulation
Highly Effective
Effective
Undecided
Ineffective
Highly Ineffective
Total
Count
% within Division Count
% within Division Count
% within Division Count
% within Division Count
% within Division Count
% within Division
Kindergarten
1
16.7%
4
66.7%
1
16.7%
0
.0%
0
.0%
6
100.0%
Grade 1-3
9
29.0%
11
35.5%
7
22.6%
3
9.7%
1
3.2%
31
100.0%
Division Grade
4-6
10
30.3%
16
48.5%
7
21.2%
0
.0%
0
.0%
33
100.0%
Grade 7-9
5
20.0%
9
36.0%
8
32.0%
2
8.0%
1
4.0%
25
100.0%
Grade 10-12
1
10.0%
3
30.0%
5
50.0%
0
.0%
1
10.0%
10
100.0%
Total
26
24.8%
43
41.0%
28
26.7%
5
4.8%
3
2.9%
105
100.0%
*22.2% of all respondents selected Not Applicable

97
Peer Tutoring or Mentoring * Division Crosstabulation
Highly Effective
Effective
Undecided
Ineffective
Highly Ineffective
Total
Count
% within Division Count
% within Division Count
% within Division Count
% within Division Count
% within Division Count
% within Division
Kindergarten
1
20.0%
4
80.0%
0
.0%
0
.0%
0
.0%
5
100.0%
Grade 1-3
13
40.6%
14
43.8%
5
15.6%
0
.0%
0
.0%
32
100.0%
Division Grade
4-6
11
32.4%
20
58.8%
3
8.8%
0
.0%
0
.0%
34
100.0%
Grade 7-9
7
30.4%
11
47.8%
3
13.0%
1
4.3%
1
4.3%
23
100.0%
Grade 10-12
0
.0%
11
84.6%
1
7.7%
0
.0%
1
7.7%
13
100.0%
Total
32
29.9%
60
56.1%
12
11.2%
1
.9%
2
1.9%
107
100.0%
*20.7% of all respondents selected Not Applicable
Classroom Observations * Division Crosstabulation
Highly Effective
Effective
Undecided
Ineffective
Highly Ineffective
Total
Count
% within Division Count
% within Division Count
% within Division Count
% within Division Count
% within Division Count
% within Division
Kindergarten
0
.0%
4
100.0%
0
.0%
0
.0%
0
.0%
4
100.0%
Grade 1-3
4
19.0%
10
47.6%
6
28.6%
1
4.8%
0
.0%
21
100.0%
Division Grade
4-6
5
19.2%
14
53.8%
7
26.9%
0
.0%
0
.0%
26
100.0%
Grade 7-9
1
5.6%
8
44.4%
6
33.3%
2
11.1%
1
5.6%
18
100.0%
Grade 10-12
1
10.0%
5
50.0%
3
30.0%
0
.0%
1
10.0%
10
100.0%
Total
11
13.9%
41
51.9%
22
27.8%
3
3.8%
2
2.5%
79
100.0%
*40.6% of all respondents selected Not Applicable