los angeles county metropolitan transportation...
TRANSCRIPT


Los Angeles County Metropolitan Transportation Authority FY11 Budget
FY11 Budget Table of Contents Ÿ i
Table of Contents Budget Message from the CEO………………………………………………………………………………. 1
LACMTA Organization Chart………………………..………………………………………………………… 2
Metro Board of Directors ….…………………………………………………………………………………… 3
Metro Profile…………………………………………………………………………………………………….. 8
Budget Assumptions……………………………………………………………………………………………. 10
Service Level Details…………………………………………………………………………………………… 11
Budget Highlights……………………………………………………………………………………………….. 12
Budget Summary of FTEs and Expenditures……………………………………………………………….. 14
Summary of Budgeted FTEs by Department………………………………………………………………… 15
Summary of Resources………………………………………………………………………………………… 19
Summary of Expenses/Expenditures by Program………………………………………………………….. 20
Sales Tax and STA Revenues………………………………………………………………………………… 21
Financial Structure Comparison to Organizational Structure……………………….……………………… 22
Enterprise Fund - Operating & Capital Summary…………………………………………………………… 23
Governmental Fund……………………………………………………………………………………………. 24
Special Revenue Funds……………………………………………………………………………………….. 25
Fund Balances………………………………………………………………………………………………….. 27
Debt Schedule…………………………………………………………………………………………………... 28
Debt Policy Maximum Permitted Debt Service ……………………………………………………………... 29
Capital Program Project List…………………………………………………………………………………… 30
Measure R Projects/Funding………………………………………………………………………………….. 35
Regional Subsidy Programs…………………………………………………………………………………… 36
Modal Operating Statistics…………………………………………………………………………………….. 37
Activity Based Bus Cost Model……………………………………………………………………………….. 39
Activity Based Orange Line Cost Model……………………………………………………………………… 41
Activity Based Light Rail Cost Model…………………………………………………………………………. 42
Activity Based Heavy Rail Cost Model……………………………………………………………………….. 43
Legally Separate Entities………………………………………………………………………………………. 45
Los Angeles County Metropolitan Transportation Authority FY11 Budget
1 Ÿ Budget Message from the CEO FY11 Budget
Budget Message from the CEO The Los Angeles County Metropolitan Transportation Authority is at a critical juncture. In the midst of a major economic downturn, never has more been expected of this agency with regard to the delivery of capital programs and day-to-day services.
In order for us to successfully meet our broad set of transportation development and service commitments in a fiscally responsible manner, we must act now to streamline the agency, restructure our service delivery, and improve the management of our capital programs. Collectively, we are committed to these seven goals:
1. Accelerate delivery of Measure R projects through the 30/10 Initiative and Accelerated Highway Program, while simultaneously positioning the agency for long-term financial health and stability.
2. Maintain a Culture of Safety. Develop an organizational culture where passenger, public and employee safety permeates every aspect of planning, building and operating our transportation system.
3. Deliver outstanding transportation programs and services; efficiently and effectively delivering on our program and service commitments; integrate bus and rail services; improve reliability, cleanliness and safety.
4. Build broad-based county-wide support for MTA's program. Create alignment by delivering transit and highway products, services and capital projects.
5. Complete all MTA projects on time and within budget through improved project management and business practices, including sustainability, more local hiring and small business participation.
6. Compete effectively for federal and state resources to improve the region's mobility. Increase Los Angeles County influence on key legislation, form effective partnerships for Measure R acceleration, high speed rail and other priority projects, and increase support for transit operations.
7. Develop a world class workforce and MTA’s next generation of leaders. Hire, lead, train and retain employees who are both good at their jobs and committed to outstanding public and customer service.
This budget is the next step of a comprehensive plan to achieve our goals while providing the agency prudent reserves. We enter FY11 with a new lean, restructured organization, a new service delivery model, and a focused agenda for capital programs delivery. Our intent in restructuring is to ensure we more efficiently and effectively address the needs of our customers and the transportation development commitments required in Measure R and our charter.
The FY11 budget includes agency-wide cost reductions, bus service reduction, an increased emphasis on maintenance, service improvements and an improved capital budgeting process.
However, given the planned expansion of rail, additional bus service restructuring and agency-wide operating expense reductions, new revenues will be required to sustain a balanced budget over the coming years. Arthur T. Leahy Chief Executive Officer Los Angeles County Metropolitan Transportation Authority

Los Angeles County Metropolitan Transportation Authority FY11 Budget
FY11 Budget LACMTA Organization Chart 2
LACMTA Organization Chart (As of May 19, 2010)
LACMTABoard of Directors
Chief Executive Officer
Office of Inspector General(1)
Office of County Counsel(1)
Office of Board Secretary(1)Ethics Office(1)
Economic Development SBU
Financial Services SBU
Countywide Planning &
Development SBU
Highway Capital Management SBU
Construction Project
Management SBU
Communications SBU
Chief Executive Officer SBU Operations SBU(2)
Board Relations
Corporate Safety
Government Relations
High Speed Rail
Labor/Employee Relations
Office of Management &
Budget
Transit Security
Creative Services
Customer Communications
Customer Programs &
Services
Customer Relations
Executive Office, Communictions
Public Relations
Regional Communications
Programs
TAP
Construction
Engineering
Executive Office, Construction
Program Management
Quality Management
Exeuctive Office, Planning
Long Range Planning &
Coordination
Programming & Policy Analysis
Transp Dev (Cental/East/SE
Region)
Transp Dev(North/West/SW
Region)
New Business Development
Real Estate Administration
Executive Office, Highway Capital
Motorist Services
Congestion Reduction Demo
Project
Rail Fleet Services
Bus Maintenance
Accounting
Risk Management
Treasury
Management Audit Services
Operations Administration
Administrative Services SBU
Human Services
Information Technology
Services
Procurement & Material
Management
(1)Part of Board of Directors SBU(2)Bus Operations and Rail Operations to be combined into one SBU July 1, 2010
Bus/Rail Transportation

Los Angeles County Metropolitan Transportation Authority FY11 Budget
3 Ÿ Metro Board of Directors FY11 Budget
Metro Board of Directors
Ara Najarian Board Chairman Mayor, City of Glendale
Board Chairman Najarian was elected to the Glendale City Council in 2005 and re-elected in 2007. He was appointed Mayor in 2010. Before being elected to the city council, he was an elected member of the Glendale Community College Board of Trustees. He served 7 years on the Glendale Transportation and Parking Commission and served two of those years as Chairman. Director Najarian is currently Vice Chair of the Glendale Redevelopment Agency and is the Past Chair of the Glendale Housing Authority. He has been an attorney in private practice for 20 years. Chairman Najarian attended Occidental College where he received a Bachelor of Arts degree in Economics and later earned his JD from the University of Southern California School of Law.
Don Knabe Board 1st Vice Chairman LA County Supervisor 4th Supervisorial District
Board 1st Vice Chairman Don Knabe was first elected to the Los Angeles County Board of Supervisors representing the Fourth District in 1996 and reelected three times since. He is a White House appointee to the State and Local Elected Officials Senior Advisory Committee to the Homeland Security Advisory Council. Supervisor Knabe is a former Mayor and Councilman of the City of Cerritos. He has served on the Board of Directors for Metro, Metrolink, and the Alameda Corridor Transportation Authority. He is the immediate past Chairman and Member of the Southern California Regional Airport Authority and a Member of the Southern California Association of Governments Aviation Task Force. Supervisor Knabe holds a bachelor’s degree in business administration from Graceland College.
Antonio Villaraigosa Board 2nd Vice Chairman Mayor, City of Los Angeles
Board 2nd Vice-Chairman Antonio Villaraigosa was elected the 41st Mayor of the City of Los Angeles in 2005 and was re-elected in 2009. He was formerly a City Councilman for the City of Los Angeles representing the 14th District. Prior to his election to the City Council, Mayor Villaraigosa served on the boards of the Southern California Rapid Transit District and the Metro Board of Directors including a prior term as Board Chairman. He was elected to the California State Assembly in 1994, serving as Democratic Whip and Majority Leader before becoming Speaker of the Assembly in 1998. Mayor Villaraigosa holds a Bachelor of Arts degree from UCLA and a law degree from the People’s College of Law.

Los Angeles County Metropolitan Transportation Authority FY11 Budget
FY11 Budget Metro Board of Directors Ÿ 4
Michael Antonovich LA County Supervisor 5th Supervisorial District
Director Antonovich is a member of the Los Angeles County Board of Supervisors representing the Fifth Supervisorial District. Supervisor Antonovich was reelected to his eighth four-year term in 2008. From 1972 to 1978, he served as a member of the California State Assembly. He also served as a member of the Board of Trustees of the Los Angeles Community College District from 1968 to 1973. Director Antonovich has held teaching positions with the Los Angeles Unified School District and Pepperdine University. He holds a Bachelor of Arts degree and Master’s degree from California State University, Los Angeles.
Diane DuBois City Council Member City of Lakewood
Director DuBois was elected to the City Council of Lakewood in 2005. Prior to her City Council service, she was a Lakewood Planning and Environment Commissioner for 28 years. She has been a board member and volunteer for Lakewood Meals On Wheels, a board member of the Greater Long Beach Girl Scout Council, a governing board member of Lakewood Regional Medical Center, a member of Soroptimists International of Lakewood/Long Beach, and a volunteer at Pathways Volunteer Hospice. Director DuBois is representing the Gateway Cities on the Metro Board of Directors and will serve on the Operations and Construction committees.
John Fasana City Council Member City of Duarte
Director Fasana has served on the Duarte City Council since 1987, and served as Mayor in 1990, 1997 and 2004. He has represented thirty San Gabriel Valley cities on the Metro Board of Directors since its inception in 1993 and served as Board Chair during the 2001-2002 fiscal year. He is currently serving as Chair of the newly created Ad hoc Committee on Congestion Pricing. Director Fasana also serves as Chair of the San Gabriel Valley Council of Governments Transportation Committee, and represents seven cities on the Foothill Transit Governing Board. He has 26 years of service with Southern California Edison and is a graduate of Whittier College with a Bachelor of Arts degree in business administration.

Los Angeles County Metropolitan Transportation Authority FY11 Budget
5 Ÿ Metro Board of Directors FY11 Budget
Jose Huizar City of Los Angeles Mayor Appointee
Director Huizar was elected to the Los Angeles City Council in 2005 and re-elected in 2007. He is Chair of the Audits and Governmental Efficiency Committee, Vice-Chair of the Planning & Land Use Management Committee and a member of the Budget & Finance Committee, Ad Hoc River Committee and Ad Hoc Gang Violence and Youth Development Committee. Director Huizar serves as the Chair of the LA County Education Coordinating Council and is a member of SCAG’s Transportation and Communications Committee. He served as board of education president for the LAUSD from 2001-2005. He was previously a deputy city attorney in the Real Estate and Environmental Division of the LA City Attorney’s Office. Director Huizar earned degrees from UC Berkeley, Princeton and the UCLA School of Law.
Richard Katz City of Los Angeles Mayor Appointee
Director Katz served on the State Water Resources Control Board from 2001-2006. He also served Governor Davis as Senior Advisor on Energy and Water and led negotiations on the Colorado River Agreement with the Federal Government, California Water Agencies, and six other states. Director Katz served 16 years in the State Legislature beginning in 1980, including a term as the Democratic Leader. For 10 years, He chaired the Assembly Transportation Committee and authored Proposition 111 to raise money for mass transit/highways and created the Congestion Management Program. Director Katz was instrumental in drafting legislation that created Metro in 1993 through a merger of the Southern California Rapid Transit District and the LA County Transportation Commission.
Gloria Molina LA County Supervisor 1st Supervisorial District
Director Molina serves on the Los Angeles County Board of Supervisors representing the First District. She was first elected in 1991 and re-elected in 1994, 1998, 2002 and 2006. Prior to her election to the Board of Supervisors, Director Molina served as State Assemblywoman for the 56th District from 1982 to 1987. In 1987, she was elected to the Los Angeles City Council, where she represented the First District until 1991. Before her election to public office, Director Molina served in the Carter White House as a Deputy for Presidential Personnel and subsequently as the Deputy Director for the Department of Health and Human Services in San Francisco. She attended East Los Angeles College and Rio Hondo College.

Los Angeles County Metropolitan Transportation Authority FY11 Budget
FY11 Budget Metro Board of Directors Ÿ 6
Pam O’Connor City Council Member City of Santa Monica
Director O’Connor has served on the Santa Monica City Council since 1994 and has served three terms as mayor. She is a member of the SCAG Regional Council and is on the Board of Directors of the Local Government Commission. She also serves on committees for the League of California Cities and the National League of Cities. Director O’Connor works as a private consultant, specializing in historic preservation. She has worked throughout Southern California on projects, including the rehabilitation of Los Angeles’ City Hall and on numerous buildings at UCLA and USC. She earned a Bachelor of Science degree in journalism from Southern Illinois University and holds masters’ degrees in historic preservation planning and in technology management from Eastern Michigan University.
Mark Ridley-Thomas LA County Supervisor 2nd Supervisorial District
Director Ridley-Thomas was elected Los Angeles County Supervisor for the Second District in 2008. He previously served the 26th District in the California State Senate where he chaired the Senate’s Committee on Business, Professions and Economic Development and its two subcommittees on Professional Sports and Entertainment, and The Economy, Workforce Preparation and Development. He also served on the Senate Appropriations, Energy, Utilities and Communications, Health and Public Safety committees. He served on the Los Angeles City Council starting in 1991 for nearly a dozen years, departing as Council President pro Tempore and served two terms in the California State Assembly, where he chaired the Assembly Democratic Caucus.
Rita Robinson City of Los Angeles Mayor Appointee
Director Robinson is the General Manager of the Los Angeles Department of Transportation where she is responsible for the day-to-day operations of over 2,000 employees whose mission is to provide for the safe and optimal mobility of people and goods throughout the City of Los Angeles to support economic activity and a desirable quality of life. A city employee for over 30 years, she began her career as a student professional intern and has served in a number of capacities in Los Angeles city government, including the Office of the City Administrative Officer, Department of Recreation and Parks, and the Community Development Department. Before Director Robinson’s appointment to the Transportation Department, she directed the Department of Public Works Bureau of Sanitation.

Los Angeles County Metropolitan Transportation Authority FY11 Budget
7 Ÿ Metro Board of Directors FY11 Budget
Zev Yaroslavsky LA County Supervisor 3rd Supervisorial District
Director Yaroslavsky, a past chairman of the Metro Board of Directors, is a member of the Los Angeles County Board of Supervisors representing the Third Supervisorial District. He was elected to the office in November 1994 and re-elected three times, most recently in 2006. Supervisor Yaroslavsky is recognized as a leader on fiscal, health care, transportation, cultural and environmental matters. He is also regarded as the County’s fiscal watchdog, insisting that it live within its means. He previously served as a member of the Los Angeles City Council between 1975 and 1994. The Los Angeles native earned his bachelor’s degree in history and economics from UCLA in 1971 and a Master’s degree in history in 1972.
Vacant Ex-officio Member Appointed by Governor
`
Note: The Board of Directors as presented herein is the Board as it existed at the time the FY11 Budget was adopted in May 2010.

Los Angeles County Metropolitan Transportation Authority FY11 Budget
FY11 Budget Metro Profile Ÿ 8
Metro Profile The Los Angeles County Metropolitan Transportation Authority (LACMTA), or Metro, was formed in 1993 to plan, coordinate, design, build, and operate the public transportation system for the region. Metro’s employees are proud to:
· Operate the second largest bus system in the United States, providing over 7.2 million revenue service hours annually with an average of 1.1 million boardings per weekday.
· Operate three light rail lines and two heavy rail lines with about 300,000 boardings per weekday.
· Administer and distribute transportation funds for all Los Angeles County transit providers.
· Develop and construct Rapid Bus lines and fixed guideways for buses and multi-passenger vehicles.
· Construct new light and heavy rail lines. · Provide highway construction funding
and traffic flow management. · Promote the use of public transit
services and rideshare programs. Metro headquarters and the Gateway Transit Center are located adjacent to the historic Union Station. The Gateway Transit Center links Los Angeles County with neighboring counties in Southern California by providing easy connections for commuters to Metro Bus and Rail, Metrolink (commuter rail) and Amtrak (intercity rail). Metro is governed by a Board of Directors with 13 voting members and one non-voting member, consisting of:
· The five members of the Los Angeles County Board of Supervisors.
· The Mayor of the City of Los Angeles and three mayoral appointees.
· Four members appointed by the Los Angeles County City Selection Committee.
· One non-voting member appointed by the Governor.
Five legally separate entities which are integrated into Metro’s operations and financial reporting are also included in the annual budget presentation that follows. These “blended component” units are: · the Public Transportation Services
Corporation (PTSC), · two Benefit Assessment Districts (BAD), · the Exposition Metro Line Construction
Authority (Expo), and · the Service Authority for Freeway
Emergencies (SAFE) Please see pages 45 and 46 for detailed financial statements. The annual budget and additional information about the organization, programs, and services at Metro can be found on its website: www.metro.net
Brief History of Metro 1871 – Los Angeles grants operational franchises for horse drawn streetcar railways. 1951 – Los Angeles Chamber works with the state legislature to form the Los Angeles Metropolitan Transit Authority (LAMTA). 1957 – Legislature gives LAMTA authority to purchase and operate privately owned bus lines through sale of revenue bonds. 1964 – Southern California Rapid Transit District (SCRTD) was formed to deliver mass rapid transit system, acquire property by eminent domain, levy taxes with voter approval, issue bonds and create Benefit Assessment Districts. 1976 – Los Angeles County Transportation Commission (LACTC) formed by legislature as new oversight organization for planning and funding mass transit. 1993 – SCRTD and LACTC merged to form the Los Angeles County Metropolitan Transportation Authority (Metro).

Los Angeles County Metropolitan Transportation Authority FY11 Budget
9 Ÿ Metro Profile FY11 Budget
Los Angeles County Profile Los Angeles County in California is the most populous county in the United States with an estimated population of 10.4 million. The county seat is the city of Los Angeles. The county is home to 88 incorporated cities and many unincorporated city-like areas.
As of 2010, the county's population is larger than the populations of 43 states, ranking just behind Ohio, and is home to over a quarter of all California residents. In addition, if the county were a nation, it would be the 18th largest economy in the world.

Los Angeles County Metropolitan Transportation Authority FY11 Budget
FY11 Budget Budget Assumptions · 10
Budget Assumptions
Revenue Assumptions · Sales tax revenue will grow 4.5%, following
9.1% declines in FY09 and FY10. · Fare increase for non-discounted riders was
implemented on July 1, 2010, resulting in a farebox recovery ratio of 28% and fare revenue per boarding of $0.75.
· Metro’s entire share of Measure R 20% Bus Operations including prior fund balances ($117.4 million) is used for bus operations.
· Metro’s entire share of new STA revenues in FY10 ($98.3 million) is used for bus and rail operations in FY11.
Service Level Assumptions · The FY11 budget assumes an initial 5% bus
service reduction (387,575 Revenue Service Hours) through more efficient scheduling to reduce service duplication and improve productivity. At the same time we will improve service quality by continuing the current level of maintenance activity and on-street supervision. This will improve the state of good repair and cleanliness of the bus fleet and continue to improve bus in-service on-time performance.
· Rail service will remain at the FY10 level, with Expo opening in FY12.
Labor Assumptions · Twenty percent reduction in Non-Contract
Full Time Equivalents (FTEs). · Reduction in Contract FTEs will comply with
labor agreements. Service-level related reductions in UTU FTEs will be managed through attrition.
· No wage and salary increases.
Things to Watch/Areas of Risk · Budget contains no wage increases in
collective bargaining agreements. · Budget assumed a 4.5% growth in sales tax
revenue as a result of the economic recovery.
· Assumed timely issuance of Prop 1B bonds. Funding is at risk for Expo II Land Acquisition, I-405, Orange Line Extension and other projects.
· At the time the FY11 budget was adopted, there was no funding established for the 30/10 Initiative. Therefore, no FTEs or expenditures associated with that initiative are included in the budget. The concept of the 30/10 Initiative is to use the long-term revenue from the Measure R sales tax as collateral for long-term bonds and a federal loan which will allow Metro to build 12 key mass transit projects in 10 years, rather than 30. If, and when, the 30/10 Initiative receives funding, the Board will be asked to approve budget amendments accordingly.

Los Angeles County Metropolitan Transportation Authority FY11 Budget
11 Ÿ Service Level Details FY11 Budget
Service Level Details
Revenue Service Hours Boardings (000s)
ModeFY10
BudgetFY11
Budget Inc/(Dec) ModeFY10
BudgetFY11
Budget Inc/(Dec)Bus Bus
Local & Rapid 6,943,692 6,561,282 (382,410) Local & Rapid 377,542 334,480 (43,062) Orange Line 101,561 101,561 - Orange Line 7,793 6,996 (797)
Purchased Transp 554,419 549,254 (5,165) Purchased Transp 15,969 14,478 (1,491) Subtotal Bus 7,599,672 7,212,097 (387,575) Subtotal Bus 401,304 355,954 (45,350)
Rail RailBlue Line 221,473 221,179 (294) Blue Line 25,855 24,190 (1,665)
Green Line 87,741 87,555 (186) Green Line 12,218 11,174 (1,044) Gold Line 139,701 139,802 101 Gold Line 11,680 9,323 (2,357) Heavy Rail 257,128 257,310 182 Heavy Rail 47,400 45,306 (2,094)
Subtotal Rail 706,043 705,846 (197) Subtotal Rail 97,152 89,993 (7,159) Totals 8,305,715 7,917,943 (387,772) Totals 498,457 445,947 (52,510)
Revenue Service Miles Passenger Miles (000s)
ModeFY10
BudgetFY11
Budget Inc/(Dec) ModeFY10
BudgetFY11
Budget Inc/(Dec)Bus Bus
Local & Rapid 86,944,471 76,362,630 (10,581,841) Local & Rapid 1,429,588 1,266,529 (163,059) Orange Line 1,619,412 1,619,412 - Orange Line 43,086 38,679 (4,407)
Purchased Transp 7,689,930 7,618,290 (71,640) Purchased Transp 51,426 46,625 (4,801) Subtotal Bus 96,253,813 85,600,332 (10,653,481) Subtotal Bus 1,524,100 1,351,834 (172,267)
Rail RailBlue Line 4,837,232 4,830,998 (6,234) Blue Line 190,031 177,797 (12,235)
Green Line 2,644,697 2,639,068 (5,629) Green Line 80,397 73,525 (6,872) Gold Line 3,032,506 2,719,516 (312,990) Gold Line 84,326 67,312 (17,014) Heavy Rail 5,897,486 5,930,192 32,706 Heavy Rail 236,999 226,530 (10,469)
Subtotal Rail 16,411,921 16,119,774 (292,147) Subtotal Rail 591,754 545,163 (46,590) Totals 112,665,734 101,720,106 (10,945,628) Totals 2,115,854 1,896,997 (218,857)
Los Angeles County Metropolitan Transportation Authority FY11 Budget
FY11 Budget Budget Highlights · 12
Budget Highlights
Metro Operations Metro Bus and Rail Operations were reorganized during FY10, realigning functions from a service sector organization into a centralized operation, while ensuring that a formal process for public input to service changes remains intact. All of Operations will report to the Chief Operations Officer. The overall goal is to operate a highly-responsive, fully-integrated bus and rail system that focuses on core service. FY11 highlights for Metro Operations: · Continue developing the service
restructuring plan to set the direction of service planning over the next 5 years.
· Procure 125 buses to adhere to fleet age and fleet replacement plan guidelines.
· Implement a bus/rail interface and restructuring plan for the Gold Line Eastside Extension.
· Complete union contract negotiations with UTU, ATU, TCU and Teamsters.
FY11 highlights for Bus Operations: · Operate 7.2 million Metro Bus, Metro
Orange Line, and Contracted revenue service hours.
· Restructure to improve efficiency on existing bus service through trip thinning, reducing frequency on unproductive routes, and rightsizing of Rapid corridors.
· Maintaining customer-based service input
via Governance Councils and the Blue Ribbon Committee.
· Complete installation of the “SmartDrive” Incident Based Surveillance System (IBSS) on all buses systemwide to reduce accidents, improve safety, and enhance operator training.
· Improve quality of bus fleet and service. FY11 highlights for Rail Operations: · Operate 705,846 Metro Rail revenue service
hours. · Receive P2550 light rail vehicles and initiate
contract closeout. · Award a new contract for additional rail cars
to support future rail lines. · Support Exposition Line start-up operations. · Expand Rail rehabilitation programs to
maintain the state of good repair of our aging fleet and infrastructure.
Los Angeles County Metropolitan Transportation Authority FY11 Budget
13 Ÿ Budget Highlights FY11 Budget
Transit and Highway Development and Construction Programs Construction Project Management, Countywide Planning and Development and Highway Capital Management business units plan, design and build future transit and highway projects for Los Angeles County. FY11 highlights for the transit construction program: · Complete Metro Gold Line Eastside
Extension Project close-out. · Continue construction of Expo Light Rail
Line Phase I. · Continue planning and design of Expo Light
Rail Transit Phase II. · Begin Preliminary Engineering, and provide
support to the EIS/EIR phase and Federal New Starts Funding application process for the Regional Connector and Westside Subway Extension Projects.
· Continue design and construction management of the Orange Line Extension north on Canoga.
· Complete Metro Rapid Signal Priority Expansion Phase I on four Metro Rapid Corridors, and continue Signal Priority Expansion Phase II for three more corridors.
FY11 budgeted transit corridor studies: · Eastside Quad Gate Study · Crenshaw Transit Corridor · Eastside Light Rail Access · SFV East N/S Rapid · Eastside Extension Phase II · Metro Green Line SB Extension · Red Line Westside Extension · Regional Connector FY11 highlights for the highway development program: · Design and begin construction of Interstate
405 Northbound Carpool Lane from Interstate 10 to US 101.
· Continue construction management of seven freeway soundwalls.
· Complete design and begin construction of improvements to the Harbor Transitway Stations, El Monte Busway/Patsaouras Plaza Connector and El Monte Station as part of the Congestion Reduction Demonstration Project.
FY11 budgeted highway corridor studies: · High Desert Corridor · I-605 Corridor "Hot Spot" · I-710 North Gap Closure · I-710 South Early Action Projects

Los Angeles County Metropolitan Transportation Authority FY11 Budget
FY11 Budget Budget Summary of FTEs and Expenditures Ÿ 14
Budget Summary of FTEs and Expenditures
FY10 FY11 Change
FTEs Budget Budget from FY10
1 Bus and Rail Operations 7,678 7,324 (354)
2 Countywide Planning & Development 124 84 (40)
3 Highway Capital Management 12 27 15
4 Construction Project Management 106 101 (5)
5 Communications 228 210 (18)
6 Economic Development 27 21 (6)
7 Administrative Services 574 496 (78)
8 Financial Services 203 175 (28)
9 Management Audit Services 27 21 (6)
10 Board of Directors 43 37 (6)
11 Chief Executive Office 179 175 (4)
12 Agency wide Non-Contract Total 1,311 1,071 (240)
13 Agency wide Union Total 7,890 7,600 (290) 14 Agency Total 9,201 8,671 (530)
Expenditure by SBU FY10 FY11
($ in thousands) Budget Budget ($) (%)
15 Bus and Rail Operations $1,434,806 $1,292,000 ($142,805) -10.0%
16 Countywide Planning & Development 1,026,032 1,171,412 145,379 14.2%
17 Highway Capital Management 57,977 124,207 66,230 114.2%
18 Construction Project Management 623,237 566,781 (56,456) -9.1%
19 Communications 82,587 67,294 (15,293) -18.5%
20 Economic Development 30,701 130,892 100,191 326.3%
21 Administrative Services 80,735 81,566 831 1.0%
22 Financial Services 389,511 228,745 (160,766) -41.3%
23 Management Audit Services 4,990 5,117 127 2.5%
24 Board Of Directors 20,166 19,592 (574) -2.8%
25 Chief Executive Office 97,976 104,808 6,832 7.0%26 Agency Total $3,848,718 $3,792,414 ($56,304) -1.5%
Note: Some of the changes in expenditures at the SBU level are the result of the reorganization.
Change
Expenditure by Type FY10 FY11
($ in thousands) Budget Budget ($) (%)
27 Wage & Benefit $906,821 $870,684 ($36,137) -4.0%
28 Fuel & Propulsion Power 70,761 53,246 (17,515) -24.8%
29 Acquisitions 680,985 603,691 (77,294) -11.4%
30 Services 602,797 633,476 30,679 5.1%
31 Purchased Transportation 44,053 39,854 (4,199) -9.5%
32 Material & Supply 146,938 133,208 (13,730) -9.3%
33 Insurance 57,566 40,980 (16,586) -28.8%
34 Subsidies 979,928 1,090,041 110,114 11.2%
35 Other Support 27,299 27,281 (17) -0.1%
36 Debt 331,571 299,952 (31,619) -9.5%37 Agency Total $3,848,718 $3,792,414 ($56,304) -1.5%
Note: Total may not add due to rounding.
Change

Los Angeles County Metropolitan Transportation Authority FY11 Budget
15 Ÿ Summary of Budgeted FTEs by Department FY11 Budget
Summary of Budgeted FTEs by Department
FY10 FY11 ChangeBudget Budget from FY10
1 Bus and Rail Operations2 Bus/Rail Transportation Total 4,755 4,480 (275)3 Maintenance Total 2,157 2,135 (22)4 Rail Fleet Services Total 350 346 (4)5 Rail Wayside Total 177 179 26 Operations Administration Total 239 184 (55)7 Bus and Rail Operations Subtotal by Representation8 Non-Contract 355 268 (87) 9 Union 7,323 7,056 (267) 10 Bus and Rail Operations Total 7,678 7,324 (354)11
12 Countywide Planning & Development13 Chief Planning Officer Total 3 2 (1)14 Long Range Planning & Coordination Total 33 27 (6)15 Transp. Dev. & Implm. (Central/East/Se Region) Total 34 15 (19)16 Transp. Dev. & Implm. (North/West/Sw Region) Total 28 17 (11)17 Programming & Policy Analysis Total 26 23 (3)18 Countywide Planning & Development Subtotal by Representation19 Non-Contract 124 84 (40) 20 Union - - - 21 Countywide Planning & Development Total 124 84 (40)22
23 Highway Capital Management Subtotal by Representation24 Non-Contract 12 27 15 25 Union - - - 26 Highway Capital Management Total 12 27 1527
28 Construction Project Management29 Executive Office, Const Total 16 14 (2)30 Construction Total 23 22 (1)31 Engineering Total 35 33 (2) 32 Program Management Total 24 24 - 33 Quality Management Total 8 8 - 34 Construction Project Management Subtotal by Representation35 Non-Contract 105 100 (5) 36 Union 1 1 - 37 Construction Project Management Total 106 101 (5)

Los Angeles County Metropolitan Transportation Authority FY11 Budget
FY11 Budget Summary of Budgeted FTEs by Department · 16
FY10 FY11 Change
Budget Budget from FY1038 Communications39 Chief Communication Officer Total 7 3 (4)40 Customer Communications Total 31 29 (2)41 Customer Relations Total 104 101 (3)42 Public Relations Total 11 7 (4)43 Regional Communications Program Total 21 20 (1)44 Creative Services Total 16 13 (3)45 Customer Programs & Services Total 28 28 046 TAP Operations Total 10 9 (1)47 Communications Subtotal by Representation48 Non-Contract 100 83 (17) 49 Union 128 127 (1) 50 Communications Total 228 210 (18)51
52 Economic Development53 New Business Development Total 7 7 054 Real Estate Administration Total 20 14 (6)55 Economic Development Subtotal by Representation56 Non-Contract 27 21 (6) 57 Union - - - 58 Economic Development Total 27 21 (6)59
60 Administrative Services61 Human Services Total 153 135 (18)62 Procurement Total 107 80 (27)63 Material Management Total 184 171 (13)64 Information Technology Services Total 130 110 (20)65 Administrative Services Subtotal by Representation66 Non-Contract 299 237 (62) 67 Union 275 259 (16) 68 Administrative Services Total 574 496 (78)69
70 Financial Services71 Accounting Total 79 68 (11)72 Finance & Treasury Total 66 61 (5)73 Risk Management Total 58 46 (12)74 Financial Services Subtotal by Representation75 Non-Contract Total 139 111 (28) 76 Union 64 64 - 77 Financial Services Total 203 175 (28)78
79 Management Audit Services Subtotal by Representation80 Non-Contract 27 21 (6) 81 Union - - - 82 Management Audit Services 27 21 (6)

Los Angeles County Metropolitan Transportation Authority FY11 Budget
17 Ÿ Summary of Budgeted FTEs by Department FY11 Budget
Summary of Budgeted FTEs by Department (continued)
FY10 FY11 ChangeBudget Budget from FY10
83 Board of Directors84 Board of Directors & Board Secretary Total 11 11 085 County Counsel Total 4 4 086 Ethics Office Total 7 6 (1)87 Inspector General Total 21 16 (5)88 Board of Directors Subtotal by Representation89 Non-Contract Total 43 37 (6) 90 Union - - - 91 Board of Directors Total 43 37 (6)92
93 Chief Executive Office94 Chief Executive Office Total 7 7 095 Board Relation, Policy & Research Service Total 8 8 096 Corporate Safety Total 24 26 297 Transit Security Total 104 96 (8)98 Government Relations Total 7 7 099 High Speed Rail Total 0 2 2
100 Labor/Employee Relations Total 9 12 3101 Office Of Management & Budget Total 20 17 (3)102 Chief Executive Office Subtotal by Representation103 Non-Contract Total 80 82 2 104 Union 99 93 (6) 105 Chief Executive Office Total 179 175 (4)106
107 Agency wide Subtotal by Representation108 Agency wide Non-Contract Total 1,311 1,071 (240) 109 Agency wide Union Total 7,890 7,600 (290) 110 Agency wide Total 9,201 8,671 (530)

Los Angeles County Metropolitan Transportation Authority FY11 Budget
FY11 Budget · 18
This page was intentionally left blank.

Los Angeles County Metropolitan Transportation Authority FY11 Budget
19 Ÿ Summary of Resources FY11 Budget
Summary of Resources
($ in millions) FY10 to FY11$ Change
1 Sales Tax2 Proposition A 620.8$ 20.4% 616.7$ 16.0% 589.8$ 15.7% (26.9)$ 3 Proposition C 620.9 20.4% 616.9 16.0% 589.8 15.7% (27.1)4 Measure R - 0.0% 361.2 9.4% 589.8 15.7% 228.65 Transportation Development Act 310.4 10.2% 307.3 8.0% 294.9 7.9% (12.4)6 State Transit Assistance 76.5 2.5% 115.2 3.0% - 0.0% (115.2)7 Total Current Year Sales Tax 1,628.6$ 53.5% 2,017.4$ 52.4% 2,064.3$ 55.0% 46.9$ 8
9 Federal Grants10 Recurring (1) 290.2$ 9.5% 326.3$ 8.5% 283.5$ 7.5% (42.8)$ 11 Non-Recurring (2) 85.8 2.8% 471.5 12.3% 225.1 5.9% (246.4)12 Total Current Year Federal Grants 376.0$ 12.4% 797.8$ 20.7% 508.6$ 13.4% (289.2)$ 13
14 Miscellaneous Other15 State Grants (3) 412.0$ 13.5% 414.3$ 10.8% 524.4$ 13.8% 110.1$ 16 Local Grants (4) 13.9 0.5% 45.3 1.2% 14.3 0.4% (31.0)17 Passenger Fares 324.7 10.7% 337.4 8.8% 335.5 8.8% (1.9)18 Advertising 23.6 0.8% 25.6 0.7% 28.0 0.7% 2.419 CNG Fuel Credits 20.4 0.7% 10.2 0.3% - 0.0% (10.2)20 Fines & Fees 8.1 0.3% 8.5 0.2% 8.0 0.2% (0.5)21 Investment Income 63.1 2.1% 5.0 0.1% 1.0 0.0% (4.0)22 Other (5) 40.4 1.3% 66.8 1.7% 55.5 1.5% (11.3)23 Total Current Year Miscellaneous Other 906.2$ 29.8% 913.1$ 23.7% 966.7$ 25.5% 53.6$ 24
25 Total Current Year Revenues 2,910.8$ 95.6% 3,728.3$ 96.9% 3,539.6$ 93.3% (188.7)$
26 133.1 4.4% 120.5 3.1% 252.8 6.7% 132.3
27 3,043.9$ 100.0% 3,848.8$ 100.0% 3,792.4$ 100.0% (56.4)$
Note - totals may not add due to rounding(1) Recurring Federal Grants includes Federal Section 5307 & 5309, Growing State Section 5340, JARC (Job Access/Reverse Commute) Grant Program, and New Freedoms Section 5316-17. (2) Non-Recurring Federal Grants includes CMAQ (Congestion Mitigation & Air Quality Improvement Program), ARRA (American Recovery & Reinvestment Act), Homeland Security, and other grant revenues not considered annual entitlements.(3) State Grants includes Regional Improvement Funds, State Highway Account, STIP (State Transportation Improvement Program), Freeway Service Patrol Grant, State TCRP (Traffic Congestion Relief Program) Grant, Prop 1B and State Others.(4) Local Grants includes Grants from different cities, EZ Pass Program, and Joint Development Reimbursement.(5) Other includes lease revenues, legal settlements, vending revenues, film site revenues, prior year surplus, and other miscellaneous resources.(6) Represents use of fund balances such as STA, TCRP and Prop 1B advances, and others accumulated in prior years to cover current year expenses/expenditures. Refer to separate Fund Balance schedule for more information related to individual Fund Balances.
Total Resources Required to Cover Current Year Expenses/Expenditures
Use of Prior Year Fund Balances to
Fund Current Expense/Expenditure(6)
FY11Actual Budget BudgetFY09 FY10

Los Angeles County Metropolitan Transportation Authority FY11 Budget
FY11 Budget Summary of Expenses/Expenditures by Program · 20
Summary of Expenses/Expenditures by Program
($ in millions) FY10 to FY11$ Change
1 Countywide Bus2 Metro Bus3 Operating 903.3$ 29.7% 976.1$ 25.4% 922.2$ 24.3% (53.9)$ 4 Capital 159.5 5.2% 332.9 8.6% 234.4 6.2% (98.5) 5 BRT Capital 6.0 0.2% 37.6 1.0% 66.0 1.7% 28.4 6 Metro Bus Subtotal 1,068.8$ 35.1% 1,346.6$ 35.0% 1,222.6$ 32.2% (124.0)$ 7
8 Municipal Operator and9 Paratransit Programs 349.5 11.5% 305.9 7.9% 301.7 8.0% (4.2) 10 Countywide Bus Subtotal 1,418.3$ 46.6% 1,652.5$ 42.9% 1,524.3$ 40.2% (128.2)$ 11
12 Countywide Rail13 Metro Rail14 Operating 233.8$ 7.7% 264.4$ 6.9% 257.2$ 6.8% (7.2)$ 15 Capital 32.9 1.1% 51.5 1.3% 51.1 1.3% (0.4) 16 Rail Rehabilation 0.8 0.0% 36.7 1.0% 18.1 0.5% (18.6) 17 Major Rail Construction 337.4 11.1% 273.5 7.1% 237.8 6.3% (35.7) 18 Metro Rail Subtotal 604.9$ 19.9% 626.1$ 16.3% 564.2$ 14.9% (61.9)$ 19
20 Metrolink 47.5 1.6% 70.8 1.8% 75.7 2.0% 4.9 21 Countywide Rail Subtotal 652.4$ 21.4% 696.9$ 18.1% 639.9$ 16.9% (57.0)$ 22
23 Regional Activities 4.7$ 0.2% 21.1$ 0.5% 19.3$ 0.5% (1.8)$ 24
25 Non Bus & Rail Expenses269.7$ 8.9% 321.4$ 8.4% 343.4$ 9.1% 22.0$
jurisdictionsStreets and Highways and 330.1 10.8% 760.3 19.8% 910.2 24.0% 149.9
Other Planning28 Debt Service (1) 297.7 9.8% 329.0 8.5% 296.8 7.8% (32.2) 29 Other Governmental (2) 71.0 2.3% 67.6 1.8% 58.5 1.5% (9.1) 30 Non Bus & Rail Expenses Subtotal 968.5$ 31.8% 1,478.3$ 38.4% 1,608.9$ 42.4% 130.6$ 31
32 Total Expenses/Expenditures 3,043.9$ 100.0% 3,848.8$ 100.0% 3,792.4$ 100.0% (56.4)$
Note: Totals may not add due to rounding.(1) Includes principal liability payments and Benefit Assessment District debt payments, but excludes the
following items: (a) USG Building (General Revenue Bonds) debt service, (b) Capital Grant bondsrepaid from FTA grant with full funding agreement, and (c) defeased lease payments.
(2) General Fund Others, General Fund Property Management, Rideshare Service, & Regional EZ Pass.
Sales tax return to local 26
27
FY11BudgetBudgetActual
FY09 FY10

Los Angeles County Metropolitan Transportation Authority FY11 Budget
21 Ÿ Sales Tax and STA Revenues FY11 Budget
($ in millions)FY09
ActualFY10
BudgetFY11
Budget
FY11 Change
from FY10
Eligible for Operating
1 Proposition A
2 5% Administraiton 31.0$ 30.8$ 29.5$ (1.3)$ 3 25% Local Return 147.4 146.5 140.1 (6.4) 4 35% Rail Development 206.4 205.1 196.1 (9.0) Eligible
5 40% Discretionary
6 Transit (95% of 40%) 224.1 222.6 212.9 (9.7) Eligible
7 Incentive (5% of 40%) 11.8 11.7 11.2 (0.5)
8 Estimated Tax Revenue from Prop A 620.8$ 616.7$ 589.8$ (26.9)$
9 Proposition C
10 1.5% Admnistration 9.3$ 9.3$ 8.8$ (0.4)$
11 5% Rail/Bus Security 30.6 30.4 29.0 (1.3) Eligible
12 10% Commuter Rail 61.2 60.8 58.1 (2.7)
13 20% Local Return 122.3 121.5 116.2 (5.3)
14 25% Freeways/Highways 152.9 151.9 145.2 (6.7)
15 40% Discretionary 244.6 243.1 232.4 (10.7) Eligible
16 Estimated Tax Revenue from Prop C 620.9$ 616.9$ 589.8$ (27.1)$
17 Measure R
18 1.5% Admnistration -$ 5.4$ 8.8$ 3.4$
19 2% TC Metro Rail - 7.1 11.6 4.5
20 3% TC Metrolink - 10.7 17.4 6.8
21 5% Operations - New rail - 17.8 29.0 11.3 *22 15% Local Return - 53.4 87.1 33.8
23 20% Operations - Bus - 71.2 116.2 45.0 Eligible
24 20% Highway Capital - 71.2 116.2 45.0
25 35% TC New Rail/BRT - 124.5 203.3 78.8
26 Estimated Tax Revenue from Measure R -$ 361.3$ 589.8$ 228.6$
27 TDA
28 Administration 6.0$ 6.0$ 6.0$ -$
29 2% Article 3 (Pedestrians & Bikeways) 6.1 6.0 5.8 (0.2)
30 92.101% Article 4 (Bus Transit) 280.4 277.5 266.1 (11.5) Eligible31 5.899% Article 8 (Transit/Streets & Hwys) 18.0 17.8 17.0 (0.7) 32 Estimated Tax Revenue from TDA 310.4$ 307.3$ 294.9$ (12.4)$
33 STA
34 STA Bus 39.9$ 62.3$ -$ (62.3)$ Eligible35 STA Rail 36.6 52.8 - (52.8) Eligible36 Estimated Revenue from STA 76.5$ 115.2$ -$ (115.2)$
37 Totals All Revenue 1,628.6$ 2,017.4$ 2,064.3$ 46.9$
Revenues Eligible for Bus & RailFY09
ActualFY10
BudgetFY11
Budget
FY11 Change
from FY1038 Prop A 430.5$ 427.7$ 409.0$ (18.7)$ 39 Prop C 275.2 273.4 261.4 (12.0) 40 Measure R* - 71.2 116.2 45.0 41 TDA 280.4 277.5 266.1 (11.5) 42 STA 76.5 115.2 - (115.2)
43 Total Bus & Rail Operating Eligible Revenues 1,062.6$ 1,165.0$ 1,052.7$ (112.3)$
*Measure R Rail Operating funding is restricted to new rail operating projects only.Note: Totals may not add due to rounding.
Sales Tax and STA Revenues
Los Angeles County Metropolitan Transportation Authority FY11 Budget
FY11 Budget Comparison of Financial Structure to Organizational Structure · 22
Enterprise Fund
Enterprise Fund
Enterprise Fund
Internal Service
Special Revenue
Props A&C & Measure R General Agency Metro
Strategic Business Unit Operating Capital Debt Fund (1) Fund Admin (2) Fund Fund (3) Total
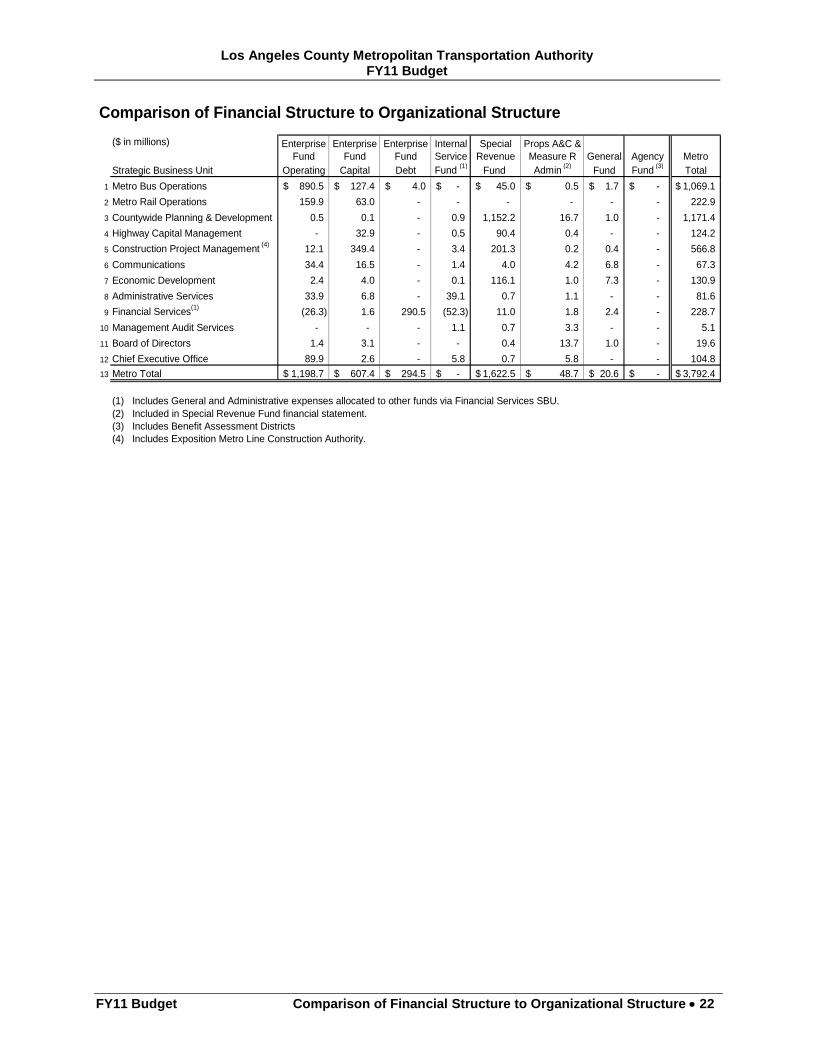
1 Metro Bus Operations 890.5$ 127.4$ 4.0$ -$ 45.0$ 0.5$ 1.7$ -$ 1,069.1$
2 Metro Rail Operations 159.9 63.0 - - - - - - 222.9
3 Countywide Planning & Development 0.5 0.1 - 0.9 1,152.2 16.7 1.0 - 1,171.4
4 Highway Capital Management - 32.9 - 0.5 90.4 0.4 - - 124.2
5 Construction Project Management (4) 12.1 349.4 - 3.4 201.3 0.2 0.4 - 566.8
6 Communications 34.4 16.5 - 1.4 4.0 4.2 6.8 - 67.3
7 Economic Development 2.4 4.0 - 0.1 116.1 1.0 7.3 - 130.9
8 Administrative Services 33.9 6.8 - 39.1 0.7 1.1 - - 81.6
9 Financial Services(1) (26.3) 1.6 290.5 (52.3) 11.0 1.8 2.4 - 228.7
10 Management Audit Services - - - 1.1 0.7 3.3 - - 5.1
11 Board of Directors 1.4 3.1 - - 0.4 13.7 1.0 - 19.6
12 Chief Executive Office 89.9 2.6 - 5.8 0.7 5.8 - - 104.8
13 Metro Total 1,198.7$ 607.4$ 294.5$ -$ 1,622.5$ 48.7$ 20.6$ -$ 3,792.4$
(1) Includes General and Administrative expenses allocated to other funds via Financial Services SBU.(2) Included in Special Revenue Fund financial statement.(3) Includes Benefit Assessment Districts(4) Includes Exposition Metro Line Construction Authority.
Comparison of Financial Structure to Organizational Structure
($ in millions)
Los Angeles County Metropolitan Transportation Authority FY11 Budget
23 Ÿ Enterprise Fund – Operating & Capital Summary FY11 Budget
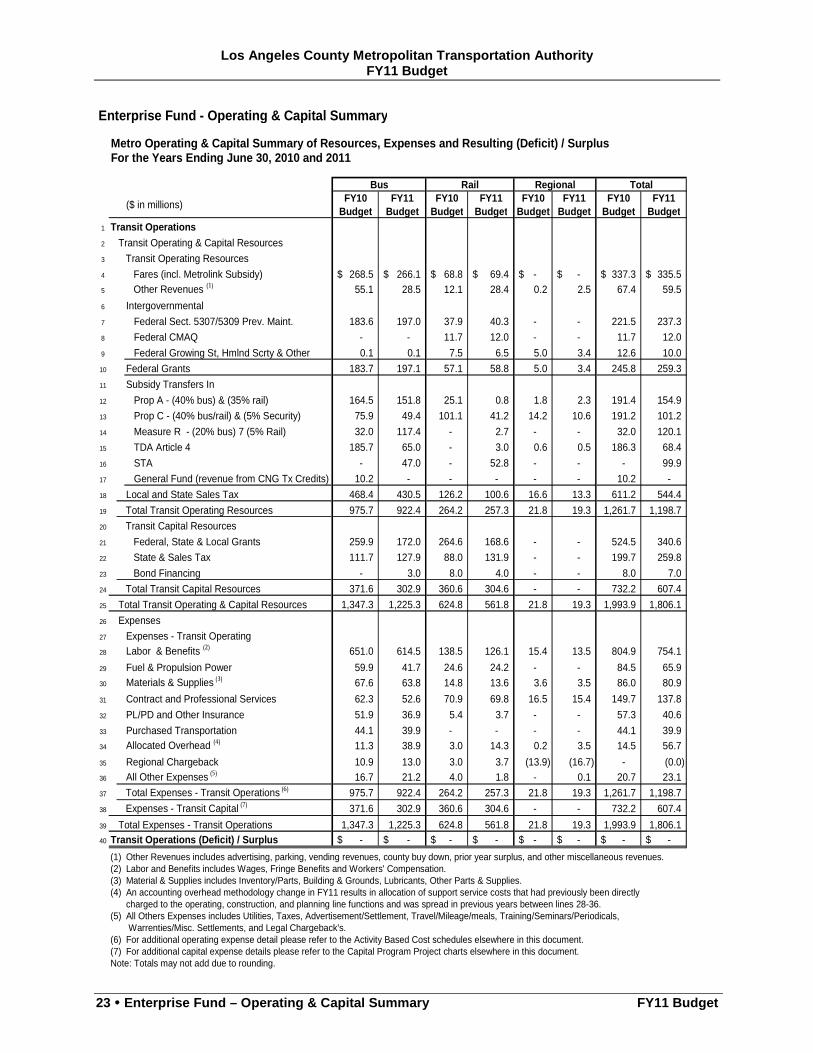
For the Years Ending June 30, 2010 and 2011
Bus Rail Regional Total
($ in millions)FY10
BudgetFY11
BudgetFY10
BudgetFY11
BudgetFY10
BudgetFY11
BudgetFY10
BudgetFY11
Budget
1 Transit Operations
2 Transit Operating & Capital Resources
3 Transit Operating Resources
4 Fares (incl. Metrolink Subsidy) 268.5$ 266.1$ 68.8$ 69.4$ -$ -$ 337.3$ 335.5$ 5 Other Revenues (1) 55.1 28.5 12.1 28.4 0.2 2.5 67.4 59.5
6 Intergovernmental
7 Federal Sect. 5307/5309 Prev. Maint. 183.6 197.0 37.9 40.3 - - 221.5 237.3
8 Federal CMAQ - - 11.7 12.0 - - 11.7 12.0
9 Federal Growing St, Hmlnd Scrty & Other 0.1 0.1 7.5 6.5 5.0 3.4 12.6 10.0
10 Federal Grants 183.7 197.1 57.1 58.8 5.0 3.4 245.8 259.3
11 Subsidy Transfers In
12 Prop A - (40% bus) & (35% rail) 164.5 151.8 25.1 0.8 1.8 2.3 191.4 154.9
13 Prop C - (40% bus/rail) & (5% Security) 75.9 49.4 101.1 41.2 14.2 10.6 191.2 101.2
14 Measure R - (20% bus) 7 (5% Rail) 32.0 117.4 - 2.7 - - 32.0 120.1
15 TDA Article 4 185.7 65.0 - 3.0 0.6 0.5 186.3 68.4
16 STA - 47.0 - 52.8 - - - 99.9
17 General Fund (revenue from CNG Tx Credits) 10.2 - - - - - 10.2 -
18 Local and State Sales Tax 468.4 430.5 126.2 100.6 16.6 13.3 611.2 544.4
19 Total Transit Operating Resources 975.7 922.4 264.2 257.3 21.8 19.3 1,261.7 1,198.7
20 Transit Capital Resources
21 Federal, State & Local Grants 259.9 172.0 264.6 168.6 - - 524.5 340.6
22 State & Sales Tax 111.7 127.9 88.0 131.9 - - 199.7 259.8
23 Bond Financing - 3.0 8.0 4.0 - - 8.0 7.0
24 Total Transit Capital Resources 371.6 302.9 360.6 304.6 - - 732.2 607.4
25 Total Transit Operating & Capital Resources 1,347.3 1,225.3 624.8 561.8 21.8 19.3 1,993.9 1,806.1
26 Expenses
27 Expenses - Transit Operating 325.7 28 Labor & Benefits (2) 651.0 614.5 138.5 126.1 15.4 13.5 804.9 754.1
29 Fuel & Propulsion Power 59.9 41.7 24.6 24.2 - - 84.5 65.9 30 Materials & Supplies (3) 67.6 63.8 14.8 13.6 3.6 3.5 86.0 80.9
31 Contract and Professional Services 62.3 52.6 70.9 69.8 16.5 15.4 149.7 137.8
32 PL/PD and Other Insurance 51.9 36.9 5.4 3.7 - - 57.3 40.6
33 Purchased Transportation 44.1 39.9 - - - - 44.1 39.9 34 Allocated Overhead (4) 11.3 38.9 3.0 14.3 0.2 3.5 14.5 56.7
35 Regional Chargeback 10.9 13.0 3.0 3.7 (13.9) (16.7) - (0.0) 36 All Other Expenses (5) 16.7 21.2 4.0 1.8 - 0.1 20.7 23.1
37 Total Expenses - Transit Operations (6) 975.7 922.4 264.2 257.3 21.8 19.3 1,261.7 1,198.7
38 Expenses - Transit Capital (7) 371.6 302.9 360.6 304.6 - - 732.2 607.4
39 Total Expenses - Transit Operations 1,347.3 1,225.3 624.8 561.8 21.8 19.3 1,993.9 1,806.1 40 Transit Operations (Deficit) / Surplus -$ -$ -$ -$ -$ -$ -$ -$
(1) Other Revenues includes advertising, parking, vending revenues, county buy down, prior year surplus, and other miscellaneous revenues.(2) Labor and Benefits includes Wages, Fringe Benefits and Workers' Compensation.(3) Material & Supplies includes Inventory/Parts, Building & Grounds, Lubricants, Other Parts & Supplies.(4) An accounting overhead methodology change in FY11 results in allocation of support service costs that had previously been directly
charged to the operating, construction, and planning line functions and was spread in previous years between lines 28-36.(5) All Others Expenses includes Utilities, Taxes, Advertisement/Settlement, Travel/Mileage/meals, Training/Seminars/Periodicals,
Warrenties/Misc. Settlements, and Legal Chargeback's.(6) For additional operating expense detail please refer to the Activity Based Cost schedules elsewhere in this document.(7) For additional capital expense details please refer to the Capital Program Project charts elsewhere in this document.Note: Totals may not add due to rounding.
Metro Operating & Capital Summary of Resources, Expenses and Resulting (Deficit) / Surplus
Enterprise Fund - Operating & Capital Summary

Los Angeles County Metropolitan Transportation Authority FY11 Budget
FY11 Budget Governmental Funds · 24
Statement of Revenues, Expenditures and Changes in Fund BalancesFor the Years Ending June 30, 2010 and 2011
Governmental Funds
($ in millions) Special Revenue Fund
Governmental FundsFY10
BudgetFY11
BudgetFY10
BudgetFY11
BudgetFY10
BudgetFY11
Budget
1 Revenue:
2 Sales tax 2,017.4$ 2,064.3$ -$ -$ 2,017.4$ 2,064.3$
3 Intergovernmental grants 396.0 260.2 3.2 0.6 399.3 260.8
4 Other 10.4 8.0 30.5 17.9 40.8 25.9
5 Total Revenues 2,423.8 2,332.5 33.7 18.5 2,457.4 2,351.0
6
7 Expenditures:
8 Subsidies 980.1 1,085.6 - - 980.1 1,085.6
9 Operating Expenditures 521.9 585.6 26.1 20.6 548.0 606.2
10 Expenditures: 1,502.0 1,671.2 26.1 20.6 1,528.1 1,691.8
11
12 Transfers In 93.4 175.2 12.3 11.1 105.7 186.4
13 Transfers (out) (1,213.2) (1,288.5) (10.7) (0.9) (1,223.9) (1,289.4)
14
15 Net change in fund balances (198.0) (451.9) 9.1 8.1 (188.9) (443.8)
16
17 Fund balances - beginning of year 1,250.7 1,363.2 160.6 169.7 1,411.3 1,533.0
18
19 Fund balances - end of year 1,052.7$ 911.3$ 169.7$ 177.9$ 1,222.5$ 1,089.2$
NOTE:- Totals may not add due to rounding.- Beginning FY11 Fund Balances reflect net effect of reforecast FY10 sales tax and STA revenues plus anticipated
unspent FY10 budgeted expenditures.- Special Revenue Other includes State TCRP, PTMSIEA and Security Prop 1B funding, and EZ Pass.
General Fund
Governmental Funds
Total

Los Angeles County Metropolitan Transportation Authority FY11 Budget
25 Ÿ Special Revenue Funds FY11 Budget
Combined Statement of Revenues, Expenditures and Changes in Fund Balances For the Years Ending June 30, 2010 and 2011
($ in millions)Proposition A
Special Revenue FundsFY10
Budget FY11
Budget FY10
Budget FY11
Budget FY10
Budget FY11
Budget FY10
Budget FY11
Budget
1 Revenue:
2 Sales tax -$ -$ 616.7$ 589.8$ 616.9$ 589.8$ 361.2$ 589.8$
3 Intergovernmental grants 6.7 6.6 - - 325.0 225.6 3.3 4.9
4 Other - - 0.6 - 1.2 - - -
5 Total revenues 6.7 6.6 617.3 589.8 943.0 815.4 364.5 594.7
6
7 Expenditures:
8 Subsidies 0.4 0.7 248.1 243.8 516.3 463.7 97.3 276.9
9 Acquisitions and Services 24.5 19.4 - - 338.8 239.0 54.2 258.4
10 Other Operating Expenditures 36.0 28.9 - - 12.5 11.3 6.2 13.5
11 Expenditures 60.9 49.0 248.1 243.8 867.6 714.1 157.7 548.8
12
13 Transfers In 56.2 44.9 - 38.0 5.1 4.8 30.2 85.6
14 Transfers Out (9.0) (3.6) (427.2) (380.9) (411.3) (336.9) (38.6) (185.0)
15 Proceeds from Financing - - - - - - - -
16 Net change in fund balance (7.0) (1.1) (58.0) 3.1 (330.8) (230.8) 198.4 (53.5)
17
18 Fund balance - beginning of year (1.2) 1.1 114.6 46.8 478.5 346.8 - 293.2
19
20 Fund balance - end of year (8.2)$ -$ 56.6$ 49.9$ 147.7$ 116.0$ 198.4$ 239.7$
NOTES:
- Totals may not add due to rounding.
- Beginning FY11 Fund Balances reflect net effect of reforecast FY10 sales tax and STA revenues plus anticipated unspent
FY10 budgeted expenditures.
- Special Revenue Other includes State TCRP, PTMSIEA and Security Prop 1B funding, and EZ Pass.
Special Revenue Funds
Proposition A & C, TDA
AdministrationProposition C Measure R

Los Angeles County Metropolitan Transportation Authority FY11 Budget
FY11 Budget Special Revenue Funds · 26
State Transit Assistance
SAFE Other Total
FY10Budget
FY11 Budget
FY10Budget
FY11 Budget
FY10Budget
FY11 Budget
FY10Budget
FY11 Budget
FY10Budget
FY11 Budget
1
2 307.3$ 294.9$ 115.2$ -$ -$ -$ -$ -$ 2,017.4$ 2,064.3$
3 - - - - - - 61.1 23.2 396.0 260.2
4 - - - - 8.6 8.0 - - 10.4 8.0
5 307.3 294.9 115.2 - 8.6 8.0 61.1 23.2 2,423.8 2,332.5
6
7
8 89.8 77.7 - 0.3 - - 28.2 22.6 980.1 1,085.6
9 - - - - 12.5 9.7 33.8 1.5 463.8 528.1
10 - - - - 3.1 3.4 0.3 0.4 58.1 57.6
11 89.8 77.7 - 0.3 15.6 13.1 62.3 24.5 1,502.0 1,671.2
12
13 0.7 0.7 - - - - 1.3 1.3 93.4 175.2
14 (262.3) (93.2) (0.3) (99.9) (2.0) (2.0) (62.4) (187.0) (1,213.2) (1,288.5)
15 - - - - - - - - - -
16 (44.1) 124.7 114.9 (100.1) (9.0) (7.1) (62.3) (187.0) (198.0) (451.9)
17
18 117.3 90.2 54.2 169.2 35.2 26.2 452.1 389.8 1,250.7 1,363.2
19
20 73.2$ 214.9$ 169.1$ 69.0$ 26.2$ 19.0$ 389.8$ 202.8$ 1,052.7$ 911.3$
Transportation Development Act

Los Angeles County Metropolitan Transportation Authority FY11 Budget
27 Ÿ Fund Balances FY11 Budget
Fund BalancesFor The Year Ending June 30, 2011
($ in millions)
Fund FY11 Estimated
Ending Fund Balance
1 Proposition A:
2 Rail Set Aside 48.7$ 48.7$ (1) -$
3 Incentive 1.2 1.2 (2) -
4 Total Proposition A 49.9$ 49.9$ -$
5 Proposition C:
6 Discretionary 102.5$ 102.5$ (2) -$
7 Interest 13.5 13.5 (3) -
8 Total Proposition C 116.0$ 116.0$ -$
9 Measure R
10 Admin 8.6$ -$ 8.6$
11 Transit Capital - Metrolink 3.5 - 3.5
12 Transit Capital - Metro Rail 10.5 - 10.5
13 Rail Operations 49.7 - 49.7
14 Transit Capital New Rail 120.0 - 120.0
15 Highway Capital 47.4 - 47.4
16 Bus Operations - - -
17 Total Measure R 239.7$ -$ 239.7$
18 Transportation Development Act (TDA):
19 Article 3 19.2$ 19.2$ (2) -$ (2)
20 Article 4 191.4 103.4 (2) 88.0 (2)
21 Article 8 4.3 4.3 (2) - (2)
22 Total TDA 214.9$ 126.9$ 88.0$
23 State Transit Assistance (STA):
24 Revenue Share 32.0$ 32.0$ (2) -$
25 Population Share 37.0 37.0 (1) -
26 Total STA 69.0$ 69.0$ -$
27 SAFE 19.1$ 19.1$ (4) -$
28 Prop. A, C, TDA Administration -$ -$ -$
29 General Fund:
30 Sales/leaseback 27.8$ 27.8$ (5) -$
31 Right-of-Way Lease 72.1 - 72.1
32 HOV Fines 2.3 - 2.3
33 General 74.3 - 72.1
34 Employee Activities 1.4 - 1.4
35 Total General Fund 177.9$ 27.8$ 147.9$
36 Special Revenue Other 202.8$ 173.5$ (6) 29.3$
37 Benefit Assessment Districts 3.0 - 3.0 (7)
38 Pension Plans (Jointly Administered) 640.1$ 640.1$ (8) -$
(1) Reserved for future rail rehabilitation costs.(2) Previously allocated to Metro and Muni Operators.(3) Pending FY10 Board Report committs portions of Propositions A and C Interest Fund Balances.(4) Committed for future SAFE obligations.(5) Contingency amount held related to AIG third-party insured lease deals.(6) Represents Traffic Congestion Relief Program (TCRP) commitments towards private placement bonds -- commitment
expires in 2014. Also includes $39.9 million of loan of TCRP cash to Proposition A 40% for cash flow purposes.(7) Residual BAD equity balance available for Red Line Segment 1 & 2 related projects..(8) Fully committed to existing obligations.
Fund Balance Designations
FY11 Estimated Available Fund
Balance

Los Angeles County Metropolitan Transportation Authority FY11 Budget
FY11 Budget Debt Schedule · 28
Debt Schedule Current Year Debt Service Activities
($ in thousands)
Bus Rail Total Bus Rail Total1 Enterprise Fund Debt Service
2 Debt Service Funding Demand
3 Enterprise Fund Debt Service Expense 28,209.0$ 275,835.4$ 304,044.4$ 24,728.1$ 269,804.6$ 294,532.7$
4 Premium/Discount Amortization (1) 194.4 3,084.3 3,278.7 169.8 4,138.6 4,308.4
5 Total Debt Service Funding Demand 28,403.4$ 278,919.7$ 307,323.1$ 24,897.9$ 273,943.2$ 298,841.1$
6 Debt Service Funding Sources
7 Proposition A 35 Rail Set Aside 2,845.0$ 156,766.2$ 159,611.2$ 2,935.6$ 157,473.0$ 160,408.6$
8 Proposition A 40 Discretionary 41.2 2,267.8 2,309.0 42.2 2,265.4 2,307.6
9 Proposition C 40 Discretionary 13,320.8 75,432.6 88,753.4 11,443.0 72,810.4 84,253.4
10 Proposition C 10 Commuter Rail 1,936.4 10,965.2 12,901.6 1,584.8 10,083.9 11,668.7
11 Proposition C 25 Street & Highways 5,913.7 33,487.8 39,401.5 4,920.8 31,310.5 36,231.3
12 Trans. Development Act Articicle 4 4,346.4 - 4,346.4 3,971.4 - 3,971.4
13 Measure R 35 Transit Capital Program New Rail/BRT - - - - - -
14 Measure R 3 Metrolink - - - - - -
15 Measure R 2 Metro Rail Capital Program - - - - - -
16 Measure R 20 Highway Capital Program - - - - - -
17 Total Enterprise Fund Debt Service Funding Sources 28,403.4$ 278,919.7$ 307,323.1$ 24,897.9$ 273,943.1$ 298,841.1$
18 Enterprise Fund Debt Service (Deficit) / Surplus -$ -$ -$ -$ -$ -$
19 Governmental and Agency Funds Debt Service
20 Governmental Fund and Agency Fund Debt Service Expense 24,939.9$ 2,277.3$
21 Debt Service Funding Sources
22 Proposition A35 Rail Set Aside 2,280.2$ 2,277.3$
23 Benefit Assessment District Assessments 22,659.7 -
24 Total Governmental & Agency Funds Debt Service Funding Sources 24,939.9$ 2,277.3$
25 Governmental and Agency Funds Debt (Deficit) / Surplus -$ -$
26 Debt Service Funding Demand All Funds
27 Total Debt Service Expense All Funds (2) 328,984.3$ 296,810.0$
28 Premium/Discount Amortization (1) 3,278.7 4,308.4
29 Total Debt Service Funding Demand All Funds 332,263.0$ 301,118.4$
30 Debt Service Funding Sources All Funds 332,263.0$ 301,118.4$
31 Total Debt Service (Deficit) / Surplus All Funds -$ -$
($ in thousands)
Bus Rail Total Bus Rail Total32 Outstanding Principal Balance All Funds
33 Enterprise Fund Principal Balance
34 Proposition A 30,396$ 1,674,892$ 1,705,288$ 30,867$ 1,655,775$ 1,686,642$
35 Proposition C 223,491 1,112,714 1,336,205 204,763 1,131,108 1,335,871
36 Transportation Development Act Article 4 18,941 - 18,941 15,235 - 15,235
37 Total Enterprise Fund Principal Balance 272,828$ 2,787,606$ 3,060,434$ 250,865$ 2,786,883$ 3,037,748$
38 Governmental and Agency Funds Principal Balance
39 Proposition A35 Rail Set Aside 25,765 24,755
40 Benefit Assessment District Assessments 22,170 -
41 Total Governmental and Agency Funds Principal Balance 47,935 24,755
42 Total Outstanding Principal Balance All Funds 3,108,369$ 3,062,503$ 242,432 2,103,888 714,114 219,998 2,092,428 725,322 Note: Totals may not add due to rounding.(1) Amortizing the difference between the market value of the debt instrument and the face value of the debt instrument.(2) Includes principal liability payments and Benefit Assessment District debt payments, but excludes the following items:
(a) USG Building (General Revenue Bonds) debt service, (b) Capital Grant bonds repaid from FTA grant with
full funding agreement, and (c) defeased lease payments.
Beginning FY10 Balance Beginning FY11 Balance
FY10 Budget FY11 Budget
Long Term Debt Obligations for Next 30 Years

Los Angeles County Metropolitan Transportation Authority FY11 Budget
29 Ÿ Debt Policy Maximum Permitted Debt Service FY11 Budget
Debt Policy Maximum Permitted Debt Service($ in millions)
FY09 FY10 FY11 Foot-Actual Budget Budget notes
1 Proposition A:2 Net A35% Sales Tax Revenue 217.3$ 197.5$ 206.4$ 3 Annual A35% Debt Service 158.7 159.6 160.4 4 A35% Debt Policy Maximum Permitted Annual Debt Service 189.0 171.8 179.6 15 Maximum Additional A35% Bond Issuance allowed under Debt Policy 396.2 159.5 251.0 26
7 Net A40% Sales Tax Revenue 248.3$ 225.7$ 235.9$ 8 Annual A40% Debt Service 2.3 2.3 2.3 9 A40% Debt Policy Maximum Permitted Annual Debt Service N/A N/A N/A 3
10 Maximum Additional A35% Bond Issuance allowed under Debt Policy N/A N/A N/A 311
12
13 Proposition C:14 Net C10% Sales Tax Revenue 62.1$ 56.4$ 59.0$ 15 Annual C10% Debt Service 12.4 12.9 11.7 16 C10% Debt Policy Maximum Permitted Annual Debt Service 24.8 22.6 23.6 417 Maximum Additional A35% Bond Issuance allowed under Debt Policy 163.0 126.5 155.9 218
19 Net C25% Sales Tax Revenue 155.2$ 141.1$ 147.5$ 20 Annual C25% Debt Service 35.6 39.4 36.2 21 C25% Debt Policy Maximum Permitted Annual Debt Service 93.1 84.6 88.5 522 Maximum Additional A35% Bond Issuance allowed under Debt Policy 752.2 591.6 683.3 223
24 Net C40% Sales Tax Revenue 248.3$ 225.7$ 235.9$ 25 Annual C40% Debt Service 69.1 74.8 70.5 626 C40% Debt Policy Maximum Permitted Annual Debt Service 99.3 90.3 94.4 727 Maximum Additional A35% Bond Issuance allowed under Debt Policy 395.3 202.7 312.9 2
Footnotes: 1 - Debt policy limits annual debt service to 87% of PA35% tax revenue. 2 - Total amount of bonds that could be issued under the Debt Policy limitations. Assumes 30 year amortization of debt at 5.5%. 3 - No further debt issuance is permitted pursuant to the debt policy. 4 - Debt policy limits annual debt service to 40% of PC10%. 5 - Debt policy limits annual debt service to 60% of PC25%. 6 - Does not include Workers Compensation Bonds debt service. 7 - Debt policy limits annual debt service to 40% of PC40%.

Los Angeles County Metropolitan Transportation Authority FY11 Budget
FY11 Budget Capital Program Project List Ÿ 30
Capital Program Project List
($ in thousands) Expected FY11 FY12 Life
Expenditures Budget and of
Project Title CP# Through FY10 Future Project
1
2 Bus Acquitisiton
3 45-Foot Composite Buses 201013 163,212$ 15,331$ 587$ 179,130$
4 100 CNG Buses (ARRA Funds) 201052 1,552 58,381 67 60,000
5 Contract Services Bus Buy 201054 18,632 3,898 1,470 24,000
641 Buses for Congestion Relief Reduction Demonstration Program (CRDP)
201059 28,336 64 - 28,400
7 Zero Emission Bus Demonstration Project 201060 - 475 119 594 Y
8 Bus Acquitisiton Total 211,732 78,150 2,243 292,124
9
10 Bus Facilities Improvements
11 Division 13 202001 7,927 5,396 81,677 95,000
12 Articulated Bus Facility Modifications 202065 6,074 567 - 6,641
13 Division 7 - Installation of a Fire Alarm System 202107 305 46 - 351
14 Division 10 - CNG Fueling Facility 202138 287 641 10,745 11,673
15 Division 18 - CNG Fueling Facility 202139 212 582 10,306 11,100
16 Metro Art Enhancements 202166 480 135 - 615
17 FY11 UST Replacement 202174 - 2,678 - 2,678 Y
18 Division 5, 10, & 18 Renovations 202181 18,162 60 111 18,333
19 In-ground Bus Hoist Replacement -- Phase II 202203 2,726 363 1,283 4,372
20 Articulated Bus Facility Modifications -- Phase II 202204 3,030 180 170 3,380
21 ATMS Upgrade 202232 6,856 838 4,412 12,107
22 Division 1, 3, 8, 9 and 15 Renovations 202239 13,113 608 - 13,720
23Bauchet Street Storage and Facilities Maintenance Structure
202246 13,191 2,974 1,189 17,355
24 Metro Orange Line Passenger Amenities 202249 93 522 - 615
25 Div. 1 Environmental Mitigations 202253 255 195 - 450
26 Division 3 Master Plan Phases II-IV 202260 5,411 3,294 4,495 13,200
27 Solar Powered Enhanced Bus Stop Lighting 202261 293 7 450 750
28 Division 9 Bus Yard Expansion 202279 748 122 105 975
29El Monte Busway Improvements and Transit Center Expansion (CRDP)
202286 24,147 35,591 368 60,106
30 Harbor Transitway Improvements (CRDP) 202287 1,620 1,860 370 3,850
31 CNG Compression Electrification Project 202302 13,412 11,127 3,461 28,000
32 Bus Stop Information System Improvement Project 202304 150 523 477 1,150
33 Bus Facilities Improvements Total 118,493 68,309 119,619 306,420
34
35 Bus Maintenance
36 FY09 Bus Midlife Program 203006 22,605 1,690 - 24,294
37 FY10 Bus Midlife Program 203007 18,077 28,922 - 47,000 Y (1)
38 FY10 CMS Engine Replacement Program 203017 11,121 1,726 - 12,847
39 FY11 CMS Engine Replacement Program 203018 - 8,722 1,478 10,200 Y
40 Bus Maintenance total 51,803 41,060 1,478 94,341 (1) The LOP for CP 203007 has increased.Note: Totals may not add due to rounding.
New in
FY11

Los Angeles County Metropolitan Transportation Authority FY11 Budget
31 Ÿ Capital Program Project List FY11 Budget
Capital Program Project List (continued)
($ in thousands) Expected FY11 FY12 Life
Expenditures Budget and of
Project Title CP# Through FY10 Future Project41
42 IT/Commuications43 Simulcast Security Radio System Upgrade 207033 885$ 383$ 50$ 1,318$
44 Application Platform Upgrade Program 207057 - 567 - 567 Y
45 Computer Equipment Upgrade Program 207060 - 1,119 - 1,119 Y
46 Transit Operator Activity Scheduling and Tracking 207061 7,122 559 - 7,681
47 Procurement Contract Management System 207096 514 52 1,697 2,263
48 Computer Center UPS Replacement 207101 - 649 - 649 Y
49 MRL PBX Emergency Replacement Project 207112 - 264 - 264 Y
50 IT/Commuications Total 8,521 3,594 1,746 13,862 51
52 Non-Revenue Vehicles53 FY08 Bus System Support Non-Revenue Vehicles 208007 9,293 1,548 - 10,841
54 Replacement Non-Revenue Heavy Duty Vehicles - Bus 208049 1,225 991 - 2,215
55 Expansion Non-Revenue Heavy Duty Vehicles 208050 1,379 119 - 1,499
56 Replacement Non-Revenue Equipment - Bus 208051 620 117 451 1,188
57 Replacement Metro Experience Vehicle Combo 208054 1,203 344 - 1,548
58 Non-Revenue Vehicles Total 13,721 3,119 451 17,291 59
60 Other Capital61 Universal Fare Collection System 200225 94,607 3,000 - 97,607
62 Regional Service Center and Clearinghouse 200351 17,472 2,600 - 20,072
63 Regional Rail Signage System Improvements 204020 443 200 1,588 2,231
64 Customer Center Security & Information Enhancements 207048 260 20 62 342
65 Express Lanes on I-10 and I-110 (CRDP) 210120 16,888 34,400 12,912 64,200
66 Harbor Freeway/ El Monte Busway Amenities (CRDP) 210124 70 656 304 1,031
67 SCRRA Relocation Program 210150 - 2,500 - 2,500
68 Other Capital Total 129,741 43,376 14,866 187,983
Note: Totals may not add due to rounding.
New in
FY11

Los Angeles County Metropolitan Transportation Authority FY11 Budget
FY11 Budget Capital Program Project List · 32
Capital Program Project List (continued)
($ in thousands) Expected FY11 FY12 Life
Expenditures Budget and of
Project Title CP# Through FY10 Future Project
69
70 Rail Facilities
71 Division 20 Carwash & Cleaning Platform 204047 5,815$ 5,347$ 4,238 15,400$
72 Division 21 Improvements - Phase II 204053 3,915 4,798 5,288 14,000
73 UPS System & Backup Generator for Loc. 61 (2) 204082 122 458 (205) 375
74 MRL Fall Protection Gear Installation 204088 347 42 111 500
75 Bicycle Lockers and Racks for Metro Rail Stations 204089 545 264 541 1,350
76 Div. 21 Rockfall Mitigation Project 204112 1,121 359 - 1,480
77 MRL Station Entrance Canopies 204115 3,340 3,204 226 6,770
78 Metro Rail Gating 210094 12,732 8,269 - 21,000
79 Rail Facilities Total 27,935 22,740 10,199 60,874
80
81 Rail Rehabilitation
82 Subway Railcar Midlife Overhaul 206034 3,507 617 197,876 202,000
83 MBL Traction Power Sub-Stations Rehabilitation 211001 8,469 7,941 65,790 82,200
84 MBL OCS Rehabilitation 211002 1,124 1,140 10,737 13,000
85 MBL TWC Rehabilitation 211003 1,460 290 - 1,750
86 MBL & MRL Switch Machines Rehabilitation 211004 848 426 - 1,275
87 MBL Signal System Rehabilitation 211005 386 149 285 820
88 MGL Central ATC Computer System Rehabilitation 211006 422 63 265 750
89 MRL Segment 2/3 Remote Terminal Units Rehabilitation 211008 312 109 119 540
90Escalator/Elevator Modernization Program - Civic Center Station
211010 2,700 2,443 6,857 12,000
91 Hi-Rail OCS Rehab Platform/Bucket Trucks 211012 488 2,484 1,728 4,700
92 Digital Rail Radio Upgrade 211013 1,286 984 22,730 25,000
93 MRL Seg-1 A/F Track Circuit Replacement 211014 361 1,452 466 2,279
94 Rail Rehabilitation Total 21,364 18,098 306,852 346,314
95
96 Rail Vehicle Maintenance
97 P2000 Vehicle Signaling Package Upgrade 206005 1,142 841 1,381 3,364
98 Rail Vehicle Maintenance Total 1,142 841 1,381 3,364
(2) CP 204082 is currently budgeted in excess of the approved LOP. The budget will be revised to conform with the LOP.
New in FY11

Los Angeles County Metropolitan Transportation Authority FY11 Budget
33 Ÿ Capital Program Project List FY11 Budget
Capital Program Project List (continued)
($ in thousands) Expected FY11 FY12 Life
Expenditures Budget and of
Project Title CP# Through FY10 Future Project
99
100 Security Projects
101MRL Bridges and Tunnels Protection Project Phase I (DHS)
204084 1,528$ 312$ - 1,840$
102 Security Control Center Upgrade 210100 550 168 137 856
103MGL Transit Passenger Information Systems (DHS - FY2007 TSGP)
212001 602 335 1,338 2,275
104MRL Bridges and Tunnels Protection Project Phase II (DHS - FY2007 TSGP)
212002 438 339 623 1,400
105 ATMS Disaster Recovery System Phase I 212003 1,104 341 340 1,785
106 Intelligent Video Upgrade (DHS - FY2007 TSGP) 212005 226 128 380 734
107 Security Projects Total 4,448 1,623 2,819 8,890
108
109 Warehouse
110 Division 7 Warehousing Support - West Hollywood 209028 1,063 121 - 1,184
111 Green Line Material Storage Building and Offices 209042 136 6 1,051 1,192
112 Vertical Carousel - Blue Line Warehouse 209045 76 182 - 258
113 Division 9 Warehouse Improvements 209047 82 194 614 890
114Safety Improvements at the Central Warehouse Facility
209058 209 137 - 345
115 Warehouse Total 1,566 639 1,665 3,870
116
117 Wayside Systems
118 MBL Grade Crossing Improvements 205006 8,722 1,389 489 10,600
119 Light Rail Train Tracking Improvements 205014 504 283 168 956
120 MRL Seg-1 Remote Terminal Unit (RTU) Upgrade 205017 2,380 241 23 2,645
121 System-Wide Elevator/Escalator System Monitoring 205039 500 3 8 511
122 Cathodic Protection Systems 205054 242 215 464 920
123MBL Wayside Communication Enclosures Installation
205069 291 3 113 406
124 Wayside Workers Protection Project 205085 668 2,019 1,886 4,573
125 Rail Wayside Energy Storage System 205090 350 2,846 1,270 4,466
126 Wayside Systems Total 13,657 6,999 4,421 25,077
Note: Totals may not add due to rounding.
New in
FY11

Los Angeles County Metropolitan Transportation Authority FY11 Budget
FY11 Budget Capital Program Project List · 34
Capital Program Project List (continued)
($ in thousands) Expected FY11 FY12 Life
Expenditures Budget and of
Project Title CP# Through FY10 Future Project
127
128 Major Construction
129 Expo/Blue Line Light Rail Vehicle Procurement 206035 475$ 15,622$ 158,403$ 174,500$
130 Metro Gold Line Eastside Extension 800088 877,634 21,180 - 898,814
131 Metro Orange Line Extension 800119 38,707 65,449 111,444 215,600
132 Light Rail Vehicle Fleet Enhancement 800151 108,632 16,866 27,422 152,919
133 MGL Eastside Extension Enhancements 800288 54,366 1,062 476 55,903
134 Pasadena Gold Line Closeout 809005 1,658 860 211 2,729
135 MRL Segment 2 Closeout 809081 12,937 1,688 683 15,307
136 MRL Segment 3 North Hollywood Closeout 809082 2,352 749 1,038 4,139
137 Project Management Information System 860001 - 860 835 1,695
138 Mid-City/Exposition Light Rail Corridor (3) 890001 605,565 111,253 145,482 862,300
139Mid-City Exposition Light Rail Corridor,
Phase 2 (4) 890002 40,860 83,262 - -
140 Major Construction Total 1,743,186 318,850 445,992 2,383,906
141 Total Operating Capital 604,122$ 288,549$ 467,740$ 1,360,410$
142 Total Major Construction Capital 1,743,186 318,850 445,992 2,383,906
143 Grand Total Capital Program 2,347,308$ 607,399$ 913,733$ 3,744,316$
Note: Totals may not add due to rounding.(3) CP 890001 includes Metro costs for CP 800113 - Expo Light Rail Corridor(4) CP 890002 does not have an established LOP at this time. Does not include Project 460301.
New in
FY11

Los Angeles County Metropolitan Transportation Authority FY11 Budget
35 Ÿ Measure R Projects/Funding FY11 Budget
Measure R Funds
Non-Measure R Funds
Total FY11 Budgeted Expense
1 Measure R Administration (1.5%) 4.2$ -$ 4.2$
2 Measure R Local Returns (15%) 87.1 - 87.1
3 Measure R Transit Capital - Metrolink (3%)
4 Metrolink Transit Capital 17.4 - 17.4
5 Measure R Transit Capital - Metrolink (3%) Total 17.4 - 17.4
6 Measure R Transit Capital - Metro Rail (2%)
7 Eastside Quad Gate Study and Installation 8.6 - 8.6
8 Measure R Transit Capital - Metro Rail (2%) Total 8.6 - 8.6
9 Measure R Transit Capital - New Rail (35%)
10 Exposition Blvd LRT Phase II 109.9 - 109.9
11 Gold Line Foothill LRT Extension 54.1 - 54.1
12 Crenshaw Transit Corridor 13.3 - 13.3
13 Eastside Light Rail Access 5.3 - 5.3
14 Green Line Extension to LAX Airport 1.8 - 1.8
15 Red Line Westside Extension - 36.0 36.0
16 Regional Connector - 19.6 19.6
17 Eastside Extension Phase II - 6.9 6.9
18 San Fernando Valley East N/S Rapidway - 2.5 2.5
19 Green Line Extension Redondo Beach-South Bay - 2.4 2.4
20 West Santa Ana Branch Corridor Study - 0.9 0.9
21 Measure R Transit Capital - New Rail (35%) Total 184.4 68.3 252.7
22 Measure R Highway Capital (20%)
23 SR-138 Capacity Enhancement 18.0 - 18.0
24 Hwy Operating Improvements Virgenes/Malibu 17.0 - 17.0
25 Hwy Operating Improvements Arroyo Verdugo 16.5 - 16.5
26 Countywide Soundwall Projects 15.8 - 15.8
27 High Desert Corridor 13.0 - 13.0
28 I-605 Corridor "Hot Spot" 10.6 - 10.6
29 I-710 South Early Action Project 9.2 - 9.2
30 I-5 N Enhance SR14/Kern Cnty 8.0 - 8.0
31 I-710 North Gap Closure 3.1 - 3.1
32 SFV I-405 Corridor Connection 1.0 - 1.0
33 Phase II Alameda Corridor East Grade Separation 31.1 - 31.1
34 I-405, I-110, I-105 SR91 Ramp & Interchange 2.1 - 2.1
35 Measure R Highway Capital (20%) Total 145.4 - 145.4
36 Measure R Operations - Bus (20%)
37 Metro Bus Share 117.4 - 117.4
38 Measure R 20% Fap Subsidies 34.2 - 34.2
39 Measure R Operations - Bus (20%) Total 151.6 - 151.6
40 Measure R Operations - New Rail (5%) - - -
41 Grand Total 598.7$ 68.3$ 667.0$
Measure R Funding / Projects ($ in millions)
Measure R Projects/Funding
Los Angeles County Metropolitan Transportation Authority FY11 Budget
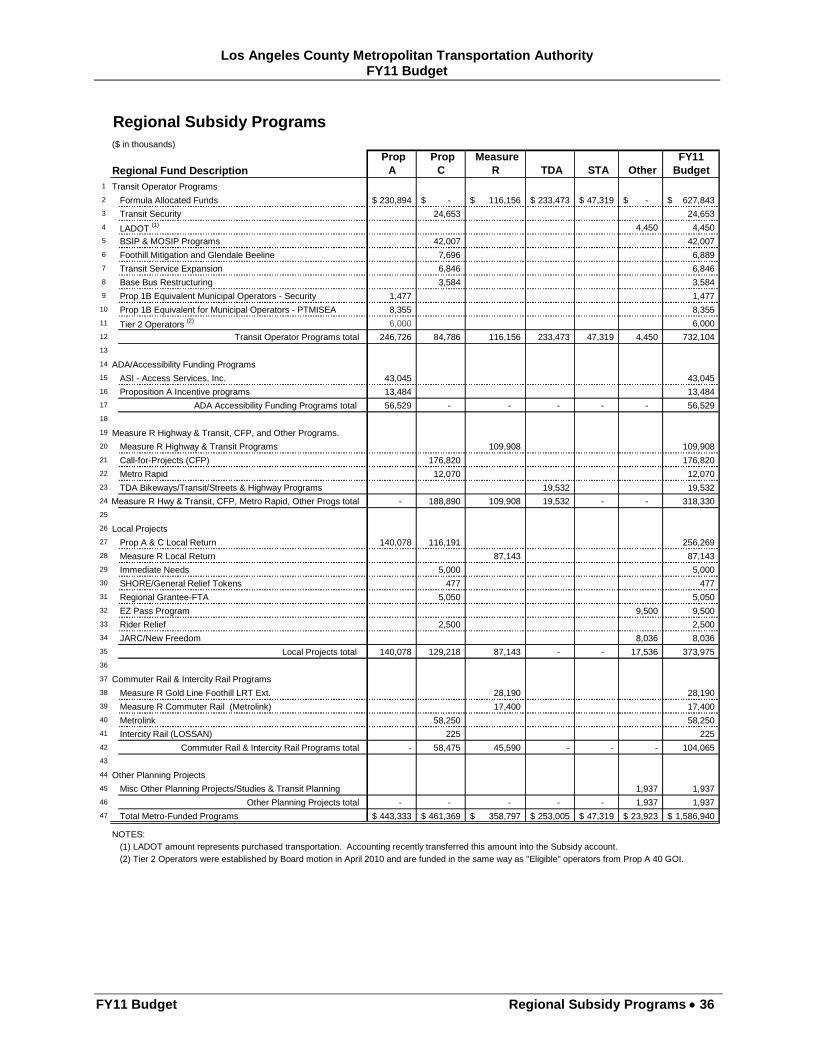
FY11 Budget Regional Subsidy Programs · 36
Regional Subsidy Programs($ in thousands)
Regional Fund Description Prop
A Prop
C Measure
R TDA STA Other FY11
Budget1 Transit Operator Programs2 Formula Allocated Funds 230,894$ -$ 116,156$ 233,473$ 47,319$ -$ 627,843$ 3 Transit Security 24,653 24,653
4 LADOT (1) 4,450 4,4505 BSIP & MOSIP Programs 42,007 42,0076 Foothill Mitigation and Glendale Beeline 7,696 6,8897 Transit Service Expansion 6,846 6,846
8 Base Bus Restructuring 3,584 3,5849 Prop 1B Equivalent Municipal Operators - Security 1,477 1,477
10 Prop 1B Equivalent for Municipal Operators - PTMISEA 8,355 8,355 11 Tier 2 Operators (2) 6,000 6,000 12 Transit Operator Programs total 246,726 84,786 116,156 233,473 47,319 4,450 732,10413
14 ADA/Accessibility Funding Programs15 ASI - Access Services, Inc. 43,045 43,04516 Proposition A Incentive programs 13,484 13,48417 ADA Accessibility Funding Programs total 56,529 - - - - - 56,52918
19 Measure R Highway & Transit, CFP, and Other Programs.20 Measure R Highway & Transit Programs 109,908 109,908
21 Call-for-Projects (CFP) 176,820 176,82022 Metro Rapid 12,070 12,07023 TDA Bikeways/Transit/Streets & Highway Programs 19,532 19,53224 Measure R Hwy & Transit, CFP, Metro Rapid, Other Progs total - 188,890 109,908 19,532 - - 318,330
25
26 Local Projects27 Prop A & C Local Return 140,078 116,191 256,26928 Measure R Local Return 87,143 87,14329 Immediate Needs 5,000 5,00030 SHORE/General Relief Tokens 477 47731 Regional Grantee-FTA 5,050 5,05032 EZ Pass Program 9,500 9,50033 Rider Relief 2,500 2,50034 JARC/New Freedom 8,036 8,03635 Local Projects total 140,078 129,218 87,143 - - 17,536 373,97536
37 Commuter Rail & Intercity Rail Programs
38 Measure R Gold Line Foothill LRT Ext. 28,190 28,19039 Measure R Commuter Rail (Metrolink) 17,400 17,40040 Metrolink 58,250 58,25041 Intercity Rail (LOSSAN) 225 225
42 Commuter Rail & Intercity Rail Programs total - 58,475 45,590 - - - 104,06543
44 Other Planning Projects45 Misc Other Planning Projects/Studies & Transit Planning 1,937 1,937
46 Other Planning Projects total - - - - - 1,937 1,93747 Total Metro-Funded Programs 443,333$ 461,369$ 358,797$ 253,005$ 47,319$ 23,923$ 1,586,940$
NOTES:(1) LADOT amount represents purchased transportation. Accounting recently transferred this amount into the Subsidy account.(2) Tier 2 Operators were established by Board motion in April 2010 and are funded in the same way as "Eligible" operators from Prop A 40 GOI.

Los Angeles County Metropolitan Transportation Authority FY11 Budget
37 Ÿ Modal Operating Statistics FY11 Budget
Modal Operating Statistics
Bus excluding FY09 FY10 FY11 Inc/(Dec) Inc/(Dec)
Orange Line Notes Actual Budget Budget Budget %
1 Fares ($000) 252,885$ 262,459$ 260,042$ (2,417)$ -0.9%2 Other Operating Revenue ($000) 22,644$ 24,098$ 26,388$ 2,290$ 9.5%3 Expenses ($000) (1) 934,139$ 951,662$ 899,434$ (52,228)$ -5.5%4 Boardings (000) 378,753 393,530 348,958 (44,572) -11.3%5 Farebox Recovery Ratio 27.1% 27.6% 28.9% 1.3% 1.3%6 Vehicle Service Hours (000) (2) 7,418 7,498 7,111 (388) -5.2%7 Cost Per Hour 125.93$ 126.92$ 126.49$ (0.43)$ -0.3%8 Cost Per Passenger Mile 0.63$ 0.64$ 0.68$ 0.04$ 6.6%9 Vehicle Service Miles (000) (2) 87,014 94,634 83,981 (10,653) -11.3%10 Passenger Miles (000) (3) 1,474,137 1,481,529 1,313,154 (168,375) -11.4%11 Fare Revenue Per Boarding 0.67$ 0.67$ 0.75$ 0.08$ 11.9%12 Subsidy Per Boarding 1.74$ 1.69$ 1.76$ 0.07$ 3.9%13 Subsidy Per Passenger Mile 0.45$ 0.45$ 0.47$ 0.02$ 4.0%14 Vehicles Operated 2,239 2,213 2,213 - 0.0%
FY09 FY10 FY11 Inc/(Dec) Inc/(Dec)
Orange Line Notes Actual Budget Budget Budget %
15 Fares ($000) 4,890$ 5,198$ 5,213$ 15$ 0.3%16 Other Operating Revenue ($000) 411$ (411)$ -100.0%17 Expenses ($000) (1) 20,305$ 24,058$ 22,759$ (1,299)$ -5.4%18 Boardings (000) 7,318 7,793 6,996 (797) -10.2%19 Farebox Recovery Ratio 24.1% 21.6% 22.9% 1.3% 1.3%20 Vehicle Service Hours (000) (2) 98 102 102 - 0.0%21 Cost Per Hour 207.64$ 236.88$ 224.09$ (12.79)$ -5.4%22 Cost Per Passenger Mile 0.46$ 0.56$ 0.59$ 0.03$ 5.4%23 Vehicle Service Miles (000) (2) 1,542 1,619 1,619 - 0.0%24 Passenger Miles (000) (3) 43,675 43,086 38,679 (4,407) -10.2%25 Fare Revenue Per Boarding 0.67$ 0.67$ 0.75$ 0.08$ 11.9%26 Subsidy Per Boarding 2.11$ 2.37$ 2.51$ 0.14$ 5.9%27 Subsidy Per Passenger Mile 0.35$ 0.43$ 0.45$ 0.03$ 5.9%28 Vehicles Operated 28 28 28 - 0.0%

Los Angeles County Metropolitan Transportation Authority FY11 Budget
FY11 Budget Modal Operating Statistics · 38
FY09 FY10 FY11 Inc/(Dec) Inc/(Dec)Light Rail (4)
Notes Actual Budget Budget Budget %
29 Fares ($000) 31,053$ 33,183$ 33,301$ 117$ 0.4%30 Other Operating Revenue ($000) 39 282 (282) -100.0%31 Expenses ($000) (1) 151,405$ 173,698 168,336 (5,362)$ -3.1%32 Boardings (000) 46,028 49,752 44,687 (5,065) -10.2%33 Farebox Recovery Ratio 20.5% 19.1% 19.8% 0.7% 0.7%34 Vehicle Service Hours (000) (2) 385 449 449 - 0.0%35 Cost Per Hour 393.37$ 386.93$ 375.30$ (11.63)$ -3.0%36 Cost Per Passenger Mile 0.46$ 0.49$ 0.53$ 0.04$ 7.9%37 Vehicle Service Miles (000) (2) 9,051 13,514 10,190 (3,325) -24.6%38 Passenger Miles (000) 327,341 354,755 318,633 (36,122) -10.2%39 Fare Revenue Per Boarding 0.67$ 0.67$ 0.75$ 0.08$ 11.9%40 Subsidy Per Boarding (3) 2.61$ 2.82$ 3.02$ 0.20$ 7.2%41 Subsidy Per Passenger Mile (3) 0.37$ 0.40$ 0.42$ 0.03$ 7.6%
FY09 FY10 FY11 Inc/(Dec) Inc/(Dec)
Heavy Rail (5) Notes Actual Budget Budget Budget %
42 Fares ($000) 31,620$ 31,614$ 33,762$ 2,148$ 6.8%43 Other Operating Revenue ($000) 5,514 5,889 4,734 (1,156) -19.6%44 Expenses ($000) (1) 85,902$ 90,505$ 88,919$ (1,586)$ -1.8%45 Boardings (000) 46,891 47,400 45,306 (2,094) -4.4%46 Farebox Recovery Ratio 36.8% 34.9% 38.0% 3.0% 3.0%47 Vehicle Service Hours (000) (2) 268 257 257 - 0.0%48 Cost Per Hour 319.95$ 351.98$ 345.57$ (6.41)$ -1.8%49 Cost Per Passenger Mile 0.38$ 0.38$ 0.39$ 0.01$ 2.8%50 Vehicle Service Miles (000) (2) 6,078 5,897 5,930 33 0.6%51 Passenger Miles (000) 227,656 236,999 226,530 (10,469) -4.4%52 Fare Revenue Per Boarding 0.67$ 0.67$ 0.75$ 0.08$ 11.9%53 Subsidy Per Boarding (3) 1.04$ 1.12$ 1.11$ (0.01)$ -0.5%54 Subsidy Per Passenger Mile (3) 0.21$ 0.22$ 0.22$ -$ 0.0%
(1) Expenses exclude regional costs and debt.(2) Reflect revenue vehicle hours & miles.(3) Subsidy equals expenses less fares and other operating revenue.(4) Light Rail includes the Blue, Green and Gold Lines.(5) Heavy Rail includes the Red and Purple Lines.

Los Angeles County Metropolitan Transportation Authority FY11 Budget
39 Ÿ Activity Based Bus Cost Model FY11 Budget
Activities Dollars $/RSH Dollars $/RSH Dollars $/RSH1 Transportation2 Wages & Benefits 346,371,262$ 49.88$ 335,699,505$ 51.16$ (10,671,758)$ 1.28$ 3 Services 49,736 0.01 194,636 0.03 144,900 0.02 4 Materials & Supplies 213,796 0.03 188,933 0.03 (24,863) - 5 Training 5,955,578 0.86 4,369,360 0.67 (1,586,218) (0.19) 6 Control Center 8,235,987 1.19 7,721,927 1.18 (514,059) (0.01) 7 Scheduling & Planning 3,846,059 0.55 4,212,336 0.64 366,276 0.09 8 Field Supervision 9,295,823 1.34 10,597,709 1.62 1,301,886 0.28 9 Sub-Total 373,968,243 53.86 362,984,406 55.32 (10,983,836) 1.4610
11 Division Maintenance12 Wages & Benefits 121,895,412 17.55 117,691,256 17.94 (4,204,155) 0.38 13 Fuel 64,130,083 9.24 46,076,327 7.02 (18,053,756) (2.21) 14 Materials & Supplies 40,624,732 5.85 38,856,411 5.92 (1,768,321) 0.07 15 Fueling Contractor Reimb. (2,084,536) (0.30) (1,614,300) (0.25) 470,236 0.05 16 Services 187,009 0.03 156,113 0.02 (30,896) - 17 Sub-Total 224,752,700 32.37 201,165,807 30.66 (23,586,893) (1.71)18
19 RRC Regular Maintenance20 Wages & Benefits 13,166,527 1.90 12,242,155 1.87 (924,372) (0.03) 21 Materials & Supplies 4,241,763 0.61 4,287,401 0.65 45,638 0.04 22 Maintenance Services 195,026 0.03 188,758 0.03 (6,268) - 23 Sub-Total 17,603,316 2.54 16,718,314 2.55 (885,002) 0.0124
25 Other Maintenance26 Maintenance Support 12,868,790 1.85 14,494,826 2.21 1,626,036 0.36 27 Non-Revenue Vehicles 5,652,282 0.81 5,625,132 0.86 (27,150) 0.04 28 Facilities Maintenance 32,970,405 4.75 28,369,693 4.32 (4,600,712) (0.42) 29 Training 1,690,463 0.24 1,713,647 0.26 23,184 0.02 30 Sub-Total 53,181,940 7.66 50,203,298 7.65 (2,978,642) (0.01)31
32 Sub-Total Maintenance 295,537,956$ 42.56$ 268,087,419$ 40.86$ (27,450,537)$ (1.70)$
Notes:- RSH = Revenue Service Hour- Totals may not add due to rounding.
Activity Based Bus Cost Model
FY10 Budget FY11 Budget Inc/(Dec)

Los Angeles County Metropolitan Transportation Authority FY11 Budget
FY11 Budget Activity Based Bus Cost Model · 40
Activities Dollars $/RSH Dollars $/RSH Dollars $/RSH33 Other Operating Costs34 Transit Security 19,700,253 2.84$ 19,139,083$ 2.92$ (561,170)$ 0.08 35 Revenue 18,421,328 2.65 22,082,679 3.37 3,661,351 0.71 36 Service Development 10,385,785 1.50 11,098,995 1.69 713,210 0.20 37 Safety 1,402,702 0.20 2,942,103 0.45 1,539,401 0.25 38 Casualty & Liability 54,975,734 7.92 39,862,174 6.08 (15,113,560) (1.84) 39 Workers' Comp 40,269,961 5.80 39,086,701 5.96 (1,183,260) 0.16 40 Transitional Duty Program 2,185,490 0.31 1,147,059 0.17 (1,038,431) (0.14) 41 Utilities 9,357,139 1.35 10,638,918 1.62 1,281,779 0.27 42 Other Metro Operations 14,602,230 2.10 10,004,937 1.52 (4,597,293) (0.58) 43 Building Costs 11,187,899 1.61 15,529,436 2.37 4,341,537 0.76 44 Copy Services 877,716 0.13 745,587 0.11 (132,129) (0.01) 45 Sub-Total 183,366,237 26.41 172,277,672 26.26 (11,088,565) (0.15)46
47 Support Department Costs 51,810,511 7.46 49,412,441 7.53 (2,398,071) 0.0748
49 Total Local & Rapid 904,682,947 130.29 852,761,938 129.97 (51,921,009) (0.32)50 Revenue Service Hours 6,943,692 6,561,282 (382,410) 51
52 Purchased Transportation53 Contracted Service 44,053,228 79.46 44,078,893 80.25 25,665 0.79 54 Security 1,972,740 3.56 1,602,159 2.92 (370,581) (0.64) 55 Administration 952,766 1.72 990,927 1.80 38,162 0.09 56 Sub-Total 46,978,733 84.74 46,671,979 84.97 (306,754) 0.2457 Revenue Service Hours 554,419 549,254 (5,165) 58
59 Total Excluding Debt 951,661,680 126.92$ 899,433,917 126.49$ (52,227,763) (0.43)$ 60 Revenue Service Hours 7,498,111 7,110,536 (387,575) 61
62 Enterprise Fund Debt63 Principal 13,200,000 13,795,000 595,000 64 Interest 765,954 - (765,954) 65 Administration 9,500 10,000 500 66 Sub-Total 13,975,454 13,805,000 (170,454) 67
68 Total Cost 965,637,134$ 126.92$ 913,238,917$ 126.49$ (52,398,217)$ (0.43)$
FY10 Budget FY11 Budget Inc/(Dec)

Los Angeles County Metropolitan Transportation Authority FY11 Budget
41 Ÿ Activity Based Orange Line Cost Model FY11 Budget
Activity Based Orange Line Cost Model
Activities Dollars $/RSH Dollars $/RSH Dollars $/RSH1 Transportation2 Wages & Benefits 4,424,482$ 43.56$ 4,424,220$ 43.56$ (262)$ (0.00)$ 3 Control Center 279,019 2.75 100,746 0.99 (178,273) (1.76) 4 Sub-Total 4,703,502 46.31 4,524,966 44.55 (178,536) (1.76)5
6 Division Maintenance7 Wages & Benefits 1,847,913 18.20 1,819,363 17.91 (28,550) (0.28) 8 Fuel 1,195,320 11.77 887,513 8.74 (307,807) (3.03) 9 Materials & Supplies 1,401,283 13.80 1,019,106 10.03 (382,177) (3.76) 10 Fueling Contractor Reimb. - - 0.00 - 11 Sub-Total 4,444,516 43.76 3,725,982 36.69 (718,534) (7.07)12
13 Other Maintenance14 Facilities Maintenance 3,429,767 33.77 2,907,634 28.63 (522,133) (5.14) 15 Sub-Total 3,429,767 33.77 2,907,634 28.63 (522,133) (5.14)16
17 Sub-Total Maintenance 7,874,283 77.53 6,633,615 65.32 (1,240,668) (12.22)18
19 Other Operating Costs20 Transit Security 6,648,410 65.46 6,334,976 62.38 (313,434) (3.09) 21 Revenue 1,816,116 17.88 2,735,113 26.93 918,996 9.05 22 Safety - 80,655 0.79 80,655 NA23 Casualty & Liability 853,055 8.40 668,773 6.58 (184,282) (1.81) 24 Workers' Compensation 581,499 5.73 564,671 5.56 (16,828) (0.17) 25 Transitional Duty Program 19,863 0.20 17,877 0.18 (1,986) (0.02) 26 Utilities 44,307 0.44 206,197 2.03 161,890 1.59 27 Other Metro Operations 708,479 6.98 161,537 1.59 (546,942) (5.39) 28 Building Costs 200,609 1.98 273,983 2.70 73,374 0.72 29 Copy Services 15,720 0.15 13,342 0.13 (2,377) (0.02) 30 Sub-Total 10,888,058 107.21 11,057,124 108.87 169,066 1.6631
32 Support Department Costs 592,214 5.83 543,246 5.35 (48,968) (0.48)33
34 Total Cost 24,058,056$ 236.88$ 22,758,951$ 224.09$ (1,299,105)$ (12.79)$
35 Total Revenue Service Hours 101,561 101,561 -
Note: Totals may not add due to rounding.
FY10 Budget FY11 Budget Inc/(Dec)

Los Angeles County Metropolitan Transportation Authority FY11 Budget
FY11 Budget Activity Based Light Rail Cost Model · 42
Activity Based Light Rail Cost Model
Activities Dollars $/RSH Dollars $/RSH Dollars $/RSH1 Transportation2 Wages & Benefits 20,636,622 45.97$ $20,399,538 45.48$ (237,084)$ (0.49)$ 3 Materials & Supplies 101,461 0.23 97,756 0.22 (3,705) (0.0) 4 Other 73,034 0.16 67,939 0.15 (5,095) (0.01) 5 Operator Training 1,164,493 2.59 896,394 2.00 (268,099) (0.60) 6 Scheduling 351,112 0.78 153,363 0.34 (197,749) (0.44) 7 Control Center 5,215,444 11.62 5,246,377 11.70 30,933 0.088 Sub-Total 27,542,166 61.35 26,861,368 59.89 (680,798) (1.47)9
10 Maintenance11 Vehicle Maintenance12 Wages & Benefits 22,839,508 50.88 22,219,989 49.54 (619,519) (1.34) 13 Materials & Supplies 6,694,279 14.91 6,144,549 13.70 (549,730) (1.21) 14 Other 8,429 0.02 8,429 0.02 - - 15 Services 6,005 0.01 10,005 0.02 4,000 0.01 16 Sub-Total 29,548,221 65.82 28,382,972 63.28 (1,165,249) (2.54)17
18 Wayside Maintenance 19 Wages & Benefits 22,037,741 49.09 21,772,794 48.54 (264,948) (0.55) 20 Materials & Supplies 2,543,846 5.67 2,472,897 5.51 (70,949) (0.15) 21 Services 1,763,699 3.93 1,680,886 3.75 (82,813) (0.18) 22 Propulsion Power 15,349,743 34.19 14,965,715 33.37 (384,028) (0.83) 23 Other 16,087 0.04 15,362 0.03 (725) - 24 Sub-Total 41,711,116 92.92 40,907,654 91.20 (803,463) (1.71)25
26 Other Maintenance27 Non-Revenue Vehicles 901,152 2.01 947,092 2.11 45,939 0.10 28 Facilities Maintenance 5,109,520 11.38 3,948,402 8.80 (1,161,118) (2.58) 29 Sub-Total 6,010,673 13.39 4,895,494 10.91 (1,115,179) (2.47)30
31 Sub-Total Maintenance 77,270,010 172.13 74,186,120 165.40 (3,083,890) (6.73)32
33 Other Operating Costs34 Transit Security 33,254,460 74.08 31,610,361 70.47 (1,644,099) (3.60) 35 General Manager 1,088,639 2.43 836,734 1.87 (251,904) (0.56) 36 Revenue 7,543,995 16.80 9,483,022 21.14 1,939,027 4.34 37 Service Development 1,422,850 3.17 117,923 0.26 (1,304,926) (2.91) 38 Safety 2,023,032 4.51 2,437,652 5.43 414,620 0.93 39 Casualty & Liability 2,971,141 6.62 2,250,827 5.02 (720,314) (1.60) 40 Workers' Comp 3,185,682 7.10 3,262,753 7.27 77,071 0.18 41 Utilities 1,329,036 2.96 1,051,568 2.34 (277,468) (0.62) 42 Other Metro Operations 315,674 0.70 84,720 0.19 (230,953) (0.51) 43 Building Costs 2,020,921 4.50 2,950,059 6.58 929,138 2.08 44 Copy Services 167,538 0.37 143,563 0.32 (23,975) (0.05) 45 Sub-Total 55,322,967 123.24 54,229,183 120.90 (1,093,784) (2.33)46
47 Support Department Costs 13,562,836 30.21 13,059,080 29.11 (503,756) (1.10)48
49 Total Cost 173,697,980$ 386.93$ 168,335,751$ 375.30$ (5,362,228)$ (11.63)$
50 Total Revenue Service Hours 448,915 448,536 (379)
Note: Totals may not add due to rounding.
FY10 Budget FY11 Budget Inc/(Dec)

Los Angeles County Metropolitan Transportation Authority FY11 Budget
43 Ÿ Activity Based Heavy Rail Cost Model FY11 Budget
Activity Based Heavy Rail Cost Model
Activities Dollars $/RSH Dollars $/RSH Dollars $/RSH1 Transportation2 Wages & Benefits 7,749,174$ 30.14$ 7,504,923$ 29.17$ (244,251)$ (0.97)$ 3 Materials & Supplies 33,797 0.13 33,797 0.13 - - 4 Other 6,058 0.02 6,058 0.02 - - 5 Control Center 1,663,320 6.47 1,659,169 6.45 (4,151) (0.02)6 Scheduling 73,957 0.29 50,160 0.19 (23,797) (0.09)7 Training 365,829 1.42 307,466 1.19 (58,362) (0.23)8 Sub-Total 9,892,135 38.47 9,561,574 37.16 (330,561) (1.31)9
10 Maintenance11 Vehicle Maintenance12 Wages & Benefits 11,526,946 44.83 11,594,102 45.06 67,156 0.23 13 Materials & Supplies 3,184,500 12.38 3,103,380 12.06 (81,120) (0.32) 14 Services 75,000 0.29 63,000 0.24 (12,000) (0.05) 15 Other 7,604 0.03 5,804 0.02 (1,800) (0.01) 16 Sub-Total 14,794,050 57.54 14,766,286 57.39 (27,764) (0.15)17
18 Wayside Maintenance 19 Wages & Benefits 14,776,950 57.47 14,716,906 57.20 (60,044) (0.27) 20 Materials & Supplies 1,167,130 4.54 1,167,130 4.54 - - 21 Services 1,645,962 6.40 1,645,962 6.40 - - 22 Propulsion Power 8,884,635 34.55 8,884,635 34.53 - (0.02) 23 Other 7,384 0.03 7,384 0.03 - - 24 Sub-Total 26,482,061 102.99 26,422,016 102.69 (60,044) (0.31)25
26 Other Maintenance27 Non-Revenue Vehicles 339,766 1.32 328,343 1.28 (11,423) (0.05) 28 Facilities Maintenance 5,427,823 21.11 5,493,689 21.35 65,866 0.24 29 Sub-Total 5,767,589 22.43 5,822,032 22.63 54,443 0.2030
31 Sub-Total Maintenance 47,043,700 182.96 47,010,335 182.70 (33,366) (0.26)32
33 Other Operating Costs34 Transit Security 18,028,085 70.11 16,845,604 65.47 (1,182,480) (4.65) 35 General Manager 475,174 1.85 392,143 1.52 (83,031) (0.32) 36 Revenue 2,594,875 10.09 3,855,491 14.98 1,260,616 4.89 37 Service Development 368,281 1.43 38,079 0.15 (330,201) (1.28) 38 Safety 490,457 1.91 468,400 1.82 (22,057) (0.09) 39 Casualty & Liability 2,478,090 9.64 1,616,012 6.28 (862,078) (3.36) 40 Workers' Comp 1,531,000 5.95 1,597,363 6.21 66,363 0.25 41 Utilities 508,822 1.98 692,970 2.69 184,149 0.71 42 Other Metro Operations 169,198 0.66 71,451 0.28 (97,747) (0.38) 43 Building Costs 967,175 3.76 1,466,516 5.70 499,341 1.94 44 Copy Services 79,859 0.31 66,097 0.26 (13,763) (0.04) 45 Sub-Total 27,691,015 107.69 27,110,126 105.36 (580,888) (2.33)46
47 Support Department Costs 5,877,748 22.86 5,236,568 20.35 (641,180) (2.51)48
49 Total Cost 90,504,598$ 351.98$ 88,918,603$ 345.57$ (1,585,995)$ (6.41)$ 50 Total Revenue Service Hours 257,128 257,310 182
Note: Totals may not add due to rounding.
FY10 Budget FY11 Budget Inc/(Dec)

Los Angeles County Metropolitan Transportation Authority FY11 Budget
FY11 Budget · 44
This page was intentionally left blank.

Los Angeles County Metropolitan Transportation Authority FY11 Budget
45 Ÿ Legally Separate Entities FY11 Budget
Legally Separate Entities Public Transportation Services Corporation
Public Transportation Services Corporation (PTSC) is a nonprofit public benefit corporation. PTSC was created in December 1996 in order to transfer certain functions performed by the LACMTA, and the employees related to those functions, to this new corporation. The PTSC conducts essential public transportation activities including: planning; programs funds for transportation projects within Los Angeles
County; construction; provides certain business services to the County’s Service Authority for Freeway Emergencies (SAFE) and the Southern California Regional Rail Authority (SCRRA); and provides security services to the operation of the Metro Bus and Rail systems. PTSC allows the employees of the corporation to participate in the California Public Employees Retirement System (PERS)
Statement of Revenues, Expenses and Changes in Retained EarningsFor The Years Ending June 30, 2010 and 2011.
FY10 FY11PTSC Only ($ in millions) Budget Budget
1 Revenue 228.5$ 209.4$ 2 Expenses 228.5 209.4 3 Increase(decrease) in retained earnings - - 4 Retained earnings - beginning of year - - 5 Retained earnings - end of year -$ -$
Note: Totals may not add due to rounding. ____________________________________________________________________________________
Exposition Metro Line Construction Authority
The Exposition Metro Line Construction Authority was created by the State Legislature under Public Utilities Code Section 132600, et seq. for the purpose of awarding and overseeing final design and construction contracts for
completion of the Los Angeles-Exposition Metro Light Rail project from the Metro Rail Station at 7th Street and Flower Street in the City of Los Angeles to downtown Santa Monica.
Statement of Revenues, Expenditures and Changes in Fund BalancesFor The Years Ending June 30, 2010 and 2011.
Exposition Metro Line Construction FY10 FY11Authority ($ in millions) Budget Budget
1 Revenue 221.6$ 304.4$ 2 Expenditures 221.6 304.4 3 Increase(decrease) in retained earnings - - 4 Retained earnings - beginning of year - - 5 Retained earnings - end of year -$ -$
Notes:- FY11 Budget is composed of Phase I $111.3 million and Phase II $193.1 million. - Funding for all Exposition projects is provided by Metro.- Totals may not add due to rounding.
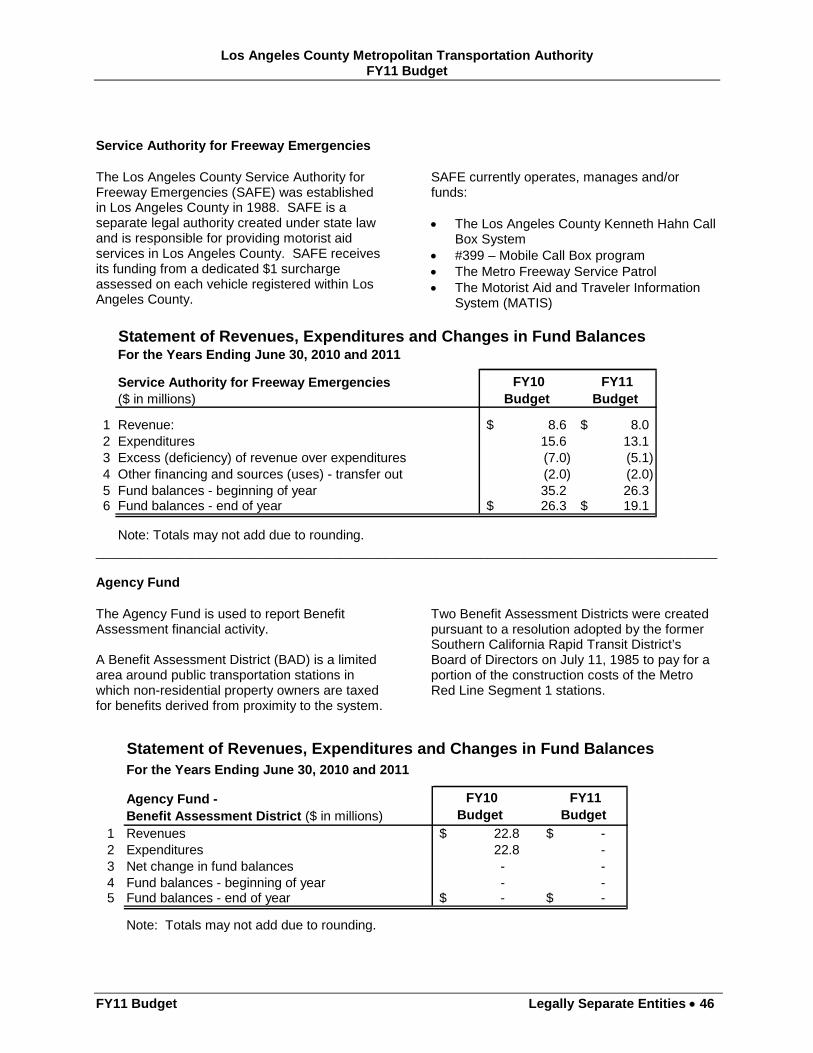
Los Angeles County Metropolitan Transportation Authority FY11 Budget
FY11 Budget Legally Separate Entities · 46
Service Authority for Freeway Emergencies
The Los Angeles County Service Authority for Freeway Emergencies (SAFE) was established in Los Angeles County in 1988. SAFE is a separate legal authority created under state law and is responsible for providing motorist aid services in Los Angeles County. SAFE receives its funding from a dedicated $1 surcharge assessed on each vehicle registered within Los Angeles County.
SAFE currently operates, manages and/or funds: · The Los Angeles County Kenneth Hahn Call
Box System · #399 – Mobile Call Box program · The Metro Freeway Service Patrol · The Motorist Aid and Traveler Information
System (MATIS)
Statement of Revenues, Expenditures and Changes in Fund Balances For the Years Ending June 30, 2010 and 2011
FY10Budget
FY11 Budget
1 Revenue: 8.6$ 8.0$ 2 Expenditures 15.6 13.1 3 Excess (deficiency) of revenue over expenditures (7.0) (5.1) 4 Other financing and sources (uses) - transfer out (2.0) (2.0) 5 Fund balances - beginning of year 35.2 26.3 6 Fund balances - end of year 26.3$ 19.1$
Note: Totals may not add due to rounding.
Service Authority for Freeway Emergencies ($ in millions)
____________________________________________________________________________________ Agency Fund
The Agency Fund is used to report Benefit Assessment financial activity. A Benefit Assessment District (BAD) is a limited area around public transportation stations in which non-residential property owners are taxed for benefits derived from proximity to the system.
Two Benefit Assessment Districts were created pursuant to a resolution adopted by the former Southern California Rapid Transit District’s Board of Directors on July 11, 1985 to pay for a portion of the construction costs of the Metro Red Line Segment 1 stations.
Statement of Revenues, Expenditures and Changes in Fund Balances For the Years Ending June 30, 2010 and 2011
FY10Budget
FY11 Budget
1 Revenues 22.8$ -$ 2 Expenditures 22.8 - 3 Net change in fund balances - - 4 Fund balances - beginning of year - - 5 Fund balances - end of year -$ -$
Note: Totals may not add due to rounding.
Agency Fund - Benefit Assessment District ($ in millions)

Los Angeles County Metropolitan Transportation Authority FY11 Budget
47 Ÿ FY11 Budget
This page was intentionally left blank.

