lost in translation? the effect of cultural …...lost in translation? the effect of cultural values...
TRANSCRIPT

LOST IN TRANSLATION? THE EFFECT OF CULTURAL VALUES ON
MERGERS AROUND THE WORLD
KENNETH R. AHERNa, DANIELE DAMINELLIb, AND CESARE FRACASSIc
Abstract
We find strong evidence that three key dimensions of national culture (trust, hierarchy, and individualism)
affect merger volume, synergy gains, deal structure, and the division of gains between bidders and targets in
international mergers. First, the volume and combined gains of domestic mergers are significantly higher in
countries where people are more trusting of others. Second, the volume and gains of cross-border mergers
are lower when countries are more culturally distant. Third, firms from countries that are more trusting and
hierarchical capture a larger share of combined merger gains. Finally, the use of termination fees, tender
offers, and the form of payment vary systematically by cultural differences.
First draft: 15 November 2009
This version: 17 July 2010
Keywords: Mergers & Acquisitions, Culture, International, Cross-border, Bargaining
JEL Classifications: G34, M14, Z1
We thank Sreedhar Bharath, Jonathan Carmel, John Griffin, Antonio Macias, Pedro Matos, Paige Ouimet, Amiy-atosh Purnanandam, Uday Rajan, Denis Sosyura, Laura Starks, Mike Stegemoller, Sheridan Titman, Yuhai Xuan,Yishay Yafeh, and seminar participants at the University of Michigan and the University of Texas-Austin for helpfulcomments.a University of Michigan, Ross School of Business, 701 Tappan Street, Ann Arbor MI 48109-1234. Telephone: (734)764-3196. E-mail: [email protected] Politecnico di Milano, Department of Management, Economics, and Industrial Engineering, Via Lambruschini 4,20156 Milan, Italy; Telephone: +39 0223992805; E-mail: [email protected] University of Texas at Austin, McCombs School of Business, 1 University Station B6600, Austin TX 78712. Tele-phone: (512) 232-6843. E-mail: [email protected] .

Lost in Translation? The Effect of Cultural Values on Mergers Around the World
Abstract
We find strong evidence that three key dimensions of national culture (trust, hierarchy, and individualism)
affect merger volume, synergy gains, deal structure, and the division of gains between bidders and targets in
international mergers. First, the volume and combined gains of domestic mergers are significantly higher in
countries where people are more trusting of others. Second, the volume and gains of cross-border mergers
are lower when countries are more culturally distant. Third, firms from countries that are more trusting and
hierarchical capture a larger share of combined merger gains. Finally, the use of termination fees, tender
offers, and the form of payment vary systematically by cultural differences.

LOST IN TRANSLATION? CULTURAL VALUES AND MERGERS 1
Though the vast majority of research on mergers and acquisitions focuses on domestic mergers
in the U.S., recent research documents that international mergers (both cross-border and domestic
mergers in foreign countries) differ in systematic ways from U.S. mergers. Rossi and Volpin (2004)
show that countries with less transparent accounting standards and weaker shareholder-rights laws
have less active domestic merger markets. Research also shows that a country’s legal system affects
acquirer gains and target premiums in international mergers (Moeller and Schlingemann, 2005;
Bris and Cabolis, 2008; Chari, Ouimet, and Tesar, 2010). Other research shows that cross-border
mergers are facilitated by institutional investors (Ferreira, Massa, and Matos, 2010), but inhibited
by protectionist governments (Dinc and Erel, 2010). Understanding how international forces affect
mergers has become especially important recently — the number of cross-border mergers has almost
doubled in the last decade, from 23 percent of total mergers in 1998 to 45 percent in 2007 (Erel,
Liao, and Weisbach, 2009).
In this paper, we study how a completely different force affects mergers: national cultural values.
Though culture has been shown to influence economic decision-making in many contexts (Guiso,
Sapienza, and Zingales, 2006), little is known about its impact on mergers. We measure cultural
values along the three dimensions most commonly identified in sociology and economics: 1. Trust
versus Distrust (whether people believe that others can be trusted); 2. Hierarchy versus Egalitari-
anism (whether people believe they should follow the rules dictated by higher authorities); and 3.
Individualism versus Collectivism (whether people believe they should sacrifice personal gains for
the greater good of all). In a large sample of mergers from 52 countries between 1991 and 2008,
we find that culture is a critical determinant of mergers across a variety of dimensions, including
where mergers occur, how deals are structured, the amount of value they create, and how the gains
are divided between the bidder and the target.
We first provide evidence that culture has a significant impact on domestic mergers. There are
various reasons why this may be so, though we note that there exists no formal theoretical research
to guide our investigation. One possibility is that firms in collectivist countries may be more willing
to merge than firms in individualistic countries, since collectivist people believe in working towards
a common good, rather than individual goals. In addition, the cost of post-merger integration may
be reduced when employees have collectivist, rather than individualistic, values, which increases

2 LOST IN TRANSLATION? CULTURAL VALUES AND MERGERS
the net synergy gains. Likewise, if trust facilitates trade as suggested by Arrow (1972), then
mergers may be more common and create more value in countries where people are more trusting
of others. Alternatively, mergers may be less common if greater trust or collectivism allow arms-
length contracts, rather than the necessity of a formal merger. We find evidence consistent with
the first explanation. Controlling for a host of country-level variables, we find significantly more
domestic mergers in countries that are more trusting of others and in more collectivist countries. In
addition, the average three-day abnormal bidder-target combined announcement return in domestic
mergers is about 0.73 percentage points higher for a one standard deviation increase in trustfulness.
This is a sizable difference, considering the average combined return in domestic mergers is 1.85
percent and the median is 1.16 percent. Though combined announcement returns are not a perfect
proxy for value changes, these results suggest that culture has an important impact on the synergy
gains in mergers.
Second, we investigate the role of cultural differences on the volume and gains in cross-border
mergers. We find evidence consistent with the idea that cultural distance produces frictions be-
tween merging firms, just as geographic distance produces frictions in corporate decisions (Uysal,
Kedia, and Panchapagesan, 2008; Landier, Nair, and Wulf, 2009). In particular, cultural differences
between firms are likely to inhibit the post-merger coordination and cooperation that is necessary
to realize synergy gains. We find that the greater is the cultural distance between two countries
along the dimensions of hierarchy and individualism, the fewer are the number of cross-border
mergers. In contrast, as long as one of two countries has a high level of trust, there are signifi-
cantly more cross-border mergers between the two countries. Greater cultural distance also leads
to lower combined announcement returns. Moving from the 25th percentile of distance in individ-
ualism to the 75th percentile leads to a reduction in combined gains of more than one percentage
point (−1.11%), compared to an average gain of 3.46 percent and a median gain of 2.10 percent in
cross-border mergers. Thus cultural differences have substantial economic impacts on cross-border
mergers.
We next investigate the role of national culture on the division of merger gains in cross-border
deals. The division of merger gains has received less attention in prior research than the separate

LOST IN TRANSLATION? CULTURAL VALUES AND MERGERS 3
gains to targets and acquirers, but it is of primary importance for each firm involved.1 We suggest
that culture may affect the division of gains in multiple ways. First, a cynical view is that being
trustful will lead to a smaller share of the gains if a trading partner can take advantage of one’s
trust. In contrast, trust may engender reciprocity, where a trading partner may reward trust by
sharing more of the gains (Berg, Dickhaut, and McCabe (1995) presents experimental evidence
consistent with this hypothesis). Second, firms that are more individualistic may capture more
gains than firms that are more collectivist, since collectivist firms are more willing to sacrifice
individual benefits to maximize combined gains. Third, egalitarian firms may wish to share the
gains equally, whereas hierarchical firms believe that one firm should capture most of the gains. We
do not claim to present an exhaustive list of explanations. Instead, we emphasize that empirical
evidence that is consistent with any possible explanation would be important, since it would be the
first evidence that cultural differences affect bargaining outcomes in mergers.
We find strong evidence that cultural differences do, in fact, have a strong impact on the division
of merger gains. First, an acquirer’s gain relative to the target’s gain is larger when the acquirer
is from a country with a higher level of trust relative to the target. A change from the 25th to
the 75th percentile of the difference in trustfulness leads to an acquirer capturing an additional 1.7
percent of combined acquirer and target pre-merger market value. This is a substantial amount,
compared to the mean of −3.4 and median of −2.2. In dollar terms, this additional gain is about
$118 million for an average acquirer and target. This result is consistent with the experimental
findings where greater trust leads to a larger share of the gains. Second, an acquirer from a country
with a high level of hierarchy, relative to the target, captures more of the gains of the merger than
if the acquirer was from a country with a high level of egalitarianism. This is consistent with our
conjecture that target firms in egalitarian cultures are more willing to share gains with acquirers.
Since national culture affects bargaining outcomes, it is likely that it also affects deal structure
in cross-border mergers. In the last part of the paper we explore this hypothesis for three aspects
of the structure of a merger: form of payment, the use of target termination fees, and whether the
deal is structured as a tender offer. In logit regressions, we find that mergers are more likely paid in
cash, rather than stock, when the target is less trusting and more hierarchical and individualistic.
1See Ahern (2009) for recent evidence on the division of merger gains.

4 LOST IN TRANSLATION? CULTURAL VALUES AND MERGERS
Our intuition is that a target firm that has less trust in others will avoid the uncertainty of acquirer
stock as payment, but egalitarian and collectivist targets are more willing to share the risks of
the acquirer by accepting stock as a payment. Second, we find that targets are more likely to
have termination fees when they are more hierarchical and individualistic. This possibly reflects
that informal relations may substitute for formal contracts in egalitarian and collectivist countries.
Finally, when acquirers are more trusting and less hierarchical than targets, they are more likely
to negotiate with management, rather than make a tender offer. Again, this may reflect that in
trusting and egalitarian countries, informal negotiations are preferred to formal offers. As before,
we do not claim that these explanations are the only possible explanations, but rather, we believe
that the biggest contribution of the paper is to simply document the prevalent effects of cultural
values on many dimensions of merger negotiations.
Our results are robust to a multitude of country-level and deal-specific control variables, as well
as important sample filters. In particular, in our main specifications, we use cultural value measures
from the World Value Survey, a standard data source in the literature, which we describe in detail
in Section II. However, we also find similar results if we use the alternative measures of cultural
values developed in Hofstede (1980, 2001) or in Schwartz (1994). Second, since U.S. firms account
for a large number of mergers, we exclude all U.S. firms from our sample in robustness tests. Our
qualitative results are unchanged. Finally, one may argue that our results are driven by cultural
differences in investor responses, rather than real merger effects. We address this criticism in two
ways. First, we document that national culture affects the actual incidence of mergers as well as
observed deal structures, not only the market responses to merger announcements. Second, we
investigate the effects of national culture on long-run stock market returns. We do not find any
evidence that changes our prior conclusions.
To the best of our knowledge, this is the first comprehensive study of the effect of national
culture on merger outcomes. The richness of data on mergers allows us to study culture’s influence
on the gains from trade, the division of gains between the firms, and the structure of the deal,
rather than just the volume of cross-border trade. Other research has investigated the role of
culture in economics. Barr et al. (2009), Oosterbeek, Sloof, and Van de Kuilen (2004), Brett et al.
(1998), and Adair et al. (2004) run experiments using participants from many different cultures

LOST IN TRANSLATION? CULTURAL VALUES AND MERGERS 5
and find evidence that deep-seated values of fairness, trust, and individualism affect fundamental
economic decisions. Evidence from non-experimental settings also confirms the importance of
culture on economic decision-making: real and financial cross-border investment flows are larger
when countries have greater bilateral trust (Guiso, Sapienza, and Zingales, 2009a), stock price
momentum is greater in countries where individualism is higher (Chui, Titman, and Wei, 2009),
countries where people are more trusting have greater stock market participation (Guiso, Sapienza,
and Zingales, 2009b), national culture is related to risk-taking by firms (Griffin, Li, Yue, and Zhao,
2009), and interest rates are lower when borrowers share common cultural values with lenders
(Giannetti and Yafeh, 2009).
The rest of this paper is organized as follows. Section I describes the three dimensions of
cultural values studied in this paper and develops empirical predictions. Section II describes the
data used in this paper and documents the prevalence of international mergers. In Section III, we
present empirical tests of the effect of culture on merger volumes and combined returns. Section IV
presents empirical results on the division of merger gains and deal structures. Robustness checks
are presented in Section V. Section VI presents concluding remarks.
I. Theory and Hypotheses
Following Guiso, Sapienza, and Zingales (2006), we define culture as, “those customary beliefs
and values that ethnic, religious, and social groups transmit fairly unchanged from generation to
generation.” We are careful to differentiate our notion of national culture from corporate culture.
Weber, Shenkar, and Raveh (1996) present evidence that national culture is defined by deep-held
values, whereas corporate culture is defined by a set of operational practices. Since operating
practices are less rigid than are values, Weber et al. argue that differences in national culture will
impose a greater impediment to realizing synergy gains in mergers than will corporate culture.
Using survey responses from CEOs, they find that national cultural differences predict stress,
negative attitudes towards the merger, and lack of cooperation better than do corporate cultural
differences.
We expect that the national cultural differences between firms will impact the surplus created
from trade and the negotiation of the trade. To realize synergy gains in a merger, the combined

6 LOST IN TRANSLATION? CULTURAL VALUES AND MERGERS
firm must be able to lower costs or increase revenue. Lowering costs typically involves firing workers
or greater coordination between firms, whereas revenue synergies are generated by the fusion of
knowledge capital. In either case, the employees of the two firms must work together. If they do
not share common cultural values, communication and coordination will be inhibited.
Second, there is a large amount of experimental evidence that cultural differences impede bar-
gaining (Brett et al., 1998; Adair et al., 2004; Metcalf et al., 2007). When CEOs do not use the
same methods to communicate, have different social norms, or have differing concepts of time,
truthfulness, or success, then negotiation is more likely to break down. In addition, it is plausible
that differing cultural values will affect the division of gains. We are unaware of any prior research
that tests this relationship, but we argue below why we think culture will affect the division of
gains between firms.
Since not all beliefs and values would be expected to affect economic decisions, we focus on
three values that prior research in economics, psychology, sociology, and negotiation studies has
identified as important dimensions of culture: trust, hierarchy, and individualism. First, trust
has been studied extensively in finance and economics in various contexts (see Guiso, Sapienza,
and Zingales (2006) for references). Second, though the particular dimensions used in cultural
classification systems tend to be idiosyncratic, both hierarchy and individualism are shared by
the most widely cited classifications, with only minor variations. In particular, hierarchy and
individualism are the only two dimensions common to the five-dimension classification system of
Hofstede (1980, 2001), the three dimension system of Schwartz (1994), the seven dimension system
of Trompenaars (1993), and the four dimension system of Fiske (1991). Thus, there is a large
literature that suggests that these three dimensions are central to understanding cultural values.
In the following section, we describe our measures of national culture in detail.
A. Trust versus Distrust
Trust is the dependence on another to fulfill an implicit or explicit obligation. As far back
as Arrow (1972), economics scholars have recognized that trust facilitates trade.2 In economic
transactions characterized by uncertainty, trust is the confidence that a counter-party will fulfill
2See Carlin, Dorobantu, and Viswanathan (2009) for a recent theoretical model that incorporates trust.

LOST IN TRANSLATION? CULTURAL VALUES AND MERGERS 7
her side of the deal. In addition, trust may substitute or complement legal statutes that govern
transactions. This is particularly relevant for cross-border mergers where accurate valuations are
unlikely and where post-merger integration will require non-contractible effort by both firms.
One argument is that cultures that have greater amounts of trust in others will have more active
domestic merger markets since trust facilitates trade. The total gains from mergers are also likely
to be higher when cultures have higher levels of trust because trust may enable firms to realize
synergies. If firms are distrustful of others on average, integration may be more difficult and hence
total gains will be lower. A counter-argument is that mergers are likely to be observed when
arms-length trading relations break down. The theories of transaction cost economics (Williamson,
1975, 1979, 1985) and the property rights theory of the firm (Grossman and Hart, 1986; Hart and
Moore, 1990; Hart, 1995) predict that if the costs of incomplete contracts are too high, assets will
be organized under common ownership to reduce hold-up and underinvestment problems. Thus
if trust substitutes for written contracts, we may observe more mergers that produce more value
where people are less trusting of others.
In cross-border mergers, we start from the finding in Guiso, Sapienza, and Zingales (2009a), that
greater bilateral trust increases FDI flows. We do not have measures of bilateral trust, but we
expect that the aggregate trust levels of country-pairs will be positively related to the volume of
cross-border mergers between two countries. As long as one of the parties trusts the other, then
mergers will be consummated. For the same reason, we also expect that combined returns will be
larger when there is greater aggregate trust. Even if one firm has relatively less trust than the
other, a higher level of trust in the other firm is likely to alleviate integration problems.
Trust is also likely to affect the division of gains in mergers, though for various and possibly
conflicting reasons. Butler, Giuliano, and Guiso (2009) find evidence that individuals who have the
‘right amount of trust’ have higher incomes. The right amount of trust for an individual is equal
to the median level of trust within the local economy: those who trust others too much get taken
advantage of; those who do not trust others enough forego good opportunities. This argument
predicts that a firm from a country with high levels of trust, relative to the merger partner, will
capture a smaller percentage of the total gains since it is more likely to be deceived by its merger
partner. An alternative hypothesis is that trust engenders reciprocity. In experiments of the trust

8 LOST IN TRANSLATION? CULTURAL VALUES AND MERGERS
game, kind behavior is rewarded by a kind response (Berg, Dickhaut, and McCabe, 1995). Thus,
firms that exhibit more trust may receive a larger share of the gains.
If trust affects the outcomes in mergers, it will likely affect how mergers are structured as well.
In particular, if trust reduces the perceived uncertainty about a deal, stock payments may be more
common when targets are more trusting. In contrast, if targets are less trusting, they may demand
cash as payment. Similarly, if acquirers are more trusting, they may be less likely to use target
termination fees, as trust may substitute for formal written contracts. It is also likely that less
trustful acquirers may make direct tender offers to target shareholders, rather than negotiate with
target management.
B. Hierarchy versus Egalitarianism
Egalitarian cultures rank the importance and social power of all members relatively equally,
whereas hierarchical cultures delineate members into multiple vertical ranks of power. In hier-
archical cultures, members from lower ranks defer to higher ranked members, who in turn have
an obligation to ensure that the needs of lower ranked members are satisfied. When two equally
ranked members disagree, they allow a higher ranked member to arbitrate. In a firm, this means
that workers are more likely to follow instructions from superiors in hierarchical cultures. Egalitar-
ian cultures, in contrast, are not likely to assign bargaining power solely by social status, but rather
to rely on the outside options available to each agent. This means that bargaining power is tem-
porary and case-specific in egalitarian cultures, as opposed to permanent in hierarchical societies
(Brett and Okumura, 1998).
Since egalitarian cultures do not differentiate based solely on social status, there may be more
opportunities for mergers in egalitarian cultures than hierarchical cultures, where only higher-status
firms would initiate mergers. However, a strong hierarchical structure may make post-integration
less costly than if both firms regarded themselves as equals. Hence, mergers may be more likely in
hierarchical societies.
In cross-cultural mergers, as before, we expect that differences in culture will reduce the total
volume of mergers, as well as the combined gains from mergers, since cultural differences may
impede post-merger integration. It is not clear how cultural differences in egalitarianism will affect

LOST IN TRANSLATION? CULTURAL VALUES AND MERGERS 9
bargaining positions since the social status rankings of hierarchical cultures may not extend across
borders. This means that a low ranked firm in a local hierarchy may not regard a foreign merger
partner as higher-ranked since it is not in the same culture.
Hierarchy may also affect the prevalence of certain deal characteristics. If targets are more
egalitarian, and hence less likely to follow the orders of the acquirer’s management post-merger,
then stock payments may be needed to give incentives to the target’s largest employee-shareholders.
Since more hierarchical countries believe economic incentives are important, termination fees may
be more likely used in order to provide an incentive to complete a merger. Finally, hierarchy may
affect whether mergers are completed through negotiation or tender offers.
C. Individualism versus Collectivism
A society may view individuals as autonomous or as members of a larger social group. In
societies where individualism is the norm, individual-level accomplishments are rewarded and goals
are independent of the overall society’s goals. In economic settings, in particular, it is accepted
and expected that agents will seek to maximize their self-interest, without regard to the well-being
of society-at-large. In contrast, collectivist cultures emphasize group goals, and the aspirations
of individuals are tied to social obligations. It is expected that individuals will sacrifice personal
self-interest for the benefit of the group (Brett and Okumura, 1998; Brett, 2000). As with other
cultural values, there is little theoretical research in economics that tries to understand the role of
individualism. A recent exception is Tabellini (2008), which models the trade-off between following
economic incentives and following collective values.
If collectivist cultures value overall benefits, domestic mergers in these markets may produce
greater gains since integration frictions will be less. Mergers in individualistic cultures, in contrast,
may create more costs as employees from each firm try to assert their own goals without regard
for the other. At the same time, mergers may be more likely in individualistic societies since arms-
length contracting is a poor substitute due to greater hold-up costs and opportunistic renegotiation,
as discussed above.
In cross-border mergers, we expect that firms from countries that differ in individualism are less
likely to merge. When they do merge, we expect that the combined gains will be smaller since

10 LOST IN TRANSLATION? CULTURAL VALUES AND MERGERS
cultural frictions will impede integration. In terms of bargaining, the naıve expectation is that
firms from more individualistic nations will capture a larger share of the gains when merging with
firms from more collectivist nations. Collectivist cultures will be more likely to sacrifice personal
gains for the benefit of overall gains. However, collectivism is group-specific. If the firm with
collectivist values does not consider the merger partner to be part of its group, it may resist the
merger and reduce the overall gains. Indeed, collectivist cultures are more attuned to identities of
group-membership than individualistic cultures (Brett, 2000).
Individualism may also affect how mergers are structured. It is possible that mergers of more
collectivist firms will be more likely to use stock as payment, rather than cash, in order to share
risk. Collectivist firms may also be more likely to negotiate mergers, rather than use tender offers,
which are typically more hostile. We reiterate that these are simply conjectures and we do not
claim that our explanations are exhaustive. Instead, we simply wish to provide some rationale for
why we may observe an empirical relationship between national culture and mergers.
II. Data Sources
A. Merger Data
For our tests of aggregate domestic and cross-border merger activity, we start with as large
a sample of mergers as possible, which due to constraints on other variables will be reduced in
subsequent tests. Our initial sample includes all completed mergers from SDC Platinum database
valued at $1 million or more from 1985 through 2008 where more than 50% of the target is acquired.
We place no restrictions on the public status of the acquirer or target, which means we include
public, private, and subsidiary acquirers and targets, though government entities are excluded.
Since private firms account for the majority of merger targets, this sampling procedure provides a
much more complete sample than is typically used in merger studies. For each deal we record the
form of payment, the industry classifications of the acquirer and target, the attitude of the deal
(friendly/hostile), and other deal-specific information from SDC.
The data filter yields a sample of 127,950 mergers, of which 30,907 are cross border deals, and
65,796 do not include a U.S. acquirer or target. A detailed cross-country matrix of the thirty nations

LOST IN TRANSLATION? CULTURAL VALUES AND MERGERS 11
with the most firms that are acquired is presented in Table I. The top five target nations (including
domestic deals) are the U.S. (55,407 targets), the U.K. (21,689), Canada (6,752), Australia (6,128),
and Japan (3,513). The U.S. is the leader by far and there is a sharp dropoff in merger activity
for the next most active market. Sweden, the tenth largest nation by targets had 1,688 deals over
1985 to 2008, which is less than half as many as Japan, the fifth largest, and only three percent of
the U.S.’s total.
Figure 1 presents a map of worldwide merger activity for the 20 largest domestic markets to
illustrate the complexity of international merger relations. The size of each country’s abbreviation
is proportional to the number of domestic mergers and the size of the arrows connecting countries
is proportional to their cross-border merger activity over 1985 to 2008. The visualization is taken
directly from the data, with the exception of the U.S., which is scaled by half and is still the largest
domestic market. This picture reveals a complex network of cross-border merger flows where
trading partners are clearly not random. For instance, both the U.S. and Canada, and the U.S.
and the U.K., have strong cross-border merger ties, but Canada and the U.K. have relatively few
cross-border deals. In addition, some of the largest domestic markets have few cross-border mergers.
Japan is the most notable example, but Australia, and Malaysia are similarly isolated. The last row
in Table I reports the percentage of foreign-made acquisitions in each of the forty top nations. Less
than six percent of acquisitions of Japanese companies are made by non-Japanese firms, compared
to 24 percent for the entire world. In contrast, over two-thirds of acquisitions are made by foreign
acquirers in Germany, the seventh largest target nation. Clearly cultural differences are not the
only reason that some countries have few cross-border mergers, as the geographic isolation of island
nations, such as Japan and Australia, are likely important as well.
Though the U.S. has dominated worldwide activity on average over the 24 year period, foreign
acquisitions have gained substantially in numbers relative to the U.S. over time. Figure 2 presents
the time series of the numbers of domestic and cross-border mergers by country. In 1985, almost all
domestic mergers worldwide occurred in the U.S.. Through the 1990s, other nations experienced
increased domestic merger activity, notably the U.K.. However, since 1998 the number of domestic
mergers in foreign countries has increased much faster than have U.S. domestic mergers. In fact,

12 LOST IN TRANSLATION? CULTURAL VALUES AND MERGERS
domestic mergers in foreign countries in the 2000s were more common than during the 1990s wave,
in contrast to the minor merger wave in the U.S. domestic market.
Panel B of Figure 2 shows cross-border mergers have increased substantially since the 1990s and
that firms are buying targets in many more foreign countries. All five of the top target nations in
cross-border mergers (U.S., U.K., Canada, Germany, and France) have witnessed increased numbers
of acquisitions, but by far the most striking pattern is the number of cross-border mergers where
targets are in countries that are not in the top five most active markets. In fact, the number of
cross-border mergers at the peak of the 2000s wave was larger than the number of cross-border
mergers in the 1990s wave, mainly due to acquisitions outside the top five target nations. Both of
these figures provide strong evidence that research must account for cross-border and foreign-based
acquisitions if it is to be relevant in today’s M&A environment.
B. Empirical Measures of Cultural Values
To measure national cultural values we use the World Value Survey (WVS). The WVS is the
largest study ever conducted on cultural values and covers 97 societies on six continents and samples
from populations that represent more than 88 percent of the total world population. The survey
is carried out in five waves of surveys in 1981–1984, 1989–1993, 1994–1998, 1999–2004, and 2005–
2008. Sample respondents are randomly chosen to be representative across age, sex, occupation,
and geographic region. The set of questions in each wave of the WVS is not stable over time.
In order to have consistency, we start our study using the 1989–1993 wave because the survey
questions we use to measure culture are in all of the following survey wave questionnaires. Though
surveys are completed in waves, we know the exact year of each country’s survey. Therefore, we
match the most recent country-level and deal-level merger data to each survey year that includes
all three questions we use to measure national cultural values. Following this, for the rest of our
study, our data covers the years 1991 to 2008.
Each survey consists of about 250 questions on a variety of topics. We focus on the questions
that are most relevant for our dimensions of national culture.
1. Trust versus Distrust:
To measure trust, we use the question from the WVS which is as follows:

LOST IN TRANSLATION? CULTURAL VALUES AND MERGERS 13
Generally speaking, would you say that most people can be trusted or that you
need to be very careful in dealing with people?
This measure has been used extensively in prior research to measure trust (e.g, La Porta, Lopez-
de-Silanes, Shleifer, and Vishny (1997b), Sapienza, Toldra, and Zingales (2007), and Guiso,
Sapienza, and Zingales (2009b)).
2. Hierarchy versus Egalitarianism:
To measure national attitudes toward hierarchy versus egalitarianism we use the following
question from the WVS:
People have different ideas about following instructions at work. Some say that
one should follow one’s superior’s instructions even when one does not fully agree
with them. Other’s say that one should follow one’s superior’s instructions only
when one is convinced that they are right. With which of these two opinions do
you agree?
1. Should follow instructions
2. Must be convinced first
Those countries where people are more likely to follow instructions without question, are con-
sidered hierarchical. In egalitarian cultures, people look upon others as equals and so are more
likely to require a satisfactory explanation before following orders (Au and Cheung, 2004)
3. Individualism versus Collectivism:
To measure individualism we use the following question from the WVS:
How would you place your views on this scale? 1 means you completely agree
with the statement on the left; 10 means you agree completely with the statement
on the right; and if your views fall somewhere in between, you can choose any
number in between.
Incomes should be
made more equal
We need larger income differences
as incentives for individual effort
Countries that are more individualistic place greater weight on individual effort than on
ensuring everyone’s benefit. This variables has also been used in prior research, including Guiso,
Sapienza, and Zingales (2003) and Gabaix and Landier (2008).
We rescale the responses to each of the three questions to create measures that are bounded between
zero and one and take the average response for each of the 97 countries in the sample.
Figure 3 presents a scatter-plot of the country-level measures of the three cultural values we
study. The relationship of values represented in Figure 3 reveals a number of interesting patterns.

14 LOST IN TRANSLATION? CULTURAL VALUES AND MERGERS
First, the three measures are not correlated. Using the 2001 wave, the correlation between trust and
hierarchy has a p−value= 0.157, between trust and individualism the significance is p = 0.703, and
the significance is p = 0.253 for hierarchy and individualism. Thus, each measure of cultural values
is measuring something unique. Second, countries cluster together in predictable ways. Great
Britain, Australia, New Zealand, Ireland, and South Africa form a tight cluster of countries that
are slightly higher than the median in hierarchy and slightly below median in individualism, though
with some variation in trust. Other clusters include Mexico, Spain, and Argentina; Guatemala and
El Salvador; and Bosnia and Herzegovina, Bulgaria, Italy, and Albania.
Finally, we note that the U.S. is substantially separated from other countries on the hierarchy
versus egalitarianism scale. The U.S. scores the highest of all nations on our hierarchical measure,
indicating that people in the U.S. are most likely to follow instructions without the need to be
convinced. This reinforces our claim that understanding U.S. merger markets may not be enough
to understand world merger markets. In a later section of the paper, we show that our results are
robust if we exclude U.S. firms from our analysis.
Implicit in our definition of culture is that national culture is defined by the values held by
individuals in a country. Since firms are the unit of analysis in this study, we must assume that
individual-level values affect firm-level outcomes. This means that if managers or employees of
firms do not share the cultural values of the country where the firm is headquartered, then our
individual-level values will be poor proxies for firm-level values. We verify that this is not the case.
Using data from Management Diagnostics Ltd.’s Boardex database, in a sample of S&P 1500
companies headquartered in the United States over 2000 to 2009, we find that 97.7% of all CEOs
are U.S. nationals. The remaining percentage of CEOS are spread across 22 different nationalities,
where the next largest nationality is British, with 0.4% of all CEOs. For board members of these
firms, 95.8% are Americans, with the remainder comprised of 48 different nationalities. The large
majority of European CEOs are also nationals of their company’s country of residence. For example,
using the Boardex dataset, 90% of CEOs in Germany are German, 85% of CEOs in France are
French, and 91% of CEOs in Italy are Italian. Though we don’t have data on laborer nationality,
it is reasonable to assume that they are most likely citizens of the country where their employer is
headquartered. Therefore, we feel confident that country-level cultural values will be appropriate

LOST IN TRANSLATION? CULTURAL VALUES AND MERGERS 15
proxies for the cultural values held by the employees of a firm. For brevity, throughout the paper
we may refer to a ‘firm’s values’ to indicate the values of the people in the country where the firm
is headquartered.
C. Other National Institutions that Affect Mergers
As stated in the introduction, other institutional environments have been shown to affect both
domestic and cross-border merger activity. Since these institutions are likely correlated with na-
tional cultural values we control for them in our tests.
From La Porta, Lopez-de-Silanes, Shleifer, and Vishny (1998), we record a nation’s legal origin as
French, German, or Scandinavian Civil Law or English Common Law. La Porta et al. (1998) shows
that common law countries typically have stronger legal protection for investors. From Djankov, La
Porta, Lopez-de-Silanes, and Shleifer (2008) we take the anti-director index of investor protection
and the public enforcement of regulation for 72 countries. This more complete anti-director index
is a revision of the original measure in La Porta, Lopez-de-Silanes, Shleifer, and Vishny (1997a,
1998) which is only reported for 49 countries. The public enforcement index records a variety of
publicly mandated consequences of self-dealing. Both of these indexes record the protection of
minority shareholders. Though we study transactions where control rights are changed, minority
shareholder rights may affect a firm’s decision to own companies in a particular country.
Other financial institutions are likely to affect international mergers. We control for a country’s
wealth using GDP per capita from the Penn World Tables. We record the average corporate tax
rate for each country, using data from the Economic Freedom Index. GDP per capita and tax rates
may both proxy for the financial development of a country. Froot and Stein (1991) present a model
and empirical evidence to show that currency exchange rates help explain cross-border investment
patterns. Therefore, we record the historical exchange rate growth and volatility between each
country-pair over the 12 months prior to the merger. Next, we record if two countries have signed
a double-taxation treaty or a bilateral investment treaty at the time of the merger announcement.
Data is from the United Nations Conference on Trade and Development. Barthel, Busse, and
Neumayer (2009) show that FDI flows are larger between countries when they have signed a double-
taxation treaty. See also Huizinga and Voget (2009) for the role of double-taxation treaties in

16 LOST IN TRANSLATION? CULTURAL VALUES AND MERGERS
cross-border mergers. Bilateral investment treaties provide assurances against nationalization of
private enterprise and provide a framework to resolve investor disputes. To record a country’s level
of foreign trade we calculate the ratio of imports and exports to GDP, which we call openness.
Religion and language are other cultural institutions that have been shown to affect economic
outcomes (Barro and McCleary, 2003; Guiso, Sapienza, and Zingales, 2003). Following Stulz and
Williamson (2003), for each country we record its primary spoken language and religion using data
from the CIA World Factbook 2008.
Last, since geographic distance is likely related to the costs of cross-border mergers and also
to differences in culture, we control for geographic distance in two ways. First, we measure the
shortest distance between each country’s most important city (in terms of population) or its capital
city, following the great circle formula. However, this would be a poor measure for the geographic
closeness of many countries, such as the U.S. and Mexico. To address this type of geographical
distance we also record a dummy variable if two countries share a common border. These data are
from Centre D’Etudes Prospectives et D’Informations Internationales (CEPII) and are provided
for 225 countries.
The availability of data for all of our variables leads to a sample of 91,386 domestic mergers and
25,127 cross-border mergers from 52 different countries. In the tests of value creation where both
acquirers and targets must be publicly traded with available stock price data, our sample becomes
much more limited in size, though the scope is still relatively large. This subsample includes 3,586
domestic mergers in 38 countries and 815 cross-border mergers where acquirers are from 33 different
countries and targets from 36 countries.
III. The Effect of Culture on the Volume and Gains of Mergers
In this section we present empirical evidence on the role of cultural values on wealth creation in
both domestic and cross-border mergers. We analyze this in two ways. First, we investigate how
culture affects the volume of mergers within and across countries. Like any transaction, mergers
are expected to create value. This means that if mergers create more value on average, then we
will observe greater merger volume. The advantage of this approach is that we are not restricted to
mergers involving publicly traded firms. The disadvantage is that we cannot measure the magnitude

LOST IN TRANSLATION? CULTURAL VALUES AND MERGERS 17
of the effect of culture on firm values. Therefore, we also investigate the effect of culture on merger
returns using the smaller sample of publicly traded firms.
A. The Effect of Culture on Merger Volume
To measure merger activity within and across countries we normalize merger counts by GDP (in
thousands of U.S. dollars). In particular, we measure domestic merger activity in country i, in year
t, as follows:
Domestic M&A Activityi,t =log(1 + NUMBERi,t)
log(GDPi,t−1)
In cross-border mergers, we normalize by the aggregate GDP of the acquirer and target country.
For i 6= j, this is:
Cross-Border M&A Activityi,j,t =log(1 + NUMBERi,j,t)
log(GDPi,t−1 + GDPj,t−1)+
log(1 + NUMBERj,i,t)
log(GDPi,t−1 + GDPj,t−1)
where NUMBERi,j,t is the number of deals worth more than $1 million and the acquirer is from
country i and the target from country j. Therefore, we record cross-border mergers independent
of which country is the host for the acquirer and which is the host for the target.3
The first two columns of Table II present summary statistics of the measures of merger activity,
the cultural values measures, and the control variables. In domestic mergers, the average normal-
ized merger activity is 0.125 per year with a standard deviation of 0.090. To better understand
this measure, we use the merger activity of Belgium, the median country in the sample, as an
example. Over the period 1991–2008, Belgium had 10.6 domestic mergers per year on average. Its
average GDP was $259.8 billion, which produces an average measure of M&A activity of 0.126. For
comparison, the U.S. has a merger activity score of 0.328, Portugal has a score of 0.130, Romania
has a score of 0.036, and Nigeria has a score of 0.007.
Next, the average level of trust is 0.321, with a standard deviation of 0.155. The average levels
of Hierarchy and Individualism are 0.470 and 0.534. All three numbers are normalized to be in
the range zero to one. Across the 783 country-year observations, French Civil Law is the most
3For robustness, we also record variants on these measures that only count mergers if they are valued at $10 millionand $100 million and we also record aggregate dollar volumes, rather than counts of mergers. Our qualitative resultsare unchanged. See the Internet Appendix for details.

18 LOST IN TRANSLATION? CULTURAL VALUES AND MERGERS
common, followed by German Civil Law and English Common Law countries. Roman Catholic is
the primary religion in 52 percent of country-years, followed by Protestant at 17 percent and Islam
and Orthodox religions which each comprise about eight percent of the sample. The remaining
fraction is made up of Buddhist, Church of Norway, Hindu, Shintoism, Taoism, and Zion Christian
religions. Finally there is significant variation in GDP per capita and corporate tax rates over our
sample countries with the mean GDP per capita equal to $16,552 and an average tax rate of 25.5
percent.
Panel B of Table II presents summary statistics for cross-border variables. Across all 13,453
non-domestic country-pair years, merger activity is very small. In fact the 75th percentile of
country-pairs have no mergers that meet our $1 million sample requirement. Clearly, cross-border
mergers are not random, but instead highly focused within particular country-pairs as illustrated
in Figure 1. In the 1,898 country-pair years with a history of merger activity, the average merger
intensity is 0.090, less than the average domestic merger activity.
Aggregate trust is the sum of each country’s trust level in a cross-border country-pair. On
average, aggregate trust is 0.636. The average absolute difference between countries across all
country pairs is 0.179 for trust, larger than the difference for hierarchy and individualism. Shared
religion (28.9%) and shared borders (4.7%) in country-pairs are each more common than shared
language (3.4%). The average difference of GDP per capita between two randomly chosen countries
is $13,531, the difference of corporate tax rates is 6.9%. Finally, double-taxation treaties are more
common (61.8%) than are bilateral investment treaties (41.8%).
A.1. Merger Volume Results
The last three columns of Table II present the average domestic merger activity based on each of
the above country-level characteristics in Panel A. First, countries where people report an above-
median level of trustfulness have significantly higher domestic merger activity than countries where
people are less trusting of others. More hierarchical countries also have more domestic mergers than
do more egalitarian countries. Finally, there is a large and significant difference between the low
levels of merger activity in individualistic countries compared to the high level of merger activity
in more collectivist countries.

LOST IN TRANSLATION? CULTURAL VALUES AND MERGERS 19
The results in Panel B of Table II show that cultural values are significantly related to cross-
border merger activity. When the aggregate trust of two countries is high, there are significantly
more cross-border mergers. Cultural distance between countries is also related to merger activity.
Greater distance in levels of trust and individualism between two countries is associated with
significantly fewer cross-border mergers, though differences in hierarchy are slightly related to more
cross-border merger activity.
In both domestic and cross-border mergers, Table II shows that other country-level variables
affect merger volume. However, since country-level characteristics such as legal origin, religion,
geographic distance, and GDP per capita are all correlated with each other and with national
culture, we next run multivariate tests to determine the effect of culture on mergers controlling for
the effects of these other institutional characteristics. Our underlying model of mergers proposes
that mergers occur when the combined net benefits of the acquirer and target are positive. As a
consequence, when net benefits are negative, we will not observe any mergers. Therefore we estimate
tobit regression models in this section of the paper to account for the truncation of observed merger
activity at zero.
Table III presents the results from tobit regressions of culture and control variables on the GDP-
normalized level of domestic merger activity in the 52 countries in our sample. Controlling for a
country’s legal origin, investor protection laws, religion, GDP per capita and corporate tax rates, a
higher level of trust in a country is significantly related to a more active domestic merger market,
consistent with our hypothesis. These results are intuitive and are consistent with our hypothesis
that cultural values affect mergers. In particular, these results are consistent with Arrow (1972),
where greater levels of trust facilitate economic transactions. Second, greater individualism is
significantly related to less active domestic merger markets. This is consistent with the idea that the
focus on group goals above individual goals in collectivist cultures also facilitates mergers. Table III
shows that other institutions affect domestic merger activity in multivariate regressions, consistent
with prior research. Compared to English Common Law countries, countries with German and
Scandinavian legal origin have significantly fewer mergers. Stronger shareholder rights laws increase
merger activity.

20 LOST IN TRANSLATION? CULTURAL VALUES AND MERGERS
Turning next to cross-border merger volume, Table IV presents tobit regression estimates of
the effect of culture on the level of cross-border activity across the 13,453 country-pair yearly
observations. In these regressions, as well as in all of our cross-border tests, we include country
dummy variables. These variables take on the value of one for a particular country if either the
target or the acquirer firm is from that country. This way we do not distinguish between acquirer
and target country-level effects, but rather treat them symmetrically. These dummy variables
capture any country-level effects that do not vary over time, such as legal origin and religion. We
do not use country-pair dummies, since this would capture the cross-sectional effects of cultural
differences between countries. Instead, we include the absolute distance in country-level variables,
such as GDP/Capita, geographic distance, and openness, for example, to control for confounding
cross-country effects. We also include year fixed effects in all of our regressions to control for
worldwide macro economic shocks, such as currency crises and changes in world market valuations.
Columns (1)–(4) of Table IV include the cultural values separately, though each specification
includes all the control variables. As expected, cross-border mergers are more likely when countries
share a common origin of their legal systems, a common religion, a common language, less exchange
rate volatility, and are closer geographically. However, the difference in shareholder rights laws and
enforcement is not related to cross-border merger activity, nor are differences in GDP per capita.
Turning to the cultural variables, aggregate trust between two countries is positively related
to cross-border merger activity. Thus, as long as one country is trusting enough, merger activity
will increase. Next, greater cross-country differences along the cultural dimensions of hierarchy
and individualism are related to less cross-border merger activity, though individualism is only
significant at the 0.113 level. These results provide strong evidence that cultural differences have
a substantial effect on the patterns of cross-border mergers.
B. The Effect of Culture on Value Creation in Mergers
In order to measure the role of culture on value creation in mergers, we are forced to use a smaller
sub-sample of mergers where both acquirers and targets are publicly traded firms with available
stock price data. Stock price data is from Compustat Global Security Issue database and CRSP

LOST IN TRANSLATION? CULTURAL VALUES AND MERGERS 21
for U.S. companies. This restriction reduces our sample size to 3,586 domestic mergers and 815
cross-border mergers across 38 countries.
For each deal we compute the acquirer’s and target’s abnormal returns in the three day window
surrounding the announcement of the merger. Abnormal returns are calculated by subtracting the
Datastream country index of the firm’s host country from the firm’s daily return. We take the
sum over three days to generate a cumulative abnormal return (CAR). We use these CARs to
create our variable of interest, the combined CAR, which is simply the average of the acquirer’s
and target’s CAR, weighted by each firm’s market value two days before the announcement. Across
all of the deals in our sample, in untabulated results, we find that the average combined CAR is
2.13 percent in the three-day window around the announcement. In cross-border deals, the average
is 3.46 percent and in domestic mergers the average combined CAR is significantly lower at 1.85
percent (p−value < 0.001). Thus mergers create value on average, and cross-border mergers create
more value than do domestic mergers.
B.1. Sample Selection Effects
We have established in the prior section that there is a selection effect on cultural differences
in cross-border mergers. Mergers are not randomly assigned, instead, only mergers with expected
positive gains are undertaken. Thus the mergers that we observe have strong enough economic
motivations that the synergy gains outweigh the costs of cultural differences.
To address this selection bias, we need to account for the likelihood that two firms merge in
our cross-sectional regressions on CARs. In cross-border mergers we do this by running a two-
stage Heckman model. We first run a probit analysis using the same variables as in column (5)
of Table IV, where the dependent variable is equal to one if two countries had any cross-border
mergers, and zero otherwise. For each country-pair, we calculate the predicted probability of a
cross-border merger from the fitted values of the probit model, which includes year effects. Then,
at the deal-level we use this country-pair predicted probability to proxy for the likelihood of a
merger. In domestic mergers, since all firms share the same values, there is no selection on cultural
values and we do not need to account for this type of selection bias.

22 LOST IN TRANSLATION? CULTURAL VALUES AND MERGERS
B.2. Merger Returns Results
Table V presents results from regressions of combined CARs in domestic mergers. Controlling for
a host of country-level variables, we find that countries with greater levels of trustfulness have higher
combined returns from mergers. The effect of trust on merger returns is economically significant.
For a one standard deviation increase in trustfulness, the combined merger gains increase by 0.73
percentage points, compared to an average combined return of 1.85 percent and a median of 1.16
percent. These results are consistent with the effect of trust on the incidence of domestic mergers.
Countries where people are most trusting have more domestic mergers that create more value.
Cultural values along the dimensions of hierarchy and individualism are not significantly related to
combined CARs.
Table VI presents coefficient estimates of the effect of cultural differences on combined returns
in 815 cross-border mergers. We include each measure of culture separately in columns (1) through
(4) and then all together in column (5). We also include the Heckman lambda, described above,
to account for sample selection bias across country-pairs, and the country effects to account for
time invariant country-level effects. We find that the greater is the distance between two countries
along the cultural dimension of individualism versus collectivism, the lower are the combined an-
nouncement returns of a merger. This effect is also economically significant. Mergers at the 25th
percentile of the difference of individualism have combined returns that are 1.11 percentage points
higher than mergers where the difference is at the 75th percentile.
Other variables that affect cross-border merger returns include the negative effects of greater
differences in GDP per capita and differences in the import/export openness of the two countries.
Deal characteristics, such as relative size, form of payment, and the volatility of the target’s stock
returns also affect combined announcement returns in cross-border mergers.
C. Summary of the Effect of Culture on the Volume and Gains of Mergers
Our empirical evidence provides strong support for the hypothesis that cultural values impact
both domestic and cross-border merger activity and wealth creation. We find that higher levels of
trust in a country are related to both a higher volume of domestic and cross-border mergers, as
well as higher combined announcement returns in domestic mergers. This is consistent with the

LOST IN TRANSLATION? CULTURAL VALUES AND MERGERS 23
notion that trust facilitates trading. Higher levels of cross-border merger activity are explained
in part by less cultural differences between two countries along the dimensions of hierarchy versus
egalitarianism and individualism versus collectivism. Likewise, greater cross-country similarity of
individualism increases cross-border merger gains. This is consistent with the notion that cultural
distance impedes mergers by introducing costly frictions. Taken together, these results intuitively
fit into a rational trade off between the costs and benefits of mergers.
IV. The Effect of Culture on Merger Negotiations
In this section, we investigate whether national culture affects bargaining outcomes and deal
structures in mergers. As in the tests on merger volume and combined returns, there is no theoretical
model that explains how culture affects bargaining. Therefore we simply present empirical evidence
on the effect of culture on bargaining outcomes in mergers, while remaining agnostic about any
theoretical predictions. Finding any significant relationship between culture and the division of
gains would be a new contribution to our limited understanding of bargaining in any setting.
A. Culture and Bargaining Outcomes
We investigate the outcomes of bargaining by measuring the division of gains in mergers. To
measure the division of gains we would ideally divide the dollar value of total gains by the fraction
that each firm received, akin to splitting a pie. However, since each firms’ dollar gains, as well
as the combined gains, are not always positive, we can not use this method. Instead, we follow
Ahern (2009) and take the difference of dollar abnormal returns between the acquirer and target,
normalized by the sum of the firms’ market equity two days before the announcement. This is:
Acquirer’s Relative Gain =MVA,−2 · CARA,−1,+1 − MVT,−2 · CART,−1,+1
MVA,−2 + MVT,−2(1)
where MVi,−2 is the market value of the acquirer (i = A) or target (i = T ) two days before the
announcement. The acquirer’s relative gain is −3.04 percent on average. This means for each dollar
of aggregate pre-merger market value of the acquirer and target, the acquirer receives about 3 cents
less than the target in abnormal gains.

24 LOST IN TRANSLATION? CULTURAL VALUES AND MERGERS
Table VII presents the results of multivariate regressions of cultural values on the relative gain of
the acquirer in cross-border mergers. As before we include Heckman’s lambda to account for sample
selection, since acquirers may choose targets based on bargaining power embedded in cultural
differences, or vice versa. We restrict our attention to cross-border mergers since firms in domestic
mergers share the same national cultural values. Also, in contrast to earlier tests, we now consider
the effect of the signed difference between cultural variables, rather than the absolute difference.
In particular, ∆ Trust is calculated as the trust level of the acquirer’s nation minus the trust level
of the target’s nation. ∆ Hierarchy and ∆ Individualism are calculated analogously.
We find strong evidence that cultural differences affect bargaining outcomes. When the acquirer
is relatively more trusting than the target, the acquirer realizes greater relative gains, just as found
in the univariate tests. Moving from the 25th to the 75th percentile of the difference in trustfulness
leads to an increase in the acquirer’s gain relative to the target’s of 1.7 percentage points, compared
to the median of −2.2 percent. For an average target and acquirer, this translates into about $118
million. This result is consistent with the experimental evidence that trust engenders reciprocity.
This is also consistent with the idea that acquirers receive a premium for their trustfulness, since
trust increases the likelihood of completing the deal and successfully integrating the two firms. We
also find that when the acquirer is relatively more hierarchical than the target, the acquirer realizes
greater relative gains. The effect is also economically significant, increasing the acquirer’s relative
gain by 0.6 percentage points from the 25th to the 75th percentile of the difference in individualism,
compared to the median of 2.2 percent.
Consistent with a bargaining power story, we also find that the larger is the target, relative to the
acquirer, the less is the acquirer’s gain relative to the target’s. Mergers structured as tender offers
and mergers across industries also lead to less relative gains of the acquirer. Since relative size is a
strong determinant of bargaining power, we interact it with our measures of cultural differences in
column (5) of Table VII, though we find no significant interaction. This implies that culture affects
deal outcomes through a separate channel than through the economic power of the merging firms.

LOST IN TRANSLATION? CULTURAL VALUES AND MERGERS 25
B. Culture and Deal Structure
Since national culture affects bargaining outcomes, it is also likely to affect how mergers are
structured. In Table VIII we report univariate tests of deal characteristics by cultural values. In
Panel A, we find that deal characteristics vary significantly by national culture. In particular, in
countries with above-median levels of trust, deals are smaller, more likely to be tender offers, and
have fewer termination fees. In countries that report above-median hierarchy levels, mergers are
less likely to be tender offers and use more termination fees, on average. In individualistic countries,
mergers are smaller, use less termination fees, and targets are more likely to resist the merger using
a takeover defense.
In panel B of Table VIII, deal characteristics also vary by cultural differences between the acquirer
and target national values. When the home country of an acquirer is relatively more trusting than
that of a target, deals are more likely to be paid in cash only and there are fewer target termination
fees. Greater hierarchy values of the acquirer, relative to the target, are associated with smaller
deals, more tender offers, fewer termination fees, and fewer target defenses. Finally, individualism
is associated with fewer termination fees.
Given that cultural values are associated with various deal characteristics, in the last piece of
analysis of the paper, we investigate more closely three key deal characteristics that are part of the
structure of a merger: cash payment, target termination fees, and tender offers.
B.1. Culture and Method of Payment
The decision to use cash or stock is typically explained by tax implications (Huang and Walkling,
1987; Asquith, Bruner, and Mullins Jr., 1990), information asymmetry (Andrade, Mitchell, and
Stafford, 2001; Moeller, Schlingemann, and Stulz, 2007), and incentive effects (Hansen, 1987; Officer,
Poulsen, and Stegemoller, 2009). Cash payments usually require targets to pay capital gains taxes,
whereas stock swaps defer capital gains taxes. Second, when acquirer stock is difficult to value,
targets may prefer cash payments. Alternatively, an acquirer may prefer to use stock if it has private
information that its stock is overvalued. Third, targets that receive acquirer stock as payment will
continue to share the risk of the post-merger company, whereas targets that receive cash will not.

26 LOST IN TRANSLATION? CULTURAL VALUES AND MERGERS
In addition, payment in cash will give incentives to target shareholders and employee-shareholders
to increase the value of the post-merger firm.
In columns (1) and (2) of Table IX we report the coefficient estimates of logit regressions where
the dependent variable is a dummy variable equal to one if a merger is paid entirely in cash, and zero
otherwise. Column (1) includes the difference in national cultural variables between the acquirer
and target. Column (2) includes the acquirer and target cultural values separately. Consistent with
information asymmetry, friendly mergers in the same industry, where acquirers and targets share
a common geographic border, use less cash and more stock.
Turning to our variables of interest, controlling for a wide range of variables, national cultural
differences significantly affect the choice of cash or stock as a form of payment in a merger. When
targets are less trusting of others, more cash is used. This is consistent with the idea that trust
diminishes the effect of information asymmetry and allows stock to be used as payment. Second,
when people in the home country of the target are more likely to follow directions without being
convinced first than are people in the acquirer’s home country (i.e., the targets are more hierar-
chical), cash is more likely used as payment. Conjecturing, this is consistent with the incentive
effect of stock. When target employees are less likely to follow directions from the acquirer, using
acquirer stock will provide better incentives, whereas target employees that will follow directions
do not require stock incentives. Greater target individualism also significantly increases the likeli-
hood that the acquirer uses cash to pay for the merger. Conjecturing again, this may reflect that
collectivist cultures accept stock since they are more prone to work together and share the same
risks, whereas individualistic targets value the freedom of cash.
B.2. Culture and Target Termination Fees
Target termination fees require the target to pay a fee to the acquirer if the target reneges on the
merger. Acquirers may request termination fees to lock targets into a deal, reducing competition.
Alternatively, targets may prefer termination fees to generate more aggressive bids because bidders
are protected if the deal is not completed. A number of studies have shown that termination fees
actually increase competition and bidding (Officer, 2003; Bates and Lemmon, 2003; Boone and

LOST IN TRANSLATION? CULTURAL VALUES AND MERGERS 27
Mulherin, 2006). Thus termination fees insure the bidder but may increase the bargaining power
of the target.
In columns (3) and (4) of Table IX we present coefficient estimates from logit regressions where
the dependent variable equals one if the deal includes a target termination fee. Similar to the
use of cash payments, target termination fees are more common when their is greater information
asymmetry between targets and acquirers, consistent with an insurance motive. In particular,
when acquirers and targets do not share the same language or legal system, and when acquirer
stock volatility is higher, termination fees are more common.
National culture also affects the likelihood of the use of termination fees. When targets are more
hierarchical than acquirers, termination fees are more common. Also, greater target individualism
leads to a greater likelihood of the usage of termination fees. Since hierarchical countries place
greater weight on economic incentives, it is reasonable that firms from these countries would be
more likely to use termination fees in a merger agreement.
B.3. Culture and Tender Offers
The last aspect of negotiation that we investigate is the use of tender offers to complete a merger.
Tender offers are made directly to target shareholders, in contrast to a negotiated merger where
acquirers make their offer to the board of directors of the target firm. It is often the case that
tender offers are made to purposely exclude target executives from the negotiation, though it is not
always the case.4 Therefore, we distinguish between tender offers and negotiated offers.
Columns (5) and (6) of Table IX present estimates of logit coefficients where the dependent
variable equals one if the deal is a tender offer and zero otherwise. We find that culture affects this
decision as well. When an acquirer is relatively more trusting than a target, deals are more likely
negotiated than executed through a tender offer. This is again consistent with the idea that trust
substitutes for formal contracts, such as a tender offer. Second, when targets are more hierarchical
(more likely to follow directions from superiors), negotiated mergers are more likely. We don’t have
a strong intuition for this result, though it may reflect that greater hierarchical values may also be
substitutes for formal contracts.
4In some instances, tender offers are simply made for legal reasons after the merger has been successfully negotiatedwith the target board. Our data does not allow us to distinguish these two types.

28 LOST IN TRANSLATION? CULTURAL VALUES AND MERGERS
C. Summary of the Effect of Culture on Merger Negotiations
In this section, we have documented strong empirical relationships between national culture and
the ways in which mergers are structured, as well as the bargaining outcomes in mergers. We
find that acquirers from more trusting and hierarchical countries receive a statistically higher gain
relative to the target, than acquirers in countries that are less trusting and more egalitarian. We
next document numerous differences in deal structures by differences in national cultural values.
In detailed tests, we show that culture affects the form of payment used in mergers, the presence
of termination fees, and whether deals are structured as tender offers, after controlling for a host
of country-level variables. We do not claim that these results support one particular theory over
another. Instead, the contribution of these results is that they are the first to show an empirical
relation between culture and merger negotiations.
V. Robustness Checks
In this section of the paper, we describe various robustness checks to ensure our results are
not driven by U.S. firms, nor our measures of national culture, nor that our effects are driven by
differences in the cultural values of investors, rather than firms.
A. Excluding U.S. Firms
Because U.S. firms account for a large fraction of our sample, we verify that our results do not
change if we exclude these firms from our analyses. Since our measures of merger activity are at
the country-year level in domestic mergers, and country-pair-year level in cross-border mergers,
our sample size is only reduced slightly by this exclusion. We find that there are no differences
in our tests of domestic merger activity. In the tests of cross-border merger activity, the effect
of aggregate trust remains unchanged, the absolute difference of hierarchy becomes insignificant,
and individualism becomes negative and significant, consistent with the negative effect of cultural
distance.
Excluding U.S. firms from our regressions on combined gains in domestic mergers reduced our
sample size from 3,586 to 1,124 mergers, though our results are unchanged. In cross-border mergers,

LOST IN TRANSLATION? CULTURAL VALUES AND MERGERS 29
excluding U.S. firms as either targets or acquirers reduces our sample from 815 to 399, and the
results are again unchanged. In our tests of the acquirer’s gain relative to the target’s gain we lose
half of our sample, as before, though only the significance on the hierarchy variable is affected.
Overall, the robustness tests indicate that our results are not driven by U.S. firms. All results are
presented in the Internet Appendix.
B. Alternative Cultural Measures
Measures of cultural values other than the World Value Survey have been used in prior literature.
Hofstede (1980, 2001) categorizes culture into five dimensions: uncertainty avoidance (the extent
to which a society feels threatened by uncertainty), masculinity (the extent to which a society holds
values traditionally identified as masculine: assertiveness, materialism, and not caring for others),
power distance (similar to our hierarchical classifications), individualism (as we categorize it as
well), and short-term versus long-term orientation. Hofstede measured national culture along these
five dimensions using surveys responses from over 88,000 employees of IBM in 40 countries in 20
languages in the 1960s and 1970s. See Kirkman, Lowe, and Gibson (2006) for a comprehensive
survey of research using Hofstede’s measures.
Alternatively, Schwartz (1994) defines three dimensions of cultural values: Embeddedness versus
Autonomy (similar to our individualism dimension), Hierarchy versus Egalitarianism (same as our
Hierarchy dimension), and Mastery versus Harmony (where Mastery is an emphasis on dominating
an environment through assertion and harmony refers to finding one’s place in an existing environ-
ment). Schwartz’s data come from survey responses of more than 25,000 elementary school teachers
and university students in 44 countries.
We use the World Value Survey to measure culture because it provides the broadest and most up-
to-date information on cultural values and because the WVS allows us to measure the two cultural
values that overlap with both the Hofstede and Schwartz measures: hierarchy and individualism.
In addition, we use the WVS because it includes the question used to measure trustfulness in prior
research.
For robustness, we study the effects of cultural values measures from Schwartz (1994) and Hof-
stede (2001). First, we find results that are generally consistent with our main findings when

30 LOST IN TRANSLATION? CULTURAL VALUES AND MERGERS
we use the Schwartz or Hofstede measures of hierarchy and individualism, though in some cases
they are mixed. For instance, higher individualism in the alternative measures is correlated with
more domestic mergers, whereas we found a negative effect using the World Value Survey. At the
same time, the absolute difference of the Schwartz measure of individualism has a positive effect
on cross-border CARs, whereas the Hofstede measure is consistent with the negative effect in our
main results using the World Value Survey. In contrast, the three value classification systems are
consistent in many cases, including cross-border merger volume, division of merger gains, and each
of the three deal characteristics we study. It is reasonable that in some cases there will be lower
significance levels or conflicting results given the wide differences in sampling methods, sample
sizes, and the exact questions asked.
We also look at the cultural dimensions beyond hierarchy and individualism in each of Schwartz’s
and Hofstede’s classification systems. In the Schwartz system, Harmony versus Mastery has no
effect in any test, except a positive impact on the use of target termination fees. In the Hofstede
system, there are three additional dimensions: Masculinity, Uncertainty avoidance, and Long-term
orientation. Masculinity and uncertainty avoidance are negatively related to the volume of domestic
mergers, while long-term orientation is positively related. In cross-border merger volume tests, only
the distance in long-term orientation is related, and it is positively related, against our hypothesis.
The combined returns in domestic mergers are positively related to uncertainty avoidance and to
long-term orientation. The absolute difference in masculinity is positively related to combined
returns in cross-border mergers. In the division of merger gains, acquirers from countries that have
higher masculinity and uncertainty avoidance receive lower gains on average, relative to the target,
though long-term acquirers capture more gains. Finally, long-term oriented targets are more likely
to be paid in cash and targets from more masculine cultures are less likely to use termination fees.
All results are available in the Internet Appendix. We do not attempt to interpret these results,
though in many cases it is easy to think of a ex post rationale. Instead, we simply note that
consistent with our claim, culture influences merger activity, gains, and negotiation processes.

LOST IN TRANSLATION? CULTURAL VALUES AND MERGERS 31
C. Long-Run Effects
One may argue that the empirical relationship between national culture and mergers reflects
that investors in different countries respond differently to mergers, rather than reflecting the ease
of transactions or costly post-merger integration. Our first response to this criticism is that only
part of our results are driven by initial investor reactions, whereas the volume of mergers, as well
as the deal characteristics, is not based on market responses. Despite the well known problems of
identifying long-run stock market performance (Lyon, Barber, and Tsai, 1999; Mitchell and Stafford,
2000), to address the concern for the set of results based on acquirer announcement returns, we
investigate long-run stock returns using a buy-and-hold approach. Using country-level market
equity, book-to-market, and momentum benchmarks, as well as an analogous world benchmark, we
find no consistent significant effects of national culture on long-run acquirer stock returns. This is
consistent with market efficiency, where the value effects are captured at the announcement and no
momentum or reversals are observed on average. The results are available in the Internet Appendix
of this paper. These additional tests provide some assurance that our results on combined merger
gains are not driven simply by cultural differences in stock market investors.
VI. Conclusion
This paper investigates the role of national cultural values on the incidence, gains, and bargaining
process in both domestic and cross-border mergers. In a comprehensive sample of 116,513 worldwide
mergers over 1991 to 2008 we find that culture has a significant and economically meaningful effect
on the volume of mergers. Controlling for a multitude of country-level variables, including legal
origin, language, religion, exchange ratios, GDP per capita, and shareholder protection laws, we
find that countries that are more trusting of others and less individualistic have significantly more
domestic mergers for each dollar of national GDP. In addition, the average combined returns are
higher in domestic mergers in more trustful countries. This is consistent with the idea that trust
facilitates trade.
We also document a strong negative relationship between cultural differences and cross-border
returns and merger activity between two countries. In particular, the greater is the cross-country
32 LOST IN TRANSLATION? CULTURAL VALUES AND MERGERS
difference between the value of hierarchy versus egalitarianism, the smaller is the cross-border
merger volume. Similarly, less cultural distance along the dimension of individualism versus collec-
tivism leads to higher combined announcement returns in cross-border mergers. This is consistent
with the hypothesis that cultural differences impose costly frictions between firms which lead to
fewer mergers and mergers that create less value.
Finally, we provide new evidence that culture affects negotiations in cross-border mergers. First,
consistent with a strain of recent experimental evidence on bargaining and culture, we find that
certain cultural values are associated with larger bargaining outcomes. Firms that are more trusting
and hierarchical capture more gains than firms that are less trusting and more egalitarian. Though
there are no formal theories of the role of culture on bargaining outcomes, we propose rational
explanations for these effects. Second, we show that culture helps explain the form of payment,
the use of termination fees, and whether mergers are negotiated or completed via a tender offer in
cross-border deals. For example, cash is more commonly used as a form of payment if targets are
less trusting than acquirers.
Our findings show that culture matters, even where the stakes are very large. In particular, we
find evidence that trust may substitute for formal written contracts and that frictions caused by
cultural differences have large effects on economic transactions. This paper is part of a growing
field of research that connects finance with sociology. Our paper answers questions about the effect
of culture on one aspect of finance, though we believe that many other aspects remain unanswered.
LOST IN TRANSLATION? CULTURAL VALUES AND MERGERS 33
Appendix: Variable Definitions
Acquirer (Target) termination fee: Dummy variable equal to 1 if the merger agreementincludes an acquirer (target) termination fee (Source: SDC).
Acquirer (Target) past year return: Acquirer (target) stock buy-and-hold return in the12 months prior to the announcement month (Source: Compustat Global and CRSP).
Acquirer (Target) past year return volatility: Acquirer (target) stock return volatilityin the 12 months prior to the announcement (Source: Compustat Global and CRSP).
All cash: Dummy variable equal to 1 if the payment in the merger is made with all cash(Source: SDC).
Bilateral Investment Treaty: Dummy variable equal to 1 if the acquirer and target nationsigned a Bilateral Investment Treaty (Source: UNCTAD).
Corporate tax rate: Country corporate tax rate percentage in 2008 (Source: EconomicFreedom Index 2009).
Country effects: Dummy variables for each country in the sample that equal 1 if either theacquirer or target firm is located in a particular country. Thus each cross-border deal hastwo country dummy variables equal to 1.
Days to completion: Number of days between the announcement and the completion of themerger (Source: SDC and authors’ calculations).
Double-Tax Treaty: Dummy variable equal to 1 if the acquirer and target nation signed aDouble Taxation Treaty (Source: UNCTAD).
Exchange rate volatility: Exchange rate standard deviation from 36 months up to 1 monthprior the announcement, between the acquirer and target nation (Source: I/B/E/S data-base).
Exchange ratio growth: Exchange rate growth 1 year prior to the announcement betweenthe acquirer and target nation (Source: I/B/E/S database).
Financial acquirer: Dummy variable equal to 1 if SDC reports the acquirer as a financialacquirer (Source: SDC).
Friendly offer: Dummy value equal to 1 if a merger attitude is classified as friendly (Source:SDC).
GDP per capita: Annual Gross Domestic Product per capita (Source: Penn World Table6.3).

34 LOST IN TRANSLATION? CULTURAL VALUES AND MERGERS
Geographic Distance: Geographic distance between capitals. The geographical distancesare calculated following the great circle formula, which uses latitudes and longitudes of themost important city (in terms of population) or of its official capital (Source: CEPII).
Hierarchy: Average answer to the following question: “People have different ideas about fol-lowing instructions at work. Some say that one should follow one’s superior’s instructionseven when one does not fully agree with them. Others say that one should follow one’ssuperior’s instructions only when one is convinced that they are right. With which of thesetwo opinions do you agree? (1) Should follow instructions (2) Must be convinced first (3)Depends” (Question V105) (Source: World Value Survey).
Individualism: Average answer to the following question: “Incomes should be more equalor We need larger income differences as incentives for individual effort” (Question V141)(Source: World Value Survey).
Language: Primary spoken language of a country (Source: CIA World Factbook 2008).
Legal system: Common or civil law origin countries, with the latter further classified asFrench, German, or Scandinavian (Source: La Porta et al., 1998).
Majority cash: Dummy variable equal to 1 if the merger payment is made with at least 50%cash (Source: SDC).
Market value: The value of equity 10 days before the merger announcement (Source: Com-pustat Global).
Merger of equals: Dummy variable equal to 1 if the merger is recorded by SDC as a mergerof equals (Source: SDC).
Openness: Exports plus Imports divided by GDP as a percentage of GDP. The export andimport figures are in national currencies from the World Bank and United Nations dataarchives (Source: Penn World Tables 6.3).
Premium: The transaction value reported by SDC divided by the market value of the target30 days before the announcement (Source: SDC and Compustat Global and CRSP).
Public enforcement: Index of public enforcement. Ranges from 0 to 1. One quarter pointwhen each of the following sanctions is available: (1) fines for the approving body; (2) jailsentences for the approving body; (3) fines for Mr. James; and (4) jail sentence for Mr.James (Djankov et al., 2008).
Relative size: The ratio of the transaction value to the acquirer market value at the an-nouncement date (Source: SDC).
Religion: The primary religion in a country (Source: CIA World Factbook 2008).

LOST IN TRANSLATION? CULTURAL VALUES AND MERGERS 35
Same Industry: Dummy variable equal to 1 if the acquirer and target have the same 3-DigitSIC Code (Source: SDC).
Share Border: Dummy variable equal to 1 if the acquirer and target nations share the sameborder (Source: CEPII).
Shareholder rights: The shareholder index is an average of five 0-1 indicators: the coun-try allows shareholders to mail their proxy vote; shareholders are not required to deposittheir shares prior to the General Shareholders Meeting; cumulative voting is allowed; anoppressed minorities mechanism is in place; the minimum percentage of share capital thatentitles a shareholder to call an Extraordinary Shareholders Meeting is less than or equalto 10%. Scale from zero to 5, with lower scores for lower shareholder protection (Source:Djankov et al., 2008).
Target defense: Dummy variable equal to 1 if a target company uses anti-takeover defensesto attempt to prevent the merger (Source: SDC).
Tender offer: Dummy variable equal to 1 if a merger is a tender offer, 0 otherwise (Source:SDC).
Transaction value: The dollar value of all consideration paid in a merger minus costs andfees (Source: SDC).
Trust: Average answer to the following question: “Generally speaking, would you say that(1) Most people can be trusted (2) Need to be very careful” (Question V25)(Source: WorldValue Survey)

36 LOST IN TRANSLATION? CULTURAL VALUES AND MERGERS
REFERENCES
Adair, Wendi, Jeanne Brett, Alain Lempereur, Tetsushi Okumura, Peter Shikhirev, Catherine
Tinsley, and Anne Lytle, 2004, Culture and negotiation strategy, Negotiation Journal 20, 87–
111.
Ahern, Kenneth R., 2009, Bargaining power and industry dependence in mergers, University of
Michigan, Working Paper.
Andrade, Gregor, Mark Mitchell, and Erik Stafford, 2001, New evidence and perspectives on merg-
ers, The Journal of Economic Perspectives 15, 103–120.
Arrow, Kenneth J., 1972, Gifts and exchanges, Philosophy and Public Affairs 1, 343–362.
Asquith, Paul, Robert F. Bruner, and David W. Mullins Jr., 1990, Merger returns and the form of
financing, Massachusetts Institute of Technology Working Paper.
Au, Kevin, and Mike W. L. Cheung, 2004, Intra-cultural variation and job autonomy in 42 countries,
Organization Studies 24, 1339–1362.
Barr, Abigail, Chris Wallace, Jean Ensminger, Joseph Henrich, Clark Barrett, Alexander Bolyanatz,
Juan Camilo Cardenas, Michael Gurven, Edwins Gwako, Carolyn Lesorogol, Frank Marlowe,
Richard McElreath, David Tracer, and John Ziker, 2009, Homo æqualis: A cross-society experi-
mental analysis of three bargaining games, University of Oxford Working Paper.
Barro, Robert J., and Rachel M. McCleary, 2003, Religion and economic growth across countries,
American Sociological Review 68, 760–781.
Barthel, Fabian, Matthias Busse, and Eric Neumayer, 2009, The impact of double taxation treaties
on foreign direct investment: Evidence from large dyadic panel data, London School of Economics
Working Paper.
Bates, Thomas W., and Michael L. Lemmon, 2003, Breaking up is hard to do? An analysis of
termination fee provisions and merger outcomes, Journal of Financial Economics 69, 469–504.
Berg, Joyce, John Dickhaut, and Kevin McCabe, 1995, Trust, reciprocity, and social history, Games
and Economic Behavior 10, 122–142.
Boone, Audra L., and J. Harold Mulherin, 2006, Do termination provisions truncate the takeover
bidding process?, The Review of Financial Studies 20, 461–489.
Brett, Jeanne M., 2000, Culture and negotiation, International Journal of Psychology 35, 97–104.

LOST IN TRANSLATION? CULTURAL VALUES AND MERGERS 37
, Wendi Adair, Alain Lempereur, Tetsushi Okumura, Peter Shikhirev, Catherine Tinsley,
and Anne Lytle, 1998, Culture and joint gains in negotiation, Negotiation Journal 14, 61–86.
Brett, Jeanne M., and Tetsushi Okumura, 1998, Inter- and intracultural negotiations: U.S. and
Japanese negotiators, The Academy of Management Journal 41, 495–510.
Bris, Arturo, and Christos Cabolis, 2008, The value of investor protection: Firm evidence from
cross-border mergers, The Review of Financial Studies 21, 605–648.
Butler, Jeffrey, Paola Giuliano, and Luigi Guiso, 2009, The right amount of trust, NBER Working
Paper.
Carlin, Bruce Ian, Florin Dorobantu, and S. Viswanathan, 2009, Public trust, the law, and financial
investment, Journal of Financial Economics 92, 321–341.
Chari, Anusha, Paige P. Ouimet, and Linda L. Tesar, 2010, The value of control in emerging
markets, The Review of Financial Studies 23, 1741–1770.
Chui, Andy C.W., Sheridan Titman, and K.C. John Wei, 2009, Individualism and momentum
around the world, Journal of Finance, forthcoming.
Dinc, I. Serdar, and Isil Erel, 2010, Economic nationalism in mergers & acquisitions, Massachusetts
Institute of Technology and Ohio State University Working Paper.
Djankov, Simeon, Rafael La Porta, Florencio Lopez-de-Silanes, and Andrei Shleifer, 2008, The law
and economics of self-dealing, Journal of Financial Economics 88, 430–465.
Erel, Isil, Rose Liao, and Michael Weisbach, 2009, World markets for mergers and acquisitions,
Ohio State University Working Paper.
Ferreira, Miguel A., Massimo Massa, and Pedro Matos, 2010, Shareholders at the gate? Institu-
tional investors and cross-border mergers and acquisitions, The Review of Financial Studies 23,
601–644.
Fiske, Alan P., 1991, Structures of Social Life: The Four Elementary Forms of Human Relations
(Free Press (Macmillan)).
Froot, K., and J. Stein, 1991, Exchange rates and foreign direct investment: An imperfect capital
markets approach, The Quarterly Journal of Economics 106, 1191–1217.
Gabaix, Xavier, and Augustin Landier, 2008, Why has CEO pay increased so much?, Quarterly
Journal of Economics 123, 49–100.

38 LOST IN TRANSLATION? CULTURAL VALUES AND MERGERS
Giannetti, Mariassunta, and Yishay Yafeh, 2009, Do cultural differences between contracting parties
matter? Evidence from syndicated bank loans, Stockholm School of Economics Working Paper.
Griffin, Dale, Kai Li, Heng Yue, and Longkai Zhao, 2009, Cultural values and corporate risk-taking,
University of British Columbia and Peking University Working Paper.
Grossman, Sanford J., and Oliver D. Hart, 1986, The costs and benefits of ownership: A theory of
vertical and lateral integration, The Journal of Political Economy 94, 691–719.
Guiso, Luigi, Paola Sapienza, and Luigi Zingales, 2003, People’s opium? Religion and economic
attitudes, Journal of Monetary Economics 50, 225–282.
, 2006, Does culture affect economic outcomes?, The Journal of Economic Perspectives 20,
23–48.
, 2009a, Cultural biases in economic exchange?, The Quarterly Journal of Economics 124,
1095–1131.
, 2009b, Trusting the stock market, Journal of Finance, forthcoming.
Hansen, Robert G., 1987, A theory for the choice of exchange medium in mergers and acquisitions,
The Journal of Business 60, 75–95.
Hart, Oliver, 1995, Firms, Contracts, and Financial Structure (Clarendon Press: Oxford).
, and John Moore, 1990, Property rights and the nature of the firm, The Journal of Political
Economy 98, 1119–1158.
Hofstede, Geert, 1980, Culture’s Consequences: International differences in work related values
(Sage: Beverly Hills, CA).
, 2001, Culture’s Consequences: Comparing Values, Behaviors, Institutions, and Organiza-
tions Across Nations (Sage Publications: Thousand Oaks, California) 2nd edn.
Huang, Yen-Sheng, and Ralph A. Walkling, 1987, Target abnormal returns associated with acqui-
sition announcements, Journal of Financial Economics 19, 329–349.
Huizinga, Harry P., and Johannes Voget, 2009, International taxation and the direction and volume
of cross-border m&as, The Journal of Finance 64, 1217–1249.
Kirkman, Bradley L., Kevin B. Lowe, and Cristina B. Gibson, 2006, A quarter century of Culture’s
Consequences: A review of empirical research incorporating Hofstede’s cultural values framework,
Journal of International Business Studies 37, 285–320.

LOST IN TRANSLATION? CULTURAL VALUES AND MERGERS 39
La Porta, Rafael, Florencio Lopez-de-Silanes, Andrei Shleifer, and Robert W. Vishny, 1997a, Legal
determinants of external finance, Journal of Finance 52, 1131–1150.
, 1997b, Trust in large organizations, The American Economic Review, Papers and Pro-
ceedings 87, 333–338.
, 1998, Law and finance, The Journal of Political Economy 106, 1113–1155.
Landier, Augustin, Vinay B. Nair, and Julie Wulf, 2009, Trade-offs in staying close: Corporate
decision making and geographic dispersion, Review of Financial Studies.
Lyon, John D., Brad M. Barber, and Chih-Ling Tsai, 1999, Improved methods for tests of long-run
abnormal stock returns, The Journal of Finance 54, 165–201.
Metcalf, Lynn E., Allan Bird, Mark F. Peterson, Mahesh Shankarmahesh, and Terri R. Lituchy,
2007, Cultural influences in negotiations: A four country comparative analysis, International
Journal of Cross Cultural Management 7, 147–168.
Mitchell, Mark L., and Erik Stafford, 2000, Managerial decisions and long-term stock price perfor-
mance, Journal of Business 73, 287–329.
Moeller, Sara B., and Frederik P. Schlingemann, 2005, Global diversification and bidder gains: A
comparison between cross-border and domestic acquisitions, Journal of Banking & Finance 29,
533–564.
, and Rene M. Stulz, 2007, How do diversity of opinion and information asymmetry affect
acquirer returns?, The Review of Financial Studies 20, 2047–2078.
Officer, Micah S., 2003, Termination fees in mergers and acquisitions, Journal of Financial Eco-
nomics 69, 431–467.
, Annette B. Poulsen, and Mike Stegemoller, 2009, Target-firm information asymmetry and
acquirer returns, Review of Finance 13, 467–493.
Oosterbeek, Hessel, Randolph Sloof, and Gijs Van de Kuilen, 2004, Cultural differences in ultima-
tum game experiments: Evidence from a meta-analysis, Experimental Economics 7, 171–188.
Rossi, Stefano, and Paolo F. Volpin, 2004, Cross-country determinants of mergers and acquisitions,
Journal of Financial Economics 74, 277–304.
Sapienza, Paola, Anna Toldra, and Luigi Zingales, 2007, Understanding trust, Northwestern Uni-
versity Working Paper.

Schwartz, Shalom, 1994, Individualism and collectivism: Theory, method and applications . chap.
Beyond individualism-collectivism: New cultural dimensions of values., pp. 85–119 (Sage: New-
bury Park, California).
Stulz, Rene, and Rohan Williamson, 2003, Culture, openness, and finance, Journal of Financial
Economics 70, 313–349.
Tabellini, Guido, 2008, The scope of cooperation: Values and incentives, The Quarterly Journal of
Economics 123, 905–950.
Trompenaars, Fons, 1993, Riding the Wave of Culture (The Economist Books).
Uysal, Vahap B., Simi Kedia, and Venkatesh Panchapagesan, 2008, Geography and acquirer returns,
Journal of Financial Intermediation 17, 256–275.
Weber, Yaakov, Oded Shenkar, and Adi Raveh, 1996, National and corporate cultural fit in merg-
ers/acquisitions: An exploratory study, Management Science 42, 1215–1227.
Williamson, Oliver E., 1975, Markets and Hierarchies: Analysis and Antitrust Implications (Free
Press: New York).
, 1979, Transaction-cost economics: The governance of contractual relations, Journal of
Law and Economics 22, 233–261.
, 1985, The Economic Institutions of Capitalism (Free Press: New York).
40

LO
ST
INT
RA
NSLAT
ION
?C
ULT
UR
AL
VA
LU
ES
AN
DM
ER
GE
RS
41
USA
GBR
JPN
CAN
AUS
FRADEU
MYS
ESPITA
SWE
CHN
NLD
INDIA
RUS
HKG
BRAZIL
FIN
SGP
SWISS
XYZ Text size represents the number of domestic mergers within a nation (Note: USA is 50% of its correct scale)
Line width represents the number of cross-border mergers
Direction points from acquirer to target when acquirer nation makes 50% more acquisitions of target than vice versa
Figure 1Cross-Border Activity for the 20 Most Active Domestic M&A Markets 1985–2008The 20 most active domestic merger markets are determined by the total number of domestic mergers over 1985–2008, where acquirersand targets are public, private, and subsidiary firms listed on SDC Thompson Database.

42 LOST IN TRANSLATION? CULTURAL VALUES AND MERGERS
1985 1990 1995 2000 2005
Num
ber
ofM
erge
rs
1000
2000
3000
4000
5000
6000
7000 Rest of World
JPN
AUS
CAN
UK
USA
(a) Domestic Mergers
1985 1990 1995 2000 2005
Num
ber
ofM
erge
rs
400
800
1200
1600
2000
2400
2800
Rest of World
FRA
DEU
CAN
UK
USA
(b) Targets in Cross-Border Mergers
Figure 2Five Largest Domestic and Cross-Border Merger MarketsPanel (A) reports the five largest domestic merger markets by year, plus the rest of the world. Largestdomestic merger markets are determined by the most number of domestic mergers over the period1985 to 2008. Panel (B) reports the five largest cross-border target nations. Largest cross-bordertarget nations are determined by the number of cross-border mergers in 1985–2008 where the targetfirm was located in a particular country. Mergers include all public, private, and subsidiary targetsand acquirers from SDC Thomson database.

LOST IN TRANSLATION? CULTURAL VALUES AND MERGERS 43
PRIBGD
GCA
JOR
MAR
VEN
SLV
ROU
VNM
BRA
PER
TZA
GEO
ZAF
IRL
UGA
SAU
MEXBLR
USA
ARG
AUS
BGR
GBR
CAN
IRN
ARM
AZE
FRA
DZA
UKR
NLD
ESP
BEL
RUS
CHL
POL
NZL
DOM
CHN
SGP
URY
ITA
TUR
MKD
MDA
TWN
YUG
EST LUX
KGZ CZE
IND
LTU
ALB
HRV
SVN
BIH
HKG
AUTFIN
IDN
NOR
KOR
JPN
Indiv
idual
ism
Col
lect
ivis
m
Egalitarianism Hierarchy
TrustDistrust
Figure 3Cultural Values Across NationsEach circle represents a country’s relative scores from three questions on the World Value Survey,1999–2004. Positioning along the horizontal axis indicates the country’s degree of hierarchal vs.egalitarianism (measured as whether people believe they should follow instructions from a superiorat work even if they do not agree vs. having to be convinced first). Positioning along the vertical axisindicates the country’s degree of individualism vs. collectivism (measured as whether people believeincome differences are an incentive for effort vs. whether incomes should be made more equal). Thecoloration of each circle indicates the country’s degree of trust (measured as whether people believemost other people can be trusted or not). A lighter color indicates a more trusting country, a darkercolor indicates more distrust of others. Country abbreviations follow the three-digit ISO codes.
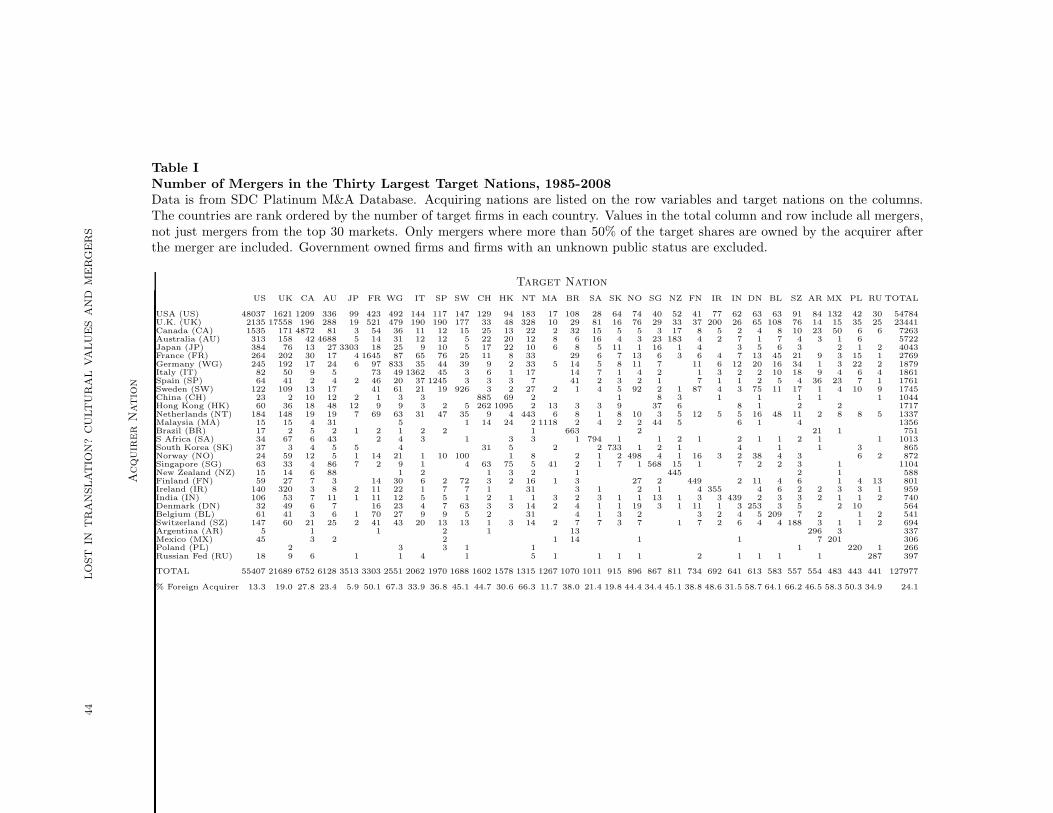
44
LO
ST
INT
RA
NSLAT
ION
?C
ULT
UR
AL
VA
LU
ES
AN
DM
ER
GE
RS
Table INumber of Mergers in the Thirty Largest Target Nations, 1985-2008Data is from SDC Platinum M&A Database. Acquiring nations are listed on the row variables and target nations on the columns.The countries are rank ordered by the number of target firms in each country. Values in the total column and row include all mergers,not just mergers from the top 30 markets. Only mergers where more than 50% of the target shares are owned by the acquirer afterthe merger are included. Government owned firms and firms with an unknown public status are excluded.
Target Nation
US UK CA AU JP FR WG IT SP SW CH HK NT MA BR SA SK NO SG NZ FN IR IN DN BL SZ AR MX PL RU TOTAL
USA (US) 48037 1621 1209 336 99 423 492 144 117 147 129 94 183 17 108 28 64 74 40 52 41 77 62 63 63 91 84 132 42 30 54784U.K. (UK) 2135 17558 196 288 19 521 479 190 190 177 33 48 328 10 29 81 16 76 29 33 37 200 26 65 108 76 14 15 35 25 23441Canada (CA) 1535 171 4872 81 3 54 36 11 12 15 25 13 22 2 32 15 5 5 3 17 8 5 2 4 8 10 23 50 6 6 7263Australia (AU) 313 158 42 4688 5 14 31 12 12 5 22 20 12 8 6 16 4 3 23 183 4 2 7 1 7 4 3 1 6 5722Japan (JP) 384 76 13 27 3303 18 25 9 10 5 17 22 10 6 8 5 11 1 16 1 4 3 5 6 3 2 1 2 4043France (FR) 264 202 30 17 4 1645 87 65 76 25 11 8 33 29 6 7 13 6 3 6 4 7 13 45 21 9 3 15 1 2769Germany (WG) 245 192 17 24 6 97 833 35 44 39 9 2 33 5 14 5 8 11 7 11 6 12 20 16 34 1 3 22 2 1879Italy (IT) 82 50 9 5 73 49 1362 45 3 6 1 17 14 7 1 4 2 1 3 2 2 10 18 9 4 6 4 1861Spain (SP) 64 41 2 4 2 46 20 37 1245 3 3 3 7 41 2 3 2 1 7 1 1 2 5 4 36 23 7 1 1761Sweden (SW) 122 109 13 17 41 61 21 19 926 3 2 27 2 1 4 5 92 2 1 87 4 3 75 11 17 1 4 10 9 1745China (CH) 23 2 10 12 2 1 3 3 885 69 2 1 8 3 1 1 1 1 1 1044Hong Kong (HK) 60 36 18 48 12 9 9 3 2 5 262 1095 2 13 3 3 9 37 6 8 1 2 2 1717Netherlands (NT) 184 148 19 19 7 69 63 31 47 35 9 4 443 6 8 1 8 10 3 5 12 5 5 16 48 11 2 8 8 5 1337Malaysia (MA) 15 15 4 31 5 1 14 24 2 1118 2 4 2 2 44 5 6 1 4 1356Brazil (BR) 17 2 5 2 1 2 1 2 2 1 663 2 21 1 751S Africa (SA) 34 67 6 43 2 4 3 1 3 3 1 794 1 1 2 1 2 1 1 2 1 1 1013South Korea (SK) 37 3 4 5 5 4 31 5 2 2 733 1 2 1 4 1 1 3 865Norway (NO) 24 59 12 5 1 14 21 1 10 100 1 8 2 1 2 498 4 1 16 3 2 38 4 3 6 2 872Singapore (SG) 63 33 4 86 7 2 9 1 4 63 75 5 41 2 1 7 1 568 15 1 7 2 2 3 1 1104New Zealand (NZ) 15 14 6 88 1 2 1 3 2 1 445 2 1 588Finland (FN) 59 27 7 3 14 30 6 2 72 3 2 16 1 3 27 2 449 2 11 4 6 1 4 13 801Ireland (IR) 140 320 3 8 2 11 22 1 7 7 1 31 3 1 2 1 4 355 4 6 2 2 3 3 1 959India (IN) 106 53 7 11 1 11 12 5 5 1 2 1 1 3 2 3 1 1 13 1 3 3 439 2 3 3 2 1 1 2 740Denmark (DN) 32 49 6 7 16 23 4 7 63 3 3 14 2 4 1 1 19 3 1 11 1 3 253 3 5 2 10 564Belgium (BL) 61 41 3 6 1 70 27 9 9 5 2 31 4 1 3 2 3 2 4 5 209 7 2 1 2 541Switzerland (SZ) 147 60 21 25 2 41 43 20 13 13 1 3 14 2 7 7 3 7 1 7 2 6 4 4 188 3 1 1 2 694Argentina (AR) 5 1 1 2 1 13 296 3 337Mexico (MX) 45 3 2 2 1 14 1 1 7 201 306Poland (PL) 2 3 3 1 1 1 220 1 266Russian Fed (RU) 18 9 6 1 1 4 1 5 1 1 1 1 2 1 1 1 1 287 397
TOTAL 55407 21689 6752 6128 3513 3303 2551 2062 1970 1688 1602 1578 1315 1267 1070 1011 915 896 867 811 734 692 641 613 583 557 554 483 443 441 127977
% Foreign Acquirer 13.3 19.0 27.8 23.4 5.9 50.1 67.3 33.9 36.8 45.1 44.7 30.6 66.3 11.7 38.0 21.4 19.8 44.4 34.4 45.1 38.8 48.6 31.5 58.7 64.1 66.2 46.5 58.3 50.3 34.9 24.1
Acquir
er
Natio
n

LOST IN TRANSLATION? CULTURAL VALUES AND MERGERS 45
Table IIDomestic and Cross-Border Merger Activity by Cultural ValuesThis table presents summary statistics and univariate tests of the difference in merger activity by highand low values of country-level variables. Entries in the first two columns are the mean and standarddeviation of the row variable. Entries in columns 3 and 4 are the average of the log number of mergersin a given country-year normalized by the log GDP (in domestic mergers) or the log of the sum ofGDPs (in cross-border mergers). High (Low) indicates above- (below-)median observations basedon the median of the row variable. The last column reports the p−value of a test of the differencebetween High and Low. There are 783 domestic country-year observations from 52 countries and13,453 cross-border country pair-years from 1991 to 2008. Trust is measured as whether peoplebelieve most other people can be trusted or not. Hierarchy is measured as whether people believethey should follow instructions from a superior at work even if they do not agree vs. having tobe convinced first. Individualism is measured as whether people believe income differences are anincentive for effort vs. whether incomes should be made more equal. Aggregate Trust is the sum ofeach country’s trust score in a cross-border merger. | ∆ | indicates the absolute difference betweenthe acquirer and target nation. All variables are defined in the appendix.
Panel A: Domestic Mergers
Summary Statistics No. of Mergers Normalized by GDP
MeanStandardDeviation
High/Yes Low/NoDifferencep−value
No. Mergers Normalized by GDP 0.125 0.090
Cultural Values
Trust 0.321 0.155 0.155 0.094 (0.000)∗∗∗
Hierarchy 0.470 0.112 0.147 0.103 (0.000)∗∗∗
Individualism 0.534 0.107 0.110 0.140 (0.000)∗∗∗
Legal System
English Common Law 0.179 0.383 0.208 0.107 (0.000)∗∗∗
French Civil Law 0.452 0.498 0.100 0.145 (0.000)∗∗∗
German Civil Law 0.254 0.436 0.104 0.132 (0.000)∗∗∗
Scandinavian Civil Law 0.115 0.319 0.141 0.123 (0.019)∗∗
Investor Protection
Shareholder Rights 3.383 1.108 0.145 0.100 (0.000)∗∗∗
Public Enforcement 0.440 0.437 0.127 0.122 (0.380)
Religion
Roman Catholic 0.519 0.500 0.119 0.131 (0.069)∗
Muslim 0.083 0.276 0.039 0.132 (0.000)∗∗∗
Protestant 0.174 0.379 0.191 0.111 (0.000)∗∗∗
Orthodox 0.080 0.272 0.045 0.132 (0.000)∗∗∗
Financial
GDP/Capita 16.552 11.736 0.173 0.076 (0.000)∗∗∗
Corporate Tax Rate 0.255 0.063 0.163 0.086 (0.000)∗∗∗
Openness 0.075 0.053 0.105 0.145 (0.000)∗∗∗
continued on next page

46 LOST IN TRANSLATION? CULTURAL VALUES AND MERGERS
Table II - Continued
Panel B: Cross-Border Mergers
Summary Statistics No. of Mergers Normalized by GDP
MeanStandardDeviation
High/Yes Low/NoDifferencep−value
Number of MergersNormalized by GDP
0.013 0.041
Number of Mergers (if any)Normalized by GDP
0.090 0.072
Cultural Values
Aggregate Trust 0.636 0.226 0.018 0.007 (0.000)∗∗∗
| ∆ Trust | 0.179 0.135 0.010 0.016 (0.000)∗∗∗
| ∆ Hierarchy | 0.120 0.090 0.013 0.012 (0.051)∗
| ∆ Individualism | 0.122 0.090 0.007 0.018 (0.000)∗∗∗
Legal System
Same Legal System 0.805 0.396 0.014 0.009 (0.000)∗∗∗
| ∆ Investor Protection | 1.201 0.899 0.012 0.015 (0.000)∗∗∗
| ∆ Public Enforcement | 0.477 0.384 0.013 0.012 (0.037)∗∗
Other Cultural Variables
Same Religion 0.289 0.453 0.016 0.012 (0.000)∗∗∗
Same Language 0.034 0.181 0.067 0.011 (0.000)∗∗∗
Log(Geographic Distance) 1.581 1.036 0.006 0.020 (0.000)∗∗∗
Share Border 0.047 0.211 0.054 0.011 (0.000)∗∗∗
Financial
| ∆ GDP/Capita | 13.531 11.549 0.008 0.018 (0.000)∗∗∗
| ∆ Tax rate | 0.069 0.051 0.014 0.012 (0.002)∗∗∗
| ∆ Openness | 0.052 0.066 0.010 0.015 (0.000)∗∗∗
Exchange Ratio Volatility 0.068 0.277 0.006 0.019 (0.000)∗∗∗
Exchange Ratio Growth 0.213 2.837 0.011 0.014 (0.000)∗∗∗
Double-Taxation Treaty 0.618 0.486 0.019 0.003 (0.000)∗∗∗
Bilateral Investment Treaty 0.418 0.493 0.004 0.019 (0.000)∗∗∗
∗∗∗ Statistical significance at the 1% level.∗∗ Statistical significance at the 5% level.∗ Statistical significance at the 10% level.

LOST IN TRANSLATION? CULTURAL VALUES AND MERGERS 47
Table IIINational Culture and Merger Activity in Domestic MarketsThis table presents pooled cross-sectional tobit regression coefficients and robust p−values clusteredat the nation level. The dependent variable is the log of the number of domestic mergers normalizedby the log GDP in the same year at the country-year level. Trust is measured as whether peoplebelieve most other people can be trusted or not. Hierarchy is whether people believe they shouldfollow instructions from a superior at work even if they do not agree vs. having to be convinced first.Individualism is whether people believe income differences are an incentive for effort vs. whetherincomes should be made more equal. All other variables are defined in the appendix. Significance at10%, 5%, and 1%, indicated by ∗, ∗∗, and ∗∗∗.
Number of Domestic MergersNormalized by GDP
(1) (2) (3) (4)
Trust 0.161∗∗ 0.194∗∗
(0.043) (0.016)
Hierarchy 0.005 −0.020(0.956) (0.819)
Individualism −0.090 −0.138∗
(0.215) (0.072)
Openness −0.550∗∗ −0.594∗∗∗ −0.546∗∗ −0.474∗∗
(0.019) (0.009) (0.014) (0.038)
Shareholder Rights 0.018∗ 0.016 0.016 0.017∗
(0.057) (0.112) (0.112) (0.071)
Public Enforcement 0.018 0.016 0.017 0.020(0.410) (0.511) (0.487) (0.371)
GDP/Capita 2.175 3.033∗∗ 2.882∗∗ 1.785(0.142) (0.034) (0.039) (0.201)
Corporate Tax Rate 0.270 0.274 0.307∗ 0.314∗
(0.113) (0.121) (0.092) (0.065)
French Legal System −0.048 −0.062∗ −0.066∗ −0.053(0.151) (0.092) (0.081) (0.127)
German Legal System −0.069∗∗ −0.076∗∗ −0.079∗∗ −0.076∗∗
(0.031) (0.034) (0.025) (0.032)
Scandinavian Legal System −0.151∗∗∗ −0.121∗∗∗ −0.122∗∗∗ −0.161∗∗∗
(0.001) (0.009) (0.002) (0.002)
Constant 0.064∗∗∗ 0.066∗∗∗ 0.066∗∗∗ 0.063∗∗∗
(0.000) (0.000) (0.000) (0.000)
Year Fixed Effects Yes Yes Yes YesReligion Fixed Effects Yes Yes Yes YesLog likelihood 685.691 666.466 671.977 698.669Constant only log likelihood 334.559 334.559 334.559 334.559Observations 783 783 783 783
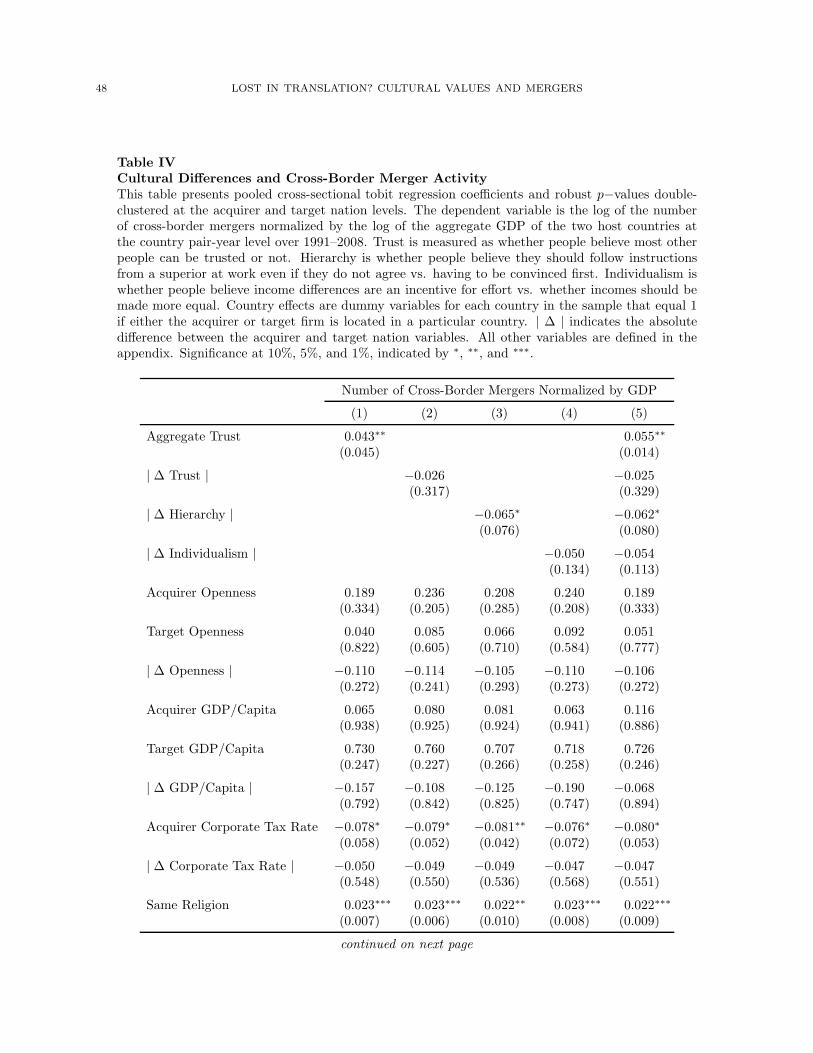
48 LOST IN TRANSLATION? CULTURAL VALUES AND MERGERS
Table IVCultural Differences and Cross-Border Merger ActivityThis table presents pooled cross-sectional tobit regression coefficients and robust p−values double-clustered at the acquirer and target nation levels. The dependent variable is the log of the numberof cross-border mergers normalized by the log of the aggregate GDP of the two host countries atthe country pair-year level over 1991–2008. Trust is measured as whether people believe most otherpeople can be trusted or not. Hierarchy is whether people believe they should follow instructionsfrom a superior at work even if they do not agree vs. having to be convinced first. Individualism iswhether people believe income differences are an incentive for effort vs. whether incomes should bemade more equal. Country effects are dummy variables for each country in the sample that equal 1if either the acquirer or target firm is located in a particular country. | ∆ | indicates the absolutedifference between the acquirer and target nation variables. All other variables are defined in theappendix. Significance at 10%, 5%, and 1%, indicated by ∗, ∗∗, and ∗∗∗.
Number of Cross-Border Mergers Normalized by GDP
(1) (2) (3) (4) (5)
Aggregate Trust 0.043∗∗ 0.055∗∗
(0.045) (0.014)
| ∆ Trust | −0.026 −0.025(0.317) (0.329)
| ∆ Hierarchy | −0.065∗ −0.062∗
(0.076) (0.080)
| ∆ Individualism | −0.050 −0.054(0.134) (0.113)
Acquirer Openness 0.189 0.236 0.208 0.240 0.189(0.334) (0.205) (0.285) (0.208) (0.333)
Target Openness 0.040 0.085 0.066 0.092 0.051(0.822) (0.605) (0.710) (0.584) (0.777)
| ∆ Openness | −0.110 −0.114 −0.105 −0.110 −0.106(0.272) (0.241) (0.293) (0.273) (0.272)
Acquirer GDP/Capita 0.065 0.080 0.081 0.063 0.116(0.938) (0.925) (0.924) (0.941) (0.886)
Target GDP/Capita 0.730 0.760 0.707 0.718 0.726(0.247) (0.227) (0.266) (0.258) (0.246)
| ∆ GDP/Capita | −0.157 −0.108 −0.125 −0.190 −0.068(0.792) (0.842) (0.825) (0.747) (0.894)
Acquirer Corporate Tax Rate −0.078∗ −0.079∗ −0.081∗∗ −0.076∗ −0.080∗
(0.058) (0.052) (0.042) (0.072) (0.053)
| ∆ Corporate Tax Rate | −0.050 −0.049 −0.049 −0.047 −0.047(0.548) (0.550) (0.536) (0.568) (0.551)
Same Religion 0.023∗∗∗ 0.023∗∗∗ 0.022∗∗ 0.023∗∗∗ 0.022∗∗∗
(0.007) (0.006) (0.010) (0.008) (0.009)
continued on next page

LOST IN TRANSLATION? CULTURAL VALUES AND MERGERS 49
Table IV - Continued
(1) (2) (3) (4) (5)
Same Language 0.038∗∗∗ 0.037∗∗∗ 0.037∗∗∗ 0.037∗∗∗ 0.037∗∗∗
(0.003) (0.003) (0.003) (0.003) (0.003)
Log(Geographic Distance) −0.051∗∗∗ −0.051∗∗∗ −0.051∗∗∗ −0.051∗∗∗ −0.051∗∗∗
(0.000) (0.000) (0.000) (0.000) (0.000)
Share Border 0.007∗ 0.007 0.007∗ 0.007∗∗ 0.006(0.092) (0.123) (0.096) (0.050) (0.116)
Exchange Rate Volatility −0.273∗∗ −0.268∗∗ −0.258∗∗ −0.262∗∗ −0.267∗∗
(0.015) (0.016) (0.018) (0.018) (0.016)
Exchange Rate Growth −0.023 −0.023 −0.022 −0.023 −0.022(0.121) (0.120) (0.142) (0.139) (0.136)
Double-Tax Treaty 0.008 0.008 0.008 0.008 0.008(0.272) (0.270) (0.272) (0.258) (0.240)
Bilateral Investment Treaty 0.006 0.006 0.006 0.006 0.006(0.377) (0.357) (0.415) (0.356) (0.402)
Same Legal System 0.056∗∗∗ 0.052∗∗∗ 0.058∗∗∗ 0.057∗∗∗ 0.054∗∗∗
(0.000) (0.000) (0.000) (0.000) (0.000)
| ∆ Shareholder Rights | −0.003 −0.003 −0.002 −0.003 −0.003(0.396) (0.345) (0.401) (0.389) (0.360)
| ∆ Public Enforcement | −0.003 −0.003 −0.004 −0.003 −0.004(0.625) (0.620) (0.579) (0.608) (0.550)
Constant 0.005 0.021 0.011 0.023 0.020(0.942) (0.730) (0.862) (0.712) (0.748)
Country Effects Yes Yes Yes Yes YesYear Fixed Effects Yes Yes Yes Yes YesLog likelihood 1041.435 1041.973 1046.443 1042.565 1053.051Constant only log likelihood −2752.770 −2752.770 −2752.770 −2752.770 −2752.770Observations 13,453 13,453 13,453 13,453 13,453

50 LOST IN TRANSLATION? CULTURAL VALUES AND MERGERS
Table VNational Culture and Combined Abnormal Returns in Domestic MergersThis table presents cross-sectional ordinary least squares regression coefficients and robust p−values,clustered at the country level. The dependent variable is the combined abnormal return of the targetand acquirer over the period (−1, +1) around the announcement, where returns are weighted bymarket values. Mergers include all public, private, and subsidiary targets where the transactionvalue is at least $1 million from SDC Thomson database in 1991–2008. Trust is measured as whetherpeople believe most other people can be trusted or not. Hierarchy is measured as whether peoplebelieve they should follow instructions from a superior at work even if they do not agree vs. havingto be convinced first. Individualism is measured as whether people believe income differences are anincentive for effort vs. whether incomes should be made more equal. All other variables are definedin the appendix. Significance at 10%, 5%, and 1%, indicated by ∗, ∗∗, and ∗∗∗.
Combined CAR(−1,+1)
(1) (2) (3) (4)
Trust 0.090∗∗∗ 0.091∗∗∗
(0.004) (0.002)
Hierarchy 0.031 0.013(0.418) (0.743)
Individualism 0.029 −0.013(0.604) (0.811)
Transaction Value 0.068 0.067 0.064 0.070(0.437) (0.441) (0.465) (0.417)
Relative Size 0.008∗∗∗ 0.008∗∗∗ 0.008∗∗∗ 0.008∗∗∗
(0.000) (0.000) (0.000) (0.000)
Acquirer Market Value −0.194∗∗∗ −0.199∗∗∗ −0.199∗∗∗ −0.194∗∗∗
(0.000) (0.000) (0.000) (0.000)
Majority Cash 0.021∗∗∗ 0.021∗∗∗ 0.021∗∗∗ 0.021∗∗∗
(0.000) (0.000) (0.000) (0.000)
Tender Offer 0.013∗∗∗ 0.014∗∗∗ 0.014∗∗∗ 0.013∗∗∗
(0.000) (0.000) (0.000) (0.000)
Friendly Offer 0.000 0.000 0.000 0.000(0.972) (0.963) (0.935) (0.959)
Same Industry −0.001 −0.001 −0.001 −0.001(0.514) (0.487) (0.494) (0.508)
Acquirer Termination Fee 0.004∗∗∗ 0.005∗∗∗ 0.005∗∗∗ 0.004∗∗∗
(0.001) (0.000) (0.000) (0.001)
Target Termination Fee −0.006∗∗∗ −0.007∗∗∗ −0.007∗∗∗ −0.007∗∗∗
(0.000) (0.000) (0.000) (0.000)
Target Defense −0.002 −0.002 −0.002 −0.002(0.227) (0.230) (0.240) (0.230)
continued on next page

LOST IN TRANSLATION? CULTURAL VALUES AND MERGERS 51
Table V - Continued
Combined CAR(−1,+1)
(1) (2) (3) (4)
Acquirer Past Return 0.000 0.000 0.000 0.000(0.958) (0.864) (0.857) (0.962)
Acquirer Past Volatility −0.002 −0.003 −0.003 −0.002(0.835) (0.747) (0.743) (0.839)
Target Past Return −0.001 −0.002 −0.002 −0.001(0.159) (0.152) (0.150) (0.160)
Target Past Volatility 0.045 0.046 0.044 0.046(0.368) (0.370) (0.382) (0.367)
Openness 0.000 0.000 0.000 0.000(0.866) (0.346) (0.213) (0.997)
French Legal System 0.014 0.005 0.005 0.014(0.105) (0.728) (0.710) (0.132)
German Legal System 0.018∗ 0.015 0.015 0.018∗
(0.056) (0.251) (0.255) (0.064)
Scandinavian Legal System 0.019 0.050∗∗∗ 0.047∗∗∗ 0.020(0.352) (0.005) (0.008) (0.265)
Shareholder Rights 0.001 0.000 0.000 0.001(0.725) (0.904) (0.996) (0.786)
Public Enforcement 0.018∗∗ 0.011 0.014 0.017∗
(0.041) (0.308) (0.214) (0.067)
GDP/Capita −0.464 −0.090 0.232 −0.613(0.243) (0.873) (0.618) (0.328)
Corporate Tax Rate 0.141∗∗ 0.069 0.071 0.140∗∗
(0.013) (0.292) (0.281) (0.011)
Constant −0.093∗∗∗ −0.032 −0.046 −0.087∗
(0.003) (0.264) (0.339) (0.050)
Year Fixed Effects Yes Yes Yes YesReligion Fixed Effects Yes Yes Yes YesAdjusted R2 0.083 0.081 0.081 0.082Observations 3,586 3,586 3,586 3,586

52 LOST IN TRANSLATION? CULTURAL VALUES AND MERGERS
Table VICultural Differences and Combined Abnormal Returns in Cross-Border MergersThis table presents cross-sectional ordinary least squares regression coefficients and robust p−values, double-clustered at the acquirer and target country levels. The dependent variable is the combined abnormal returnof the target and acquirer over the period (−1, +1) around the announcement, where returns are weightedby market values. Trust is measured as whether people believe most other people can be trusted or not.Hierarchy is whether people believe they should follow instructions from a superior at work even if they donot agree vs. having to be convinced first. Individualism is whether people believe income differences are anincentive for effort vs. whether incomes should be made more equal. Country effects are dummy variablesfor each country in the sample that equal 1 if either the acquirer or target firm is located in a particularcountry. | ∆ | is the absolute difference between acquiror and target nation. All other variables are definedin the appendix. Significance at 10%, 5%, and 1%, indicated by ∗, ∗∗, and ∗∗∗.
Combined CAR(−1,+1)
(1) (2) (3) (4) (5)
Aggregate Trust −0.017 0.007(0.492) (0.586)
| ∆ Trust | −0.018 0.001(0.292) (0.963)
| ∆ Hierarchy | −0.009 0.004(0.836) (0.914)
| ∆ Individualism | −0.133∗∗∗ −0.135∗∗∗
(0.002) (0.005)
Transaction Value 0.068 0.071 0.073 0.051 0.049(0.791) (0.776) (0.792) (0.823) (0.846)
Relative Size 0.010∗∗∗ 0.010∗∗∗ 0.010∗∗∗ 0.010∗∗∗ 0.010∗∗∗
(0.000) (0.000) (0.000) (0.000) (0.000)Acquirer Market Value −0.507 −0.508 −0.507 −0.509 −0.509
(0.157) (0.157) (0.157) (0.155) (0.158)Majority Cash 0.018∗∗ 0.018∗∗ 0.018∗∗ 0.018∗∗ 0.018∗∗
(0.030) (0.032) (0.027) (0.034) (0.033)Tender Offer 0.006∗ 0.006∗ 0.006∗ 0.006 0.006
(0.090) (0.098) (0.083) (0.116) (0.105)Friendly Offer 0.003 0.003 0.003 0.003 0.003
(0.682) (0.677) (0.684) (0.718) (0.717)Same Industry −0.003 −0.003 −0.003 −0.003 −0.003
(0.528) (0.520) (0.522) (0.465) (0.478)Acquirer Termination Fee −0.008 −0.008 −0.008 −0.009 −0.009
(0.283) (0.286) (0.295) (0.286) (0.278)Target Termination Fee 0.001 0.001 0.001 0.002 0.002
(0.905) (0.908) (0.893) (0.732) (0.725)Target Defense 0.002 0.002 0.002 0.002 0.002
(0.785) (0.770) (0.796) (0.764) (0.766)Acquirer Past Return 0.000 0.000 0.000 0.000 0.000
(0.557) (0.578) (0.574) (0.704) (0.688)Acquirer Past Volatility −0.010∗∗∗ −0.010∗∗∗ −0.010∗∗∗ −0.009∗∗∗ −0.009∗∗∗
(0.000) (0.000) (0.000) (0.000) (0.000)Target Past Return −0.005 −0.004 −0.004 −0.005 −0.005
(0.141) (0.142) (0.145) (0.119) (0.115)Target Past Volatility 0.037∗∗ 0.036∗∗ 0.036∗∗ 0.036∗∗∗ 0.036∗∗
(0.011) (0.011) (0.020) (0.009) (0.017)
continued on next page

LOST IN TRANSLATION? CULTURAL VALUES AND MERGERS 53
Table VI - Continued
Combined CAR(−1,+1)
(1) (2) (3) (4) (5)
Acquirer Openness 0.000 0.000 0.000 0.000 0.000(0.828) (0.799) (0.743) (0.886) (0.871)
Target Openness 0.000 0.000 0.000 0.000 0.000(0.783) (0.748) (0.700) (0.855) (0.843)
| ∆ Openness | −0.309∗∗ −0.309∗∗ −0.308∗∗ −0.302∗∗ −0.303∗∗
(0.024) (0.023) (0.025) (0.023) (0.024)Acquirer GDP/Capita −0.421 −0.356 −0.403 −0.491 −0.487
(0.794) (0.828) (0.801) (0.750) (0.755)Target GDP/Capita 1.313 1.370 1.349 1.259 1.265
(0.440) (0.426) (0.426) (0.445) (0.440)| ∆ GDP/Capita | −0.881∗∗∗ −0.795∗∗ −0.894∗∗∗ −0.951∗∗∗ −0.968∗∗∗
(0.000) (0.014) (0.000) (0.001) (0.010)Acquirer Corporate Tax Rate 0.002 0.002 0.002 0.003 0.003
(0.281) (0.256) (0.265) (0.218) (0.225)Target Corporate Tax Rate 0.002 0.002 0.002 0.002 0.002
(0.312) (0.280) (0.296) (0.239) (0.247)| ∆ Corporate Tax Rate | 0.000 0.000 0.000 0.000 0.000
(0.765) (0.760) (0.778) (0.762) (0.764)Same Religion −0.005 −0.004 −0.005 −0.003 −0.003
(0.525) (0.541) (0.498) (0.666) (0.692)Same Language 0.008 0.007 0.008 0.003 0.003
(0.641) (0.650) (0.650) (0.835) (0.851)Log(Geographic Distance) −0.002 −0.002 −0.002 −0.003 −0.003
(0.751) (0.774) (0.794) (0.716) (0.732)Share Border 0.012 0.012 0.012∗ 0.009 0.010
(0.115) (0.100) (0.090) (0.210) (0.228)Exchange Rate Volatility 0.192 0.187 0.200 0.154 0.153
(0.575) (0.579) (0.552) (0.669) (0.668)Exchange Rate Growth 0.000 0.000 0.000 0.002 0.002
(0.995) (0.995) (0.995) (0.919) (0.915)Double-Tax Treaty 0.010 0.010 0.010 0.012 0.012
(0.484) (0.465) (0.462) (0.362) (0.350)Bilateral Investment Treaty 0.015 0.015 0.015 0.014 0.014
(0.293) (0.323) (0.270) (0.316) (0.295)Same Legal System 0.009 0.007 0.010 0.015 0.015
(0.434) (0.597) (0.415) (0.266) (0.342)| ∆ Shareholder Rights | 0.003 0.003 0.003 0.003 0.003
(0.471) (0.470) (0.474) (0.567) (0.571)| ∆ Public Enforcement | 0.015∗∗ 0.015∗∗ 0.015∗∗ 0.019∗∗ 0.019∗∗
(0.042) (0.046) (0.041) (0.017) (0.014)Heckman’s Lambda 0.031 0.031 0.031 0.032 0.032
(0.190) (0.188) (0.197) (0.182) (0.189)Constant −0.043 −0.049 −0.042 −0.053 −0.057
(0.822) (0.798) (0.818) (0.782) (0.767)Year Fixed Effects Yes Yes Yes Yes YesCountry Effects Yes Yes Yes Yes YesAdjusted R2 0.127 0.128 0.127 0.131 0.128Observations 815 815 815 815 815

54 LOST IN TRANSLATION? CULTURAL VALUES AND MERGERS
Table VIICulture and the Division of Merger GainsThis table presents cross-sectional ordinary least squares regression coefficients and robust p−values, double-clustered
at the acquirer and target country levels. The dependent variable is the $ value of acquirer abnormal returns in (−1, +1)minus the $ value of target abnormal returns in (−1, +1) normalized by the sum of the market values of the acquirerand target 10 days before the announcement. Mergers include 938 cross-border mergers of public targets where thetransaction value is at least $1 million from 1991–2008. Trust is measured as whether people believe most other peoplecan be trusted or not. Hierarchy is measured as whether people believe they should follow instructions from a superiorat work even if they do not agree vs. having to be convinced first. Individualism is measured as whether people believeincome differences are an incentive for effort vs. whether incomes should be made more equal. Country effects aredummy variables for each country that equal 1 if either the acquirer or target firm is located in a particular country.∆ indicates the acquirer nation value minus the target nation value. All other variables are defined in the appendix.Significance at 10%, 5%, and 1%, indicated by ∗, ∗∗, and ∗∗∗.
Acquirer’s Gain Relative to Target’s Gain
(1) (2) (3) (4) (5)
∆ Trust 0.085∗∗∗ 0.088∗∗∗ 0.080∗∗∗
(0.000) (0.000) (0.000)
∆ Hierarchy 0.047∗∗∗ 0.027∗ 0.021∗∗
(0.004) (0.084) (0.045)
∆ Individualism 0.024 −0.033 −0.029(0.432) (0.196) (0.377)
∆ Trust × Relative Size 0.010(0.331)
∆ Hierarchy × Relative Size 0.005(0.526)
∆ Individualism × Relative Size −0.003(0.912)
Transaction Value −0.242 −0.223 −0.212 −0.251 −0.261∗
(0.235) (0.266) (0.288) (0.213) (0.085)Relative Size −0.011∗∗∗ −0.011∗∗∗ −0.011∗∗∗ −0.011∗∗∗ −0.011∗∗∗
(0.000) (0.000) (0.000) (0.000) (0.000)Acquirer Market Value 0.176 0.192 0.183 0.182 0.173
(0.235) (0.206) (0.221) (0.222) (0.227)Majority Cash 0.017 0.020 0.018 0.017 0.017
(0.160) (0.103) (0.128) (0.149) (0.150)Tender Offer −0.007∗∗∗ −0.010∗∗∗ −0.010∗∗∗ −0.008∗∗∗ −0.008∗∗∗
(0.001) (0.002) (0.003) (0.000) (0.000)Friendly Offer 0.002 0.005 0.005 0.002 0.002
(0.825) (0.585) (0.576) (0.836) (0.799)Same Industry 0.006∗ 0.006∗∗ 0.006∗∗ 0.006∗ 0.006∗
(0.061) (0.046) (0.041) (0.064) (0.080)Acquirer Termination Fee 0.007 0.004 0.005 0.006 0.008
(0.322) (0.601) (0.556) (0.379) (0.249)Target Termination Fee 0.004 0.006 0.004 0.005 0.005
(0.386) (0.170) (0.382) (0.277) (0.331)Target Defense 0.005 0.004 0.004 0.005 0.006
(0.376) (0.556) (0.533) (0.373) (0.405)Acquirer Past Return 0.000 0.000 0.000 0.000 0.000
(0.627) (0.682) (0.907) (0.740) (0.833)
continued on next page

LOST IN TRANSLATION? CULTURAL VALUES AND MERGERS 55
Table VII - Continued
Acquirer’s Gain Relative to Target’s Gain
(1) (2) (3) (4) (5)
Acquirer Past Volatility 0.003 0.004 0.003 0.003 0.003(0.528) (0.385) (0.429) (0.515) (0.553)
Target Past Return 0.006∗∗ 0.006∗ 0.006∗ 0.006∗ 0.006∗
(0.047) (0.064) (0.059) (0.051) (0.067)Target Past Volatility −0.036∗∗ −0.032∗ −0.031∗ −0.036∗∗ −0.037∗∗
(0.039) (0.091) (0.084) (0.038) (0.035)Acquirer Openness 0.000 0.000 0.000 −0.001 0.000
(0.483) (0.903) (0.965) (0.419) (0.480)∆ Openness 0.000 0.000 0.000 0.000 0.000
(0.606) (0.878) (0.963) (0.472) (0.543)Acquirer GDP/Capita −1.084 −0.629 −0.173 −1.543 −1.759
(0.738) (0.850) (0.959) (0.600) (0.562)∆ GDP/Capita 0.000 0.000 0.000 0.000 0.000
(0.585) (0.654) (0.591) (0.539) (0.503)Acquirer Corporate Tax Rate 0.002 −0.001 0.001 0.000 0.000
(0.514) (0.891) (0.767) (0.921) (0.915)∆ Corporate Tax Rate −0.001 0.000 −0.001 0.000 0.000
(0.577) (0.937) (0.702) (0.989) (0.995)Same Religion 0.005 0.003 0.003 0.005 0.006
(0.150) (0.475) (0.429) (0.151) (0.150)Same Language −0.004 −0.002 −0.003 −0.004 −0.004
(0.527) (0.687) (0.704) (0.470) (0.478)Log(Geographic Distance) 0.010∗∗ 0.011∗∗ 0.010∗∗ 0.010∗∗ 0.010∗∗
(0.027) (0.038) (0.042) (0.025) (0.024)Share Border 0.000 0.006 0.006 0.001 0.000
(0.983) (0.435) (0.493) (0.928) (0.981)Exchange Rate Volatility −0.039 0.080 0.079 −0.044 −0.024
(0.881) (0.749) (0.760) (0.861) (0.925)Exchange Rate Growth −0.018 −0.016 −0.015 −0.018 −0.018
(0.508) (0.584) (0.601) (0.507) (0.511)Double-Tax Treaty −0.019 −0.016 −0.017 −0.018 −0.019
(0.273) (0.391) (0.363) (0.316) (0.310)Bilateral Investment Treaty −0.019∗ −0.014 −0.012 −0.021∗ −0.021∗
(0.099) (0.248) (0.368) (0.071) (0.065)Same Legal System −0.022∗∗ −0.027 −0.028 −0.022∗ −0.023∗∗
(0.046) (0.134) (0.121) (0.055) (0.035)∆ Shareholder Rights 0.000 −0.002 −0.001 −0.001 −0.001
(0.836) (0.370) (0.764) (0.558) (0.543)∆ Public Enforcement −0.008 −0.010 −0.009 −0.010∗ −0.010∗
(0.124) (0.148) (0.225) (0.089) (0.057)Heckman’s Lambda −0.030 −0.029 −0.030 −0.030 −0.031∗
(0.108) (0.133) (0.129) (0.114) (0.095)Constant 0.032 0.036 −0.028 0.085 0.090
(0.797) (0.840) (0.852) (0.507) (0.486)Year Fixed Effects Yes Yes Yes Yes YesCountry Effects Yes Yes Yes Yes YesAdjusted R2 0.186 0.167 0.164 0.185 0.185Observations 815 815 815 815 815
*

56
LO
ST
INT
RA
NSLAT
ION
?C
ULT
UR
AL
VA
LU
ES
AN
DM
ER
GE
RS
Table VIIIDeal Characteristics by Cultural ValuesThis table presents univariate tests of differences in deal characteristics between cultural values. Entries in the ‘All’ column are the average of the deal characteristicfor all deals. Entries in the ‘High’ (‘Low’) column are the average when the cultural value is above (below) the median. Statistical significance is indicated by thep−value of a t−test assuming unequal variances. Asterisks on entries in the ‘All’ column reflect statistical significance between domestic and cross-border mergers.Observations are 4,508 domestic and 938 cross-border mergers. Trust is measured as whether people believe most other people can be trusted or not. Hierarchy ismeasured as whether people believe they should follow instructions from a superior at work even if they do not agree vs. having to be convinced first. Individualismis measured as whether people believe income differences are an incentive for effort vs. whether incomes should be made more equal. Aggregate Trust is the sum ofeach country’s trust score in a cross-border merger. ∆ indicates the acquirer nation value minus the target nation value. All variables are defined in the appendix.Significance at 10%, 5%, and 1%, indicated by ∗, ∗∗, and ∗∗∗.
Panel A: Domestic Mergers
All Trust Hierarchy Individualism
High Low p−value High Low p−value High Low p−value
Acquirer CAR(−1,+1) −0.705∗∗∗ 0.156 −1.194 (0.000)∗∗∗ −1.340 −0.251 (0.000)∗∗∗ −0.262 −0.859 (0.003)∗∗∗
Target CAR(−1,+1) 16.439 14.219 17.701 (0.000)∗∗∗ 20.164 13.782 (0.000)∗∗∗ 15.315 16.832 (0.014)∗∗
Combined CAR(−1,+1) 1.851∗∗∗ 2.312 1.589 (0.000)∗∗∗ 1.539 2.073 (0.005)∗∗∗ 1.968 1.810 (0.452)
Acq. gain r.t. tar. −2.973 −2.237 −3.392 (0.000)∗∗∗ −3.609 −2.520 (0.000)∗∗∗ −2.497 −3.140 (0.001)∗∗∗
Premium 0.383 0.184 0.496 (0.189) 0.297 0.445 (0.569) 0.198 0.448 (0.223)Transaction Value 1.366∗∗ 0.575 1.815 (0.000)∗∗∗ 1.443 1.310 (0.437) 0.730 1.588 (0.000)∗∗∗
Relative Size 0.486∗∗∗ 0.440 0.512 (0.041)∗∗ 0.385 0.557 (0.000)∗∗∗ 0.458 0.495 (0.301)All Cash 0.342∗∗∗ 0.340 0.343 (0.849) 0.332 0.349 (0.224) 0.358 0.336 (0.174)Tender Offer 0.226∗∗∗ 0.256 0.208 (0.000)∗∗∗ 0.138 0.288 (0.000)∗∗∗ 0.234 0.223 (0.467)Friendly 0.955∗∗∗ 0.942 0.962 (0.003)∗∗∗ 0.976 0.940 (0.000)∗∗∗ 0.944 0.959 (0.042)∗∗
Same Industry 0.493 0.433 0.527 (0.000)∗∗∗ 0.534 0.464 (0.000)∗∗∗ 0.453 0.507 (0.001)∗∗∗
Days to Completion 141.888∗∗∗ 151.165 136.613 (0.001)∗∗∗ 153.159 133.846 (0.000)∗∗∗ 156.495 136.773 (0.000)∗∗∗
Financial Acquirer 0.025 0.019 0.028 (0.044)∗∗ 0.020 0.029 (0.054)∗ 0.021 0.026 (0.355)Merger of Equals 0.021∗∗∗ 0.017 0.024 (0.079)∗ 0.024 0.019 (0.301) 0.017 0.023 (0.218)Acq. Termination Fee 0.130∗∗∗ 0.061 0.169 (0.000)∗∗∗ 0.169 0.101 (0.000)∗∗∗ 0.062 0.153 (0.000)∗∗∗
Target Term. Fee 0.420∗∗∗ 0.179 0.558 (0.000)∗∗∗ 0.598 0.294 (0.000)∗∗∗ 0.211 0.494 (0.000)∗∗∗
Target Defense 0.141∗∗∗ 0.140 0.141 (0.917) 0.148 0.136 (0.277) 0.195 0.122 (0.000)∗∗∗
Panel B: Cross-Border Mergers
All Aggregate Trust ∆ Trust ∆ Hierarchy ∆ Individualism
High Low p−value High Low p−value High Low p−value High Low p−value
Acquirer CAR(−1,+1) 0.031∗∗∗ −0.296 0.357 (0.077)∗ 0.466 −0.374 (0.023)∗∗ −0.084 0.145 (0.535) 0.183 −0.119 (0.414)
Target CAR(−1,+1) 16.722 17.911 15.538 (0.049)∗∗ 15.433 17.921 (0.039)∗∗ 13.910 19.534 (0.000)∗∗∗ 16.888 16.558 (0.785)
Combined CAR(−1,+1) 3.463∗∗∗ 3.114 3.810 (0.156) 3.387 3.533 (0.765) 2.412 4.513 (0.000)∗∗∗ 3.086 3.836 (0.126)
Acq. Gain r.t. tar. −3.363 −3.517 −3.211 (0.534) −2.535 −4.134 (0.001)∗∗∗ −2.432 −4.295 (0.000)∗∗∗ −2.855 −3.867 (0.039)∗∗
Premium 0.235 0.203 0.266 (0.159) 0.264 0.207 (0.224) 0.176 0.293 (0.009)∗∗∗ 0.251 0.219 (0.477)Transaction Value 2.020∗∗ 1.510 2.527 (0.061)∗ 1.670 2.345 (0.205) 1.687 2.352 (0.222) 1.941 2.097 (0.775)Relative Size 0.806∗∗∗ 0.747 0.864 (0.369) 0.860 0.755 (0.429) 0.613 0.998 (0.003)∗∗∗ 0.712 0.898 (0.154)All Cash 0.786∗∗∗ 0.748 0.823 (0.005)∗∗∗ 0.810 0.763 (0.083)∗ 0.761 0.810 (0.067)∗ 0.773 0.798 (0.346)Tender Offer 0.534∗∗∗ 0.506 0.562 (0.090)∗ 0.527 0.541 (0.655) 0.588 0.480 (0.001)∗∗∗ 0.540 0.529 (0.737)Friendly 0.903∗∗∗ 0.919 0.887 (0.103) 0.916 0.891 (0.195) 0.876 0.930 (0.006)∗∗∗ 0.899 0.907 (0.709)Same Industry 0.512 0.502 0.521 (0.558) 0.504 0.519 (0.667) 0.548 0.475 (0.026)∗∗ 0.478 0.546 (0.037)∗∗
Days to Completion 121.957∗∗∗ 120.669 123.240 (0.739) 113.763 129.578 (0.040)∗∗ 122.079 121.836 (0.975) 123.405 120.522 (0.709)Financial Acquirer 0.022 0.021 0.023 (0.833) 0.022 0.023 (0.958) 0.026 0.019 (0.508) 0.017 0.028 (0.279)Merger of Equals 0.005∗∗∗ 0.006 0.004 (0.651) 0.000 0.010 (0.025)∗∗ 0.004 0.006 (0.654) 0.002 0.008 (0.181)Acq. Termination Fee 0.061∗∗∗ 0.077 0.045 (0.039)∗∗ 0.055 0.066 (0.499) 0.028 0.094 (0.000)∗∗∗ 0.043 0.079 (0.022)∗∗
Target Term. Fee 0.290∗∗∗ 0.338 0.243 (0.001)∗∗∗ 0.261 0.317 (0.059)∗ 0.090 0.490 (0.000)∗∗∗ 0.231 0.348 (0.000)∗∗∗
Target Defense 0.033∗∗∗ 0.034 0.032 (0.846) 0.029 0.037 (0.477) 0.011 0.055 (0.000)∗∗∗ 0.032 0.034 (0.874)

LOST IN TRANSLATION? CULTURAL VALUES AND MERGERS 57
Table IXNational Culture and Deal StructureThis table presents cross-sectional logit regression coefficients and robust p−values, double-clustered at the acquirerand target country levels where observations are cross-border mergers. The dependent variable in columns 1 & 2 is adummy variable equal to 1 if the merger payment is all cash and 0 otherwise, in columns 3 & 4, a dummy variableequal to 1 if the merger includes a target termination fee, and in columns 5 & 6, a dummy variable equal to 1 ifthe merger was a tender offer. Trust is measured as whether people believe most other people can be trusted or not.Hierarchy is whether people believe they should follow instructions from a superior at work even if they do not agreevs. having to be convinced first. Individualism is whether people believe income differences are an incentive for effortvs. whether incomes should be made more equal. Country effects are dummy variables for each country that equal 1if either the acquirer or target firm is located in a particular country. ∆ indicates the acquirer nation value minus thetarget nation value. | ∆ | is the absolute difference between acquiror and target nation. All other variables are definedin the appendix. Significance at 10%, 5%, and 1%, indicated by ∗, ∗∗, and ∗∗∗.
All Cash Target Termination Fee Tender Offer
(1) (2) (3) (4) (5) (6)
∆ Trust 1.681 −0.156 −2.290∗∗∗
(0.139) (0.809) (0.000)∆ Hierarchy −3.203∗∗ −4.818∗ 2.405∗∗∗
(0.015) (0.065) (0.000)∆ Individualism −2.653∗∗∗ 0.623 0.504
(0.008) (0.573) (0.441)Acquirer Trust −4.626 0.036 −1.684
(0.223) (0.989) (0.284)Target Trust −7.514∗∗ 0.168 2.876∗∗∗
(0.023) (0.951) (0.003)Acquirer Hierarchy 0.146 1.575 2.820∗∗
(0.961) (0.633) (0.036)Target Hierarchy 7.042∗ 17.493∗∗ −1.943
(0.082) (0.017) (0.309)Acquirer Individualism 2.599 2.886 0.369
(0.373) (0.174) (0.772)Target Individualism 7.413∗∗∗ 2.776∗∗ −0.576
(0.000) (0.018) (0.803)Transaction Value −152.102∗∗∗ −152.133∗∗∗ 0.326 3.252 22.155∗ 22.381
(0.000) (0.000) (0.982) (0.856) (0.093) (0.101)Relative Size −0.013 −0.023 0.003 −0.013 −0.033∗∗∗ −0.033∗∗∗
(0.880) (0.802) (0.885) (0.560) (0.001) (0.002)Acquirer Market Value −2.262 −2.742 12.047∗∗∗ 11.212∗∗∗ −3.848 −3.872
(0.454) (0.393) (0.000) (0.000) (0.221) (0.207)Cash dummy −0.588 −0.609 0.735∗ 0.736∗
(0.297) (0.312) (0.067) (0.068)Tender Offer 0.874∗ 0.870∗ 0.711∗∗∗ 0.706∗∗∗
(0.068) (0.061) (0.000) (0.000)Friendly Offer −1.039∗∗∗ −1.070∗∗∗ 1.394∗ 1.426∗ 0.237 0.239
(0.000) (0.000) (0.062) (0.062) (0.571) (0.568)Same Industry −0.702∗∗∗ −0.680∗∗∗ −0.003 −0.054 −0.015 −0.016
(0.001) (0.001) (0.963) (0.409) (0.928) (0.922)Acquirer Termination Fee −1.169∗∗∗ −1.136∗∗∗ 6.382∗∗∗ 6.461∗∗∗ −1.591∗∗∗ −1.599∗∗∗
(0.000) (0.000) (0.000) (0.000) (0.001) (0.001)Target Termination Fee −0.171 −0.176 0.292∗ 0.293∗
(0.751) (0.735) (0.093) (0.080)Target Defense −0.468 −0.427 0.369∗ 0.391 0.168 0.165
(0.126) (0.157) (0.098) (0.142) (0.636) (0.641)Acquirer Past Return 0.112 0.124 −0.270∗∗∗ −0.273∗∗∗ −0.179 −0.180
(0.846) (0.811) (0.000) (0.000) (0.392) (0.393)Acquirer Past Volatility −1.482 −1.577 3.270∗∗∗ 3.378∗∗∗ −0.327 −0.303
(0.795) (0.756) (0.000) (0.000) (0.918) (0.922)
continued on next page

58 LOST IN TRANSLATION? CULTURAL VALUES AND MERGERS
Table IX - Continued
All Cash Target Termination Fee Tender Offer
(1) (2) (3) (4) (5) (6)
Target Past Return 0.212∗ 0.221 0.507∗∗∗ 0.545∗∗∗ 0.078 0.080(0.062) (0.107) (0.001) (0.001) (0.468) (0.458)
Target Past Volatility −7.996∗ −7.813∗ 1.061 1.006 −1.175 −1.188(0.060) (0.091) (0.537) (0.551) (0.280) (0.264)
Acquirer Openness 0.037∗ 0.053∗∗ −0.087∗∗∗ −0.103∗∗∗ 0.016∗ 0.014∗
(0.086) (0.041) (0.001) (0.001) (0.093) (0.091)Target Openness 0.031 0.046∗ −0.091∗∗∗ −0.096∗∗∗ 0.012∗∗ 0.010∗∗
(0.128) (0.064) (0.000) (0.000) (0.016) (0.032)| ∆ Openness | −8.507 −9.132 36.017∗∗ 32.299∗∗ 2.533∗∗ 2.514∗∗
(0.487) (0.464) (0.024) (0.043) (0.013) (0.011)Acquirer GDP/Capita 145.594 163.253 −68.706 −12.874 −133.230 −132.100
(0.160) (0.178) (0.608) (0.924) (0.804) (0.745)Target GDP/Capita 160.487 161.972 66.517 37.113 −167.938∗∗∗ −166.836∗∗∗
(0.120) (0.130) (0.742) (0.820) (0.000) (0.000)| ∆ GDP/Capita | −52.792∗∗ −59.093∗∗∗ 146.059∗∗∗ 164.434∗ 38.558∗∗ 37.621∗
(0.021) (0.004) (0.001) (0.065) (0.048) (0.054)Acquirer Corporate Tax Rate −0.383∗∗∗ −0.491∗∗∗ 1.690∗∗∗ 1.826∗∗∗ −0.291∗∗∗ −0.277∗∗∗
(0.000) (0.000) (0.000) (0.000) (0.000) (0.000)Target Corporate Tax Rate −0.387∗∗∗ −0.492∗∗∗ 1.716∗∗∗ 1.886∗∗∗ −0.268∗∗∗ −0.255∗∗∗
(0.000) (0.000) (0.000) (0.000) (0.000) (0.000)| ∆ Corporate Tax Rate | −0.073∗ −0.085∗∗ 0.243∗∗∗ 0.260∗∗∗ 0.032∗∗ 0.032∗∗
(0.072) (0.037) (0.003) (0.009) (0.013) (0.016)Same Religion −0.514 −0.405 0.087 0.090 −0.095 −0.093
(0.763) (0.765) (0.848) (0.863) (0.564) (0.567)Same Language 1.106 1.096∗ −42.840∗∗∗ −43.527∗∗∗ −0.925∗∗∗ −0.936∗∗∗
(0.101) (0.090) (0.000) (0.000) (0.002) (0.003)Log(Geographic Distance) −0.120 −0.116 0.090 0.113 0.013 0.017
(0.686) (0.694) (0.924) (0.907) (0.945) (0.931)Share Border −1.092∗ −1.112∗ −0.923 −0.906 0.406 0.424
(0.081) (0.088) (0.682) (0.727) (0.431) (0.398)Exchange Rate Volatility 10.974 8.898 −47.920 −57.478 −8.309 −8.381
(0.451) (0.553) (0.174) (0.140) (0.528) (0.534)Exchange Rate Growth −0.455 −0.385 −0.185 0.010 2.283∗∗∗ 2.274∗∗∗
(0.538) (0.494) (0.874) (0.994) (0.000) (0.000)Double-Tax Treaty 1.063 1.008 0.431 0.439
(0.243) (0.270) (0.347) (0.366)
Bilateral Investment Treaty −0.029 0.026 −18.065∗∗∗ −18.538∗ −0.589 −0.584(0.976) (0.976) (0.000) (0.069) (0.521) (0.522)
Same Legal System 0.893∗∗ 0.771 −13.835∗∗∗ −18.032∗∗∗ 0.166 0.169(0.028) (0.139) (0.000) (0.000) (0.707) (0.707)
| ∆ Shareholder Rights | 0.286∗ 0.295∗ −0.363 −0.217 −0.067 −0.068(0.099) (0.085) (0.537) (0.757) (0.420) (0.421)
| ∆ Public Enforcement | −0.533 −0.533 −1.949∗ −1.833∗ 0.075 0.075(0.206) (0.205) (0.063) (0.074) (0.757) (0.747)
Heckman’s Lambda 0.353 0.182 −0.788 −0.299 0.823∗∗ 0.832∗∗
(0.322) (0.663) (0.701) (0.878) (0.036) (0.038)Constant 8.143 6.476 −78.769∗∗ −92.499∗∗ 7.060∗∗∗ 6.045∗∗
(0.150) (0.361) (0.012) (0.023) (0.002) (0.013)Year Fixed Effects Yes Yes Yes Yes Yes YesCountry Effects Yes Yes Yes Yes Yes YesPseudo R2 0.291 0.297 0.585 0.589 0.154 0.154Observations 778 778 766 766 873 873

LOST IN TRANSLATION? CULTURAL VALUES AND MERGERS 1
Internet Appendix
Lost In Translation? The Effect of Cultural Values on Mergers Around the World
This internet appendix presents additional tables of robustness checks. Each table refers to atable in the article and the regressions are identical to the main regressions except for new variablesor data filters. Alternative cultural variables used in robustness checks and the methodology oflong-run returns are described below.
A. List of Tables
The following provides a correspondence between the tables in the main paper, the internetappendix, and the robustness test of the internet appendix table.
InternetAppendix
Main Paper Robustness
Table IA.I Table III Exclude U.S. FirmsTable IA.II Table IV Exclude U.S. FirmsTable IA.III Tables V, VI, & VII Exclude U.S. FirmsTable IA.IV Table IX Exclude U.S. Firms
Table IA.V Table III Alternative Cultural Dimensions: SchwartzTable IA.VI Table III Alternative Cultural Dimensions: HofstedeTable IA.VII Table IV Alternative Cultural Dimensions: SchwartzTable IA.VIII Table IV Alternative Cultural Dimensions: HofstedeTable IA.IX Table V Alternative Cultural Dimensions: Hofstede & SchwartzTable IA.X Table VI Alternative Cultural Dimensions: Hofstede & SchwartzTable IA.XI Table VII Alternative Cultural Dimensions: Hofstede & SchwartzTable IA.XII Table IX Alternative Cultural Dimensions: Hofstede & Schwartz
Table IA.XIII Table III Alternative Measure of Dependent VariableTable IA.XIV Table IV Alternative Measure of Dependent Variable
Table IA.XV Table V Acquirer BHAR Using the World BenchmarkTable IA.XVI Table V Acquirer BHAR Using Country BenchmarksTable IA.XVII Table VI Acquirer BHAR Using the World BenchmarkTable IA.XVIII Table VI Acquirer BHAR Using Country Benchmarks
B. Alternative Cultural Values
The Hofstede (1980, 2001) dimensions of national culture:
(1) Power distance: the extent to which societies expect that power is distributed unequally
(similar to the hierarchy dimension from the World Value Survey that is used in the main
paper)

2 LOST IN TRANSLATION? CULTURAL VALUES AND MERGERS
(2) Individualism: the extent to which people identify themselves as separate from their social
group (similar to the individualism dimension from the World Value Survey that is used in
the main paper)
(3) Masculinity: the extent to which a society holds values traditionally identified as mascu-
line: assertiveness, materialism, and not caring for others
(4) Uncertainty Avoidance: the extent to which a society feels threatened by uncertainty
(5) Long-term orientation: the importance a society places on the future versus the past or
present
The Schwartz (1994) dimensions of national culture:
(1) Egalitarianism versus Hierarchy: Egalitarian societies believe individuals are more or
less equal, whereas Hierarchical societies believe some individuals have greater social rank
than others (similar to the hierarchy dimension from the World Value Survey that is used
in the main paper)
(2) Mastery versus Harmony: Mastery is an emphasis on dominating an environment
through assertion and harmony refers to finding one’s place in an existing environment
(3) Embeddedness versus Autonomy: Embedded cultures believe the identity of individ-
uals should be tied to the social group, whereas autonomous societies believe identities
are unique to the individual (similar to the individualism dimension from the World Value
Survey that is used in the main paper) environment.
C. Long-Run Returns Methodology
For each deal in the sample we calculate the long-run buy-and-hold abnormal return (BHAR)
to an acquirer as follows. We collect monthly returns for every firm covered by Compustat Global
or CRSP, using the security issue with the highest cumulative trading volume if multiple securities
for the same firm are observed. For each firm we calculate abnormal returns as the difference
between the firm’s 36 month cumulative return and either a world benchmark or a country-level
benchmark. The world benchmark is formed using a 3×3×3 sorting of market equity, book-to-
market, and momentum across all firms in the world, excluding the firm. The country benchmark
forms the benchmark portfolios using only returns in the same country as the firm. In the sample of
LOST IN TRANSLATION? CULTURAL VALUES AND MERGERS 3
mergers, we omit any acquirer if it makes a subsequent acquisition in the following 36 months. This
way we do not double-count the same firm. We use the 36-month BHAR which starts in the first
month after the acquisition is completed. These abnormal long-run returns are the observations of
our dependent variable in our robustness tests.
D. Additional notes
1. Table IA.IV does not include robustness checks for the likelihood of target termination fees
because when U.S. firms are excluded, the sample size drops to 104 and the regressions can not
be identified.
2. Table IA.XIV only includes a robustness check where the dependent variable of merger activity
is defined using the value of all deals worth at least $1 million. The tobit models using higher
thresholds of $10 and $100 million did not converge.
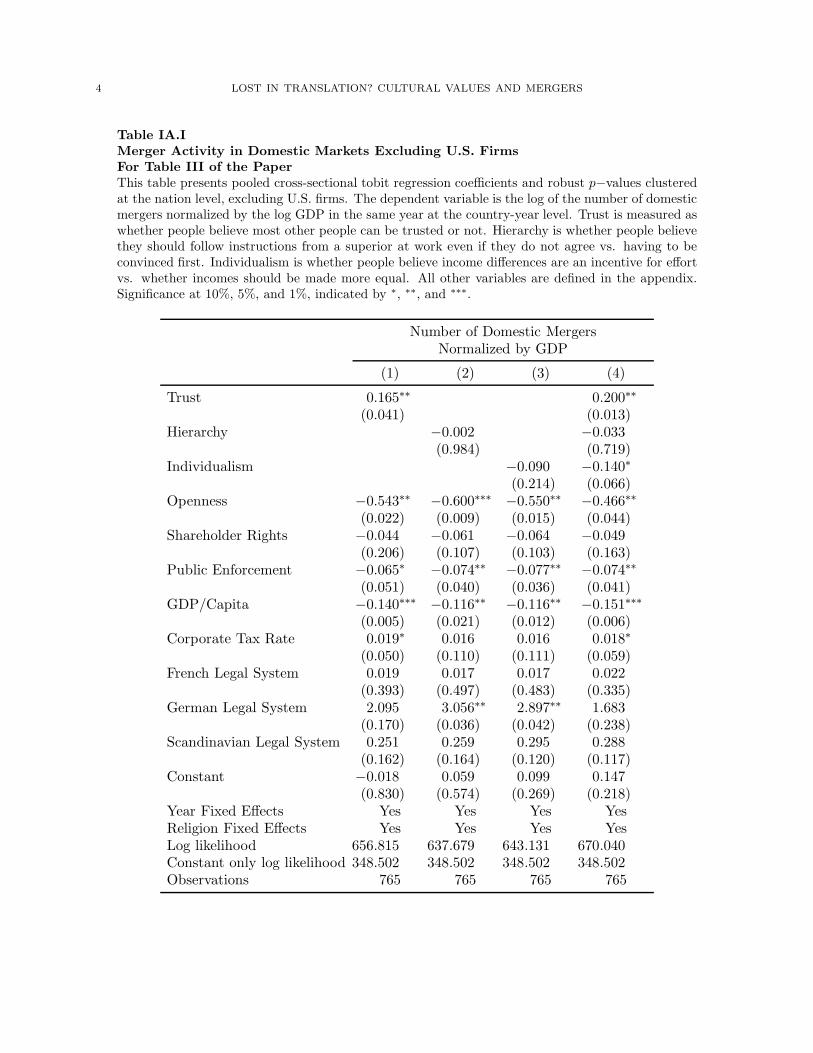
4 LOST IN TRANSLATION? CULTURAL VALUES AND MERGERS
Table IA.IMerger Activity in Domestic Markets Excluding U.S. FirmsFor Table III of the PaperThis table presents pooled cross-sectional tobit regression coefficients and robust p−values clusteredat the nation level, excluding U.S. firms. The dependent variable is the log of the number of domesticmergers normalized by the log GDP in the same year at the country-year level. Trust is measured aswhether people believe most other people can be trusted or not. Hierarchy is whether people believethey should follow instructions from a superior at work even if they do not agree vs. having to beconvinced first. Individualism is whether people believe income differences are an incentive for effortvs. whether incomes should be made more equal. All other variables are defined in the appendix.Significance at 10%, 5%, and 1%, indicated by ∗, ∗∗, and ∗∗∗.
Number of Domestic MergersNormalized by GDP
(1) (2) (3) (4)
Trust 0.165∗∗ 0.200∗∗
(0.041) (0.013)Hierarchy −0.002 −0.033
(0.984) (0.719)Individualism −0.090 −0.140∗
(0.214) (0.066)Openness −0.543∗∗ −0.600∗∗∗ −0.550∗∗ −0.466∗∗
(0.022) (0.009) (0.015) (0.044)Shareholder Rights −0.044 −0.061 −0.064 −0.049
(0.206) (0.107) (0.103) (0.163)Public Enforcement −0.065∗ −0.074∗∗ −0.077∗∗ −0.074∗∗
(0.051) (0.040) (0.036) (0.041)GDP/Capita −0.140∗∗∗ −0.116∗∗ −0.116∗∗ −0.151∗∗∗
(0.005) (0.021) (0.012) (0.006)Corporate Tax Rate 0.019∗ 0.016 0.016 0.018∗
(0.050) (0.110) (0.111) (0.059)French Legal System 0.019 0.017 0.017 0.022
(0.393) (0.497) (0.483) (0.335)German Legal System 2.095 3.056∗∗ 2.897∗∗ 1.683
(0.170) (0.036) (0.042) (0.238)Scandinavian Legal System 0.251 0.259 0.295 0.288
(0.162) (0.164) (0.120) (0.117)Constant −0.018 0.059 0.099 0.147
(0.830) (0.574) (0.269) (0.218)Year Fixed Effects Yes Yes Yes YesReligion Fixed Effects Yes Yes Yes YesLog likelihood 656.815 637.679 643.131 670.040Constant only log likelihood 348.502 348.502 348.502 348.502Observations 765 765 765 765

LOST IN TRANSLATION? CULTURAL VALUES AND MERGERS 5
Table IA.IICross-Border Merger Activity Excluding U.S. FirmsFor Table IV of the PaperThis table presents pooled cross-sectional tobit regression coefficients and robust p−values double-clustered at the acquirer and target nation levels, where U.S. firms are excluded. The dependentvariable is the log of the number of cross-border mergers normalized by the log of the aggregateGDP of the two host countries at the country pair-year level over 1991–2008. Trust is measured aswhether people believe most other people can be trusted or not. Hierarchy is whether people believethey should follow instructions from a superior at work even if they do not agree vs. having to beconvinced first. Individualism is whether people believe income differences are an incentive for effortvs. whether incomes should be made more equal. Country effects are dummy variables for eachcountry in the sample that equal 1 if either the acquirer or target firm is located in a particularcountry. | ∆ | indicates the absolute difference between the acquirer and target nation variables. Allother variables are defined in the appendix. Significance at 10%, 5%, and 1%, indicated by ∗, ∗∗, and∗∗∗.
Number of Cross-Border Mergers Normalized by GDP
(1) (2) (3) (4) (5)
Aggregate Trust 0.047∗ 0.057∗∗
(0.092) (0.039)| ∆ Trust | −0.012 −0.012
(0.629) (0.624)| ∆ Hierarchy | −0.050 −0.047
(0.234) (0.246)| ∆ Individualism | −0.050 −0.055∗
(0.115) (0.080)
Acquirer Openness 0.090 0.126 0.124 0.132 0.105(0.644) (0.498) (0.525) (0.489) (0.589)
Target Openness −0.004 0.031 0.031 0.041 0.013(0.984) (0.861) (0.868) (0.820) (0.943)
| ∆ Openness | −0.142 −0.143 −0.139 −0.140 −0.141(0.140) (0.127) (0.146) (0.144) (0.131)
Acquirer GDP/Capita 0.585 0.613 0.585 0.613 0.565(0.410) (0.397) (0.419) (0.392) (0.423)
Target GDP/Capita 0.560 0.597 0.551 0.577 0.525(0.372) (0.345) (0.384) (0.362) (0.403)
| ∆ GDP/Capita | 0.564 0.582 0.569 0.527 0.592(0.203) (0.138) (0.183) (0.230) (0.117)
Acquirer Corporate Tax Rate −0.075 −0.075 −0.075 −0.072 −0.073(0.146) (0.140) (0.125) (0.161) (0.143)
| ∆ Corporate Tax Rate | −0.070 −0.069 −0.067 −0.067 −0.063(0.431) (0.437) (0.441) (0.453) (0.468)
Same Religion 0.020∗∗ 0.020∗∗ 0.019∗∗ 0.020∗∗ 0.019∗∗
(0.039) (0.036) (0.041) (0.042) (0.039)Same Language 0.030∗ 0.030∗ 0.031∗ 0.030∗ 0.031∗
(0.065) (0.065) (0.059) (0.064) (0.057)Log(Geographic Distance) −0.053∗∗∗ −0.053∗∗∗ −0.053∗∗∗ −0.053∗∗∗ −0.053∗∗∗
(0.000) (0.000) (0.000) (0.000) (0.000)
continued on next page

6 LOST IN TRANSLATION? CULTURAL VALUES AND MERGERS
Table IA.II - Continued
(1) (2) (3) (4) (5)
Share Border 0.008 0.007 0.008 0.008 0.008∗
(0.134) (0.156) (0.113) (0.103) (0.100)Exchange Rate Volatility −0.329∗∗ −0.322∗∗ −0.310∗∗ −0.315∗∗ −0.321∗∗
(0.028) (0.029) (0.033) (0.034) (0.031)Exchange Rate Growth −0.039∗∗∗ −0.040∗∗∗ −0.039∗∗∗ −0.040∗∗∗ −0.039∗∗∗
(0.000) (0.000) (0.000) (0.000) (0.000)Double-Tax Treaty 0.010 0.010 0.010 0.010 0.010
(0.219) (0.224) (0.228) (0.208) (0.193)Bilateral Investment Treaty 0.001 0.001 0.001 0.001 0.001
(0.928) (0.907) (0.930) (0.902) (0.908)Same Legal System 0.055∗∗∗ 0.053∗∗∗ 0.056∗∗∗ 0.056∗∗∗ 0.054∗∗∗
(0.000) (0.000) (0.000) (0.000) (0.000)| ∆ Shareholder Rights | −0.001 −0.001 −0.001 −0.001 −0.001
(0.799) (0.771) (0.836) (0.799) (0.816)| ∆ Public Enforcement | −0.003 −0.003 −0.003 −0.004 −0.004
(0.581) (0.580) (0.586) (0.559) (0.545)Constant 0.139∗∗∗ 0.151∗∗∗ 0.147∗∗∗ 0.156∗∗∗ 0.150∗∗∗
(0.005) (0.002) (0.004) (0.001) (0.001)Country Effects Yes Yes Yes Yes YesYear Fixed Effects Yes Yes Yes Yes YesLog likelihood 579.386 578.385 580.828 580.391 585.641Constant only log likelihood −2193.068 −2193.068 −2193.068 −2193.068 −2193.068Observations 12810 12810 12810 12810 12810

LOST IN TRANSLATION? CULTURAL VALUES AND MERGERS 7
Table IA.IIICombined Abnormal Returns and Division of Gains Excluding U.S. FirmsFor Tables V, VI, and VII of the PaperThis table presents cross-sectional ordinary least squares regression coefficients and robust p−values, double-clustered at the acquirer and target country levels, excluding U.S. firms. The dependent variable is thecombined abnormal return of the target and acquirer over the period (−1, +1) around the announcement,where returns are weighted by market values or the $ value of acquirer abnormal returns in (−1, +1) minusthe $ value of target abnormal returns in (−1, +1) normalized by the sum of the market values of the acquirerand target 10 days before the announcement. All other variables are defined in the appendix. Significance at10%, 5%, and 1%, indicated by ∗, ∗∗, and ∗∗∗.
Combined CAR(−1,+1)Acq. Gain relative to
Target’s Gain
Domestic Cross-Border Cross-Border
(1) (2) (3)
Trust 0.073∗∗
(0.048)Hierarchy 0.017
(0.722)Individualism −0.016
(0.786)Aggregate Trust 0.048
(0.498)| ∆ Trust | −0.012
(0.569)| ∆ Hierarchy | −0.067
(0.622)| ∆ Individualism | −0.285∗∗∗
(0.000)∆ Trust 0.104∗∗∗
(0.000)∆ Hierarchy −0.014
(0.655)∆ Individualism −0.065
(0.136)∆ Trust × Relative Size −0.008
(0.748)∆ Hierarchy × Relative Size 0.030
(0.334)∆ Individualism × Relative Size 0.034∗
(0.068)∆ Openness 0.000
(0.922)∆ GDP/Capita 0.000
(0.175)∆ Corporate Tax Rate 0.001
(0.725)∆ Corporate Tax Rate −0.003
(0.263)∆ Public Enforcement −0.009
(0.225)
continued on next page

8 LOST IN TRANSLATION? CULTURAL VALUES AND MERGERS
Table IA.III - Continued
Combined CAR(−1,+1)Acq. Gain relative to
Target’s Gain
Domestic Cross-Border Cross-Border
(1) (2) (3)
Transaction Value −0.199 −0.010 −0.123(0.760) (0.920) (0.571)
Relative Size 0.007∗∗∗ 0.010∗∗∗ −0.011∗∗∗
(0.003) (0.010) (0.000)Acquirer Market Value −0.372 −0.555∗∗ 0.080
(0.220) (0.035) (0.389)Majority Cash 0.012∗∗ 0.010 0.005
(0.020) (0.277) (0.501)Tender Offer 0.008 0.004 −0.012∗∗
(0.225) (0.677) (0.044)Friendly Offer 0.003 0.011 −0.002
(0.616) (0.453) (0.835)Same Industry −0.003 −0.004 0.003
(0.378) (0.611) (0.554)Acquirer Termination Fee −0.009 −0.052∗ 0.006
(0.276) (0.090) (0.839)Target Termination Fee 0.009 0.006 −0.006
(0.584) (0.783) (0.260)Target Defense −0.015 0.011 0.023∗∗∗
(0.603) (0.812) (0.000)Acquirer Past Return 0.005∗ 0.000 0.000
(0.065) (0.571) (0.626)Acquirer Past Volatility −0.030∗ −0.088 0.013
(0.050) (0.532) (0.938)Target Past Return −0.001 −0.002 0.004
(0.807) (0.357) (0.197)Target Past Volatility 0.083 0.026 −0.038∗
(0.519) (0.236) (0.056)Openness 0.000 0.000 0.000
(0.906) (0.621) (0.887)French Legal System 0.017
(0.120)German Legal System 0.016
(0.101)Scandinavian Legal System 0.025
(0.192)Shareholder Rights −0.001
(0.830)Public Enforcement 0.018∗
(0.081)GDP/Capita −0.248 −0.172 −3.095
(0.761) (0.947) (0.215)Corporate Tax Rate 0.131
(0.103)Target Openness 0.000
(0.611)
continued on next page
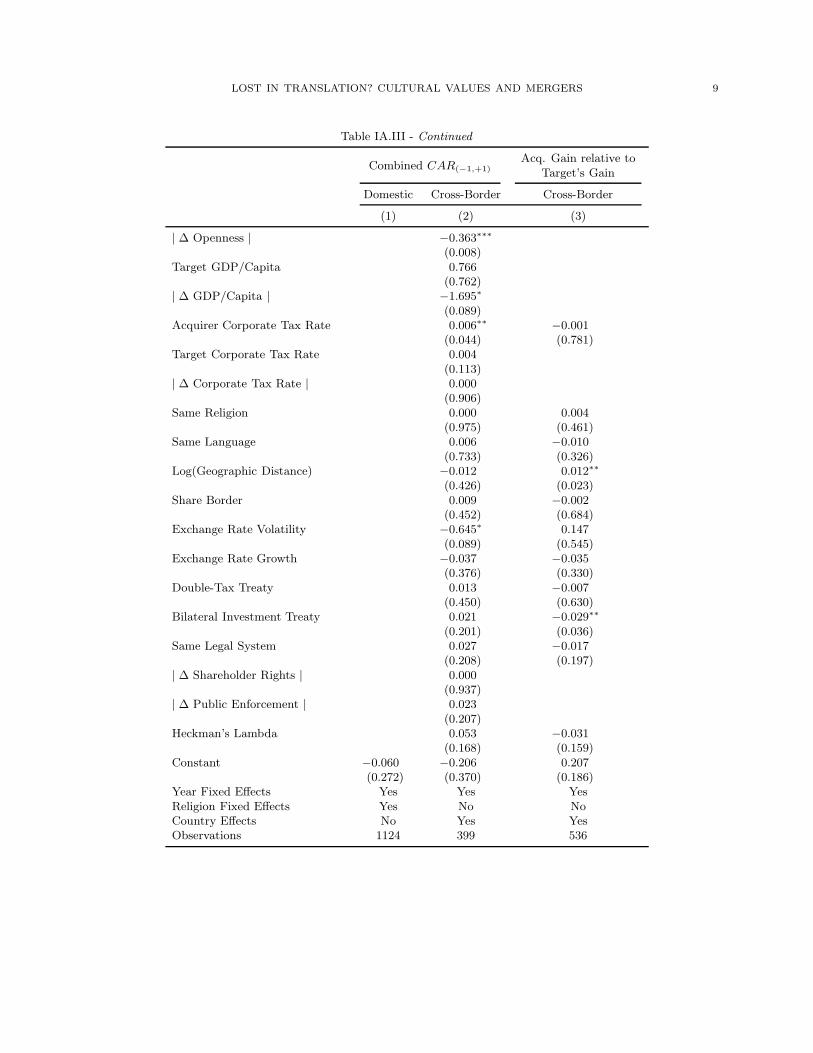
LOST IN TRANSLATION? CULTURAL VALUES AND MERGERS 9
Table IA.III - Continued
Combined CAR(−1,+1)Acq. Gain relative to
Target’s Gain
Domestic Cross-Border Cross-Border
(1) (2) (3)
| ∆ Openness | −0.363∗∗∗
(0.008)Target GDP/Capita 0.766
(0.762)| ∆ GDP/Capita | −1.695∗
(0.089)Acquirer Corporate Tax Rate 0.006∗∗ −0.001
(0.044) (0.781)Target Corporate Tax Rate 0.004
(0.113)| ∆ Corporate Tax Rate | 0.000
(0.906)Same Religion 0.000 0.004
(0.975) (0.461)Same Language 0.006 −0.010
(0.733) (0.326)Log(Geographic Distance) −0.012 0.012∗∗
(0.426) (0.023)Share Border 0.009 −0.002
(0.452) (0.684)Exchange Rate Volatility −0.645∗ 0.147
(0.089) (0.545)Exchange Rate Growth −0.037 −0.035
(0.376) (0.330)Double-Tax Treaty 0.013 −0.007
(0.450) (0.630)Bilateral Investment Treaty 0.021 −0.029∗∗
(0.201) (0.036)Same Legal System 0.027 −0.017
(0.208) (0.197)| ∆ Shareholder Rights | 0.000
(0.937)| ∆ Public Enforcement | 0.023
(0.207)Heckman’s Lambda 0.053 −0.031
(0.168) (0.159)Constant −0.060 −0.206 0.207
(0.272) (0.370) (0.186)Year Fixed Effects Yes Yes YesReligion Fixed Effects Yes No NoCountry Effects No Yes YesObservations 1124 399 536

10 LOST IN TRANSLATION? CULTURAL VALUES AND MERGERS
Table IA.IVLogit Tests of Cash Payment and Tender Offers Excluding U.S. FirmsFor Table IX of the PaperThis table presents cross-sectional logit regression coefficients and robust p−values, double-clustered at the acquirerand target country levels where observations are cross-border mergers, excluding U.S. firms. The dependent variable incolumns 1 & 2 is a dummy variable equal to 1 if the merger payment is all cash and 0 otherwise and in columns 3 & 4a dummy variable equal to 1 if the merger was a tender offer. There were only 104 observations on termination fees sothey are not run in robustness checks. Trust is measured as whether people believe most other people can be trustedor not. Hierarchy is whether people believe they should follow instructions from a superior at work even if they do notagree vs. having to be convinced first. Individualism is whether people believe income differences are an incentive foreffort vs. whether incomes should be made more equal. Country effects are dummy variables for each country thatequal 1 if either the acquirer or target firm is located in a particular country. ∆ indicates the acquirer nation valueminus the target nation value. | ∆ | is the absolute difference between acquiror and target nation. All other variablesare defined in the appendix. Significance at 10%, 5%, and 1%, indicated by ∗, ∗∗, and ∗∗∗.
All Cash Tender Offer
(1) (2) (3) (4)
∆ Trust −0.798 −1.933∗∗
(0.656) (0.049)∆ Hierarchy −6.231∗∗∗ 0.235
(0.004) (0.375)∆ Individualism 1.824 1.749
(0.591) (0.277)Acquirer Trust −13.031∗ −2.093
(0.098) (0.690)Acquirer Hierarchy −3.311 0.522
(0.622) (0.722)Acquirer Individualism 8.386 1.209
(0.132) (0.802)Target Trust −9.950∗ 1.766
(0.075) (0.661)Target Hierarchy 9.059 −0.007
(0.160) (0.994)Target Individualism 3.623 −2.253
(0.543) (0.652)Transaction Value −215.022∗∗∗ −212.058∗∗∗ 36.726 36.935
(0.005) (0.004) (0.483) (0.484)Relative Size −0.029 −0.038 0.002 0.002
(0.923) (0.906) (0.969) (0.967)Acquirer Market Value −64.097 −63.603 26.254 26.358
(0.151) (0.155) (0.127) (0.130)Cash dummy −0.029 −0.033
(0.942) (0.938)Tender Offer 0.362 0.388
(0.517) (0.504)Friendly Offer −2.767∗∗ −2.777∗∗ 0.988∗∗∗ 0.992∗∗∗
(0.015) (0.010) (0.006) (0.004)Same Industry −1.362∗ −1.268∗ −0.129 −0.130
(0.056) (0.080) (0.610) (0.607)
Acquirer Termination Fee −3.328∗ −3.406∗ −1.483 −1.479(0.054) (0.061) (0.241) (0.226)
Target Termination Fee 5.519∗∗∗ 5.691∗∗ −0.534 −0.531(0.005) (0.010) (0.563) (0.564)
Target Defense 0.848 0.902(0.312) (0.332)
Acquirer Past Return −3.021∗∗∗ −2.831∗∗∗ −0.126 −0.127(0.000) (0.000) (0.692) (0.678)
continued on next page
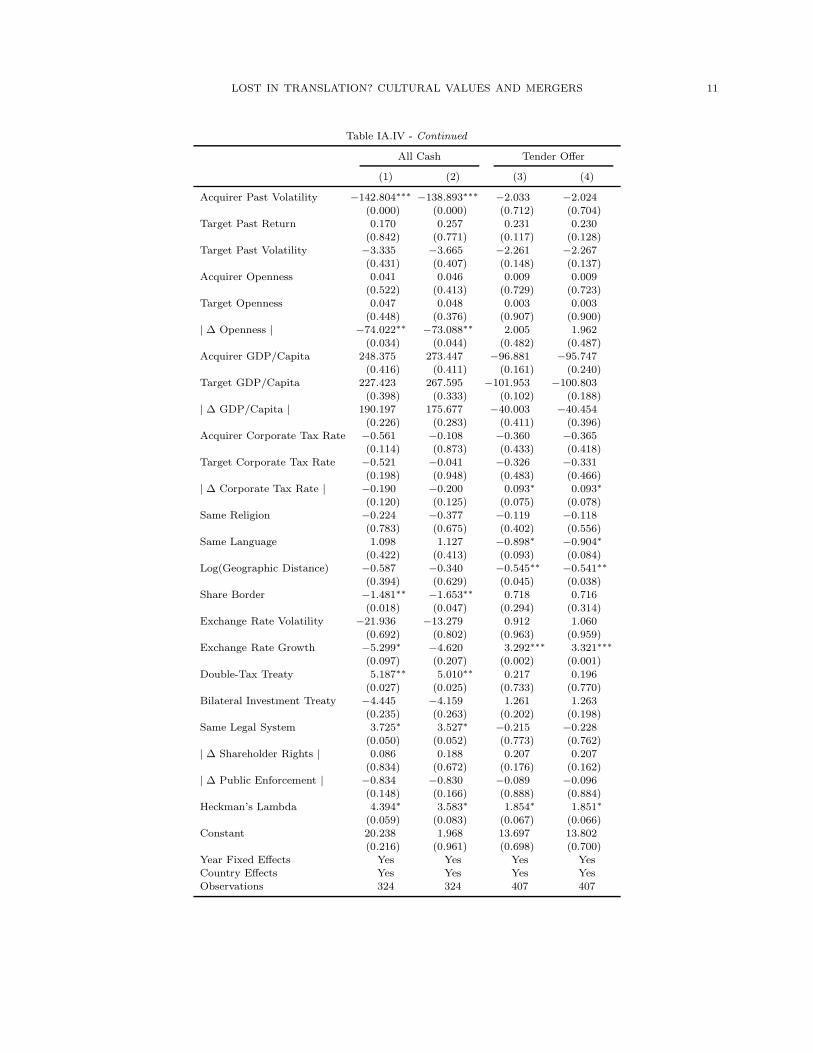
LOST IN TRANSLATION? CULTURAL VALUES AND MERGERS 11
Table IA.IV - Continued
All Cash Tender Offer
(1) (2) (3) (4)
Acquirer Past Volatility −142.804∗∗∗ −138.893∗∗∗ −2.033 −2.024(0.000) (0.000) (0.712) (0.704)
Target Past Return 0.170 0.257 0.231 0.230(0.842) (0.771) (0.117) (0.128)
Target Past Volatility −3.335 −3.665 −2.261 −2.267(0.431) (0.407) (0.148) (0.137)
Acquirer Openness 0.041 0.046 0.009 0.009(0.522) (0.413) (0.729) (0.723)
Target Openness 0.047 0.048 0.003 0.003(0.448) (0.376) (0.907) (0.900)
| ∆ Openness | −74.022∗∗ −73.088∗∗ 2.005 1.962(0.034) (0.044) (0.482) (0.487)
Acquirer GDP/Capita 248.375 273.447 −96.881 −95.747(0.416) (0.411) (0.161) (0.240)
Target GDP/Capita 227.423 267.595 −101.953 −100.803(0.398) (0.333) (0.102) (0.188)
| ∆ GDP/Capita | 190.197 175.677 −40.003 −40.454(0.226) (0.283) (0.411) (0.396)
Acquirer Corporate Tax Rate −0.561 −0.108 −0.360 −0.365(0.114) (0.873) (0.433) (0.418)
Target Corporate Tax Rate −0.521 −0.041 −0.326 −0.331(0.198) (0.948) (0.483) (0.466)
| ∆ Corporate Tax Rate | −0.190 −0.200 0.093∗ 0.093∗
(0.120) (0.125) (0.075) (0.078)Same Religion −0.224 −0.377 −0.119 −0.118
(0.783) (0.675) (0.402) (0.556)Same Language 1.098 1.127 −0.898∗ −0.904∗
(0.422) (0.413) (0.093) (0.084)Log(Geographic Distance) −0.587 −0.340 −0.545∗∗ −0.541∗∗
(0.394) (0.629) (0.045) (0.038)Share Border −1.481∗∗ −1.653∗∗ 0.718 0.716
(0.018) (0.047) (0.294) (0.314)Exchange Rate Volatility −21.936 −13.279 0.912 1.060
(0.692) (0.802) (0.963) (0.959)Exchange Rate Growth −5.299∗ −4.620 3.292∗∗∗ 3.321∗∗∗
(0.097) (0.207) (0.002) (0.001)
Double-Tax Treaty 5.187∗∗ 5.010∗∗ 0.217 0.196(0.027) (0.025) (0.733) (0.770)
Bilateral Investment Treaty −4.445 −4.159 1.261 1.263(0.235) (0.263) (0.202) (0.198)
Same Legal System 3.725∗ 3.527∗ −0.215 −0.228(0.050) (0.052) (0.773) (0.762)
| ∆ Shareholder Rights | 0.086 0.188 0.207 0.207(0.834) (0.672) (0.176) (0.162)
| ∆ Public Enforcement | −0.834 −0.830 −0.089 −0.096(0.148) (0.166) (0.888) (0.884)
Heckman’s Lambda 4.394∗ 3.583∗ 1.854∗ 1.851∗
(0.059) (0.083) (0.067) (0.066)Constant 20.238 1.968 13.697 13.802
(0.216) (0.961) (0.698) (0.700)Year Fixed Effects Yes Yes Yes YesCountry Effects Yes Yes Yes YesObservations 324 324 407 407

12 LOST IN TRANSLATION? CULTURAL VALUES AND MERGERS
Table IA.VSchwartz Cultural Dimensions and Merger Activity in Domestic MarketsFor Table III of the PaperThis table presents pooled cross-sectional tobit regression coefficients and robust p−values clusteredat the nation level. The dependent variable is the log of the number of domestic mergers normalizedby the log GDP in the same year at the country-year level. Cultural variables follow Schwartz(1994) and are defined in the opening of the internet appendix. All other variables are defined in theappendix. Significance at 10%, 5%, and 1%, indicated by ∗, ∗∗, and ∗∗∗.
Number of Domestic MergersNormalized by GDP
(1) (2) (3) (4)
Egalitarianism −0.029 −0.058∗∗
(0.246) (0.050)Harmony −0.022 −0.029
(0.266) (0.276)Embeddedness −0.014 −0.045∗∗
(0.408) (0.011)
Openness −0.362∗∗∗ −0.360∗∗∗ −0.343∗∗∗ −0.396∗∗∗
(0.001) (0.001) (0.002) (0.000)French Legal System −0.062∗∗∗ −0.060∗∗∗ −0.071∗∗∗ −0.054∗∗
(0.002) (0.006) (0.001) (0.011)German Legal System −0.120∗∗∗ −0.111∗∗∗ −0.120∗∗∗ −0.128∗∗∗
(0.000) (0.000) (0.000) (0.000)Scandinavian Legal System −0.103∗∗∗ −0.094∗∗∗ −0.100∗∗∗ −0.092∗∗∗
(0.000) (0.003) (0.000) (0.001)Shareholder Rights 0.012 0.010 0.011 0.012
(0.107) (0.174) (0.144) (0.107)Public Enforcement 0.004 0.005 −0.001 0.017
(0.773) (0.740) (0.919) (0.239)GDP/Capita 3.831∗∗∗ 3.850∗∗∗ 3.336∗∗∗ 3.438∗∗∗
(0.000) (0.000) (0.005) (0.002)Corporate Tax Rate −0.012 −0.029 0.009 −0.071
(0.920) (0.824) (0.942) (0.569)Constant 0.267∗∗ 0.242∗∗ 0.195∗ 0.714∗∗∗
(0.042) (0.046) (0.051) (0.001)Year Fixed Effects Yes Yes Yes YesReligion Fixed Effects Yes Yes Yes YesLog likelihood 813.584 813.059 812.378 827.792Constant only log likelihood 457.406 457.406 457.406 457.406Observations 617 617 617 617

LOST IN TRANSLATION? CULTURAL VALUES AND MERGERS 13
Table IA.VIHofstede Cultural Dimensions and Merger Activity in Domestic MarketsFor Table III of the PaperThis table presents pooled cross-sectional tobit regression coefficients and robust p−values clusteredat the nation level. The dependent variable is the log of the number of domestic mergers normalizedby the log GDP in the same year at the country-year level. Cultural variables follow Hofstede (1980,2001) and are defined in the opening of the internet appendix. All other variables are defined in theappendix. Significance at 10%, 5%, and 1%, indicated by ∗, ∗∗, and ∗∗∗.
Number of Domestic MergersNormalized by GDP
(1) (2) (3) (4) (5) (6)
Power Distance 0.001 0.005∗∗∗
(0.328) (0.000)Individualism 0.002∗∗∗ 0.006∗∗∗
(0.001) (0.000)Maculinity 0.000 −0.003∗∗∗
(0.839) (0.000)Uncertainty Avoidance 0.000 −0.009∗∗∗
(0.344) (0.000)Long-Term Orientation 0.001∗ 0.006∗∗∗
(0.065) (0.000)
Openness −0.564∗∗∗ −0.490∗∗∗ −0.517∗∗∗ −0.563∗∗∗ −0.218∗ −0.620∗∗∗
(0.002) (0.004) (0.005) (0.005) (0.052) (0.000)French Legal System −0.104∗∗∗ −0.052∗∗ −0.093∗∗∗ −0.080∗∗∗ −0.088∗∗∗ −0.120∗∗∗
(0.000) (0.023) (0.001) (0.007) (0.004) (0.000)German Legal System −0.110∗∗∗ −0.080∗∗∗ −0.110∗∗∗ −0.098∗∗∗ −0.167∗∗∗ 0.098∗∗∗
(0.000) (0.002) (0.000) (0.000) (0.000) (0.010)Scandinavian Legal System −0.083∗∗∗ −0.069∗∗ −0.085∗ −0.093∗∗∗ −0.135∗∗∗ −0.422∗∗∗
(0.006) (0.038) (0.068) (0.001) (0.002) (0.000)Shareholder Rights 0.021∗∗ 0.025∗∗∗ 0.022∗∗ 0.020∗∗ −0.008 −0.013∗
(0.019) (0.003) (0.022) (0.025) (0.469) (0.057)Public Enforcement −0.016 −0.003 −0.013 −0.011 0.043∗∗ 0.167∗∗∗
(0.375) (0.875) (0.499) (0.547) (0.033) (0.000)GDP/Capita 3.297∗∗ 1.009 2.701∗∗ 2.625∗∗ 1.108 −5.191∗∗∗
(0.045) (0.365) (0.048) (0.040) (0.487) (0.000)Corporate Tax Rate 0.041 0.073 0.069 0.061 −0.001 0.456∗
(0.733) (0.519) (0.587) (0.630) (0.997) (0.056)Constant 0.139 −0.004 0.101 0.202∗∗∗ 0.207∗∗ 0.237∗∗∗
(0.202) (0.956) (0.259) (0.000) (0.018) (0.005)Year Fixed Effects Yes Yes Yes Yes Yes YesReligion Fixed Effects Yes Yes Yes Yes Yes YesLog likelihood 777.198 820.677 773.936 776.456 496.115 588.634Constant only log likelihood 447.690 447.690 447.690 447.690 260.012 260.012Observations 690 690 690 690 326 326

14 LOST IN TRANSLATION? CULTURAL VALUES AND MERGERS
Table IA.VIISchwartz Cultural Dimensions and Cross-Border Merger ActivityFor Table IV of the PaperThis table presents pooled cross-sectional tobit regression coefficients and robust p−values double-clustered at the acquirer and target nation levels. The dependent variable is the log of the numberof cross-border mergers normalized by the log of the aggregate GDP of the two host countries at thecountry pair-year level over 1991–2008. Cultural variables follow Schwartz (1994) and are defined inthe opening of the internet appendix. All other variables are defined in the appendix. Significanceat 10%, 5%, and 1%, indicated by ∗, ∗∗, and ∗∗∗.
Number of Cross-Border Mergers Normalized by GDP
(1) (2) (3) (4)
| ∆ Egalitarianism | −0.011 −0.024(0.527) (0.226)
| ∆ Harmony | 0.008 0.004(0.592) (0.807)
| ∆ Embeddedness | 0.017∗ 0.023(0.086) (0.128)
Acquirer Openness 0.148 0.147 0.143 0.144(0.455) (0.456) (0.474) (0.474)
Target Openness 0.007 0.009 0.000 −0.008(0.968) (0.959) (0.999) (0.962)
| ∆ Openness | −0.181∗∗∗ −0.186∗∗∗ −0.187∗∗∗ −0.191∗∗∗
(0.004) (0.003) (0.002) (0.001)Acquirer GDP/Capita −0.123 −0.093 −0.149 −0.158
(0.914) (0.934) (0.893) (0.888)Target GDP/Capita 0.454 0.438 0.440 0.505
(0.571) (0.585) (0.589) (0.528)| ∆ GDP/Capita | −0.392 −0.394 −0.409 −0.330
(0.569) (0.570) (0.542) (0.629)Acquirer Corporate Tax Rate −0.081∗∗ −0.085∗∗ −0.082∗∗ −0.077∗∗
(0.020) (0.024) (0.047) (0.040)| ∆ Corporate Tax Rate | 0.032 0.035 0.037 0.031
(0.683) (0.654) (0.650) (0.708)Same Religion 0.023∗∗∗ 0.023∗∗∗ 0.022∗∗∗ 0.022∗∗∗
(0.008) (0.007) (0.007) (0.008)Same Language 0.042∗∗∗ 0.043∗∗∗ 0.045∗∗∗ 0.047∗∗∗
(0.001) (0.001) (0.001) (0.001)Log(Geographic Distance) −0.052∗∗∗ −0.053∗∗∗ −0.053∗∗∗ −0.052∗∗∗
(0.000) (0.000) (0.000) (0.000)Share Border 0.004 0.004 0.003 0.003
(0.371) (0.271) (0.549) (0.494)Exchange Rate Volatility −0.363∗∗∗ −0.373∗∗∗ −0.376∗∗∗ −0.390∗∗∗
(0.004) (0.002) (0.002) (0.001)Exchange Rate Growth −0.020 −0.020 −0.021 −0.021
(0.229) (0.225) (0.208) (0.200)Double-Tax Treaty −0.001 −0.001 −0.001 0.000
(0.949) (0.932) (0.912) (0.977)
continued on next page

LOST IN TRANSLATION? CULTURAL VALUES AND MERGERS 15
Table IA.VII - Continued
(1) (2) (3) (4)
Bilateral Investment Treaty 0.011 0.011 0.009 0.009(0.118) (0.136) (0.216) (0.213)
Same Legal System 0.055∗∗∗ 0.055∗∗∗ 0.054∗∗∗ 0.055∗∗∗
(0.000) (0.000) (0.000) (0.000)| ∆ Shareholder Rights | 0.002 0.002 0.002 0.002
(0.245) (0.257) (0.258) (0.178)| ∆ Public Enforcement | −0.001 −0.003 −0.002 −0.002
(0.864) (0.655) (0.761) (0.747)Constant 0.064∗∗∗ 0.064∗∗∗ 0.064∗∗∗ 0.064∗∗∗
(0.000) (0.000) (0.000) (0.000)Country Effects Yes Yes Yes YesYear Fixed Effects Yes Yes Yes YesLog likelihood 1119.629∗∗∗ 1119.383∗∗∗ 1124.169∗∗∗ 1129.356∗∗∗
Constant only log likelihood −1855.555 −1855.555 −1855.555 −1855.555Observations 8425 8425 8425 8425

16 LOST IN TRANSLATION? CULTURAL VALUES AND MERGERS
Table IA.VIIIHofstede Cultural Dimensions and Cross-Border Merger ActivityFor Table IV of the PaperThis table presents pooled cross-sectional tobit regression coefficients and robust p−values double-clustered at the acquirer and target nation levels. The dependent variable is the log of the numberof cross-border mergers normalized by the log of the aggregate GDP of the two host countries atthe country pair-year level over 1991–2008. Cultural variables follow Hofstede (1980, 2001) and aredefined in the opening of the internet appendix. All other variables are defined in the appendix.Significance at 10%, 5%, and 1%, indicated by ∗, ∗∗, and ∗∗∗.
Number of Cross-Border Mergers Normalized by GDP
(1) (2) (3) (4) (5) (6)
| ∆ Power Distance | −0.001∗∗∗ 0.000(0.006) (0.748)
| ∆ Individualism | −0.001∗∗∗ −0.001∗∗∗
(0.000) (0.001)| ∆ Masculinity | 0.000∗∗ 0.000
(0.020) (0.725)| ∆ Uncertainty Avoidance | −0.001∗∗∗ 0.000
(0.001) (0.119)| ∆ Long-Term Orientation | 0.000∗ 0.000∗
(0.070) (0.086)Acquirer Openness 0.200 0.161 0.230 0.232 0.300 0.213
(0.301) (0.371) (0.256) (0.245) (0.149) (0.184)Target Openness 0.072 0.019 0.079 0.072 0.144 0.041
(0.684) (0.905) (0.656) (0.682) (0.323) (0.747)| ∆ Openness | −0.096 −0.094 −0.083 −0.100 −0.252∗∗∗ −0.167∗∗∗
(0.323) (0.263) (0.432) (0.217) (0.000) (0.007)Acquirer GDP/Capita 0.362 0.306 0.290 0.222 −1.308 −0.900
(0.638) (0.678) (0.739) (0.787) (0.321) (0.398)Target GDP/Capita 0.854 1.096∗∗ 0.873 0.733 −0.413 −0.022
(0.139) (0.042) (0.164) (0.255) (0.708) (0.978)| ∆ GDP/Capita | 0.471 0.677 −0.092 0.071 0.548 0.907
(0.418) (0.183) (0.883) (0.906) (0.425) (0.144)Acquirer Corporate Tax Rate −0.046 −0.053∗ −0.053∗∗ −0.026 −0.223∗∗∗ −0.162∗∗
(.) (0.060) (0.047) (0.217) (0.000) (0.029)| ∆ Corporate Tax Rate | −0.046 −0.054 −0.048 −0.036 0.266∗∗∗ 0.225∗∗
(0.479) (0.415) (0.534) (0.635) (0.004) (0.013)Same Religion 0.019∗∗ 0.020∗∗ 0.026∗∗∗ 0.015∗ 0.012 0.011
(0.021) (0.015) (0.002) (0.054) (0.229) (0.292)Same Language 0.039∗∗∗ 0.027∗∗∗ 0.037∗∗∗ 0.028∗∗ 0.043∗∗ 0.033∗
(0.001) (0.000) (0.002) (0.010) (0.011) (0.063)Log(Geographic Distance) −0.049∗∗∗ −0.042∗∗∗ −0.050∗∗∗ −0.051∗∗∗ −0.056∗∗∗ −0.052∗∗∗
(0.000) (0.000) (0.000) (0.000) (0.000) (0.000)Share Border 0.006 0.011∗∗ 0.004 0.001 −0.018 −0.020
(0.133) (0.040) (0.331) (0.851) (0.264) (0.251)Exchange Rate Volatility −0.425∗∗∗ −0.467∗∗∗ −0.414∗∗∗ −0.374∗∗∗ −0.382 −0.419∗
(0.001) (0.001) (0.001) (0.001) (0.184) (0.068)
continued on next page

LOST IN TRANSLATION? CULTURAL VALUES AND MERGERS 17
Table IA.VIII - Continued
(1) (2) (3) (4) (5) (6)
Exchange Rate Growth −0.024 −0.023∗ −0.024 −0.026 −0.014 −0.011(0.118) (0.093) (0.127) (0.104) (0.582) (0.639)
Double-Tax Treaty 0.003 0.005 0.004 0.002 0.012 0.015(0.703) (0.509) (0.649) (0.772) (0.292) (0.188)
Bilateral Investment Treaty 0.010 0.014∗∗ 0.008 0.007 −0.002 0.008(0.140) (0.028) (0.306) (0.409) (0.821) (0.295)
Same Legal System 0.051∗∗∗ 0.060∗∗∗ 0.047∗∗∗ 0.055∗∗∗ 0.089∗∗∗ 0.087∗∗∗
(0.000) (0.000) (0.000) (0.000) (0.000) (0.000)| ∆ Shareholder Rights | −0.002 −0.002 −0.001 −0.002 0.002 0.001
(0.631) (0.618) (0.623) (0.528) (0.606) (0.756)| ∆ Public Enforcement | −0.002 −0.002 −0.003 −0.004 0.009 0.007
(0.746) (0.764) (0.716) (0.520) (0.361) (0.417)Constant 0.065∗∗∗ 0.063∗∗∗ 0.066∗∗∗ 0.065∗∗∗ 0.059∗∗∗ 0.057∗∗∗
(0.000) (0.000) (0.000) (0.000) (0.000) (0.000)Country Effects Yes Yes Yes Yes Yes YesYear Fixed Effects Yes Yes Yes Yes Yes YesLog likelihood 1163.181∗∗∗ 1213.373∗∗∗ 1135.171∗∗∗ 1170.955∗∗∗ 686.189∗∗∗ 718.460∗∗∗
Constant only log likelihood −2142.046 −2142.046 −2142.046 −2142.046 −584.319 −584.319Observations 9939 9939 9939 9939 2437 2437
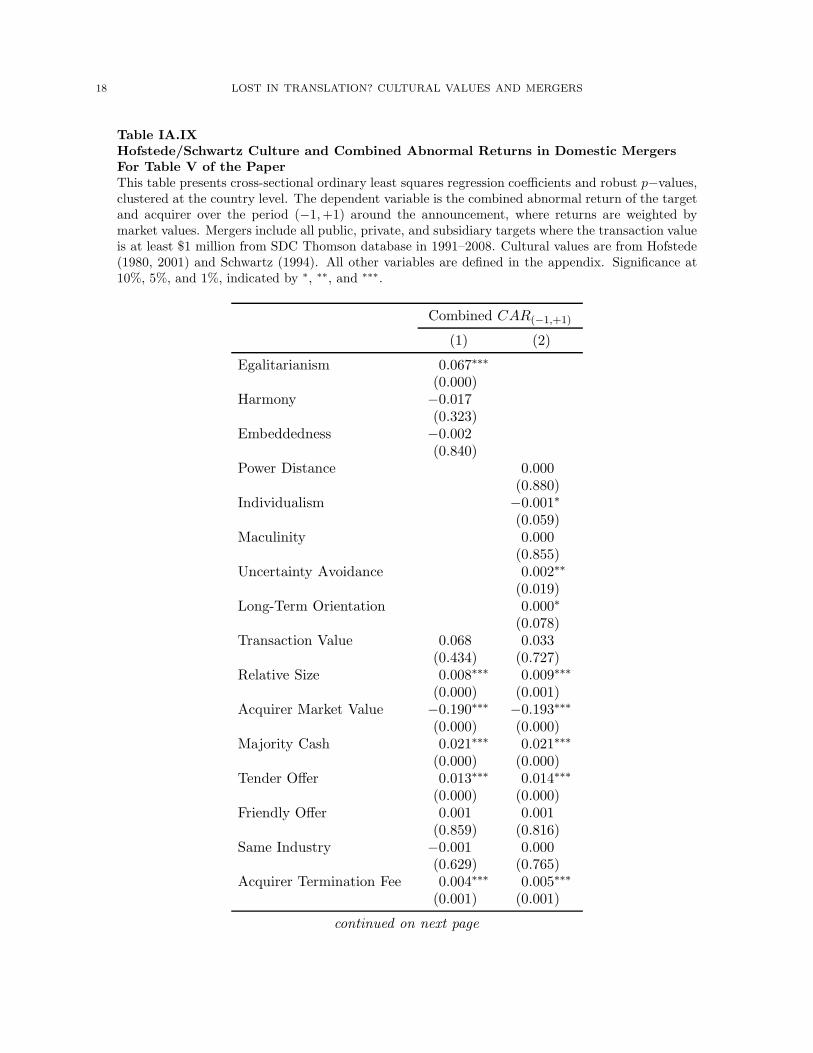
18 LOST IN TRANSLATION? CULTURAL VALUES AND MERGERS
Table IA.IXHofstede/Schwartz Culture and Combined Abnormal Returns in Domestic MergersFor Table V of the PaperThis table presents cross-sectional ordinary least squares regression coefficients and robust p−values,clustered at the country level. The dependent variable is the combined abnormal return of the targetand acquirer over the period (−1, +1) around the announcement, where returns are weighted bymarket values. Mergers include all public, private, and subsidiary targets where the transaction valueis at least $1 million from SDC Thomson database in 1991–2008. Cultural values are from Hofstede(1980, 2001) and Schwartz (1994). All other variables are defined in the appendix. Significance at10%, 5%, and 1%, indicated by ∗, ∗∗, and ∗∗∗.
Combined CAR(−1,+1)
(1) (2)
Egalitarianism 0.067∗∗∗
(0.000)Harmony −0.017
(0.323)Embeddedness −0.002
(0.840)Power Distance 0.000
(0.880)Individualism −0.001∗
(0.059)Maculinity 0.000
(0.855)Uncertainty Avoidance 0.002∗∗
(0.019)Long-Term Orientation 0.000∗
(0.078)Transaction Value 0.068 0.033
(0.434) (0.727)Relative Size 0.008∗∗∗ 0.009∗∗∗
(0.000) (0.001)Acquirer Market Value −0.190∗∗∗ −0.193∗∗∗
(0.000) (0.000)Majority Cash 0.021∗∗∗ 0.021∗∗∗
(0.000) (0.000)Tender Offer 0.013∗∗∗ 0.014∗∗∗
(0.000) (0.000)Friendly Offer 0.001 0.001
(0.859) (0.816)Same Industry −0.001 0.000
(0.629) (0.765)Acquirer Termination Fee 0.004∗∗∗ 0.005∗∗∗
(0.001) (0.001)
continued on next page

LOST IN TRANSLATION? CULTURAL VALUES AND MERGERS 19
Table IA.IX - Continued
Combined CAR(−1,+1)
(1) (2)
Target Termination Fee −0.006∗∗∗ −0.007∗∗∗
(0.000) (0.000)Target Defense −0.002 −0.002
(0.214) (0.281)Acquirer Past Return 0.000 −0.001∗∗
(0.992) (0.040)Acquirer Past Volatility −0.001 0.005
(0.850) (0.116)Target Past Return −0.001 −0.001
(0.150) (0.319)Target Past Volatility 0.051 0.051
(0.324) (0.344)Openness 0.000 0.000
(0.121) (0.973)French Legal System −0.003 −0.061
(0.703) (0.445)German Legal System 0.011 −0.142
(0.329) (0.208)Scandinavian Legal System 0.048∗∗∗ 0.051
(0.000) (0.508)Shareholder Rights −0.008∗∗∗ −0.024
(0.006) (0.257)Public Enforcement 0.002 −0.041
(0.790) (0.333)GDP/Capita 0.615 1.084
(0.102) (0.326)Corporate Tax Rate 0.147∗∗ −0.258
(0.030) (0.528)Constant −0.231∗∗ 0.133
(0.020) (0.447)Year Fixed Effects Yes YesReligion Fixed Effects Yes YesAdjusted R2 0.084 0.080Observations 3556 3336

20 LOST IN TRANSLATION? CULTURAL VALUES AND MERGERS
Table IA.XHofstede/Schwartz Culture and Combined Abnormal Returns in Cross-Border MergersFor Table VI of the PaperThis table presents cross-sectional ordinary least squares regression coefficients and robust p−values, double-clustered at the acquirer and target country levels. The dependent variable is the combined abnormal returnof the target and acquirer over the period (−1, +1) around the announcement, where returns are weightedby market values. Cultural values from World Value Survey (WVS), Hofstede (1980, 2001), and Schwartz(1994). Euclidean distance is over all cultural dimensions. All other variables are defined in the appendix.Significance at 10%, 5%, and 1%, indicated by ∗, ∗∗, and ∗∗∗.
Combined CAR(−1,+1)
(1) (2) (3) (4) (5)
Euclidian distance WVS −0.108∗∗
(0.030)Euclidian distance Hofstede 0.000
(0.635)Euclidian distance Schwartz 0.044∗∗
(0.017)| ∆ Egalitarianism | −0.025
(0.538)| ∆ Harmony | 0.005
(0.830)| ∆ Embeddedness | 0.036∗∗
(0.014)| ∆ Power Distance | 0.003
(0.291)| ∆ Individualism | −0.002∗
(0.060)| ∆ Masculinity | 0.001∗
(0.050)| ∆ Uncertainty Avoidance | 0.000
(0.517)| ∆ Long-Term Orientation | 0.000
(0.849)Transaction Value 0.085 0.070 0.124 0.134 0.206
(0.736) (0.786) (0.695) (0.662) (0.407)Relative Size 0.010∗∗∗ 0.010∗∗∗ 0.010∗∗∗ 0.010∗∗∗ 0.011∗∗∗
(0.000) (0.000) (0.000) (0.000) (0.000)Acquirer Market Value −0.509 −0.509 −0.504 −0.508 −0.396
(0.153) (0.159) (0.166) (0.164) (0.117)Majority Cash 0.018∗∗ 0.018∗∗ 0.019∗∗ 0.020∗∗ 0.027∗∗∗
(0.032) (0.030) (0.019) (0.014) (0.005)Tender Offer 0.006 0.006∗ 0.007∗ 0.007∗ 0.006
(0.110) (0.086) (0.058) (0.057) (0.229)Friendly Offer 0.003 0.004 0.005 0.005 0.001
(0.668) (0.657) (0.519) (0.504) (0.763)Same Industry −0.003 −0.003 −0.004 −0.004 0.000
(0.497) (0.524) (0.405) (0.341) (0.963)Acquirer Termination Fee −0.008 −0.008 −0.009 −0.009 −0.002
(0.285) (0.297) (0.338) (0.352) (0.821)Target Termination Fee 0.001 0.001 0.001 0.001 −0.006
(0.905) (0.908) (0.893) (0.732) (0.725)
continued on next page

LOST IN TRANSLATION? CULTURAL VALUES AND MERGERS 21
Table IA.X - Continued
Combined CAR(−1,+1)
(1) (2) (3) (4) (5)
Target Defense 0.002 0.002 −0.001 −0.001 −0.002(0.755) (0.791) (0.923) (0.903) (0.865)
Acquirer Past Return 0.000 0.000 −0.002 −0.002 0.004(0.656) (0.605) (0.554) (0.555) (0.246)
Acquirer Past Volatility −0.010∗∗∗ −0.010∗∗∗ 0.010 0.012 −0.202(0.000) (0.000) (0.754) (0.733) (0.298)
Target Past Return −0.004 −0.005 −0.003 −0.003 −0.010∗∗∗
(0.142) (0.140) (0.321) (0.348) (0.009)Target Past Volatility 0.035∗∗ 0.037∗∗∗ 0.028 0.030∗ 0.065∗∗
(0.018) (0.009) (0.136) (0.089) (0.026)Acquirer Openness 0.000 0.000 0.000 0.000 0.000
(0.760) (0.752) (0.463) (0.490) (0.776)Target Openness 0.000 0.000 0.000 0.000 0.000
(0.708) (0.699) (0.651) (0.693) (0.697)| ∆ Openness | −0.308∗∗ −0.311∗∗ −0.267∗ −0.244∗ −0.300∗
(0.025) (0.023) (0.062) (0.082) (0.064)Acquirer GDP/Capita −0.357 −0.427 −0.189 −0.168 −3.778
(0.825) (0.793) (0.906) (0.918) (0.218)Target GDP/Capita 1.379 1.327 1.445 1.489 −1.823
(0.417) (0.439) (0.448) (0.451) (0.555)| ∆ GDP/Capita | −0.732∗∗ −0.804∗∗∗ −0.801∗∗ −0.813∗∗ −1.322
(0.024) (0.000) (0.016) (0.021) (0.234)Acquirer Corporate Tax Rate 0.003 0.002 0.002 0.002 −0.011
(0.238) (0.250) (0.293) (0.231) (0.542)Target Corporate Tax Rate 0.002 0.002 0.001 0.001 −0.011
(0.258) (0.277) (0.463) (0.401) (0.531)| ∆ Corporate Tax Rate | 0.000 0.000 0.000 0.000 0.001
(0.745) (0.731) (0.901) (0.835) (0.658)Same Religion −0.005 −0.005 −0.004 −0.006 0.007
(0.487) (0.428) (0.501) (0.306) (0.631)Same Language 0.008 0.005 −0.009 −0.004 −0.021
(0.631) (0.767) (0.174) (0.575) (0.616)Log(Geographic Distance) −0.002 −0.002 0.000 −0.001 0.008
(0.822) (0.770) (0.971) (0.914) (0.169)Share Border 0.010 0.012 0.014 0.010 0.034
(0.168) (0.120) (0.142) (0.311) (0.277)Exchange Rate Volatility 0.184 0.195 0.333 0.290 1.449
(0.586) (0.562) (0.369) (0.439) (0.210)Exchange Rate Growth 0.000 0.000 −0.019∗∗∗ −0.016∗∗ −0.006
(0.987) (0.998) (0.009) (0.014) (.)Double-Tax Treaty 0.010 0.009 0.006 0.008 0.027
(0.451) (0.519) (0.626) (0.536) (0.506)Bilateral Investment Treaty 0.014 0.016 −0.005 −0.002 −0.038
(0.334) (0.273) (0.786) (0.905) (0.433)Same Legal System 0.007 0.008 0.003 0.006 0.041
(0.546) (0.515) (0.724) (0.600) (0.421)| ∆ Shareholder Rights | 0.003 0.003 −0.003∗ −0.003 −0.004
(0.454) (0.479) (0.067) (0.115) (0.670)| ∆ Public Enforcement | 0.016∗∗ 0.016∗∗ 0.007 0.008 0.024∗∗
(0.040) (0.036) (0.162) (0.372) (0.034)
continued on next page

22 LOST IN TRANSLATION? CULTURAL VALUES AND MERGERS
Table IA.X - Continued
Combined CAR(−1,+1)
(1) (2) (3) (4) (5)
Heckman’s Lambda 0.031 0.030 0.014 0.014 −0.039(0.194) (0.214) (0.339) (0.384) (0.380)
Constant −0.042 −0.040 −0.049 −0.051 0.672(0.822) (0.830) (0.718) (0.720) (0.605)
Year Fixed Effects Yes Yes Yes Yes YesCountry Effects Yes Yes Yes Yes YesAdjusted R2 0.128 0.127 0.119 0.119 0.082Observations 815 815 770 770 435

LOST IN TRANSLATION? CULTURAL VALUES AND MERGERS 23
Table IA.XIHofstede/Schwartz Culture and The Division of Merger GainsFor Table VII of the PaperThis table presents cross-sectional ordinary least squares regression coefficients and robust p−values, double-clusteredat the acquirer and target country levels. The dependent variable is the $ value of acquirer abnormal returns in (−1, +1)minus the $ value of target abnormal returns in (−1, +1) normalized by the sum of the market values of the acquirerand target 10 days before the announcement. Cultural values from Hofstede (1980, 2001) and from Schwartz (1994).All other variables are defined in the appendix. Significance at 10%, 5%, and 1%, indicated by ∗, ∗∗, and ∗∗∗.
Acquirer’s Gain Relative to Target’s Gain
(1) (2)
∆ Egalitarianism −0.038∗∗∗
(0.001)∆ Harmony 0.007
(0.600)∆ Embeddedness −0.024∗∗∗
(0.008)∆ Power Distance 0.001∗∗
(0.026)∆ Individualism 0.001∗∗∗
(0.001)∆ Masculinity −0.001∗∗∗
(0.000)∆ Uncertainty Avoidance −0.001∗∗∗
(0.000)∆ Long-Term Orientation 0.001∗∗∗
(0.000)Transaction Value −0.218 −0.256∗∗∗
(0.228) (0.000)Relative Size −0.010∗∗∗ −0.010∗∗∗
(0.000) (0.000)Acquirer Market Value 0.213 0.272
(0.169) (0.198)Majority Cash 0.019 0.033
(0.158) (0.164)Tender Offer −0.007∗∗ −0.001
(0.041) (0.858)Friendly Offer 0.004 0.005
(0.615) (0.639)Same Industry 0.008∗∗∗ 0.006∗∗
(0.000) (0.033)Acquirer Termination Fee 0.006 −0.003
(0.472) (0.793)Target Termination Fee 0.004 0.012
(0.354) (0.190)Target Defense −0.002 0.007
(0.801) (0.489)Acquirer Past Return 0.005 0.010∗∗∗
(0.177) (0.000)Acquirer Past Volatility −0.053 0.875
(0.235) (0.116)Target Past Return 0.004 0.004
(0.208) (0.258)
continued on next page

24 LOST IN TRANSLATION? CULTURAL VALUES AND MERGERS
Table IA.XI - Continued
Acquirer’s Gain Relative to Target’s Gain
(1) (2)
Target Past Volatility −0.015 −0.032(0.388) (0.315)
Acquirer Openness 0.000 −0.001∗
(0.598) (0.087)∆ Openness 0.000 0.000
(0.797) (0.932)Acquirer GDP/Capita −1.085 −7.652∗∗
(0.744) (0.017)∆ GDP/Capita 0.000 0.000∗∗∗
(0.482) (0.000)Acquirer Corporate Tax Rate 0.002 −0.022
(0.600) (0.151)∆ Corporate Tax Rate −0.001 0.007
(0.537) (0.347)Same Religion 0.001 −0.001
(0.751) (0.848)Same Language 0.008 0.001
(0.492) (0.943)Log(Geographic Distance) 0.006 −0.009∗
(0.186) (0.078)Share Border 0.004 −0.019
(0.670) (0.230)Exchange Rate Volatility 0.132 0.364
(0.660) (0.110)Exchange Rate Growth −0.011 −0.023
(0.754) (0.644)Double-Tax Treaty −0.014 0.040∗∗
(0.533) (0.036)Bilateral Investment Treaty −0.016 −0.035∗
(0.242) (0.066)Same Legal System −0.019 0.085∗∗∗
(0.326) (0.000)| ∆ Shareholder Rights | 0.001 0.001
(0.490) (0.804)| ∆ Public Enforcement | −0.010 −0.016
(0.288) (0.103)Heckman’s Lambda −0.010 0.037∗
(0.526) (0.070)Constant −0.045 0.820
(0.713) (0.238)Year Fixed Effects Yes YesCountry Effects Yes YesAdjusted R2 0.163 0.185Observations 770 435

LOST IN TRANSLATION? CULTURAL VALUES AND MERGERS 25
Table IA.XIIHofstede/Schwartz Culture and Payment, Termination Fees, and Tender OffersFor Table IX of the PaperThis table presents cross-sectional logit regression coefficients and robust p−values, double-clustered at the acquirerand target country levels where observations are cross-border mergers. The dependent variable in columns 1 & 2 is adummy variable equal to 1 if the merger payment is all cash and 0 otherwise, in columns 3 & 4, a dummy variableequal to 1 if the merger includes a target termination fee, and in columns 5 & 6, a dummy variable equal to 1 if themerger was a tender offer. Cultural values from Hofstede (1980, 2001) and from Schwartz (1994). All other variables
are defined in the appendix. Significance at 10%, 5%, and 1%, indicated by ∗, ∗∗, and ∗∗∗.
All Cash Target Termination Fee Tender Offer
(1) (2) (3) (4) (5) (6)
∆ Egalitarianism −0.872 0.360 −0.985(0.218) (0.599) (0.195)
∆ Harmony 0.306 2.257∗∗∗ −0.112(0.116) (0.000) (0.702)
∆ Embeddedness −1.984∗ −0.232 0.266(0.079) (0.241) (0.244)
∆ Power Distance −0.355∗∗∗ −2.208∗∗∗ 0.050∗
(0.000) (0.000) (0.077)∆ Individualism −0.273∗∗ −3.198∗∗∗ −0.024
(0.024) (0.000) (0.149)∆ Masculinity −0.118∗∗∗ 0.556∗∗∗ 0.004
(0.000) (0.000) (0.457)∆ Uncertainty Avoidance −0.034 0.020 −0.009
(0.372) (0.852) (0.299)∆ Long-Term Orientation −0.185∗∗ 0.453 −0.003
(0.043) (0.314) (0.837)Transaction Value −211.281∗∗∗ −227.262∗∗∗ −9.590 −23.479 20.406∗ 34.423∗∗∗
(0.000) (0.001) (0.617) (0.353) (0.096) (0.001)Relative Size 0.024 −0.139∗ 0.018 0.053∗ −0.041∗∗∗ −0.171∗∗∗
(0.826) (0.066) (0.355) (0.073) (0.009) (0.000)Acquirer Market Value 0.312 −0.763 11.290∗∗∗ 6.011∗∗ −6.216∗∗ −18.300∗∗
(0.936) (0.884) (0.000) (0.031) (0.021) (0.030)Cash dummy −0.571 −0.593 0.750∗ 1.917∗∗∗
(0.297) (0.303) (0.083) (0.000)Tender Offer 0.891∗ 2.357∗∗∗ 0.675∗∗∗ 0.521∗
(0.055) (0.000) (0.000) (0.081)Friendly Offer −0.911∗∗ 1.083∗∗∗ 1.536∗∗ 1.025∗ 0.101 −0.586
(0.013) (0.006) (0.047) (0.100) (0.828) (0.341)Same Industry −0.879∗∗∗ −1.088∗∗∗ −0.007 −0.090 −0.028 0.300∗∗
(0.000) (0.002) (0.636) (0.645) (0.870) (0.043)Acquirer Termination Fee −1.435∗∗∗ −1.194∗∗ 6.229∗∗∗ 8.290∗∗∗ −1.576∗∗∗ −1.682∗∗∗
(0.000) (0.035) (0.000) (0.000) (0.001) (0.000)Target Termination Fee −0.194 −0.435 0.300 0.324
(0.693) (0.568) (0.116) (0.287)Target Defense −0.042 0.591∗∗∗ 0.266 0.476 0.488 −0.124
(0.937) (0.000) (0.328) (0.156) (0.223) (0.779)Acquirer Past Return −0.657∗∗∗ −0.912∗∗∗ −0.401∗ −0.644∗∗ −0.142 0.085
(0.000) (0.007) (0.079) (0.012) (0.450) (0.357)Acquirer Past Volatility 6.717∗∗∗ −29.711∗∗∗ 4.519∗ −8.440 −0.908 4.898
(0.000) (0.001) (0.058) (0.431) (0.745) (0.585)Target Past Return 0.450∗ 0.300 0.568∗∗∗ 1.005∗∗∗ 0.100 0.113
(0.079) (0.601) (0.003) (0.000) (0.410) (0.560)Target Past Volatility −12.742∗∗ −14.501∗∗ 0.349 2.311 −1.548 −2.584∗
(0.030) (0.043) (0.864) (0.398) (0.113) (0.055)Acquirer Openness 0.000 −0.143 −0.097∗∗∗ −0.137 −0.001 −0.009
(0.982) (0.195) (0.000) (0.179) (0.887) (0.713)
continued on next page

26 LOST IN TRANSLATION? CULTURAL VALUES AND MERGERS
Table IA.XII - Continued
All Cash Target Termination Fee Tender Offer
(1) (2) (3) (4) (5) (6)
Target Openness −0.020 −0.103 −0.084∗∗ −0.129 0.004 0.006(0.317) (0.293) (0.015) (0.254) (0.689) (0.721)
| ∆ Openness | 7.951 190.567∗ 30.460∗∗ 55.713 3.105∗ 21.443∗∗∗
(0.487) (0.074) (0.029) (0.626) (0.081) (0.000)Acquirer GDP/Capita −58.204 84.571 −90.107 109.228 −140.328∗∗∗ −127.493
(0.468) (0.817) (0.598) (0.755) (0.001) (0.251)Target GDP/Capita 38.903 379.621 202.820 −805.239∗ −230.092∗∗∗ −352.546∗∗∗
(0.576) (0.180) (0.318) (0.061) (0.000) (0.004)| ∆ GDP/Capita | −27.022 −491.177∗∗ 112.058∗ 324.637∗∗ 23.563 65.190
(0.492) (0.018) (0.100) (0.017) (0.207) (0.337)Acquirer Corporate Tax Rate −0.092 −0.547 1.249 6.190∗∗∗ −0.287∗∗ −0.890
(0.403) (0.438) (0.300) (0.000) (0.015) (0.142)Target Corporate Tax Rate −0.211∗∗ −1.256∗∗ 1.151 3.045∗∗∗ −0.211∗ −0.747
(0.023) (0.042) (0.271) (0.003) (0.082) (0.211)| ∆ Corporate Tax Rate | −0.073 −0.912∗∗∗ 0.228∗∗∗ 3.857∗∗ 0.021 −0.300
(0.302) (0.004) (0.006) (0.029) (0.296) (0.132)Same Religion −0.500∗∗ −1.941 −0.169 −10.368∗∗∗ −0.232 0.204
(0.027) (0.305) (0.693) (0.004) (0.174) (0.777)Same Language 1.205 2.334 −42.855 83.275∗∗ −1.318∗∗∗ −4.242∗∗
(0.106) (0.834) (0.160) (0.012) (0.007) (0.022)Log(Geographic Distance) −0.645∗∗ −1.093 0.231 −5.426∗∗∗ 0.171 0.059
(0.035) (0.256) (0.797) (0.001) (0.356) (0.891)Share Border −1.787∗∗ −4.284 −1.421 −22.804∗∗∗ 0.408 1.044
(0.012) (0.238) (0.517) (0.001) (0.383) (0.579)Exchange Rate Volatility 30.271∗∗ 61.157 −61.576 −31.454 −11.534 −6.828
(0.017) (0.282) (0.133) (0.621) (0.396) (0.752)Exchange Rate Growth 0.593 3.257∗∗∗ 0.113 −1.022 1.711∗∗∗ 1.999∗
(0.365) (0.000) (0.924) (0.542) (0.000) (0.072)Double-Tax Treaty −0.062 −21.551 1.034∗∗ 2.747∗∗∗
(0.933) (0.489) (0.046) (0.005)Bilateral Investment Treaty −1.671∗∗ −18.300 38.708 −0.060 −1.167
(0.030) (0.250) (0.433) (0.960) (0.532)Same Legal System 0.842 −25.645∗∗ −8.280 −90.400 0.296 0.078
(0.184) (0.025) (0.347) (0.264) (0.463) (0.962)| ∆ Shareholder Rights | 0.228∗ 0.301 −0.769∗∗ 24.667∗∗∗ −0.148 −0.346
(0.095) (0.783) (0.022) (0.006) (0.181) (0.244)
| ∆ Public Enforcement | −0.757∗ −4.808∗∗ −1.819 −13.222∗∗∗ 0.099 −0.902(0.086) (0.035) (0.101) (0.000) (0.703) (0.275)
Heckman’s Lambda 0.449 −7.271∗ −0.063 −4.546 0.536 2.967∗∗
(0.505) (0.057) (0.974) (0.266) (0.285) (0.035)Constant 16.051∗∗ 125.016 −66.365 −263.571 6.289 37.215
(0.025) (0.176) (0.520) (0.176) (0.113) (0.340)Year Fixed Effects Yes Yes Yes Yes Yes YesCountry Effects Yes Yes Yes Yes Yes YesObservations 727 391 720 432 821 471

LOST IN TRANSLATION? CULTURAL VALUES AND MERGERS 27
Table IA.XIIIMerger Activity in Domestic Markets Using Different Activity MeasuresFor Table III of the PaperThis table presents pooled cross-sectional tobit regression coefficients and robust p−values clusteredat the nation level. The dependent variable is the log of the number (N) or value (V) of domesticmergers of at least $1 million (001), $10 million (010), or $100 (100) million, normalized by the logGDP in the same year at the country-year level. All other variables are defined in the appendix.Significance at 10%, 5%, and 1%, indicated by ∗, ∗∗, and ∗∗∗.
Number of Domestic MergersNormalized by GDP
N001 N010 N100 V001 V010 V100
(1) (2) (3) (4) (5) (6)
Trust 0.194∗∗ 0.184∗∗ 0.184∗∗ 0.337∗∗∗ 0.367∗∗∗ 0.501∗∗∗
(0.016) (0.015) (0.014) (0.008) (0.007) (0.002)Hierarchy −0.020 −0.008 −0.049 0.059 0.078 0.061
(0.819) (0.919) (0.511) (0.691) (0.608) (0.758)Individualism −0.138∗ −0.078 0.009 −0.191∗ −0.206∗ −0.132
(0.072) (0.294) (0.917) (0.088) (0.090) (0.455)Openness −0.474∗∗ −0.597∗∗∗ −0.739∗∗∗ −0.778∗∗ −0.850∗∗ −1.218∗∗
(0.038) (0.006) (0.001) (0.034) (0.030) (0.013)Shareholder Rights 0.017∗ 0.018∗∗ 0.018∗∗ 0.039∗∗ 0.044∗∗ 0.057∗∗∗
(0.071) (0.034) (0.030) (0.019) (0.013) (0.008)Public Enforcement 0.020 0.031 0.043∗∗ 0.030 0.039 0.084∗
(0.371) (0.122) (0.013) (0.405) (0.288) (0.057)GDP/Capita 1.785 2.311∗ 3.305∗∗ 4.460∗∗ 4.347∗ 6.181∗
(0.201) (0.091) (0.023) (0.048) (0.090) (0.055)Corporate Tax Rate 0.314∗ 0.351∗∗ 0.315∗∗ 0.676∗∗ 0.754∗∗ 1.056∗∗∗
(0.065) (0.026) (0.014) (0.023) (0.014) (0.004)French Legal System −0.053 −0.032 −0.016 0.039 0.051 0.083
(0.127) (0.291) (0.551) (0.497) (0.397) (0.244)German Legal System −0.076∗∗ −0.071∗∗ −0.072∗∗ 0.032 0.031 0.023
(0.032) (0.028) (0.019) (0.596) (0.625) (0.757)Scandinavian Legal System −0.161∗∗∗ −0.152∗∗∗ −0.154∗∗∗ −0.137∗ −0.141∗ −0.161∗
(0.002) (0.002) (0.002) (0.064) (0.065) (0.053)Constant 0.158 0.118 0.042 0.125 0.099 −0.080
(0.194) (0.295) (0.691) (0.529) (0.629) (0.763)Year Fixed Effects Yes Yes Yes Yes Yes YesReligion Fixed Effects Yes Yes Yes Yes Yes YesLog likelihood 698.669 660.857 534.011 383.622 268.051∗∗∗ 30.222∗∗∗
Constant only log likelihood 334.559 256.898 118.904 75.765 −37.097 −286.566Observations 783 783 783 783 783 783

28 LOST IN TRANSLATION? CULTURAL VALUES AND MERGERS
Table IA.XIVCross-Border Merger Activity Using Different Activity MeasuresFor Table IV of the PaperThis table presents pooled cross-sectional tobit regression coefficients and robust p−values double-clustered at the acquirer and target nation levels. The dependent variable is the log of the number(N) or value (V) of domestic mergers of at least $1 million (001), normalized by the log GDP in thesame year at the country-year level. All other variables are defined in the appendix. Significance at10%, 5%, and 1%, indicated by ∗, ∗∗, and ∗∗∗.
Number of Cross-Border Mergers Normalized by GDP
N001 V001
(1) (2)
Aggregate Trust 0.055∗∗ 0.190∗∗∗
(0.049) (0.001)| ∆ Trust | −0.025 −0.102∗∗
(0.286) (0.041)| ∆ Hierarchy | −0.062∗∗ −0.017
(0.034) (0.814)| ∆ Individualism | −0.054∗ −0.059
(0.088) (0.408)Acquirer Openness 0.189 0.063
(0.178) (0.852)Target Openness 0.051 −0.131
(0.684) (0.686)| ∆ Openness | −0.106∗ 0.004
(0.084) (0.981)Acquirer GDP/Capita 0.116 0.524
(0.860) (0.730)Target GDP/Capita 0.726 1.467
(0.173) (0.325)| ∆ GDP/Capita | −0.068 −0.649
(0.887) (0.433)Target Corporate Tax Rate 0.080∗ 0.097
(0.051) (0.396)| ∆ Corporate Tax Rate | −0.047 −0.192
(0.299) (0.106)Same Religion 0.022∗∗∗ 0.054∗∗∗
(0.000) (0.000)Same Language 0.037∗∗∗ 0.021
(0.006) (0.496)Log(Geographic Distance) −0.051∗∗∗ −0.142∗∗∗
(0.000) (0.000)Share Border 0.006 0.057∗∗∗
(0.304) (0.001)Exchange Rate Volatility −0.267∗∗ −0.078∗∗∗
(0.015) (0.004)Exchange Rate Growth −0.022 0.004∗∗∗
(0.149) (0.000)
continued on next page
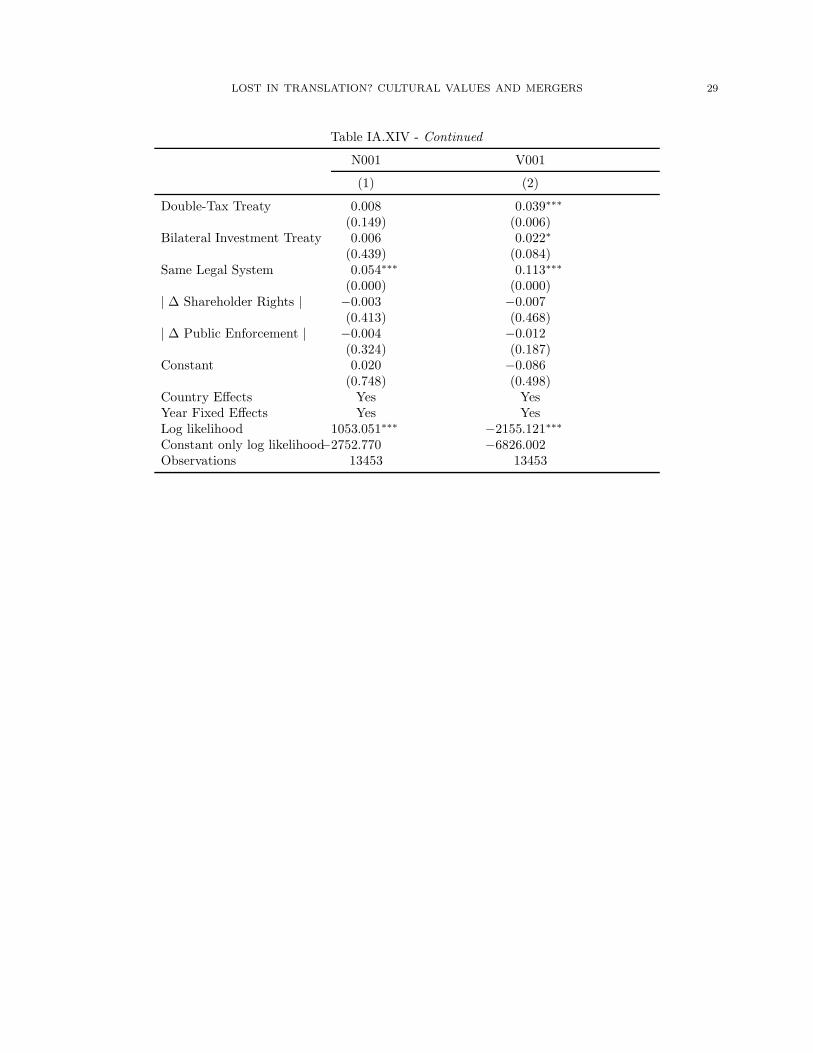
LOST IN TRANSLATION? CULTURAL VALUES AND MERGERS 29
Table IA.XIV - Continued
N001 V001
(1) (2)
Double-Tax Treaty 0.008 0.039∗∗∗
(0.149) (0.006)Bilateral Investment Treaty 0.006 0.022∗
(0.439) (0.084)Same Legal System 0.054∗∗∗ 0.113∗∗∗
(0.000) (0.000)| ∆ Shareholder Rights | −0.003 −0.007
(0.413) (0.468)| ∆ Public Enforcement | −0.004 −0.012
(0.324) (0.187)Constant 0.020 −0.086
(0.748) (0.498)Country Effects Yes YesYear Fixed Effects Yes YesLog likelihood 1053.051∗∗∗ −2155.121∗∗∗
Constant only log likelihood−2752.770 −6826.002Observations 13453 13453
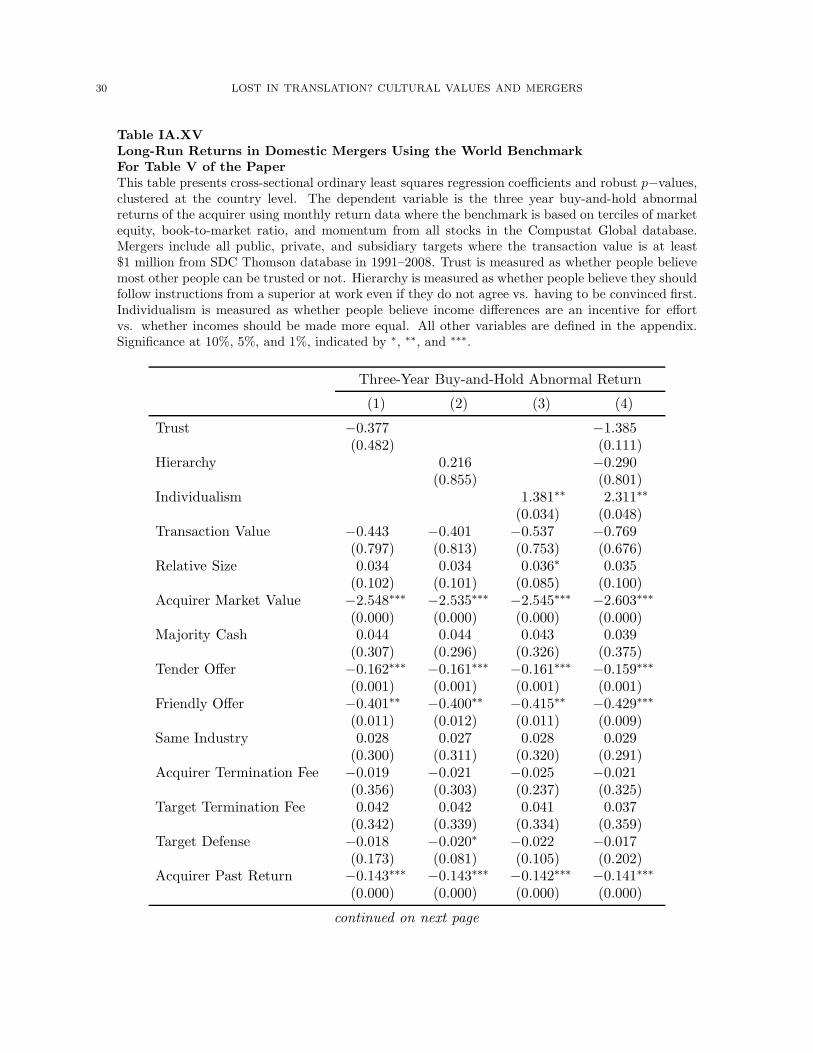
30 LOST IN TRANSLATION? CULTURAL VALUES AND MERGERS
Table IA.XVLong-Run Returns in Domestic Mergers Using the World BenchmarkFor Table V of the PaperThis table presents cross-sectional ordinary least squares regression coefficients and robust p−values,clustered at the country level. The dependent variable is the three year buy-and-hold abnormalreturns of the acquirer using monthly return data where the benchmark is based on terciles of marketequity, book-to-market ratio, and momentum from all stocks in the Compustat Global database.Mergers include all public, private, and subsidiary targets where the transaction value is at least$1 million from SDC Thomson database in 1991–2008. Trust is measured as whether people believemost other people can be trusted or not. Hierarchy is measured as whether people believe they shouldfollow instructions from a superior at work even if they do not agree vs. having to be convinced first.Individualism is measured as whether people believe income differences are an incentive for effortvs. whether incomes should be made more equal. All other variables are defined in the appendix.Significance at 10%, 5%, and 1%, indicated by ∗, ∗∗, and ∗∗∗.
Three-Year Buy-and-Hold Abnormal Return
(1) (2) (3) (4)
Trust −0.377 −1.385(0.482) (0.111)
Hierarchy 0.216 −0.290(0.855) (0.801)
Individualism 1.381∗∗ 2.311∗∗
(0.034) (0.048)Transaction Value −0.443 −0.401 −0.537 −0.769
(0.797) (0.813) (0.753) (0.676)Relative Size 0.034 0.034 0.036∗ 0.035
(0.102) (0.101) (0.085) (0.100)Acquirer Market Value −2.548∗∗∗ −2.535∗∗∗ −2.545∗∗∗ −2.603∗∗∗
(0.000) (0.000) (0.000) (0.000)Majority Cash 0.044 0.044 0.043 0.039
(0.307) (0.296) (0.326) (0.375)Tender Offer −0.162∗∗∗ −0.161∗∗∗ −0.161∗∗∗ −0.159∗∗∗
(0.001) (0.001) (0.001) (0.001)Friendly Offer −0.401∗∗ −0.400∗∗ −0.415∗∗ −0.429∗∗∗
(0.011) (0.012) (0.011) (0.009)Same Industry 0.028 0.027 0.028 0.029
(0.300) (0.311) (0.320) (0.291)Acquirer Termination Fee −0.019 −0.021 −0.025 −0.021
(0.356) (0.303) (0.237) (0.325)Target Termination Fee 0.042 0.042 0.041 0.037
(0.342) (0.339) (0.334) (0.359)Target Defense −0.018 −0.020∗ −0.022 −0.017
(0.173) (0.081) (0.105) (0.202)Acquirer Past Return −0.143∗∗∗ −0.143∗∗∗ −0.142∗∗∗ −0.141∗∗∗
(0.000) (0.000) (0.000) (0.000)
continued on next page
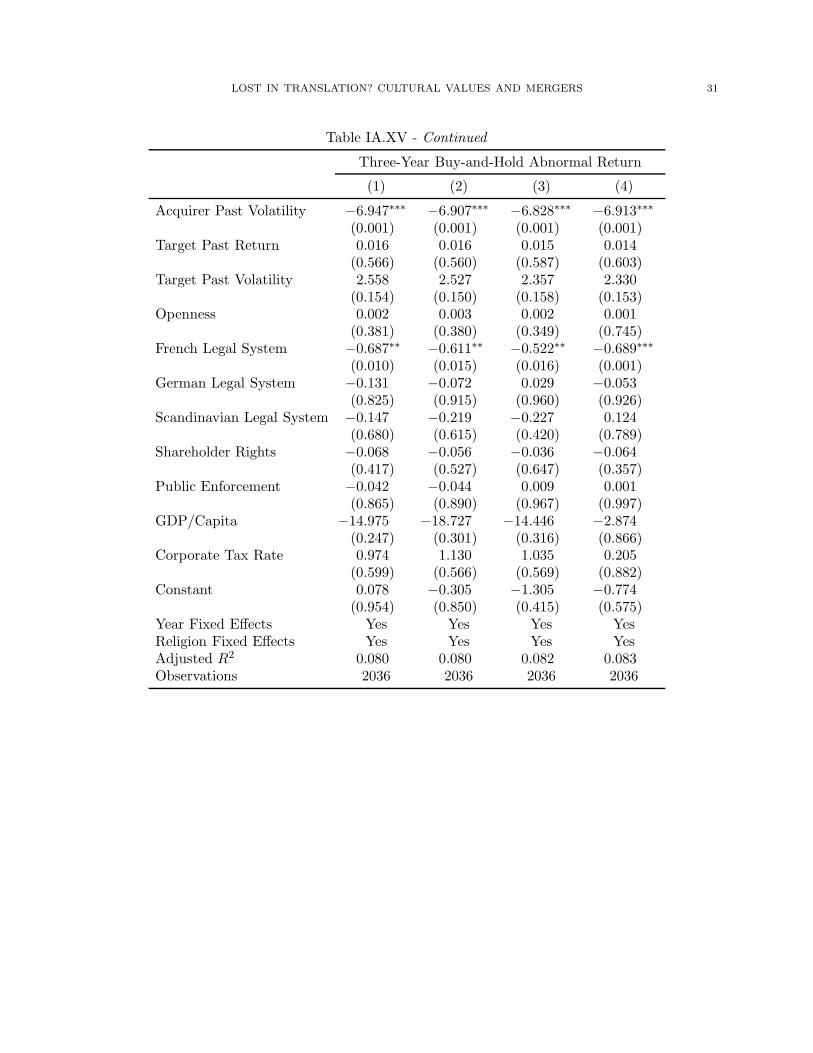
LOST IN TRANSLATION? CULTURAL VALUES AND MERGERS 31
Table IA.XV - Continued
Three-Year Buy-and-Hold Abnormal Return
(1) (2) (3) (4)
Acquirer Past Volatility −6.947∗∗∗ −6.907∗∗∗ −6.828∗∗∗ −6.913∗∗∗
(0.001) (0.001) (0.001) (0.001)Target Past Return 0.016 0.016 0.015 0.014
(0.566) (0.560) (0.587) (0.603)Target Past Volatility 2.558 2.527 2.357 2.330
(0.154) (0.150) (0.158) (0.153)Openness 0.002 0.003 0.002 0.001
(0.381) (0.380) (0.349) (0.745)French Legal System −0.687∗∗ −0.611∗∗ −0.522∗∗ −0.689∗∗∗
(0.010) (0.015) (0.016) (0.001)German Legal System −0.131 −0.072 0.029 −0.053
(0.825) (0.915) (0.960) (0.926)Scandinavian Legal System −0.147 −0.219 −0.227 0.124
(0.680) (0.615) (0.420) (0.789)Shareholder Rights −0.068 −0.056 −0.036 −0.064
(0.417) (0.527) (0.647) (0.357)Public Enforcement −0.042 −0.044 0.009 0.001
(0.865) (0.890) (0.967) (0.997)GDP/Capita −14.975 −18.727 −14.446 −2.874
(0.247) (0.301) (0.316) (0.866)Corporate Tax Rate 0.974 1.130 1.035 0.205
(0.599) (0.566) (0.569) (0.882)Constant 0.078 −0.305 −1.305 −0.774
(0.954) (0.850) (0.415) (0.575)Year Fixed Effects Yes Yes Yes YesReligion Fixed Effects Yes Yes Yes YesAdjusted R2 0.080 0.080 0.082 0.083Observations 2036 2036 2036 2036

32 LOST IN TRANSLATION? CULTURAL VALUES AND MERGERS
Table IA.XVILong-Run Returns in Domestic Mergers Using Country BenchmarksFor Table V of the PaperThis table presents cross-sectional ordinary least squares regression coefficients and robust p−values,clustered at the country level. The dependent variable is the three year buy-and-hold abnormalreturns of the acquirer using monthly return data where the benchmark is based on terciles of marketequity, book-to-market ratio, and momentum from all stocks in the acquirer’s home country, excludingthe acquirer. Mergers include all public, private, and subsidiary targets where the transaction valueis at least $1 million from SDC Thomson database in 1991–2008. Trust is measured as whetherpeople believe most other people can be trusted or not. Hierarchy is measured as whether peoplebelieve they should follow instructions from a superior at work even if they do not agree vs. havingto be convinced first. Individualism is measured as whether people believe income differences are anincentive for effort vs. whether incomes should be made more equal. All other variables are definedin the appendix. Significance at 10%, 5%, and 1%, indicated by ∗, ∗∗, and ∗∗∗.
Three-Year Buy-and-Hold Abnormal Return
(1) (2) (3) (4)
Trust 0.365 −0.639(0.461) (0.564)
Hierarchy 1.217 0.624(0.331) (0.673)
Individualism 1.265∗ 1.486(0.051) (0.212)
Transaction Value −1.088 −0.964 −1.185 −1.127(0.625) (0.655) (0.607) (0.624)
Relative Size 0.033 0.032 0.035 0.033(0.151) (0.181) (0.145) (0.150)
Acquirer Market Value −3.480∗∗∗ −3.481∗∗∗ −3.510∗∗∗ −3.524∗∗∗
(0.000) (0.000) (0.000) (0.000)Majority Cash 0.071∗ 0.069 0.068 0.066
(0.091) (0.112) (0.112) (0.120)Tender Offer −0.103∗ −0.093∗ −0.099∗ −0.093∗
(0.075) (0.097) (0.080) (0.087)Friendly Offer −0.414∗∗ −0.414∗∗ −0.418∗∗ −0.419∗∗
(0.022) (0.022) (0.022) (0.022)Same Industry 0.034∗ 0.031∗ 0.034∗ 0.033∗
(0.066) (0.083) (0.064) (0.057)Acquirer Termination Fee −0.064∗∗ −0.065∗∗ −0.066∗∗ −0.066∗∗
(0.012) (0.015) (0.012) (0.013)Target Termination Fee 0.036 0.033 0.033 0.030
(0.289) (0.265) (0.274) (0.296)Target Defense −0.014 −0.015 −0.016 −0.015
(0.331) (0.256) (0.263) (0.291)Acquirer Past Return −0.153∗∗∗ −0.155∗∗∗ −0.152∗∗∗ −0.154∗∗∗
(0.000) (0.000) (0.000) (0.000)
continued on next page

LOST IN TRANSLATION? CULTURAL VALUES AND MERGERS 33
Table IA.XVI - Continued
Three-Year Buy-and-Hold Abnormal Return
(1) (2) (3) (4)
Acquirer Past Volatility −6.706∗∗∗ −6.657∗∗∗ −6.664∗∗∗ −6.640∗∗∗
(0.005) (0.005) (0.005) (0.005)Target Past Return 0.038 0.039 0.039 0.040
(0.116) (0.113) (0.113) (0.106)Target Past Volatility 1.286 1.265 1.157 1.151
(0.483) (0.468) (0.499) (0.494)Openness 0.005∗∗ 0.006∗ 0.005∗ 0.004∗
(0.047) (0.051) (0.058) (0.094)French Legal System 0.252 0.242∗ 0.285∗ 0.222
(0.277) (0.077) (0.063) (0.186)German Legal System 0.950 0.975∗ 1.021∗ 1.016∗
(0.129) (0.096) (0.081) (0.055)Scandinavian Legal System 0.210 0.468 0.386 0.675
(0.713) (0.314) (0.366) (0.315)Shareholder Rights 0.212∗∗ 0.189∗∗ 0.217∗∗ 0.196∗∗∗
(0.026) (0.020) (0.010) (0.008)Public Enforcement −0.276 −0.392 −0.257 −0.348
(0.341) (0.138) (0.258) (0.213)GDP/Capita −3.108 −12.798 1.392 −0.197
(0.819) (0.571) (0.901) (0.994)Corporate Tax Rate 0.343 −0.163 −0.003 −0.634
(0.850) (0.911) (0.999) (0.636)Constant −1.973 −1.795 −2.606∗ −2.395∗∗
(0.137) (0.147) (0.061) (0.033)Year Fixed Effects Yes Yes Yes YesReligion Fixed Effects Yes Yes Yes YesAdjusted R2 0.059 0.060 0.061 0.060Observations 1947 1947 1947 1947

34 LOST IN TRANSLATION? CULTURAL VALUES AND MERGERS
Table IA.XVIILong-Run Returns in Cross-Border Mergers Using the World BenchmarkFor Table VI of the PaperThis table presents cross-sectional ordinary least squares regression coefficients and robust p−values, clusteredat the acquirer country levels. The dependent variable is the three year buy-and-hold abnormal returns ofthe acquirer using monthly return data where the benchmark is based on terciles of market equity, book-to-market ratio, and momentum from all stocks in the Compustat Global database. Trust is measured aswhether people believe most other people can be trusted or not. Hierarchy is whether people believe theyshould follow instructions from a superior at work even if they do not agree vs. having to be convinced first.Individualism is whether people believe income differences are an incentive for effort vs. whether incomesshould be made more equal. Country effects are dummy variables for the acquirer’s home country. | ∆ | isthe absolute difference between acquiror and target nation. All other variables are defined in the appendix.Significance at 10%, 5%, and 1%, indicated by ∗, ∗∗, and ∗∗∗.
Three-Year Buy-and-Hold Abnormal Return
(1) (2) (3) (4) (5)
Aggregate Trust 0.496 0.358(0.239) (0.338)
| ∆ Trust | 0.466 0.401(0.273) (0.307)
| ∆ Hierarchy | −0.638 −0.647(0.284) (0.337)
| ∆ Individualism | 0.779 0.650(0.387) (0.486)
Transaction Value −8.451 −9.269 −9.243 −8.715 −9.224(0.339) (0.284) (0.284) (0.312) (0.282)
Relative Size 0.046∗∗∗ 0.043∗∗∗ 0.048∗∗∗ 0.045∗∗∗ 0.046∗∗∗
(0.002) (0.003) (0.001) (0.002) (0.001)Acquirer Market Value −2.135 −2.071 −2.132 −2.066 −2.112
(0.131) (0.119) (0.121) (0.120) (0.134)Majority Cash 0.038 0.016 0.019 0.012 0.041
(0.751) (0.893) (0.874) (0.915) (0.735)Tender Offer −0.039 −0.027 −0.035 −0.019 −0.035
(0.689) (0.780) (0.736) (0.836) (0.731)Friendly Offer 0.124 0.119 0.130 0.122 0.118
(0.240) (0.267) (0.208) (0.256) (0.269)Same Industry 0.057 0.064 0.061 0.057 0.060
(0.320) (0.287) (0.304) (0.341) (0.306)Acquirer Termination Fee −0.148 −0.136 −0.144 −0.147 −0.147
(0.364) (0.405) (0.387) (0.363) (0.381)Target Termination Fee 0.003 0.002 0.002 −0.009 0.005
(0.979) (0.985) (0.982) (0.932) (0.963)Target Defense 0.139 0.143 0.147 0.131 0.128
(0.485) (0.467) (0.448) (0.512) (0.512)Acquirer Past Return −0.144∗∗ −0.146∗∗ −0.147∗∗ −0.147∗∗ −0.147∗∗
(0.033) (0.026) (0.033) (0.029) (0.037)Acquirer Past Volatility −5.549∗ −5.724∗∗ −5.616∗∗ −5.483∗∗ −5.384∗
(0.050) (0.040) (0.048) (0.048) (0.065)Target Past Return 0.018 0.022 0.025 0.026 0.027
(0.595) (0.524) (0.480) (0.460) (0.462)Target Past Volatility −1.039 −0.982 −1.137 −1.121 −1.154
(0.258) (0.283) (0.226) (0.230) (0.242)
continued on next page

LOST IN TRANSLATION? CULTURAL VALUES AND MERGERS 35
Table IA.XVII - Continued
Three-Year Buy-and-Hold Abnormal Return
(1) (2) (3) (4) (5)
Acquirer Openness 0.006 0.006 0.005 0.006 0.004(0.499) (0.507) (0.550) (0.494) (0.635)
Target Openness 0.002∗ 0.002∗ 0.002∗∗ 0.002∗ 0.002∗
(0.082) (0.071) (0.044) (0.097) (0.088)| ∆ Openness | −1.665 −1.872 −1.710 −1.794 −1.680
(0.315) (0.258) (0.297) (0.279) (0.317)Acquirer GDP/Capita 2.237 −0.165 −3.313 0.143 −0.822
(0.939) (0.995) (0.908) (0.996) (0.979)Target GDP/Capita −11.839∗ −7.077 −7.362 −7.528 −7.400
(0.095) (0.361) (0.326) (0.336) (0.334)| ∆ GDP/Capita | −7.676 −6.414 −2.971 −8.114 −5.452
(0.324) (0.428) (0.718) (0.333) (0.543)Acquirer Corporate Tax Rate −0.049 −0.057 −0.060 −0.051 −0.056
(0.241) (0.175) (0.121) (0.209) (0.194)Target Corporate Tax Rate 0.008 0.006 0.007 0.007 0.008
(0.413) (0.573) (0.484) (0.488) (0.475)| ∆ Corporate Tax Rate | −0.003 −0.006 −0.006 −0.006 −0.004
(0.786) (0.599) (0.603) (0.623) (0.760)Same Religion 0.013 0.004 −0.003 0.011 −0.015
(0.822) (0.949) (0.961) (0.847) (0.825)Same Language 0.151 0.163 0.135 0.161 0.165
(0.154) (0.129) (0.180) (0.122) (0.118)Log(Geographic Distance) 0.087∗ 0.080∗ 0.089∗ 0.086∗ 0.099∗
(0.054) (0.071) (0.061) (0.056) (0.051)Share Border 0.047 0.045 0.026 0.063 0.064
(0.679) (0.686) (0.822) (0.601) (0.567)Exchange Rate Volatility 5.523 4.825 5.474 5.203 6.317∗
(0.165) (0.239) (0.154) (0.193) (0.096)Exchange Rate Growth 0.071 0.070 0.052 0.038 0.072
(0.853) (0.859) (0.893) (0.922) (0.856)Double-Tax Treaty −0.112 −0.112 −0.138 −0.140 −0.104
(0.626) (0.626) (0.578) (0.549) (0.663)Bilateral Investment Treaty 0.027 −0.036 −0.089 −0.005 −0.032
(0.880) (0.812) (0.589) (0.972) (0.877)Same Legal System 0.115 0.139 0.061 0.049 0.151
(0.565) (0.492) (0.740) (0.797) (0.449)| ∆ Shareholder Rights | 0.013 0.017 0.016 0.014 0.021
(0.715) (0.636) (0.673) (0.686) (0.573)| ∆ Public Enforcement | −0.034 −0.020 −0.029 −0.048 −0.071
(0.639) (0.790) (0.679) (0.612) (0.415)Heckman’s Lambda 0.011 0.028 0.003 0.014 0.004
(0.947) (0.865) (0.985) (0.937) (0.982)Constant 0.946 1.544 1.861 1.332 1.213
(0.687) (0.438) (0.331) (0.522) (0.606)Year Fixed Effects Yes Yes Yes Yes YesAcquirer Country Effects Yes Yes Yes Yes YesAdjusted R2 0.125 0.123 0.124 0.123 0.123Observations 483 483 483 483 483

36 LOST IN TRANSLATION? CULTURAL VALUES AND MERGERS
Table IA.XVIIILong-Run Returns in Cross-Border Mergers Using Country BenchmarksFor Table VI of the PaperThis table presents cross-sectional ordinary least squares regression coefficients and robust p−values, clusteredat the acquirer country levels. The dependent variable is the three year buy-and-hold abnormal returns ofthe acquirer using monthly return data where the benchmark is based on terciles of market equity, book-to-market ratio, and momentum from all stocks in the acquirer’s home country, excluding the acquirer. Trustis measured as whether people believe most other people can be trusted or not. Hierarchy is whether peoplebelieve they should follow instructions from a superior at work even if they do not agree vs. having to beconvinced first. Individualism is whether people believe income differences are an incentive for effort vs.whether incomes should be made more equal. Country effects are dummy variables for the acquirer’s homecountry. | ∆ | is the absolute difference between acquiror and target nation. All other variables are definedin the appendix. Significance at 10%, 5%, and 1%, indicated by ∗, ∗∗, and ∗∗∗.
Three-Year Buy-and-Hold Abnormal Return
(1) (2) (3) (4) (5)
Aggregate Trust 0.415 0.148(0.253) (0.604)
| ∆ Trust | 0.082 −0.034(0.876) (0.945)
| ∆ Hierarchy | −1.209∗∗ −1.244∗
(0.043) (0.063)| ∆ Individualism | 0.818 0.985
(0.348) (0.311)Transaction Value 0.644 0.540 −0.055 0.400 −0.222
(0.915) (0.927) (0.993) (0.946) (0.970)Relative Size 0.022 0.022 0.028 0.022 0.028
(0.312) (0.358) (0.149) (0.304) (0.197)Acquirer Market Value −1.637 −1.643 −1.628 −1.644 −1.622
(0.348) (0.336) (0.338) (0.343) (0.359)Majority Cash 0.092 0.069 0.081 0.068 0.089
(0.526) (0.628) (0.563) (0.630) (0.532)Tender Offer 0.050 0.055 0.042 0.059 0.046
(0.629) (0.586) (0.703) (0.552) (0.680)Friendly Offer 0.086 0.091 0.081 0.089 0.075
(0.218) (0.243) (0.195) (0.186) (0.320)Same Industry −0.042 −0.038 −0.032 −0.043 −0.038
(0.387) (0.442) (0.483) (0.358) (0.424)Acquirer Termination Fee −0.118 −0.113 −0.120 −0.122 −0.132
(0.493) (0.516) (0.495) (0.477) (0.470)Target Termination Fee −0.024 −0.024 −0.023 −0.032 −0.032
(0.639) (0.647) (0.662) (0.533) (0.533)Target Defense 0.068 0.070 0.060 0.061 0.047
(0.674) (0.670) (0.714) (0.704) (0.770)Acquirer Past Return −0.122∗∗∗ −0.124∗∗∗ −0.125∗∗∗ −0.126∗∗∗ −0.127∗∗∗
(0.003) (0.002) (0.003) (0.002) (0.005)Acquirer Past Volatility 1.902 1.902 2.043 2.206 2.408
(0.605) (0.610) (0.580) (0.559) (0.522)Target Past Return 0.008 0.012 0.019 0.016 0.023
(0.868) (0.823) (0.716) (0.761) (0.654)Target Past Volatility −1.291 −1.284 −1.493 −1.368 −1.593
(0.320) (0.324) (0.262) (0.290) (0.247)
continued on next page

LOST IN TRANSLATION? CULTURAL VALUES AND MERGERS 37
Table IA.XVIII - Continued
Three-Year Buy-and-Hold Abnormal Return
(1) (2) (3) (4) (5)
Acquirer Openness 0.003 0.002 0.001 0.002 0.001(0.737) (0.751) (0.915) (0.751) (0.934)
Target Openness 0.003∗ 0.003∗∗ 0.003∗∗ 0.003∗ 0.003∗
(0.051) (0.039) (0.028) (0.083) (0.057)| ∆ Openness | −1.961 −1.945 −1.739 −1.952 −1.763
(0.216) (0.225) (0.246) (0.211) (0.262)Acquirer GDP/Capita −3.100 −5.087 −9.965 −3.497 −7.526
(0.915) (0.858) (0.721) (0.903) (0.790)Target GDP/Capita −18.156∗∗ −16.162∗∗ −11.729∗ −15.115∗ −10.683
(0.025) (0.028) (0.084) (0.066) (0.131)| ∆ GDP/Capita | −6.143 −5.509 2.127 −7.603 −0.278
(0.502) (0.545) (0.749) (0.444) (0.972)Acquirer Corporate Tax Rate 0.032 0.027 0.003 0.027 0.004
(0.574) (0.626) (0.946) (0.619) (0.931)Target Corporate Tax Rate 0.009 0.007 0.008 0.008 0.009
(0.452) (0.510) (0.509) (0.509) (0.454)| ∆ Corporate Tax Rate | 0.013 0.012 0.012 0.012 0.012
(0.381) (0.399) (0.437) (0.427) (0.479)Same Religion 0.034 0.032 0.002 0.033 0.002
(0.554) (0.621) (0.971) (0.580) (0.979)Same Language 0.066 0.070 0.036 0.082 0.052
(0.492) (0.474) (0.694) (0.387) (0.593)Log(Geographic Distance) 0.113∗ 0.112∗ 0.126∗ 0.116∗ 0.133∗
(0.089) (0.088) (0.066) (0.087) (0.067)Share Border 0.069 0.057 0.028 0.092 0.076
(0.557) (0.648) (0.814) (0.519) (0.572)Exchange Rate Volatility 11.118∗∗ 10.525∗∗ 11.372∗∗∗ 10.989∗∗ 12.126∗∗∗
(0.021) (0.032) (0.009) (0.025) (0.004)Exchange Rate Growth 0.282 0.260 0.293 0.253 0.295
(0.461) (0.502) (0.457) (0.507) (0.452)Double-Tax Treaty −0.208 −0.192 −0.223 −0.209 −0.243
(0.363) (0.412) (0.376) (0.374) (0.370)Bilateral Investment Treaty −0.419∗ −0.482∗∗ −0.568∗∗ −0.450∗∗ −0.508∗∗
(0.074) (0.033) (0.018) (0.032) (0.036)Same Legal System 0.064 −0.004 −0.054 −0.026 −0.043
(0.761) (0.983) (0.763) (0.894) (0.840)| ∆ Shareholder Rights | −0.037 −0.039 −0.033 −0.036 −0.029
(0.316) (0.314) (0.378) (0.308) (0.460)| ∆ Public Enforcement | 0.085 0.092 0.060 0.057 0.013
(0.392) (0.364) (0.470) (0.601) (0.886)Heckman’s Lambda 0.049 0.053 0.045 0.047 0.037
(0.815) (0.803) (0.822) (0.821) (0.850)Constant −2.673 −2.104 −1.531 −2.230 −1.883
(0.289) (0.349) (0.455) (0.339) (0.401)Year Fixed Effects Yes Yes Yes Yes YesAcquirer Country Effects Yes Yes Yes Yes YesAdjusted R2 0.037 0.035 0.045 0.036 0.040Observations 393 393 393 393 393