loster trade usiness development strategy (ase study … · the method used in this research is the...
TRANSCRIPT
GSJ: Volume 7, Issue 1, January 2019, Online: ISSN 2320-9186
www.globalscientificjournal.com
LOBSTER TRADE BUSINESS DEVELOPMENT STRATEGY (CASE STUDY AT PT ASI PUDJIASTUTI MARINE PRODUCT) Dhea Zeria Santika1, Asep Agus Handaka Suryana2, Rusky Intan Pratama2 and Iwang Gumilar2 1Student at Faculty of Fisheries and Marine Science, Padjadjaran University, Bandung – Sumedang KM. 21 Jatinangor 45363, Indonesia
E-mail address: [email protected] 2Lecturer at Faculty of Fisheries and Marine Science, Padjadjaran University, Bandung – Sumedang KM. 21 Jatinangor 45363, Indonesia
E-mail address: [email protected]
KeyWords
Business Development Strategy, External Factors, Internal Factors, Live Lobster Trading, SWOT Analysis.
ABSTRACT
The strategy of developing a live lobster trading business is carried out to determine the internal and external factors of the company and formulate the right alternative strategy for PT. ASI Pudjiastuti Marine Product. This research was conducted at PT. ASI Pudjiastuti Marine Product, Pananjung Village, Pangandaran District, Pangandaran Regency. The implementation starts from March 16, 2018 to December 21, 2018. The method used in this research is the case study method at PT ASI Pudjiastuti Marine Product by collecting primary data and secondary data. The sampling method used was purposive sampling and data processing through descriptive analysis using SWOT analysis. The results of the research show that the best strategy for developing a live lobster trading business at PT ASI Pudjiastuti Marine Product is by implementing a SO strategy or an aggressive growth strategy with coordinates 0.43; 0.11, which is to exert internal power to fight the opportunities that exist.
GSJ: Volume 7, Issue 1, January 2019 ISSN 2320-9186
18
GSJ© 2019 www.globalscientificjournal.com
INTRODUCTION
Lobster is a fishery commodity that has high economic value in the trade of fishery products. The average producer price reaches Rp 211,981 per kilogram in the 2011-2014 period (CBS 2015). The average producer price of Indonesian lobsters shows positive growth in that time period. According to Kanna (2006), lobster prices are high and have an increasing trend due to the high demand for lob-sters which are faced with limited production volumes. The condition of high-selling lobsters is lobster that is alive and complete in its body parts, that is, no part of the body has been broken or lost (Soekendarsi 2013).
As the population increases, the demand for basic necessities, including the demand for protein, is also increasing. Changes in the trend of public consumption patterns from red meat to white meat resulted in increased demand for fishery commodities (Rahmah 2018). The level of fish consumption in Indonesia has increased every year. In 2014 it was recorded at 38.14 kg/cap/year and contin-ued to increase to 41.11 (2015), 43.94 kg/cap/year (2016), and 46.49 kg/cap/year (2017) (MMAF 2017). Increased consumption of marine fish provides an opportunity for fishermen and business people to develop lobster capture and sale business in the future.
Pangandaran is one area in West Java that has high potential for fish and crayfish (lobster). The development of marine fisheries (lob-ster fishing) on Pangandaran coast collides with the problem of resource sustainability. The fishing effort carried out in the Panganda-ran area has exceeded the maximum sustainable limit so that the catch has decreased in number (Nurhayati 2013). In 2003-2014 lobster fisheries production experienced fluctuating growth, but in 2014 lobster production of capture fisheries experienced a signifi-cant decrease in production, which was 38.8% from 16,482 tons to 10,086 tons (MMAF 2015). Based on the results of identification of landed catches there are seven species of lobster on Pangandaran beach, but commonly found there are four types, namely pearl lobster, rock lobster, green bamboo lobster and green sand lobster (Darusman 2000).
PT. ASI Pudjiastuti Marine Product located in Pangandaran is one of the companies engaged in fisheries trading, especially the sale of live lobsters. Production carried out by PT. ASI Pudjiastuti Marine Product depends on the number of lobsters supplied by the fisher-men, so the amount of lobster production every month becomes erratic. The supply of lobsters that are still dependent on catches originating from nature has an impact on the difficulty of meeting buyer demand (Purwoko 2013).
Changes in the external environment that continue to occur make the company must have an alternative business development strategy. Strategy is a way in which the organization will achieve its objectives, in accordance with external and internal factors faced by the organization (Jatmiko 2003). A strategic planning can be done using analysis of Strength, Weakness, Opportunities, Threats (SWOT). SWOT analysis is a method for generating alternative strategies based on internal weaknesses and strengths as well as ex-ternal opportunities and threats of the company (Rangkuti 2017).
Based on the description above it can be concluded that the lobster trade carried out by PT ASI Pudjiastuti Marine Product has strengths, weaknesses, opportunities, and threats that must be addressed. Therefore research is needed on the strategy of develop-ing a live lobster trading business at PT ASI Pudjiastuti Marine Product. Strategic planning is important to obtain a competitive ad-vantage and have products that are in accordance with the wishes of consumers with optimal support from existing resources.
METHODS
Research Sites and Times
Research was conducted in March - December 2018, which included data collection, data analysis, and final report writing. This re-search was conducted at PT. ASI Pudjiastuti Marine Product, Pananjung Village, Pangandaran District, Pangandaran Regency by inter-viewing directly using questionnaires to several stakeholders.
The Method Research
The method used in this research is the case study method at PT ASI Pudjiastuti Marine Product by collecting primary data and sec-ondary data. Case studies are a series of scientific activities carried out intensively, in detail and in depth about a program, event, and activity, both at the individual level, a group of people, or an organization to obtain in-depth knowledge of the event (Raharjo 2017).
Data Collection Method
The data collection method used in this research was conducted in three ways, namely interviews with questionnaire assistance to stakeholders, direct observation, and study of literature/documents.
GSJ: Volume 7, Issue 1, January 2019 ISSN 2320-9186
19
GSJ© 2019 www.globalscientificjournal.com
Respondents' Data Collection Techniques
Determination of the sample using purposive sampling, that is, respondents who were deliberately chosen to fulfill certain objectives by relying on logic on the applicable rules (Fauzi 2001). Criteria for respondents to be interviewed and given questionnaires, namely: (1) Respondents are founders or employees who work at PT. ASI Pudjiastuti Marine Product. (2) Respondents have worked at PT. ASI Pudjiastuti Marine Product at least the last 2 years. (3) Respondents understand the production activities and environmental conditions of the company.
Data Analysis Methods
The data analysis method used is a descriptive method using analysis of Strength, Weakness, Opportunities, Threats (SWOT). The method of description analysis is an analytical method that seeks to explain the condition of the object of study according to certain criteria so that it can provide an actual picture of what happened at the research site (Gumilar 2012). SWOT analysis can determine the most appropriate alternative strategies to be applied by industry. The tools used in formulating the company's strategy are the Internal Factor Evaluation Matrix (IFE), External Factor Evaluation Matrix (EFE) and matrix Strength, Weakness, Opportunities, Threats (SWOT) (Rangkuti 2017). Internal strategic factor data were evaluated using the IFE matrix presented in Table 1, while external factor data was evaluated using the EFE matrix presented in Table 2. The total score results of each analysis were used to determine the position of the company us-ing quadrant analysis Strength, Weakness, Opportunities, Threats (SWOT) with the formula (Ariyani 2017):
S - W; O - T Where: S = Strength O = Opportunity W = Weakness T = Threats
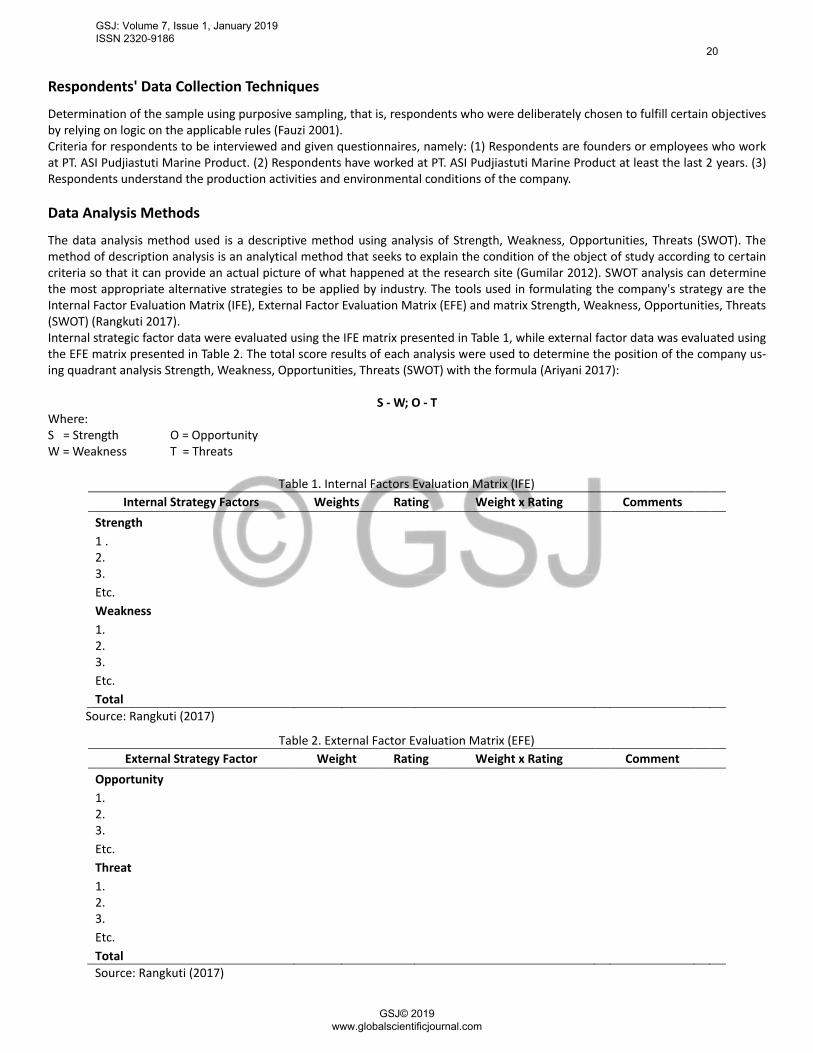
Table 1. Internal Factors Evaluation Matrix (IFE)
Internal Strategy Factors Weights Rating Weight x Rating Comments
Strength
1 .
2. 3.
Etc.
Weakness
1.
2. 3.
Etc.
Total
Source: Rangkuti (2017)
Table 2. External Factor Evaluation Matrix (EFE)
External Strategy Factor Weight Rating Weight x Rating Comment
Opportunity
1.
2. 3.
Etc.
Threat
1.
2. 3.
Etc.
Total
Source: Rangkuti (2017)
GSJ: Volume 7, Issue 1, January 2019 ISSN 2320-9186
20
GSJ© 2019 www.globalscientificjournal.com
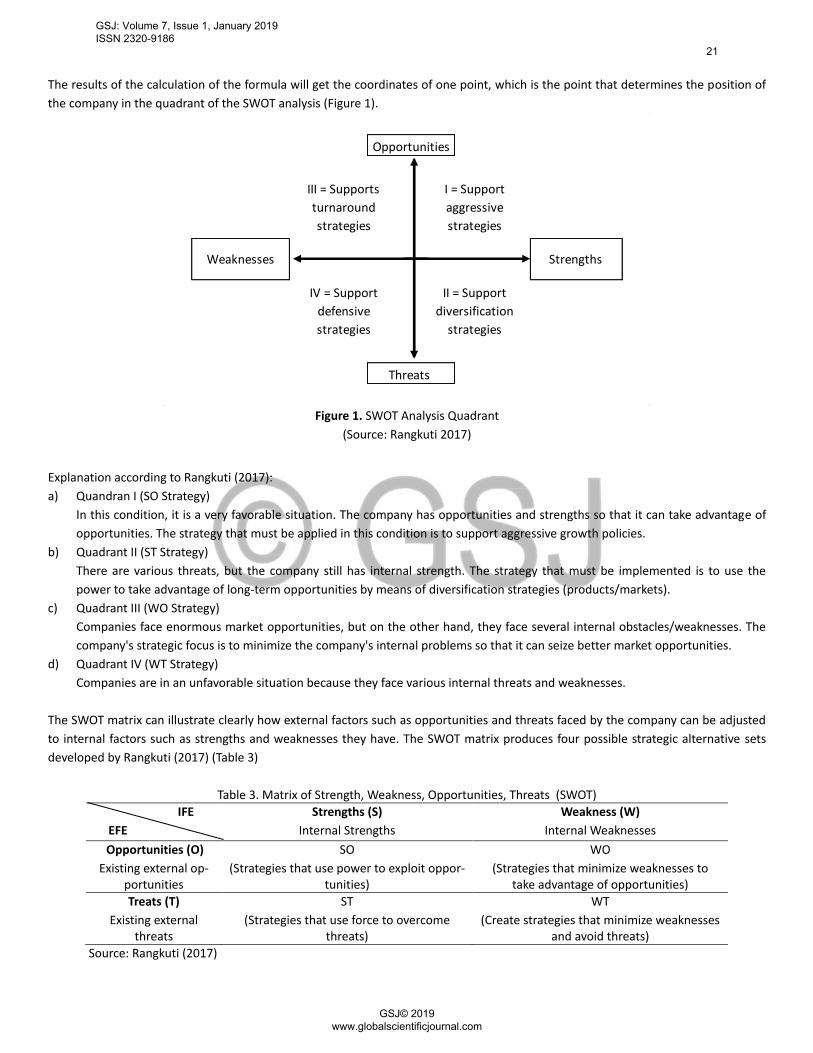
The results of the calculation of the formula will get the coordinates of one point, which is the point that determines the position of
the company in the quadrant of the SWOT analysis (Figure 1).
Figure 1. SWOT Analysis Quadrant
(Source: Rangkuti 2017)
Explanation according to Rangkuti (2017):
a) Quandran I (SO Strategy)
In this condition, it is a very favorable situation. The company has opportunities and strengths so that it can take advantage of
opportunities. The strategy that must be applied in this condition is to support aggressive growth policies.
b) Quadrant II (ST Strategy)
There are various threats, but the company still has internal strength. The strategy that must be implemented is to use the
power to take advantage of long-term opportunities by means of diversification strategies (products/markets).
c) Quadrant III (WO Strategy)
Companies face enormous market opportunities, but on the other hand, they face several internal obstacles/weaknesses. The
company's strategic focus is to minimize the company's internal problems so that it can seize better market opportunities.
d) Quadrant IV (WT Strategy)
Companies are in an unfavorable situation because they face various internal threats and weaknesses.
The SWOT matrix can illustrate clearly how external factors such as opportunities and threats faced by the company can be adjusted
to internal factors such as strengths and weaknesses they have. The SWOT matrix produces four possible strategic alternative sets
developed by Rangkuti (2017) (Table 3)
Table 3. Matrix of Strength, Weakness, Opportunities, Threats (SWOT)
IFE Strengths (S) Weakness (W)
EFE Internal Strengths Internal Weaknesses
Opportunities (O) SO WO
Existing external op-portunities
(Strategies that use power to exploit oppor-tunities)
(Strategies that minimize weaknesses to take advantage of opportunities)
Treats (T) ST WT
Existing external threats
(Strategies that use force to overcome threats)
(Create strategies that minimize weaknesses and avoid threats)
Source: Rangkuti (2017)
IV = Support
defensive
strategies
II = Support
diversification
strategies
Threats
Opportunities
III = Supports
turnaround
strategies
I = Support
aggressive
strategies
Weaknesses Strengths
GSJ: Volume 7, Issue 1, January 2019 ISSN 2320-9186
21
GSJ© 2019 www.globalscientificjournal.com

RESULT AND DISCUSSION Matrix Internal Factor Evaluation (IFE) and Matrix External Factor Evaluation (EFE)
The results of direct observation with interviews and questionnaires with stakeholders on its assessment of internal factors has a total score of each ie 1.22 for the strength and 0.79 for weakness, so that more power dominate the weaknesses possessed in de-termining the development strategy of the live lobster trading business at PT ASI Pudjiastuti Marine Product. In the assessment of external factors the company has a total score of 1.20 each for opportunities and 1.09 to threats, so that the external opportunities more dominating factor threats that companies face in determining the business development strategy. This total score can indicate the company's reaction to its internal and external strategic factors, and can also be used to compare this company with other similar companies or in the same industry group.
The following is the calculation of the internal factors of the company to determine the competitive strategy used through the SWOT analysis presented in Table 4. While the results of the calculation of the company's external factors to determine the competitive strategies used through the SWOT analysis are presented in Table 5.
Table 4. Respondents' Assessment Results from Internal Strategy Factors
No Factors Internal Strategy Weight Rating Score
(Weight x Rating)
Strength
1. Maximum production capacity that can be done by the company
0,10 2 0,20
2. Availability of business capital as supporting business activities.
0,11 1,6 0,18
3. The cash flow and the funding structure are appro-priate and efficient.
0,11 1,8 0,20
4. Availability of facilities and infrastructure to support business activities.
0,12 2,2 0,26
5. Raw lobster quality ingredients. 0,11 1,6 0,18 6. Use of technology in production activities 0,08 2,6 0,21
Total Strength 0,63 1,22
Weakness
1. Geographical position and topographic conditions of the location of business activities.
0,07 2,6 0,18
2. Quality and quantity of human resources 0,07 1,8 0,13 3. Price of live lobster products 0,08 3 0,24 4. Product promotion activities as business activity
support. 0,06 2 0,12
5. Availability of adequate lobster raw materials 0,04 1,2 0,05 6. Use of the internet as a media for promotion and
marketing 0,05 1,4 0,07
Number of Weaknesses 0,37 0,79 TOTAL 1
Table 5. Results of Respondent's Assessment of Factors of External Strategy
No Factors External Strategy Weight Rating Score
(Weight x Rating)
Opportunity
1. Market demand for live lobster commodities 0,13 2,4 0,30 2. Government regulations on size minimum lobsters
that can be caught 0,13 2,6 0,34
3. Consumer purchasing power on live lobster com-modities offered
0,15 1,8 0,26
4. Existence of company partners (Fishermen) 0,13 2,2 0, 29
GSJ: Volume 7, Issue 1, January 2019 ISSN 2320-9186
22
GSJ© 2019 www.globalscientificjournal.com
No Factors External Strategy Weight Rating Score
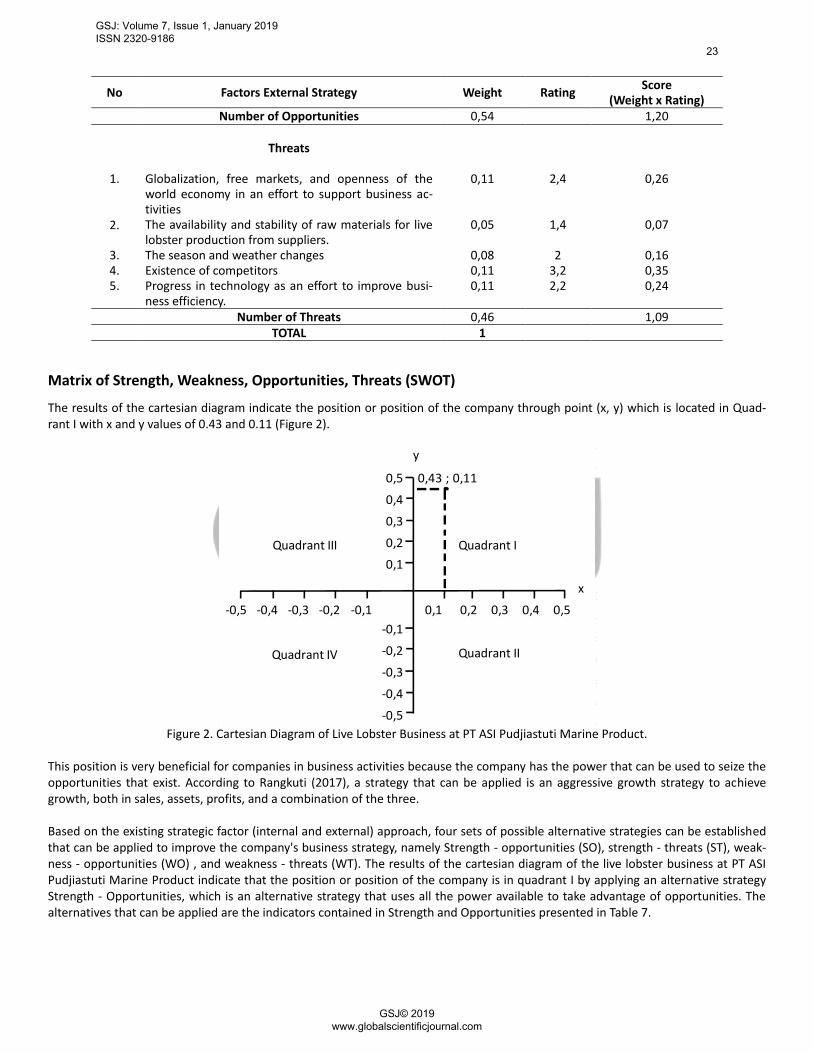
(Weight x Rating) Number of Opportunities 0,54 1,20
Threats
1. Globalization, free markets, and openness of the world economy in an effort to support business ac-tivities
0,11 2,4 0,26
2. The availability and stability of raw materials for live lobster production from suppliers.
0,05 1,4 0,07
3. The season and weather changes 0,08 2 0,16 4. Existence of competitors 0,11 3,2 0,35 5. Progress in technology as an effort to improve busi-
ness efficiency. 0,11 2,2 0,24
Number of Threats 0,46 1,09 TOTAL 1
Matrix of Strength, Weakness, Opportunities, Threats (SWOT)
The results of the cartesian diagram indicate the position or position of the company through point (x, y) which is located in Quad-rant I with x and y values of 0.43 and 0.11 (Figure 2).
Figure 2. Cartesian Diagram of Live Lobster Business at PT ASI Pudjiastuti Marine Product.
This position is very beneficial for companies in business activities because the company has the power that can be used to seize the opportunities that exist. According to Rangkuti (2017), a strategy that can be applied is an aggressive growth strategy to achieve growth, both in sales, assets, profits, and a combination of the three. Based on the existing strategic factor (internal and external) approach, four sets of possible alternative strategies can be established that can be applied to improve the company's business strategy, namely Strength - opportunities (SO), strength - threats (ST), weak-ness - opportunities (WO) , and weakness - threats (WT). The results of the cartesian diagram of the live lobster business at PT ASI Pudjiastuti Marine Product indicate that the position or position of the company is in quadrant I by applying an alternative strategy Strength - Opportunities, which is an alternative strategy that uses all the power available to take advantage of opportunities. The alternatives that can be applied are the indicators contained in Strength and Opportunities presented in Table 7.
0,5
0,4
0,3
0,2
0,1
-0,5 -0,4 -0,3 -0,2 -0,1 0,1 0,2 0,3 0,4 0,5
-0,1
-0,2
-0,3
-0,4
-0,5
0,43 ; 0,11
y
x
Quadrant III Quadrant I
Quadrant IIQuadrant IV
GSJ: Volume 7, Issue 1, January 2019 ISSN 2320-9186
23
GSJ© 2019 www.globalscientificjournal.com

Table 7. Results of SWOT Analysis Matrix
O1 Market Request
O O2 Government Regulation
S O3 consumer purchasing power
O4 Existence of Company Partners (Fishermen)
S1 Maximum Capacity Pro-duction
Adjust production capacity to meet market demand and consumer purchas-ing power (S1 - O1,3) Maintain and increase the availability of capital to meet market demand, consumer purchasing power and increase the number of company partners (S2 - O1, 3, 4) Increasing the efficiency of cost components to corporate partners (S3- O4) Providing frastructure, facilities and infrastructure to support market de-mand, government regulations and cooperation with partners (fishermen) (S4 - O1,2,4) Maintaining live lobster raw material quality to meet market demand, comply with government regulations and establish partnerships with part-ners (fishermen) (S5 - O1,2,4) Improve and adjust technology use inactivities handling temporary to meet market demand and handling raw materials from partners (Fishermen) (S5 - O1.4)
S2 Capital Availability
S3 Financial Flow (Cash Flow) and funding Struc-ture
S4 Availability of Facilities and Infrastructure
S5 Quality of Live Lobster Raw Materials
S6 Use of Technology in Production Activities
Meaning of Strategy
Analysis of strategy means a matching phase that is focused on producing a viable strategic alternative by combining internal and external factors that have been determined using the IFE and EFE matrices. Based on the results of the strategy matrix analysis using the SWOT matrix, a combination of strength factors with opportunity factors (SO) was generated. The following are the steps in car-rying out the SO strategy:
1) Adjusting production capacity to meet market demand and consumer purchasing power (S1 - O1.3) Production capacity, market demand, and consumer purchasing power have a positive and direct correlation. Companies must adjust production capacity to market demand and consumer purchasing power. If market demand and consumer purchasing power in-crease, the company must maximize its production capacity. This can be done by utilizing existing production facilities and infrastruc-ture, if it is felt that consumer demand has exceeded the maximum production capacity, then the company can increase production capacity or open a new branch in the Indonesian region that has the potential of lobster seafood. Conversely, if consumer demand and consumer purchasing power decline, the company must reduce its maximum production capacity.
2) Maintain and increase the availability of capital to meet market demand, consumer purchasing power and increase the number of company partners (S2 - O1, 3, 4)
This can be done by enlarging the profit margin which is converted as additional capital, opening opportunities for investors come from outside the company or also make loans to banks.
3) Increasing the efficiency of the cost of purchasing lobster raw materials for company partners (Fishermen) (S3- O4) The purchase price of lobster raw materials from fishermen is influenced by the selling price of lobster at exporter level, dollar ex-change rate and lobster consumption trend in export destination countries. The ever-changing lobster prices allow for leakage in the cost of purchasing raw materials. Leaks in the form of purchase prices from fishermen are too high so they are not worth the selling price to exporters. This can be overcome by always updating information about the dollar exchange rate and trend the lobster con-sumption in the destination countries in real time.
GSJ: Volume 7, Issue 1, January 2019 ISSN 2320-9186
24
GSJ© 2019 www.globalscientificjournal.com
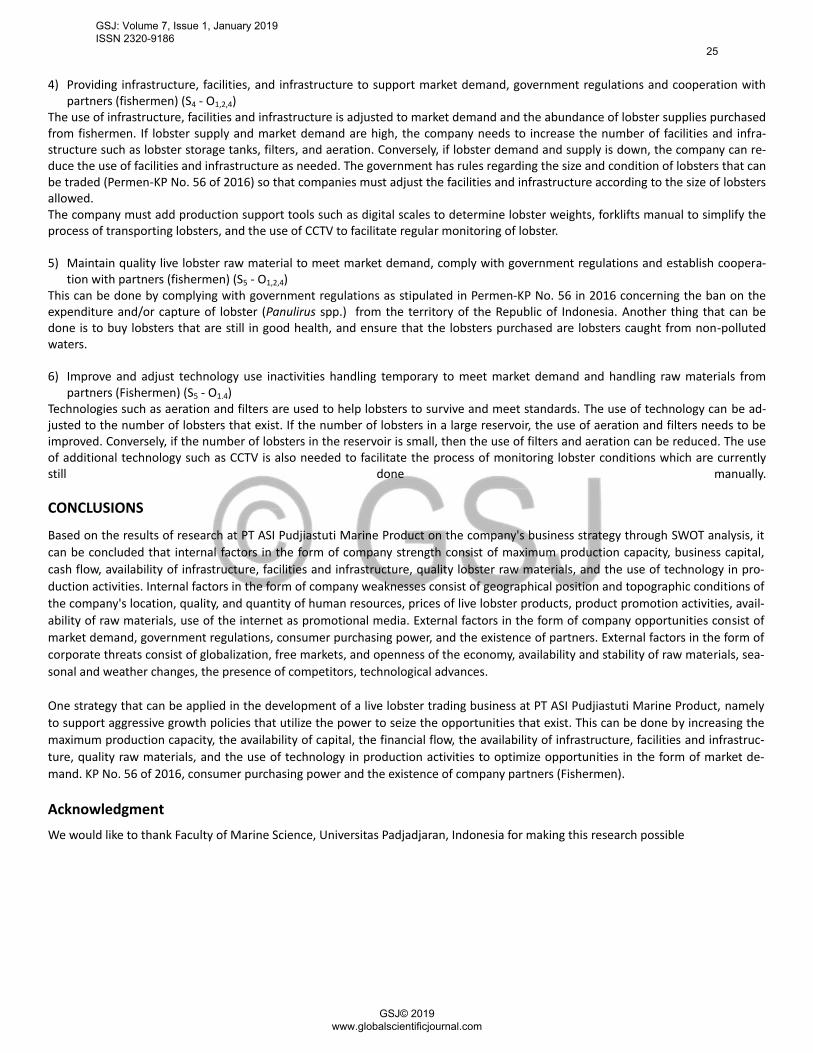
4) Providing infrastructure, facilities, and infrastructure to support market demand, government regulations and cooperation with partners (fishermen) (S4 - O1,2,4)
The use of infrastructure, facilities and infrastructure is adjusted to market demand and the abundance of lobster supplies purchased from fishermen. If lobster supply and market demand are high, the company needs to increase the number of facilities and infra-structure such as lobster storage tanks, filters, and aeration. Conversely, if lobster demand and supply is down, the company can re-duce the use of facilities and infrastructure as needed. The government has rules regarding the size and condition of lobsters that can be traded (Permen-KP No. 56 of 2016) so that companies must adjust the facilities and infrastructure according to the size of lobsters allowed. The company must add production support tools such as digital scales to determine lobster weights, forklifts manual to simplify the process of transporting lobsters, and the use of CCTV to facilitate regular monitoring of lobster.
5) Maintain quality live lobster raw material to meet market demand, comply with government regulations and establish coopera-tion with partners (fishermen) (S5 - O1,2,4)
This can be done by complying with government regulations as stipulated in Permen-KP No. 56 in 2016 concerning the ban on the expenditure and/or capture of lobster (Panulirus spp.) from the territory of the Republic of Indonesia. Another thing that can be done is to buy lobsters that are still in good health, and ensure that the lobsters purchased are lobsters caught from non-polluted waters.
6) Improve and adjust technology use inactivities handling temporary to meet market demand and handling raw materials from partners (Fishermen) (S5 - O1.4)
Technologies such as aeration and filters are used to help lobsters to survive and meet standards. The use of technology can be ad-justed to the number of lobsters that exist. If the number of lobsters in a large reservoir, the use of aeration and filters needs to be improved. Conversely, if the number of lobsters in the reservoir is small, then the use of filters and aeration can be reduced. The use of additional technology such as CCTV is also needed to facilitate the process of monitoring lobster conditions which are currently still done manually.
CONCLUSIONS
Based on the results of research at PT ASI Pudjiastuti Marine Product on the company's business strategy through SWOT analysis, it
can be concluded that internal factors in the form of company strength consist of maximum production capacity, business capital,
cash flow, availability of infrastructure, facilities and infrastructure, quality lobster raw materials, and the use of technology in pro-
duction activities. Internal factors in the form of company weaknesses consist of geographical position and topographic conditions of
the company's location, quality, and quantity of human resources, prices of live lobster products, product promotion activities, avail-
ability of raw materials, use of the internet as promotional media. External factors in the form of company opportunities consist of
market demand, government regulations, consumer purchasing power, and the existence of partners. External factors in the form of
corporate threats consist of globalization, free markets, and openness of the economy, availability and stability of raw materials, sea-
sonal and weather changes, the presence of competitors, technological advances.
One strategy that can be applied in the development of a live lobster trading business at PT ASI Pudjiastuti Marine Product, namely
to support aggressive growth policies that utilize the power to seize the opportunities that exist. This can be done by increasing the
maximum production capacity, the availability of capital, the financial flow, the availability of infrastructure, facilities and infrastruc-
ture, quality raw materials, and the use of technology in production activities to optimize opportunities in the form of market de-
mand. KP No. 56 of 2016, consumer purchasing power and the existence of company partners (Fishermen).
Acknowledgment
We would like to thank Faculty of Marine Science, Universitas Padjadjaran, Indonesia for making this research possible
GSJ: Volume 7, Issue 1, January 2019 ISSN 2320-9186
25
GSJ© 2019 www.globalscientificjournal.com

International Journal of Advancements in Research & Technology, Volume 1, Issue 5, October-2012 ISSN 2278-7763
References
[1] Central Bureau of Statistics (CBS). 2015. Lobster producer price index for 2011-2014. Central Bureau of Statistics. Jakarta.
[2] Fauzi, A. 2001. Principles of socio-economic research. Department of Social Economics, Fisheries and Marine Affairs. Essay. Bogor Institute of Agriculture.
Bogor.
[3] Gumilar, I. 2012. Coastal Community Participation in Sustainable Mangrove Forest Ecosystem Management in Indramayu Regency. Akuatika
Journal 3 (2): 198-211
[4] Kanna, I. 2006. Lobster (Catching, Hatching, Enlargement). Kanisius. Yogyakarta.
[5] Ministry of Maritime Affairs and Fisheries (MMAF). 2015. Catch Fishing Lobster Production Index (tons) in 2003-2014. Ministry of Fisheries and
Marine Affairs. Jakarta.
[6] Ministry of Maritime Affairs and Fisheries (MMAF). 2017. Productivity of Indonesian Fisheries. Ministry of Fisheries and Marine Affairs. Jakarta.
[7] Nurhayati, A. 2013. Analysis of Sustainable Potential of Fishing Fish in Pangandaran Region. Journal of Aquatics 4 (2): 195-209.
[8] Purwoko, B. S. 2013. Lobster Export Business Process PT. ASI Pudjiastuti. Essay. Economics and Business Faculty. Satya Wacana Christian
University. Salatiga.
[9] Raharjo, M. 2017. Case Studies in Qualitative Research; Concept and Procedure. Maulana Malik Ibrahim State Islamic University Malang. Malang.
[10] Rahmah. 2018. Analysis of the trade flow and Indonesian Lobster Export Development Strategy. Essay. Faculty of Fisheries and Marine Science. Bogor
Agricultural Institute.
[11] Rangkuti, F. 2017. Techniques for Dissecting Business Cases SWOT Analysis Ways to Calculate Weight, Rating, and OCAL. PT. Gramedia Main Library.
Jakarta.
[12] Soekendarsi, E. 2013. Types of Lobster in Pangandaran Waters, Ciamis Regency. PT. Gramedia Main Library. Jakarta.
GSJ: Volume 7, Issue 1, January 2019 ISSN 2320-9186
26
GSJ© 2019 www.globalscientificjournal.com