lotta knuutila blending strategies and process
TRANSCRIPT

Lotta Knuutila
BLENDING STRATEGIES AND PROCESS MODIFICATION FOR
THE FUTURE GASOLINE PRODUCTION Master´s Programme in Advanced Energy Solutions Major in Industrial Energy Processes and Sustainability
Master’s thesis for the degree of Master of Science in Technology submitted
for inspection, Espoo, 31st October 2019.
Supervisor
Professor Annukka Santasalo-Aarnio
Advisor M.Sc. Anna Karvo

ii
Tekijä Lotta Knuutila
Työn nimi Sekoitusstrategiat ja prosessin modifiointi bensiinin valmistukselle tulevai-
suudessa
Maisteriohjelma Advanced Energy Solutions Koodi CHEM3044
Työn valvoja Annukka Santasalo-Aarnio
Työn ohjaaja(t) Anna Karvo
Päivämäärä 31.10.2019 Sivumäärä 71 Kieli Englanti
Tiivistelmä
Rekisteröityjen bensiiniautojen määrä kasvoi 6,5 prosenttiyksikköä Euroopassa vuonna 2018, mikä ennustaa bensiinintuotannon jatkuvan vielä useita vuosikymmeniä, vaikka sen haittapuolia ovatkin CO2 päästöt, jotka kiihdyttävät ilmaston lämpenemistä. Tämän vuoksi tutkimuksen pitääkin keskittyä bensiinin uusiutuvien raaka-aineiden tutkimiseen, joiden ominaisuudet voivat kuitenkin erota fossiilisista. Tässä diplomityössä on kerätty laaja ominaisuustietokanta nykyisille bensiinin komponenteille, jota voidaan hyödyntää bensiinin sekoittamisessa tulevaisuudessa myös uusiutuvista raaka-aineista tuotetuille komponenteille optimoidessa sen korkeaa laatua. Ominaisuustietokantaan kuuluvat bensiinin komponentit ja niiden ominaisuudet autta-vat määrittämään jokaisen komponentin hiilivety rakenteen, fysikaaliset ominaisuudet sekä oktaaniluvut. Oktaaniluku, erityisesti tutkimusoktaaniluku (RON) on diplomityön pääominaisuus, johon keskitytään, koska se kuvaa bensiinin käyttäytymistä moottorissa. Tietokanta raportoi jokaisen bensiinin valmistuskomponentin RON:n, joissa huomataan eroavaisuuksia. Diplomityön tulokset osoittavat, että bensiini koostuu yli 100 erilaisesta hiilivety yhdis-teestä, kuten aromaateista ja parafiineista, sekä mahdollisesti myös alkoholeista ja eette-reistä. Näillä yhdisteillä on huomattu olevan vaikutus RON:n, mikä johtuu niiden reak-tiivisuuseroista. Suurempi reaktiivisuus laskee RON:a ja voi kasvattaa nakutuksen toden-näköisyyttä moottorissa, joka voi aiheuttaa sen osien vaurioitumisen. Tulokset osoittavat, että parhaimmat yhdisteet nakutuksen estoon ovat aromaattiset sekä hapelliset yhdisteet. Diplomityön tulosten pohjalta huomataan, että kaksoissidoksen ja sivuryhmän paikoilla hiilivetyketjussa, ketjun pituudella ja OH-ryhmillä on vaikutus yhdisteen reaktiivisuu-teen. Työssä huomataan erityisesti aromaattisten yhdisteiden metyyliryhmien paikalla olevan merkittävä vaikutus niiden RON:n. Aromaattiset yhdisteet, joiden metyyliryhmät ovat vierekkäisissä hiilissä, omaavat selvästi alhaisemman RON:n kuin ne, joilla metyyli-ryhmät ovat kauempana toisistaan. Nämä yhdisteiden rakenteelliset eroavaisuudet on tärkeää ottaa huomioon bensiinin valmistuksessa, koska ne voivat vaikuttaa lopputuot-teen ominaisuuksiin. Diplomityössä tutkitaan eri yhdisteryhmien oktaanien sekoittumista toistensa kanssa ja huomataan, että etanoli sekoittuu epälineaarisesti, mutta synergistisesti parafiinien ja olefiinien kanssa, mutta antagonistisesti aromaattien kanssa. Kuitenkin metyyliryhmien lisääntyessä aromaattisissa yhdisteissä, muuttuu sekoittuminen lineaarisemmaksi ja jopa synergistiseksi. Lisäksi diplomityössä esitetään uusiutuvia raaka-aineita, kuten ter-peenejä ja furaaneja, joita olemassa olevat bensiinin jalostusyksiköt voisivat muokata tuottaakseen FQD:n mukaista ja samalla uusiutuvaa bensiiniä.
Avainsanat bensiini, bensiinin sekoittaminen, synergia, antagonismi, jalostus yksikkö,
reaktiivisuus

iii
Author Lotta Knuutila
Title of thesis Blending strategies and process modification for the future gasoline pro-duction
Master programme Advanced Energy Solutions Code CHEM3044
Thesis supervisor Annukka Santasalo-Aarnio
Thesis advisor(s) Anna Karvo
Date 31.10.2019 Number of pages 71 Language English
Abstract The amount of the registered gasoline cars increased 6.5 percentage unit in Europe in 2018 that will forecast the gasoline production to continue still several decades, even though its drawbacks are the harmful CO2 emissions that accelerate the global warming. Therefore, the research needs to concentrate on the development of the renewable feed-stocks for gasoline. However, their problem could be the different properties compared to fossil gasoline. This master has collected the wide property database for the existing gasoline blending components that the gasoline blending can utilize to optimize the high-quality of gasoline also from the renewable feedstocks in the future. With the help of the gasoline blending components and their properties in the database are identified the hydrocarbon structure, physical properties and octane numbers of each gasoline component. The octane number, especially research octane number (RON) is the main property that this master thesis concentrates because it defines the behaviour of gasoline in the engine. The database reports RONs for each gasoline blending compo-nents that differ from each other. The results of the thesis show that the gasoline consist of over 100 different hydrocarbon compounds such as aromatics and paraffins and possible also of alcohols and ethers. These compounds have the highest impact on the RON that depends on their reactivity differences. Higher reactivity decreases the RON and increases the probability of knock-ing that could destroy the engine parts. The results show that the most viable organic compounds to avoid knocking are aromatics and ethanol. There is noticed in the results of the thesis that positions of double bond and the side groups in the carbon backbone, the length of it and the OH-groups influence on the reac-tivity of compound. Especially, the positions of methyl groups in aromatics influence sig-nificantly on their RON. The methyl groups in the adjacent carbons decrease the RON of aromatics compared to those that have methyl groups further each other. These struc-tural differences of the compounds are important to concern in the gasoline production, because they could affect to the properties of final product. In the master thesis is researched the octane blending of different compound groups and noticed that ethanol blends non-linearly, but synergistic with paraffins and olefins, while the blending with aromatics is antagonistic. There is noticed the increase of methyl groups in aromatics to shift the blending more linear and even synergistic with ethanol. Moreover, thesis provides the outlook for the renewable feedstocks like terpenes and fu-rans that the existing gasoline upgrading units could modify to fill the requirements of FQD and simultaneously produce renewable gasoline.
Keywords gasoline, blending of gasoline, synergistic, antagonistic, upgrading unit, re-activity

iv
Preface
This master thesis is a part of the Digifuels project between Aalto University and
Neste Oyj. The purpose of the thesis was to build the property database for gas-
oline blending components that provides input data for the development of the
Fuel Blend Property Calculator in the future. It has been accomplished at the
research group of the Energy Conversion and Neste Technology Center.
I would like to thank my supervisor, professor Annukka Santasalo-Aarnio from
Aalto University to provide me this very interesting topic and to be part of this
extremely versatile project. I would like to thank her and my advisor Anna Karvo
from Neste for their valuable feedbacks and ideas to improve my thesis. Moreo-
ver, I learned a lot about gasoline and its production that I want to thank my
advisor. I would like to thank also Juha Keskiväli and Ulla Kiiski for their feed-
back for my thesis during my summer in Neste and all colleagues who I worked
with at the Neste Technology Center and Aalto University.
Finally, I sincerely thank my parents, Elina and Timo, for all the support along
my educational journey and, my grandmother, for her encouragement during my
university studies. Especially, I want to thank my father for the patience to solve
the mathematical calculations with me and my mother to listen our constructive
debates. In the end, I am especially grateful to my boyfriend and my awesome
friends for these memorable years in the Aalto University.
Otaniemi, 31.10.2019
Lotta Knuutila

v
Table of contents
Tiivistelmä……………………………………………………………………………ii
Abstract………………………………………………………………………………iii
Preface ........................................................................................................................ iv
Table of contents .......................................................................................................... v Abbreviations ............................................................................................................. vii List of Figures ........................................................................................................... viii List of tables ................................................................................................................. x 1 Introduction ............................................................................................................... 1
1.1 Thesis structure .................................................................................................. 2 2 Gasoline .................................................................................................................... 3
2.1 Crude oil ............................................................................................................ 3 2.2 The refinery processes ....................................................................................... 4
2.2.1 Crude oil preparation and separation .......................................................... 4 2.2.2 Processes and blending components for high quality gasoline ................... 6
2.3 Other gasoline blending components ............................................................... 12 2.4 Gasoline regulation .......................................................................................... 13 2.5 Hydrocarbons ................................................................................................... 15
2.5.1 Paraffins .................................................................................................... 15 2.5.2 Olefins ....................................................................................................... 16
2.5.3 Aromatics .................................................................................................. 16 2.6 Properties of gasoline blends ........................................................................... 16
2.6.1 Octane number .......................................................................................... 17 2.6.2 Volatility ................................................................................................... 17
2.6.3 Heating value ............................................................................................ 18 2.6.4 Toxicity ..................................................................................................... 18 2.6.5 Oxygen content ......................................................................................... 19
2.6.6 Sensitivity ................................................................................................. 19 3 Blending optimization ............................................................................................. 20
3.1 Linear gasoline blending .................................................................................. 20 3.2 Non-linear gasoline blending-Synergistic and antagonistic octane blending .. 21
3.2.1 Carbon-carbon bonds, reactivity and reaction rate ................................... 22
3.2.2 Electrophilicity .......................................................................................... 25 3.2.3 Chain branching ........................................................................................ 25 3.2.4 Oxygenates ................................................................................................ 27
3.3 Vapour pressure blending ................................................................................ 27
4 Renewable feedstocks for the future production of gasoline .................................. 29 4.1 From the 1st generation biofuels to electrobiofuels ......................................... 29 4.2 The possible feedstocks to produce renewable gasoline ................................. 33
5 Collection of the database ....................................................................................... 38 5.1 PONA analysis ................................................................................................. 38
5.2 The defined properties of gasoline blending components ............................... 39 5.3 The evaluated upgrading units to produce renewable gasoline ....................... 40
6 Results and analysis ................................................................................................ 40
6.1 Explanations for the RON of hydrocarbons in gasoline blending components 41 6.2 The properties of gasoline blending components ............................................ 50

vi
6.3 The possible future feeds to the gasoline upgrading units ............................... 55 6.4 Blend proposals ................................................................................................ 61
7 Conclusions and proposals for the future study ...................................................... 63

vii
Abbreviations
AKI Anti Knock Index
BDE Bond dissociation energy
CMF 5-choloromethylfurfural
CST Crude sulphate turpentine
CO Carbon monoxide
DMF 2,5-dimethylfuran
DVPE Dry Vapour Pressure Equivalent
ETBE Ethyl tert-butyl ether
FAME Fatty acid methyl ester
FBPC Fuel Blend Property Calculator
FCC Fluid catalytic cracking
FQD Fuel Quality Directive
GC Gas Chromatography
GHG Greenhouse gas
HCl Hydrogen chloric
HDO Hydrodeoxygenation
HHV Higher heating value
HMF 5-hydroxymethylfurfural
HOV Heat of vaporization
HVO Hydrotreating of vegetable oils
LHV Lower heating value
LIMS Laboratory management system
MIBK Methyl-isobutyl ketone
MTBE Methyl tert-butyl ether
MON Motor octane number
NaCl Sodium Chloride
NEXBTL Next Generation Biomass To Liquid
NMS Neste management system
NOx Nitrogen oxides
PAHs Polycyclic Aromatic Hydrocarbons
PONA P(paraffinic), O(olefinic), N(naphthenic), A(aromatic)
PVC Polyvinyl chloride
RON Research octane number
SI Spark-ignition
TAEE Tert-amyl ethyl ether
TAME Tert-amyl methyl ether
V/L Vapor-to-liquid
VLI Vapour Lock Index

viii
List of Figures
Figure 1. The boiling points of different fractions from the atmospheric crude
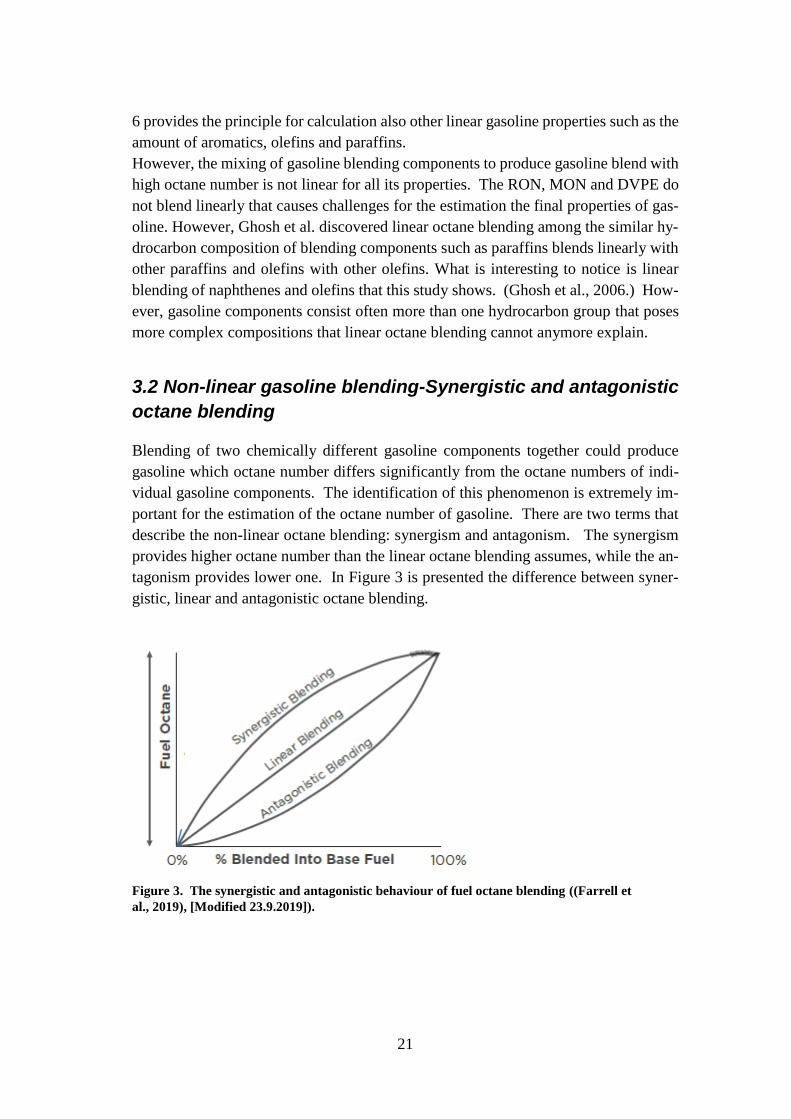
distillation. ................................................................................................................... 5 Figure 2. The refining of crude oil into refinery products (Young, 2006). ................ 6 Figure 3. The synergistic and antagonistic behaviour of fuel octane blending
((Farrell et al., 2019), [Modified 23.9.2019]). ........................................................... 21
Figure 4. The nomination of carbons in olefin structure ((ChemSpider, 2019b),
[Modified 30.8.2019]). ............................................................................................... 23 Figure 5. The primary (P), secondary (S) and tertiary (T) C-H bonds are placed in
iso-octane and n-heptane ((Boot et al., 2017), [Modified 23.9.2019]). ..................... 24 Figure 6. The hydrocarbon structure of 1-hexene, 2-hexene and 3-hexene with the
blue marked paraffinic chain ((ChemSpider, 2019b; PubChem, 2019; ChemAladdin,
2019), [Modified 29.8.2019]). ................................................................................... 24
Figure 7. Electrophilic compounds decrease the RON (Whitmore et al., 2016). ..... 25 Figure 8. More branched and shorter hydrocarbons have higher RON and MON
(Boot et al., 2017). ..................................................................................................... 26
Figure 9. The secondary OH-group increases the BDE of 𝛃-carbon atom that
reduces its reactivity ((Koivisto et al., 2015), [Modified 6.8.2019]). ........................ 27 Figure 10. The 5% addition of ethanol could increase the DVPE rapidly (Rose,
2009). ......................................................................................................................... 28 Figure 11. The esterification of wastes and residues produces FAME, while the
hydrotreating produces HVO ((Neste, 2016), [Modified 17.9.2019]). ...................... 31 Figure 12. DMF is a potential renewable feedstock in the gasoline upgrading units
and, also straight as gasoline blending component ((Sacia et al., 2015), [Modified
4.9.2019]). .................................................................................................................. 34
Figure 13. The HDO of 5-nonanone consists of three reaction steps (Jenkins et al.,
2017). ......................................................................................................................... 34 Figure 14. The production of 2-methylpentane from MIBK (Alotaibi et al., 2012). 35
Figure 15. Isoprene unit is a building block of monoterpenes (ChemSpider, 2019c).
................................................................................................................................... 35
Figure 16. The structure of monoterpenes: α -limonene, myrcene and α -pinene
(Weyrich and Hölderich, 1997; ChemSpider, 2019a; Tracy et al., 2009). ................ 36
Figure 17. Hydrogenation of 𝝰-limonene to p-menthane in the presence of noble
metal catalyst (Tracy et al., 2009). ............................................................................. 36 Figure 18. The four possible compounds from the hydrogenation and
dehydrogenation of α-pinene (Roberge et al., 2001). ................................................ 37 Figure 19. The structure of squalene, triterpene, is an optimal feedstock for the
gasoline production (Tracy et al., 2011). ................................................................... 37 Figure 20. The relations of structure of n-paraffins to their RON (Ghosh et al., 2006;
Owen and Coley, 1995). ............................................................................................ 41
Figure 21. More branched isoparaffins have higher RON (Owen and Coley, 1995;
Schobert, 2013). ......................................................................................................... 43 Figure 22. The side groups increase the RON of aromatics (Owen and Coley, 1995;
Schobert, 2013). ......................................................................................................... 45 Figure 23. The longer side groups decrease the RON compared to methyl groups
(Owen and Coley, 1995; Schobert, 2013). ................................................................. 46

ix
Figure 24. The position of double bond in olefin influence on its reactivity and in
addition to that, the position of methyl group affects to their RON, too (Owen and
Coley, 1995). .............................................................................................................. 48 Figure 25. There are variations among densities in the gasoline blending components
(LIMS, Neste). ........................................................................................................... 51
Figure 26. The sensitivity describes the difference between RON and MON (LIMS,
Neste). ........................................................................................................................ 52 Figure 27. The high LHV is desired property in gasoline (LIMS, Neste). ............... 53 Figure 28. The LHV in the units of MJ/kg (LIMS, Neste). ...................................... 53
Figure 29. The distillation end point of gasoline is 210 ��C according the FQD which
all gasoline components need to also fulfill (LIMS, Neste). ..................................... 54

x
List of tables
Table 1. The reaction pathways from different feed compositions to FCC products
(Sadeghbeigi, 2012). .................................................................................................... 8 Table 2. The requirements of highway gasoline in the EU based on the FQD and EN
228 standard (2009/30/EC, 2009; SFS-EN 228: 2012 + A1:2017, 2017). ................ 14
Table 3. The advantages and challenges of biofuels produced from different
generation feedstocks (Dutta et al., 2014). ................................................................ 32 Table 4. Isoparaffins of gasoline blending components (Owen and Coley, 1995;
Schobert, 2013). ......................................................................................................... 42
Table 5. The PONA results of aromatics in gasoline blending components (Owen
and Coley, 1995; Schobert, 2013). ............................................................................ 44 Table 6. Naphthenes of gasoline blending components (Schobert, 2013). ............... 46
Table 7. The RONs of olefins that exist in gasoline over 0.5 wt% (Owen and Coley,
1995). ......................................................................................................................... 48 Table 8. The properties of gasoline blending components to optimize blending. .... 50 Table 9. Gasoline blending components. .................................................................. 50
Table 10. The presentation of the four gasoline upgrading units according their feed,
reactions, reaction rates and the hydrocarbon structure of produced gasoline blending
components. ............................................................................................................... 55
Table 11. The feed, reactions and products of the hydrotreating unit. ..................... 56 Table 12. The ideal reactions in the FCC unit and the ideal feed for these reactions to
produce Cat gas gasoline blending component. ......................................................... 57 Table 13. The reactions and the reactants to produce the reformate blending
component. ................................................................................................................. 58 Table 14. The reaction rates in the reforming unit. .................................................. 59
Table 15. The isomerization of n-paraffins produces high octane isoparaffins. ....... 60 Table 16. The summary of octane blending behavior of hydrocarbons and other
organic compounds (Ghosh et al., 2006; Boot et al., 2017; Farrell et al., 2019). ...... 62

1
1 Introduction
The global warming is the key topic today, and one of the industries that especially
need to prevent it is the oil refining. The oil consumption is today 94 million barrels
per day and its production has been predicted to increase in next decades (OECD,
2019). The reasons for this increase are the changes in the lifetime and the growth of
the population (Masum et al., 2013). However, this increasing consumption will add
the greenhouse gas (GHG) emissions that demands research of the new feedstocks to
produce fuels. For instance, biomass could be a promising option, because it is a re-
newable and it has a wide availability compared to solar or wind, which the weather
fluctuations limits strongly (Harjanne and Korhonen, 2019). Biomass can be labelled
as 1st generation such as corn and wheat, and 2nd generation sources such as forest
residues and wastes (Dutta et al., 2014). The Finnish oil refining company, Neste, is
the leader and the biggest renewable diesel producer utilizing 2nd generation feedstocks
such as wastes and residues (Neste, 2016). Moreover, the other solutions for the future
fuel production could be found from the 3rd and 4th generation feedstocks such as algae
and CO2 (Dutta et al., 2014).
European commission has also own targets to decrease transport-related GHG emis-
sions by 20% from the levels of 2008 by 2030 and by 60% from the levels of 1990 by
2050. The procedures to decrease those emissions are prohibiting the conventionally-
fuelled cars in the cities, decreasing 40% of CO2 emissions from maritime bunker
fuels and increase sustainable low-carbon fuels in the aviation (European Commission,
2019). Today, in Finland, the share of biofuels in the transportation is only 12% of
fuels, but the ambitious target is to increase the share by 30% by 2030 (Koistinen,
2018).
Gasoline is the refinery product that consists of hundreds of different hydrocarbons
such as paraffins and aromatics that form gasoline blending components. The refiner-
ies blend these components to maximize the high quality of gasoline and to follow the
Fuel Quality Directive (FQD) and standards. (Totten et al., 2003.) The most important
properties of commercial gasoline are for instance, vapour pressure, heating value, ar-
omatic and sulphur contents. Moreover, the octane number is the main quality char-
acter of gasoline that describes its knocking tendency. (El-Fattah et al., 2008.) Octane
number has two different indicators, research octane number (RON) and motor octane
number (MON) that differ from each other by the test conditions.
In the future, the target of developing of the modern spark-ignition (SI) engines is to
have high-efficient engines that can utilize gasoline during combustion completely to
reduce emissions. Therefore, the properties of gasoline need to be favourable that its
ignition behaviour in the engines is proper and the harmful autoignition reactions could
be avoided. The autoignition of gasoline causes the knocking that most of the modern

2
SI engines detect by their knock-sensors. Those sensors inform the engine manage-
ment system that usually in turn retards the ignition timing. However, the retardment
of ignition timing reduces the power of the engine. Therefore, gasoline needs to have
high antiknock facility to avoid the knocking and the power loss. The high difference
between RON and MON improves antiknock facility and therefore, gasoline with high
RON and low MON is favoured. (Kalghatgi, 2015; Kalghatgi, 2001).
To produce gasoline with high knocking resistance demands blending of suitable gas-
oline components from the different refinery upgrading units. However, the blending
is not easy, because blending components have different RONs due to their chemical
structure. The purpose of this master thesis is to collect wide property database of
gasoline blending components to describe their hydrocarbon structure, physical and
chemical properties and octane numbers. Master thesis applies the data of the hydro-
carbon structure to explain the variations among RONs between different hydrocarbon
groups that explain the blending behaviour of different gasoline blending components.
The analysis provides input data for the building of the Fuel Blend Property Calculator
(FBPC) for gasoline in the future that will enhance the optimization of RON in every
day gasoline production in the refineries.
Moreover, as the target is to reduce oil consumption in the future, the renewable feed-
stocks for gasoline need to be researched. These feedstocks contain different chemical
structures and functionalities than crude oil and therefore, defining these functionali-
ties and modifying the feed in the refinery units to produce more sustainable gasoline
should be the target in the future. This master thesis will provide an outlook of the
feed modifications and their possible reactions in the existing gasoline upgrading units
to produce renewable gasoline.
1.1 Thesis structure
This Master thesis is divided to literature part and the research part. The literature part
introduces first gasoline, its blending components and their production units in the
refinery. Then, it presents gasoline regulation in the EU, the chemical composition of
gasoline blending components and the properties of gasoline.
Chapter 3 researches the chemistry of hydrocarbons in detailed to provide explanations
for the variations between RONs among different hydrocarbon groups. Moreover, it
explains the differences between linear and non-linear blending. Chapter 4 divides the
future renewable feedstocks to four generations and introduces possible feedstocks for
the renewable gasoline production.
The research part collects the data from Neste LIMS software to create the database
for the properties of gasoline blending components that predicts the final gasoline
properties. Chapter 5 explains how the database is collected and which properties are
researched. Chapter 6 reports the results of hydrocarbon compounds of gasoline and
their RONs, presents the properties of database for every blending component and

3
shows their variations. It indicates the importance of the property of gasoline compo-
nents on final gasoline. Chapter 6 shows also possible renewable feedstocks, their
reactions mechanisms and products in the existing gasoline upgrading units to produce
renewable gasoline. In the end, it presents the results of possible blending proposals
according to the blending behaviour of hydrocarbons and other organic compounds.
The master thesis answers to the next questions:
1. What is the chemical structure of gasoline blending components and how
it explains their RON?
2. How the properties vary among gasoline blending components and what
is the significance of properties for gasoline?
3. Which compounds blend non-linearly?
4. Which renewable feedstocks are possible to upgrade in the existing gas-
oline units?
2 Gasoline
Gasoline has hundreds different hydrocarbon molecules that consist of 4 to 14 carbon
atoms per molecule (Totten et al., 2003). It is standard SI- engine fuel that automobiles
and light trucks apply (Kroyan, 2018; Schobert, 2013). The raw materials for it are
different crude oils or their mixtures that are upgraded in the many steps to obtain
blending components. These components are then blended to produce high quality
gasoline product according to the national laws, the FQD and country- specific stand-
ards (Totten et al., 2003; Olsen, 2014).
2.1 Crude oil
Crude oil is the raw material for fossil-based gasoline and consists of tens of thousands
of hydrocarbons that can be categorized into aromatic, paraffinic and naphthenic hy-
drocarbons (Schobert, 2013). In addition, metals, heteroatoms such as sulphur, and
oxygen are included in to crude oil (Totten et al., 2003). High-quality fuel products
are refined from it through the many process pathways that include washing stage,
fractionators, reactors and distillation columns, for instance (Olsen, 2014).
The quality of crude oil varies a lot according to its properties such as relative density,
levels of metals and sulphur. Its supply is depending on the current infrastructure and
economy. However, the lack of crude oil with specific feed properties is possible to
substitute by blending multiple crude oils together to achieve a feedstock that com-
pletes the requirements of refinery. (Olsen, 2014; Totten et al., 2003.)

4
2.2 The refinery processes
From crude oil to gasoline is a multi-phase process pathway that has different units
where the fractions of crude oil are separated by distillation. These fractions react with
other fractions or for instance, with hydrogen, in separate upgrading units such as hy-
drotreating, reforming and alkylation unit that have one or more reactors to produce
chemically different gasoline components. Moreover, some refineries have an ether-
units to produce Methyl tert-butyl ether (MTBE) or Ethyl tert-butyl ether (ETBE) and
tert-amyl-methyl ether (TAME) or tert-amyl-ethyl ether (TAEE).
There are presented the main conversion and upgrading units of crude oil refining in
the next sections. Examples of units are hydrotreating that removes impurities such as
sulphur and hydrogenates double bonds to produce paraffins as product or for further
upgrading units. Also, isomerization is the upgrading unit that isomerases n-paraffins
into more branched isoparaffins and decyclizates naphthenes. Moreover, reforming,
fluidized catalytic cracking (FCC) and alkylation increase octane number of gasoline
adding aromatic, olefin and isoparaffin structures into it.
2.2.1 Crude oil preparation and separation
Crude oil is first stored in the large tanks at the refinery area and after that in the first
stage, mixing water in the desalter vessel removes its salts and sediments. The im-
portance of removing them is the protection of equipment from the corrosion, and
fouling and, moreover, they are catalysts poisons. (Olsen, 2014.) Especially, sodium
chloride (NaCl), is the most harmful salt in crude oil, because it can react with hydro-
gen forming hydrochloric acid that causes corrosion on the equipment. (Schobert,
2013.)
Before the crude oil is fed to the next stage, atmospheric crude fractionator, the fur-
naces preheat it up to 340-410 °C (Totten et al., 2003). It is important to keep the
temperature on the range otherwise thermal cracking could occur that increases the
production of carbon deposits on the pipes and equipment that might lead in the worst
case to shutdown of the process (Olsen, 2014).
In some refineries, before atmospheric fractionator, is a preflash column that removes
lower boiling point components (Totten et al., 2003). The atmospheric crude fraction-
ator separates the desalted crude oil into fractions according to boiling point ranges.
The fractions are typically light naphtha, heavy naphtha, kerosene, diesel oil, lubricat-
ing oil, fuel oil and residue. Figure 1 presents the fractions, their temperature ranges
and shows the typical boiling point fraction for gasoline to be between 32 and 165 ��C.

5
Figure 1. The boiling points of different fractions from the atmospheric crude distillation.
The lighter fractions in Figure 1 belongs to gasoline production, such as light naphtha
and heavy naphtha, while diesel oils and kerosene have longer hydrocarbon chains and
therefore, higher boiling points. The heaviest parts of crude oil are collected from the
column plate and the vacuum distillation separates them.
The boiling points of fractions do not change, but the flowrates will change based on
the utilized crude oil feedstock (Olsen, 2014). After atmospheric distillation side strip-
pers purify the impurities from the fractions and, also separate strippers remove vola-
tile parts of them. These volatile compounds are then returned to atmospheric crude
distillation and the purified fractions are feedstocks into the gasoline upgrading units.
(Schobert, 2013.)
The vacuum fractionator separates heavy, higher boiling point components under the
vacuum that prevents thermal cracking. Steam inside the fractionator prevents fouling
of the equipment and improves vaporization of heavy components at the bottom of the
fractionator. The temperature range in the vacuum fractionator is between 540-565 °C
or even 575 °C that it is larger compared to atmospheric crude fractionator, because
the occupied volume of vaporized crude oil is larger. Its fractions based on the boiling
points are light vacuum gas oil, medium vacuum gas oil and heavy vacuum gas oil that
is further processed in the FCC unit. (Olsen, 2014; Totten et al., 2003.)

6
2.2.2 Processes and blending components for high quality gasoline
This section presents gasoline components and their production units that Figure 2
shows in its block diagram. After the atmospheric crude distillation, the different up-
grading units produce gasoline, diesel and kerosene from the separated fractions.
Figure 2. The refining of crude oil into refinery products (Young, 2006).
From Figure 2 can be seen how complex the oil refining process is and how many
possible products it produces. The most important units for gasoline production are
hydrotreaters, reformer, FCC and alkylation. Beside these, the isomerization and
ethers units exist in some refineries.
Sulphur removal
The regulation limits strictly sulphur content in fuels and therefore, the refineries need
to have the suitable unit to remove it. The refineries could have more than one sulphur
removal unit, however, the basic principle is the same: unit cleans heavy and light
naphtha from impurities.
The hydro-desulphurization removes sulphur compounds and, in addition, hydrogen
sulphide and mercaptans, bad smelling gas. The reactions hydrogenate sulphur com-
pounds away and, also beside hydrogenates double bonds of the feedstock. (Owen
and Coley, 1995.) Therefore, the units stand before reforming and FCC unit to reduce
the amount of olefins in their feed.
The absorption concentrates removed hydrogen sulphide into amine solution. Amine
regenerator releases hydrogen sulphur from it and leads it to a sulphur recovery unit
that collects elemental sulphur. (Olsen, 2014.)

7
The sulphur removal unit has also other part, the fraction distillation unit, that separates
C3-C4 fractions, heavier hydrocarbons C7-C11, hexane and pentane from the feed.
Heavier fractions are fed into reforming unit and, they are also possible to use as gas-
oline blending components. (Owen and Coley, 1995.) N-butane releases from sulphur
removal unit after gasoline stream is hydrotreated from sulphur and it is valuable gas-
oline blending component, especially in the winter times. It increases the vapour pres-
sure that ensures the ignition of gasoline in the cold weather. (Olsen, 2014.)
FCC
The function of FCC is to break long-chain, C20-C70, heavy gas oils and residues into
lighter and shorter, naphtha-boiling-range hydrocarbons (Totten et al., 2003). Moreo-
ver, the low sulfuric gas oil products can be used as a feedstock to the FCC unit to
increase its conversion. The FCC unit produces gasoline component called Cat gas
that has high octane number. (Olsen, 2014.) The unit is the one most utilized in the
oil refinery to convert heavy oils into lighter and more valuable products (Schobert,
2013), but it is also the most challenging to operate, because it has specific process
dynamics. Refineries have different versions of FCC depending on the builder and
licensor, however, the operation principles are similar of these units. The unit consists
of a reactor, a catalyst regenerator and a main fractionator column at the downstream
and, also a series of distillation columns. (Olsen, 2014.) The capability to vary yield
and composition of the blending components explains the popularity of FCC unit (Tot-
ten et al., 2003).
The main factor for the high quality of blending component is the reaction mechanism
that utilizes the positive-charged carbocations, carbonium or carbenium ions, not rad-
icals (Schobert, 2013). The carbocations are formed when regenerated catalyst is in
contact with heavy gas oil feed. Equation 1 presents the formation of carbocations
when hydrogen ion reacts with paraffin molecule. (Sadeghbeigi, 2012.)
R-CH2-CH2-CH3 + (H+) -> R-(C+)H-CH2-CH3 + H2 (1)
The charge of carbonium ions is unstable and therefore, they are not common carbo-
cations in the FCC unit. While carbenium ions are more probable carbocations that
are formed by removing hydrogen and two electrons form paraffins. Moreover, their
formation from olefins is possible by adding a positive charge to them. (Sadeghbeigi,
2012.) Equations 2 and 3 show the reaction mechanism of these two reactions.
R-CH2-CH2-CH3 ->R-(C+)H-CH2-CH3 (2)
R-CH=CH-CH2-CH3 + (H+) ->R-(C+)H-CH2-CH3 (3)

8
The three most common reactions in the FCC unit are cracking the C-C -bond, isom-
erization and hydrogen transfer. Moreover, cyclization, coking and dehydrogenation
are possible reaction in this unit. The C-C -bond cracking, also called beta scissions,
breaks the low energy bond between carbon atoms to form two shorter hydrocarbon
chains. The main product from beta scission is olefin that is desired product for further
units and, it also increases octane number of Cat gas component. (Sadeghbeigi, 2012.)
The beta scission reactions favour high temperatures and therefore, catalyst and feed
react at 525-550 °C. Other reaction type in the FCC unit is isomerization that breaks
the bonds also via beta-scission and forms tertiary ions that are the most stable carbo-
cations that boost the branching during cracking and increase octane number.
(Sadeghbeigi, 2012.)
Third reaction in the FCC unit is the hydrogen transfer that transfers hydrogen from
olefin to olefin to form paraffins and cyclo-olefins. Cyclo-olefin reacts further and
rearranges to ended up aromatic that has not further reactions due its high stability.
The hydrogen transfer reaction can also occur between olefin and naphthene where
hydrogen transfers from naphthene to olefin to form paraffin and aromatic. (Sadegh-
beigi, 2012.) Table 1 concludes the possible hydrocarbon structures in the feed and
shows their reaction pathways.
Table 1. The reaction pathways from different feed compositions to FCC products (Sadegh-
beigi, 2012).
Table 1 shows that the most typical feedstocks are n-paraffins, olefins, naphthenes and
alkyl-aromatics and the cracking is the dominant reaction for their modification. It
applied catalyst to execute these reactions which average catalyst flowrate is around
one ton per thousand barrels of oil feed (Olsen, 2014). The most utilized catalysts are
zeolites that are large family of aluminosilicates, have high reactivity and therefore,
manages to process the low-quality feed. (Totten et al., 2003). The zeolite catalysts
consist of one fourth of zeolite crystals that are embedded in a matrix of silicon and
aluminium oxides. The silica-aluminium matrix decreases the price of zeolite and the
Feed Reactions
n-paraffinsCracking of long n-paraffins
into C6-C7 paraffins
olefinsH-transfer and quick double-
bond shifts
naphthenes Cracking
alkyl-aromaticsCracking of the alkyl group
next to the aromatic ring

9
demand of well-designed heat transfer to maintain the safe operation. (Schobert, 2013.)
However, the polymerization of olefins and aromatics in the reactor forms coke that
settles on the fluidized catalyst particles and decreases the catalyst activity. Therefore,
the regenerator continuously burns coke from top of the contaminated catalysts to flue
gases. (Totten et al., 2003.)
In the downstream of the reactor is the main fractionator column that separates, and
recoveries cracked hydrocarbon vapours from the reactor. The products from column
are light gases, liquefied gas (propane and butane), gas oil, light absorber gas oil, base
oil and gasoline blending component, Cat gas. The series of distillation columns treat
liquids from overhead receiver of the main fractionator column to clean gasoline frac-
tion from light gases and the rest of gases are separated into olefins, ethane and fuel
gas. (Olsen, 2014.)
Catalytic reformer
There are paraffins, aromatics and naphthenes in the feed of the reforming unit from
which aromatics and naphthenes facilitate the reforming mostly. Otherwise olefins are
not desirable in the feed, because they polymerizate and produce coke that deactivates
catalyst. The product from the catalytic reforming is called reformate that consists
mainly of high-octane aromatics that varies depending on the applied amount of hy-
drogen. (Schobert, 2013.)
The partial pressure of hydrogen is a significant factor for properties of reformate,
because its low partial pressure favours the production of aromatics, but also increases
the coke formation. While high partial pressure of hydrogen boosts hydrocracking and
decreases the production of high-octane aromatics, that the operation of unit tries to
avoid. (Schobert, 2013.)
Nowadays, the most suitable reactor configuration is the continuous that removes
formed coke during hydrogenation continuously and thus, the operation pressure in the
reactor stays low. This ensure the maximum hydrogenation of naphthenes to aromatics
that will produce high-quality reformate. (Totten et al., 2003.)
Isomerization unit
In the refinery the isomerization unit isomerizes n-paraffins into isoparaffins at the
presence of excess hydrogen and catalyst. Moreover, the saturation of benzene pro-
duces naphthenes. The purpose of isomerization is to improve properties of gasoline
and increase the octane number by adding more branching. (Kroyan, 2018; Sadegh-
beigi, 2012; Olsen, 2014; Totten et al., 2003.)
The feed to the unit comes from the atmospheric distillation of crude oil after its pre-
treatment. It typically consists mainly of C5-C9 paraffins, lighter alkyl cycloalkanes
and alkyl aromatics. (Schobert, 2013.) The feed is heated in the reactor with recycled

10
hydrogen to 180-260 °C and after that it flows to the fixed bed reactor where it reacts
in the presence of catalyst. After that the tall distillation column separates n-paraffins
from isoparaffins. The separation is difficult, because paraffins have almost the same
boiling points, n-paraffins slightly higher. (Olsen, 2014.)
Alkylation unit
In the alkylation unit isobutane reacts with olefins and produces C8 isoparaffins such
as iso-octanes. The feedstocks are usually the side streams from the other upgrading
units like FCC, MTBE and hydrotreating. The alkylation operates with acid catalyst,
either sulphuric or hydrofluoric acid that requires low temperature 0-40 °C and high
isobutane-to-olefin ratio. (Olsen, 2014.)
The alkylation is simple to implement: liquefied hydrocarbon feeds mix with strong
acid and finally, the alkylate is separated from the catalyst. In the reality the alkylation
involves a lot of observation, because it forms acid-hydrocarbon molecules that is an
exothermic reaction. Moreover, the operation needs prevent polymerization of olefins,
high catalyst consumption and consider the safety issues. (Totten et al., 2003.) How-
ever, the new alkylation technologies concentrate more on the safety using different
types of catalysts such as ionic liquids and thus, eliminate the risks of acids. Ionic
liquids offer more safer, environmentally friendly and efficient catalyst for the alkyla-
tion of isobutane and butene, because they reduce the strong acid consumption. There
are still drawbacks like the high price, the sensitivity to moisture and the high viscosity
in the use of these catalysts. (Wang et al., 2017.)
Finally, alkylates are collected from the column plate for gasoline blending, n-butane
is collected as a side stream as well the iso-butane from top of the column (Olsen,
2014). Alkylate is a paraffinic blending component that has octane number approxi-
mately 95 (Schobert, 2013).
Hydrocracking
The hydrocracking was before the primary unit to maximize the production of gaso-
line, but nowadays the hydrocracker produces mainly low-sulphur diesel and jet fuel.
It is not a necessary part of the refinery and its use also increase the maintenance cost
and hydrogen consumption. However, the absence of hydrocracking units causes lack
of hydrogen that refineries need to cover by other ways such as building the hydrogen
generation plant or purchasing it outside. The hydrocracking unit includes a product
fractionator that separates diesel, gasoline and light gases. The cracking reactions are
endothermic while the whole process is exothermic, because the hydrogenation reac-
tions occur simultaneously in the reactor. (Olsen, 2014.)

11
Ether units
Ethers are gasoline blending components that have oxygen in their structure and thus,
their production involves alcohols in addition to crude oil. MTBE has been used as a
blending component already in the 1980 and it is still one of the most used gasoline
components. However, its use is highly discussed especially in USA, because it leaked
from underground storage tanks into groundwater around twenty years ago. Because
of this leakage, the state of California for instance, banned its use in 2003. (Totten et
al., 2003; Rausser et al., 2005; Topgül, 2015.) The FQD limits the maximum ether
addition into gasoline at 15 vol% for 98E5 and at 22 vol% for 95E10. (Totten et al.,
2003; 2009/30/EC, 2009.)
Usually, MTBE is produced in the process unit that is in front of the alkylation unit
that offers the C4 paraffinic and olefinic stream into it. (Owen and Coley, 1995; Totten
et al., 2003.) Normally, the same unit produces ETBE by changing the methanol to
ethanol. The advantages to use MTBE and ETBE as a blending component are their
ability to decrease hydrocarbon and carbon monoxide (CO) emissions and decrease
the number of toxic components, like benzene. Moreover, the RONs of MTBE and
ETBE are 115 and 110 that refers their high antiknock resistance. However, the nitro-
gen oxides (NOx) emissions could increase, because their high oxygen concentration
causes lean combustion. (Topgül, 2015; Owen and Coley, 1995.)
The mixture of C4-C7 olefins with methanol produces TAME and with ethanol TAEE
(Owen and Coley, 1995). These ethers are viable gasoline blending components as
well, because they have high RONs, 111 and 105 (Owen and Coley, 1995). Normally,
the refineries have one unit to produce TAME and TAEE that changes only the meth-
anol to ethanol during the TAEE production.
Coker
In the delayed coker, occurs the cracking of thermally heavy feedstocks from vacuum
fractionator to produce solid coke, heavy gas oil, light gas oil and coker gasoline that
is a possible gasoline blending component. First, the fired heaters heat the mix of
bottom of vacuum distillation, then they are guided with steam t to the online coke
drum that thermally cracks the liquid into coke and other vapour products. Normally,
the refineries have two coker drums that operates in turns in 24 hours cycles. Without
coker refinery can sell their vacuum residue to other refineries for asphalt production
or produce it by themselves. (Olsen, 2014.)

12
2.3 Other gasoline blending components
This section presents blending components that the upgrading units in the previous
section does not produce. These blending components are renewable gasoline com-
ponent, ethanol, n-butanol and isobutanol.
Neste My Renewable Gasoline
Neste My Renewable GasolineTM is gasoline blending component that is a by-product
from production of MY Renewable DieselTM. The raw materials for its production are
wastes and residues and it is sulphur- and aromatic free component that has higher
energy density than ethanol. (Neste, 2019a)
There are mainly n-and isoparaffins in Neste My Renewable GasolineTM component
that causes its low density, approximately 670 kg/m3. Moreover, its vapour pressure
is 18.5 kPa and the boiling range 40-170 ��C. (Neste, 2019b)
Ethanol
Because of high RON of ethanol, apply refineries it as gasoline blending component.
Ethanol decreases the carbon footprint of the fossil gasoline, because the raw material
for its production is for instance sugar cane. However, the large-scale production of
ethanol for gasoline considers still many problems such as energy balance and 1st gen-
eration feedstocks. The feedstocks of ethanol such as sugar cane and corn, are the 1st
generation feedstocks that compete with the food production. Moreover, the produc-
tion of ethanol for gasoline is not in the energy balance, because its production requires
more energy than it releases during combustion in the engine. (Schobert, 2013.)
The maximum ethanol addition to 98E5 gasoline is 5 vol% and 95E10 is 10 vol%
according to the FQD. (2009/30/EC, 2009.) In the future, the larger additions of eth-
anol could be possible way to add renewable gasoline production. However, the in-
crease of ethanol content above the 10 vol% in the blends, could the heating value of
gasoline decrease that increases gasoline consumption in the consumer point of view.
The lower heating value (LHV) of gasoline is 32 MJ/l, while ethanol has only 21 MJ/l
(Neste, 2015). However, the driving style, weather and road conditions and traffic
have the main influence on the gasoline consumption and the heating value of gasoline
below 10 vol% concentration of ethanol is a minor effect. (Masum et al., 2015.)
The boiling point of ethanol is 78 °C, while conventional hydrocarbon gasoline boils
typically between 30-210 °C. The similar volatility of ethanol provides its proper op-
eration during warm-up and start-up in the SI engines. However, the flash point of
ethanol is 12.8 °C, while gasoline has around -40 °C. The flash point of gasoline covers

13
the temperature range that ensures the ignition of gasoline even in the very cold con-
ditions, but the flash point of ethanol is significantly higher that might cause problems
for gasoline ignition in the winter. (Schobert, 2013.)
N-Butanol and isobutanol
N-butanol is possible liquid biofuel because of its energy density is 26.9 MJ/l that is
higher than ethanol. The FQD approves its use as gasoline blending component and
limits its use up to 15 vol% in gasoline blend. The vapour pressure of n-butanol is
lower, and its corrosive effect to engine system is smaller compared to ethanol. The
process pathways that utilize biomass wastes and engineered microalgae could pro-
duce renewable n-butanol. (Lü et al., 2011; Liu et al., 2019.)
N-butanol, as also other oxygenated compounds, reduces the particulate emissions and
CO emissions, while NOx and hydrocarbon emissions might increase. With the care-
ful selection of the air-fuel ratio, is it possible significantly reduce the emissions com-
pared to fossil-based gasoline. However, the addition of n-butanol increases the for-
maldehyde and acetaldehyde emissions like other alcohols do as well. Moreover, the
large-scale preparation of n-butanol is still expensive. (Liu et al., 2019; Qian et al.,
2015.)
Isobutanol has almost the same energy density than n-butanol and both have higher
than ethanol, because oxygen-to-carbon ratio is lower compared to it. The FQD also
limits the use of isobutanol as a blending component in gasoline blend up to 15 vol%
(2009/30/EC, 2009). It has RON 106 and in addition, it is insoluble in water, because
its longer carbon chain. The addition of these butanols 12 to 15% into gasoline blend
has been noticed vapour pressure to decrease approximately 7 kPa that will help to
produce low vapour pressure gasoline in the summer. (Tao et al., 2014.) The cyano-
bacteria are possible raw materials for the isobutanol production in the future (Aro,
2016).
2.4 Gasoline regulation
EU, nations and sometimes city and municipal level regulate gasoline. The FQD is a
specification of legislation that instructs gasoline, diesel and biofuels in road transport
and gasoil in non-road-mobile machine. EU demands that the fuel quality meets the
strict requirements to protect the environment and human health. Therefore, the mem-
ber states of the EU need to follow FQD and implement its content in their legislation.
(2009/30/EC, 2009.)
Unleaded gasoline is standardized by EN 228 standard that guides the implementation
of FQD. The EN 228 standard has two instructions for the FQD depending on the
oxygen contents in gasoline that are of 2.7 wt% or 3.7 wt%. (SFS-EN 228: 2012 +

14
A1:2017, 2017.) Table 2 lists the current requirements of highway gasoline based on
the FQD and EN 228 standards.
ParameterDirective
2009/30/EC Gasoline
EN 228 standard,
2017 for unleaded
gasoline with a
maximum oxygen
content of 3.7 wt%
EN 228 standard,
2017 for unleaded
gasoline with a
maximum oxygen
content of 2.7 wt%
Unit
RON min. 95 min. 95 min. 95
MON min. 85 min. 85 min. 85
max. 60 max. 60 max. 60
max. 70, if the
ambient summer
temperature is low
max. 70, if the ambient
summer temperature is
low
max. 70, if the ambient
summer temperature is
low
max. 80 max. 80
max. 90, if the ambient
winter Temperature is
low
max. 90, if the ambient
winter temperature is
low
Distillation
min. 46 min. 46 min. 46
max. 72 max. 72 max. 71
Percentage evaporated
at 150 ��Cmin. 75 min. 75 min. 75 vol%
Final boiling point 210 210 210 C��
Density - min. 720; max. 775 min. 720; max. 775 kg/m3
Sulphur content max. 10 max. 10 max. 10 mg/kg
Lead content max. 5.0 max. 5.0 max. 5.0 mg/l
Manganese content - 2 2 mg/l
Oxidation stability - 360 360 minutes
Copper strip corrosion
(3h at 50 °C)- class 1 class 1 rating
Appearance - clear and bright clear and brightVisual
inspection
Existent gum content
(solvent washed)- max. 5.0 max. 5.0 mg/100 ml
Oxygen content max. 3.7 max. 3.7 max. 2.7 wt%
Olefins max. 18 max. 18 max. 18 vol%
Aromatics max. 35 max. 35 max. 35 vol%
Benzene max. 1.0 max. 1.0 max. 1.0 vol%
Ethanol max. 10 max. 10 max. 5.0 vol%
Methanol max. 3.0 max. 3.0 max. 3.0 vol%
Ethers containing at least
five carbon atomsmax. 22 max. 22 vol%
Tert-butyl alcohol max. 15 max. 15 vol%
Isobutyl alcohol max. 15 max. 15 vol%
Other oxygenates max. 15 max. 15 vol%
Isopropyl alcohol max. 12 max. 12 vol%
DVPE (summer) kPa
DVPE (winter) - kPa
Percentage evaporated
at 100 ��Cvol%
Volume blending
restricted to 2.7 wt%
maximum oxygen
content
Table 2. The requirements of highway gasoline in the EU based on the FQD and EN 228 stand-
ard (2009/30/EC, 2009; SFS-EN 228: 2012 + A1:2017, 2017).

15
What stands out clearly in Table 2 are many technical limits for gasoline that regulate
its blending. Therefore, the blending must be designed to meet the technical and com-
position limits. Table 2 shows the limit for ethanol to be 5.0 vol% for 98E5 gasoline
and 10 vol% for 95E10 gasoline that could rise in the future, if the ethanol concentra-
tion increases up to 20-25% in gasoline blends. This addition influences on other gas-
oline properties such as density, volatility, octane number and oxygen limit. Nowa-
days, the oxygen limit is 2.7 w% and 3.7 w%, but if the ethanol limit rises to 20 and
25%, the linearly calculated oxygen limits would be 7.4 wt% and 9.25 wt%. Gasoline
would be heavier with the higher addition of ethanol than 10 vol% and therefore, the
density limit could increase as well. Moreover, ethanol increases the vapour pressure
rapidly with the low concentrations, but with the higher concentrations than 10 vol%
of ethanol, vapour pressure starts decrease. (Davidson, 2013.)
2.5 Hydrocarbons
Chemical groups of crude oil consist of basic types of hydrocarbons: paraffins, olefins,
naphthenes and aromatics. The differences between structures are the amount of bonds
between carbons and the shape of molecules, ring or chain. Carbon atom has four
electrons in its outer shell that it wants to complete to obtain octet structure. Therefore,
carbon atom needs to form bonds with other carbons, atoms or molecules to have stable
structure. These bonds can be single, double or triple bonds and normally, in the gas-
oline refining, carbon has single or double bonds with other carbon atoms and rest of
the bonds between hydrogens or other elements such as oxygen, sulphur or nitrogen.
(Totten et al., 2003.)
Hydrocarbon that has single bonds between carbons is called saturated, while hydro-
carbon with double bonds is unsaturated. Paraffins and naphthenes are saturated hy-
drocarbons, while olefins and aromatics are unsaturated.
2.5.1 Paraffins
Paraffins are saturated, straight or branched chain hydrocarbons in the gasoline blend.
Their content is usually between 30-60% of the blend and desired paraffins are
branched paraffins, also called isoparaffins, because their higher-octane number.
Isomerization of n-paraffins into isoparaffins is possible reaction pathway in the refin-
ery to increase the octane number of blending components. (Olsen, 2014.) Moreover,
cracking of long paraffins into shorter, gasoline boiling range hydrocarbons is the vi-
able reaction pathway, but its drawback is the high production of coke that reduces the
activity of catalyst. (Totten et al., 2003.)
Cyclic paraffins are called naphthenes that consists of at least 5 carbons and are present
in crude oil. Naphthene structure is desired, for instance in reforming unit where aro-
matization increases its octane number.

16
2.5.2 Olefins
Olefins are unsaturated hydrocarbons that contain single or multiple double carbon-
carbon bonds. Olefins have high octane number that promotes their presence in gaso-
line components. FCC cracks long olefins from crude oil to shorter gasoline boiling
range hydrocarbons that are suitable in Cat gas component. However, the partial ox-
idation and oligomerization of them could produce high-viscosity materials, gums, that
are harmful for the engines by contaminating nozzles, fuel injectors and causing stick-
ing of the piston rings. Olefin with two double bonds is called diene that is toxic and
causes harmful emissions during combustion (OICA, 2013). The FQD limits olefin
content in gasoline up to 18 vol%. (Totten et al., 2003; Schobert, 2013.)
2.5.3 Aromatics
Aromatics consists of one benzene ring and they are favoured gasoline blending com-
ponents, because they have high-energy density and octane number. Benzene is car-
cinogenic and therefore, the FQD limits it up to 1 vol%. (2009/30/EC, 2009.)
Aromatics are most complicated hydrocarbons to handle in the hydrotreating and de-
sulphurization units, because their stable structure (Totten et al., 2003). Typically,
crude oil contains aromatics between 10 to 50% and their limit in gasoline blends is
35 vol% (2009/30/EC, 2009). Lighter fractions contain unsubstituted aromatics such
as benzene, while in heavier fractions contain aromatics with alkyl substituents or cy-
cloalkane ring such as meta-xylene or cyclohexylbenzene. Polycyclic aromatic hydro-
carbons (PAHs) such as naphthalene are harmful for SI- engine, because they form
soot and smoke (Kroyan, 2018; Schobert, 2013). Moreover, the incomplete com-
bustion of aromatics causes high maintenance cost of equipment and decreases the air
quality (Totten et al., 2003).
2.6 Properties of gasoline blends
The different hydrocarbon structure in gasoline blending components influences on
the properties of gasoline. However, blends need to meet the requirements of law and
standards always. The hydrocarbon structure of blending components varies depend-
ing on feedstock such as different crude oils or renewable raw materials. For instance,
the use of oxygenates as gasoline blending components provides more functionality to
gasoline and thus, generates new properties for it such as polarity. This section pre-
sents the most important properties of gasoline blends and their influence on the per-
formance of gasoline.

17
2.6.1 Octane number
There is a property in gasoline that describes its ability to persist the compression with-
out autoignition, octane number. Normally, the spark plug ignites air-fuel mixture,
while pressure and induced heat in the cylinder cause spontaneous combustion of air-
fuel mixture that is called knocking. Knocking occurs when these two combustion
reactions occur in the cylinder simultaneously and their flame fronts hit. (Owen and
Coley, 1995.) The short, transient knocking is not dangerous, but continuous one
could damage the pistons and spark plug electrodes (Neste, 2015).
The autoignition of gasoline is the reason for knocking, while the pre-ignition is nor-
mally reason for so called super-knock phenomenon. Glowing particles such as small
exhaust gas deposits in the combustion chamber ignite air fuel-mixture in the early
stage of piston stroke that causes damages on the engine parts. The hot surface inside
the cylinder accelerates the ignition of glowing particles and increases the probability
of pre-ignition. Pre-ignition is normally noticed only at high loads in the presence of
high temperature and pressure. (Budak et al., 2016; Neste, 2015.)
Octane number is divided into two different numbers RON and MON that are meas-
ured in the different test conditions. Usually, RON is the number that is present on the
gas station in EU, while the gas stations apply the Anti Knock Index (AKI) in the USA.
(Totten et al., 2003.) Today, the FQD requires the RON to be 95 and MON 85.
2.6.2 Volatility
The volatility is an important parameter to define the distillation characteristics of gas-
oline and moreover, the boiling range of hydrocarbons controls the proper operation
of the engine during start-up and warm-up (Totten et al., 2003). The temperature of
the environment has also a significant influence on the volatility by controlling it ac-
cording to the temperature fluctuations (Kroyan, 2018). The higher vapour pressure
compounds are called volatiles such as butane.
The vapor-to-liquid (V/L) ratio describes the probability of fuel to vaporize in auto-
motive engine fuel systems. The high vapor pressure is specially needed in the winter
to evaporate enough vaporized gasoline to ignite. That is called cold-start perfor-
mance, while its opposite is the vapor lock that occurs when gasoline evaporates un-
timely before it even reaches the engine. In the hot summer days, the vapour lock
might cause very high vapor pressure to gasoline and its consequence is the shutdown
of engine until it cools enough. (Schobert, 2013.) The EN 228 standard has the vapor-
lock protection measure, Vapour Lock Index (VLI), that defines its maximum value.
The purpose of vapour-lock protection is to predict gasoline hot-weather performance
of vehicles setting the maximum limit for VLI using vapour pressure and E70 values
that Equation 4 defines shows.

18
𝑉𝐿𝐼 = 𝑉𝑃 ∗ 10 + 7 ∗ 𝐸70 (4)
, where VP is the vapour pressure of gasoline and E70 describes the vaporized amount
of gasoline at 70 °C.
The challenge of refiners is to blend right components to produce enough volatile gas-
oline. The one solution is to shift the boiling points of distillation fractions or adding
the high vapour pressure blending components such as butane to control the vapor
pressure of gasoline seasonally. There is still drawback in high vapor pressure of gas-
oline, because it increases smog formation that adds the air pollution. (Schobert,
2013.)
2.6.3 Heating value
The heating value is expressed by two ways, higher heating value (HHV) and LHV.
The latter usually describes the heating value of gasoline, because the vaporization
heat of water from gasoline combustion product is not possible to collect by conden-
sation. The heating value for gasoline describes also its energy density that is im-
pressed by the heat of combustion per unit volume. The expression is per volume,
because the car is fuelled depending the volume of tank, not mass of it. (Schobert,
2013.) The LHV of gasoline is 32 MJ/l compared to possible future gasoline compo-
nents such as 2,5-dimethylfuran (DMF), ethanol and n-butanol, the LHVs are 30 MJ/l,
21 MJ/l and 27 MJ/l. (Neste, 2015; Qian et al., 2015.)
In the investigation of gasoline components and the chemistry of them is important to
focus on the carbon-hydrogen relation, since hydrogen has almost four times higher
heating value than carbon. Therefore, better components for gasoline production have
low amount of carbon and high hydrogen. They can offer higher energy with less
amount of fuel. Moreover, the relation between carbon and hydrogen is an important
factor to decrease CO2 emissions of gasoline combustion. The 2% reduction of carbon
content in fuel decreases CO2 emissions by 5% that is a remarkable reduction consid-
ering emissions from transportation. (Mikkonen and Nuottimäki, 2019.)
2.6.4 Toxicity
Usually, the investigation of harmful effects of gasoline focuses on its emissions. In
addition to it, the development of new gasoline blending components need to consider
the land use and toxicity, especially 2nd generation feedstocks could have toxicological
problems (Heger et al., 2016). For instance, DMF is one of 2nd generation feedstock
that needs more research to recognize its possible health hazards and toxicology (Qian
et al., 2015).
The toxicity of biofuels is a problem for the environment and, also for the human health
at the manufacturing and distribution stages. Otherwise the hazards of fossil fuels, the

19
hazard issues of biofuels are not familiar yet. “Green Toxicology” defines the hazards
of biofuels at development stages such as the contamination of water resources and
soil organisms, toxicity for human genome and the inhalation problems. The research
needs to focus on these hazards and their evaluation is essential before the large-scale
production and their arrival into the ecologic system. (Heger et al., 2016.)
Heger et al. investigated toxicity of biofuels compared to fossil diesel in the aquatic
environment. In the study were investigated several biofuels from which 2-methyltet-
rahydrofuran, 3-methyltetrahydrofuran and 2-butanone showed to be the least toxic.
Furthermore, the most toxic biofuel candidates, 1-octanol and 2-methylfuran were less
toxic than fossil diesel. The molecular structure of biomass-derived fuels influences
on the differences between toxicity of biofuels. (Heger et al., 2016.)
The FQD guides gasoline blending with the limits such as aromatic and oxygenate
content. These same limits concern also biofuels and therefore, they cannot contain
currently more than 3.7 wt% of oxygen. (2009/30/EC, 2009.) However, some changes
or additions might need to be added to the directive due to increased biofuels produc-
tion in the future.
2.6.5 Oxygen content
2.7 or 3.7 wt% are the limits to the oxygen content of gasoline that the EN 228 sets.
Lower oxygen content is defined, because the operability of the old vehicles cannot be
secured with gasoline that has higher oxygen content. There might be the deletion of
the 2.7 wt% content in the future when the old vehicles diminish, and it could even
increase. There are some advantages in higher oxygen content such as
● its combustion with lower flame temperature reduces the heat lost,
● large production of combustion products and higher cylinder pressure,
● higher RON that allows larger compression ratio of the engine and
● providing more renewable gasoline. (Owen and Coley, 1995.)
2.6.6 Sensitivity
The term sensitivity describes the difference between RON and MON. In the older
engines lower sensitivity is favoured, while the modern engines, particularly down-
sized boosted engines, favour high sensitivity and RON today. Therefore, sensitivity
might be a significant property of gasoline that needs to concern in the comparison of
gasoline blending components in the future. Paraffins have low sensitivity compared
to olefins and aromatics, while ethanol has even higher that boosts its blending with
gasoline. (Boot et al., 2017; Farrell et al., 2019; Ratcliff et al., 2018.)

20
3 Blending optimization
Blending is a mix of different strategies such as inventories, operability of refinery,
economy targets and directives. The importance to follow different blending strate-
gies helps to produce gasoline blends that have the high quality. The two main tasks
of blending are the design of its timetable and the formation of blend. The properties
of blending components such as type of hydrocarbons, dry vapor pressure equivalent
(DVPE), RON, MON and LHV influence on final gasoline product. The target of
blending is to mix these components to form a blend that combines their best proper-
ties. (Oduola and Iyaomolere, 2015.)
Gasoline production is 60-70% of the profits of the refineries in the USA, while Euro-
pean countries have the overproduction of gasoline. The reason for the overproduction
is the options to produce gasoline from lighter crude oils or shale oil. However, surplus
gasoline can be sold to the USA and South America and thus, the cutting of gasoline
production is not necessary. (Oduola and Iyaomolere, 2015; Sinervä, 2018.) Moreo-
ver, the registration of the new gasoline cars increased 6.5 percentage unit in 2018 and
it covers now 56.7% of all new registered cars in Europe. This is a proof that gasoline
has the demand also in the future (Kortelainen, 2019). New registrations offer also the
possibility to produce renewable gasoline that could increase gasoline product selec-
tion in refineries and decrease CO2 emissions.
In the next section is presented linear blending that is the easiest method to estimate
properties of final gasoline blend. While non-linear blending provides challenges for
the estimation of blend properties, for instance RON and MON. The section 3.2 ex-
plains the reasons for the non-linearity and tries to search the differences among dif-
ferent blending components with the help of their hydrocarbon structure and oxygen-
ates. Also, the vapour pressure blending is non-linear that is showed in the section 3.3
for ethanol and gasoline blends.
3.1 Linear gasoline blending
Co-optima team researches linear blending among different properties of gasoline
blends. They present the calculation of the heat of vaporization (HOV) for gasoline
blend assuming HOV blending approximately linear that Equation 6 shows.
𝐻𝑂𝑉(𝑔𝑎𝑠𝑜𝑙𝑖𝑛𝑒 𝑏𝑙𝑒𝑛𝑑) = 𝑥1 ∗ 𝐻𝑂𝑉(𝑏𝑙𝑒𝑛𝑑𝑖𝑛𝑔 𝑐𝑜𝑚𝑝𝑜𝑛𝑒𝑛𝑡 1) + 𝑥2 ∗
(𝑏𝑙𝑒𝑛𝑑𝑖𝑛𝑔 𝑐𝑜𝑚𝑝𝑜𝑛𝑒𝑛𝑡 2) + . . . 𝑥𝑛 ∗ (𝑏𝑙𝑒𝑛𝑑𝑖𝑛𝑔 𝑐𝑜𝑚𝑝𝑜𝑛𝑒𝑛𝑡 𝑛) (6)
, where xn is a molar or volume fraction of gasoline component and HOV (blending
component n) is heat of vaporization of component.
Knowing the molar ratios of blending components and their HOVs the final HOV of
gasoline blend can be calculated based on Equation 6 (Farrell et al., 2019). Equation
21
6 provides the principle for calculation also other linear gasoline properties such as the
amount of aromatics, olefins and paraffins.
However, the mixing of gasoline blending components to produce gasoline blend with
high octane number is not linear for all its properties. The RON, MON and DVPE do
not blend linearly that causes challenges for the estimation the final properties of gas-
oline. However, Ghosh et al. discovered linear octane blending among the similar hy-
drocarbon composition of blending components such as paraffins blends linearly with
other paraffins and olefins with other olefins. What is interesting to notice is linear
blending of naphthenes and olefins that this study shows. (Ghosh et al., 2006.) How-
ever, gasoline components consist often more than one hydrocarbon group that poses
more complex compositions that linear octane blending cannot anymore explain.
3.2 Non-linear gasoline blending-Synergistic and antagonistic
octane blending
Blending of two chemically different gasoline components together could produce
gasoline which octane number differs significantly from the octane numbers of indi-
vidual gasoline components. The identification of this phenomenon is extremely im-
portant for the estimation of the octane number of gasoline. There are two terms that
describe the non-linear octane blending: synergism and antagonism. The synergism
provides higher octane number than the linear octane blending assumes, while the an-
tagonism provides lower one. In Figure 3 is presented the difference between syner-
gistic, linear and antagonistic octane blending.
Figure 3. The synergistic and antagonistic behaviour of fuel octane blending ((Farrell et
al., 2019), [Modified 23.9.2019]).

22
The octane number of different alkylates and isomerates has been noticed to blend
synergistic. While reformates have been noticed to blend antagonistically and there-
fore, the octane number of gasoline blend is lower than expected according to the linear
blending. (Boot et al., 2017.) Ghosh et al. noticed also octane blending of paraffins
and olefins to be non-linear but could not prove is it synergistic or antagonistic (Ghosh
et al., 2006). In addition to the hydrocarbons, Co-optima research team investigated
the blending of oxygenates such as esters with gasoline. In the study, they noticed that
it is antagonistic otherwise the blending of gasoline with furans and cyclic ketones is
synergistic. (Farrell et al., 2019.)
Ethanol boosts the octane number of gasoline blend depending on the hydrocarbon
structure of other blending components in the blend. It blends with n-paraffins, iso-
paraffins and olefins synergistically, while with aromatics antagonistically. However,
short side chains like methyl shift blending between ethanol and aromatics toward lin-
ear and even synergistic, but longer side chains such as propyl group or even longer
might keep the blending antagonistic. Longer paraffins add the synergistic phenom-
ena in ethanol blending, for instance comparing iso-octane and iso-heptane, is the syn-
ergy greater with iso-octane-ethanol blend. Similarly, longer n-paraffins increase syn-
ergistic phenomenon compared to shorter ones. (Badra et al., 2017; Boot et al., 2017.)
Farrell et al. studied non-linear octane blending and found out phenomenon that im-
proves the RON even more than synergistic blending. It is called hyper-boosting phe-
nomenon that Farrell et al. noticed during blending prenol with gasoline blend. The
hyper-boosting phenomenon produces higher RON than either of blended components
have. Normally, the RON of final blend cannot be higher than its blending compo-
nents individually have, but in the case of prenol and gasoline it is. That phenomenon
could increase the utilization of alcohols like prenol to increase the RON of gasoline
even though the RONs of blending components are not initially high. (Farrell et al.,
2019.)
3.2.1 Carbon-carbon bonds, reactivity and reaction rate
Boot et al. has investigated the influence of the carbon-carbon bonds, reactivity and
reaction rate on RON, to explain why it differs among different hydrocarbon types.
They noticed longer paraffins to be more reactive, because they have more possible
reaction sites. The longer chain causes short ignition delay times and the better cetane
number, while the RON decreases and the probability of knocking in the engines in-
creases. (Ghosh et al., 2006; Boot et al., 2017.)
Cyclic and straight chain paraffins have different RONs even though the carbon num-
ber is same, for instance six carbon hydrocarbons, n-hexane and cyclohexane, have
RONs 25 and 83. (Boot et al., 2017.) Compared paraffins to same carbon number
cyclic paraffins, is their reactivity higher. During hydrogen abstraction reaction small
radical such as OH removes H atom from n-paraffin molecule and forms alkyl radicals,
while the hydrogen abstraction of cycloalkanes form cycloalkyl radicals. That reaction

23
needs less energy in the case of n-paraffins than cycloparaffins and therefore, the for-
mation of alkyl radicals is more probable. Those radicals react with oxygen and pro-
duce less conjugated compounds that have lower RON compared to the products form
the reaction of same size cycloalkyl radicals and oxygen. This reaction produces more
conjugated compounds with high RON that resists autoignition reactions in the low
temperatures. (Battin-Leclerc, 2008.)
Boot et al. investigated also the structure of olefins to explain their high RONs. They
noticed that double bonds increase the octane number, because they create delocalized
unpaired electrons that increase stability of olefins (Boot et al., 2017). Moreover, De
Bruycker et al. investigated the influence of carbon-carbon double bond on the radical
formation. They noticed the C-H bond of carbon atom that is in the 𝝰-position to the
C-C double bond is weak and therefore, its scission leads resonantly stabilized radi-
cals. In addition, the C-C bond between 𝝰- and 𝛃 -positions is weak, and its scission
product is also a resonantly stable radical that does not probable react with oxygen.
Because these compounds have lower reactivity, they also have high RONs. (De
Bruycker et al., 2016.) Figure 4 shows the positions of carbons to point those that are
involved in the formation of resonantly stabilized radicals.
Bounaceur et al. investigated the influence of the position of double bond on the au-
toignition and measured the RONs of 1-hexene, 2-hexene and 3-hexene, 76.4, 92.7
and 94. The bond dissociation energy (BDE) indicates how strong the bond between
carbons or carbon and hydrogen is in hydrocarbon molecule. The position of double
bond in the carbon chain influences on the BDE between carbons and hydrogens even
increasing or decreasing it. The C-H bonds that have low BDE are more reactive,
easier to break and have low RON. (Bounaceur et al., 2009; Boot et al., 2017.) The
lowest BDE of C-H bond has tertiary bonds (T), then secondary bonds (S) and the
highest has primary bonds (P) that Figure 5 illustrates.
Figure 4. The nomination of carbons in olefin structure ((ChemSpider, 2019b), [Modified
30.8.2019]).

24
1-Hexene has six secondary C-H bonds and three primary C-H bonds, while 2-hexene
has four secondary C-H bonds and six primary C-H bonds. The lower amount of the
primary bonds in 1-hexene proves its lower RON compared to 2- and 3-hexene. How-
ever, 2-hexene and 3-hexene contains equal amount of primary and secondary C-H
bonds, but 3-hexene has shorter paraffinic chain length that decreases its reactivity
compared to 2-hexene. Figure 6 indicates paraffin chain in olefins with the blue cir-
cles.
Aromatics covers normally the one third of gasoline and their structure is different
than paraffins and olefins, because their core is benzene ring. Aromatics are by them-
selves nucleophiles with high pKa value and they offer a possibility to the electrophilic
substitution such as replacing H atom with radical like OH. Because of the ℼ-bond in
aromatic ring the removing of hydrogen is extremely hard and therefore, aromatics are
resistant for auto-ignition at low and intermediate temperatures. Addition of long side
chains into aromatics increases its reactivity in the low temperatures and decreases
octane number. Toluene consists of aromatic ring and one methyl group, and xylene
consists of aromatic ring with two methyl groups. Their side chains are short that
boosts their octane numbers, because they form resonance stable radicals during bond
scission. Benzyl is an example of these radicals that is stable radical, has low reactivity
and resists the autoignition. (Boot et al., 2017.)
Figure 5. The primary (P), secondary (S) and tertiary (T) C-H bonds are placed in iso-
octane and n-heptane ((Boot et al., 2017), [Modified 23.9.2019]).
Figure 6. The hydrocarbon structure of 1-hexene, 2-hexene and 3-hexene with the blue
marked paraffinic chain ((ChemSpider, 2019b; PubChem, 2019; ChemAladdin, 2019),
[Modified 29.8.2019]).
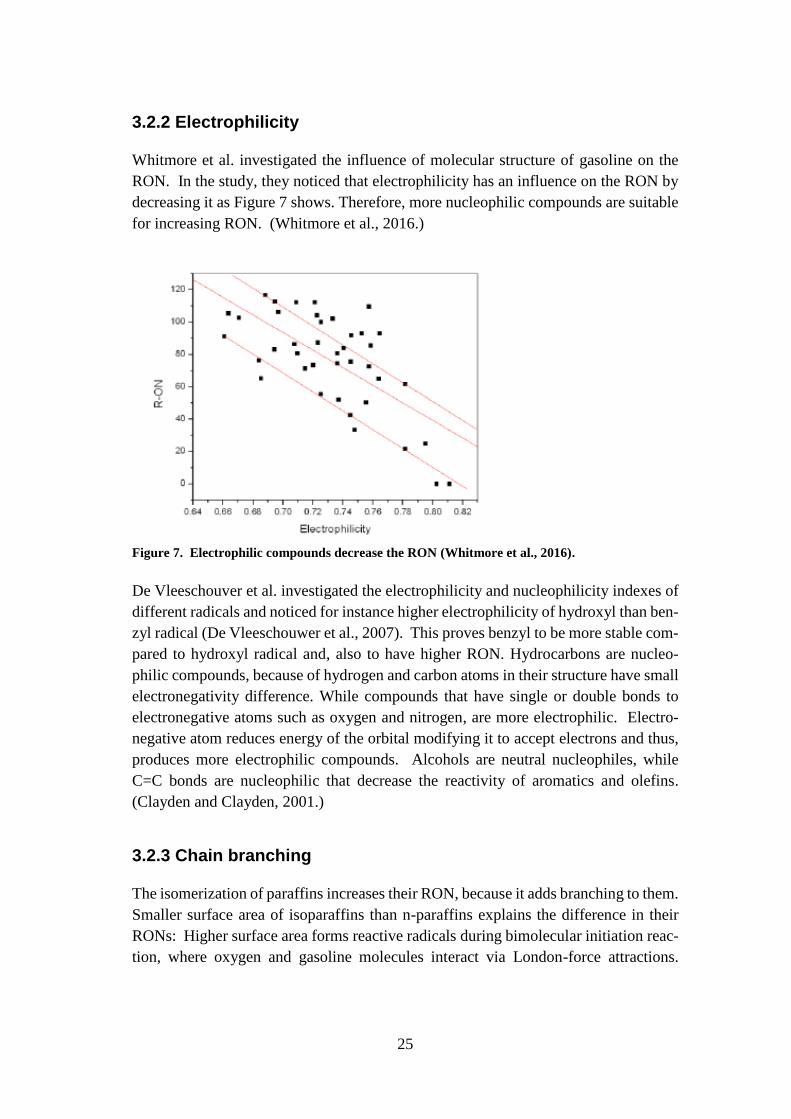
25
3.2.2 Electrophilicity
Whitmore et al. investigated the influence of molecular structure of gasoline on the
RON. In the study, they noticed that electrophilicity has an influence on the RON by
decreasing it as Figure 7 shows. Therefore, more nucleophilic compounds are suitable
for increasing RON. (Whitmore et al., 2016.)
De Vleeschouver et al. investigated the electrophilicity and nucleophilicity indexes of
different radicals and noticed for instance higher electrophilicity of hydroxyl than ben-
zyl radical (De Vleeschouwer et al., 2007). This proves benzyl to be more stable com-
pared to hydroxyl radical and, also to have higher RON. Hydrocarbons are nucleo-
philic compounds, because of hydrogen and carbon atoms in their structure have small
electronegativity difference. While compounds that have single or double bonds to
electronegative atoms such as oxygen and nitrogen, are more electrophilic. Electro-
negative atom reduces energy of the orbital modifying it to accept electrons and thus,
produces more electrophilic compounds. Alcohols are neutral nucleophiles, while
C=C bonds are nucleophilic that decrease the reactivity of aromatics and olefins.
(Clayden and Clayden, 2001.)
3.2.3 Chain branching
The isomerization of paraffins increases their RON, because it adds branching to them.
Smaller surface area of isoparaffins than n-paraffins explains the difference in their
RONs: Higher surface area forms reactive radicals during bimolecular initiation reac-
tion, where oxygen and gasoline molecules interact via London-force attractions.
Figure 7. Electrophilic compounds decrease the RON (Whitmore et al., 2016).

26
These forces diminish during reaction between isoparaffins and oxygen that forms
more stable radicals which will auto-ignite less probable. (Schobert, 2013.)
Ghosh et al. researched the influence of chain branching on the gasoline octane number
and observed that the RON varies a lot depending on the amount of side chains in the
carbon backbone. For instance, comparing 2-methylheptane and 2,2,3-trimethylpen-
tane, the RONs are 20 and 110, even though they have equal amount of carbons. 2,2,3-
trimethylpentane has low reaction rate, because it has smaller paraffinic chain length
and less existing reaction sites compared to 2-methylpentane. (Ghosh et al., 2006.)
There has been noticed to be an effect of position of the branch to the octane number
in isoparaffins. The side chain in the centre of the carbon backbone improves the
octane numbers, because the paraffin chain length decreases. As it was proved before,
shorter paraffin chain length has higher RON and therefore, more centric side chains
in the carbon backbone are preferred. (Boot et al., 2017.) Figure 8 concludes the
impacts of branching and number of carbons on both octane numbers, RON and MON.
What stands out in Figure 8 is the reduction of octane numbers when the number of
carbons increases. Also, Figure 8 shows that isoparaffins have higher-octane number
compared to same carbon number n-paraffins. Dimethyl-propane is the only exception
in Figure 8 that does not behave according the trend. It has lower RON and MON than
dimethyl-butane, because methyl groups are both in same carbon atom that produces
quaternary carbon in hydrocarbon. This carbon is more reactive and increases the
reactivity of the whole hydrocarbon that decreases its octane numbers.
Figure 8. More branched and shorter hydrocarbons have higher RON and MON (Boot et
al., 2017).

27
3.2.4 Oxygenates
Ethanol consists of one OH-group that affects to the BDE of the bonds between carbon
and hydrogen. It decreases the reactivity of the carbon chain compared to alkanes with
the same chain length. (De Bruycker et al., 2016.) Koivisto et al. noticed that second-
ary OH-group decreases the BDE of C-H bond in 𝛂-carbon atom (nearest C-atom of
OH-group) and increases the BDE of C-H bond next to 𝛂-carbon and the other sec-
ondary carbon atoms by hindering the cleavage of hydrogen atoms from them. Figure
9 shows with dash lines which C-H bonds have higher BDE, because of the secondary
OH-group. (Koivisto et al., 2015)
Secondary OH-group causes difficulties for H-abstraction from secondary alcohols
and decreases the rate of radical formation. Lower amount of free hydrogen radicals
prolongs the ignition delay time for next reactions that increases the octane number of
these compounds. (Koivisto et al., 2015.)
3.3 Vapour pressure blending
Concave organisation studied the effect of ethanol to the vapour pressure of gasoline
and noticed that ethanol increases it significantly when it is added 5 vol%. However,
in higher ethanol concentrations the vapour pressure starts to decrease. Concave or-
ganisation studied 60 different base fuels that have different ether, aromatic and olefin
compositions. They added ethanol from 0-25% to these base fuels to find out how it
affects to the DVPE, density and distillation curves. The input data also includes the
Figure 9. The secondary OH-group increases the BDE of 𝛃-carbon atom that reduces
its reactivity ((Koivisto et al., 2015), [Modified 6.8.2019]).

28
DVPE of base fuel, its E70 and E100 values. In Figure 10, is showed the influence of
ethanol on the DVPE of gasoline when their composition varies. (Rose, 2009.)
What stands out in Figure 10 is the rapid rise in the DVPE with addition of 5% ethanol
to gasoline blends without other oxygenates as orange and red curves present. There
has been studied the influence of ethanol to the DVPE of gasoline in some studies, for
instance Da Silva et al. studied gasoline blend structure to find out how hydrocarbon
groups influence on the DVPE when they added ethanol, MTBE or ETBE into it. The
study proved that adding 5% ethanol into blend with high aromatic ratio the DVPE
increases less than in paraffinic and naphthenic blend. The formation of ethanol aze-
otropes with aromatics causes its lower rise. (Da Silva et al., 2005.) Figure 10 shows
the same increase of the DVPE with 5% ethanol addition, but then it declines, because
the formation of azeotropes begins between ethanol and aromatics. All blends in the
Concawe study have high amount of aromatics and therefore, the influence of paraffins
on the DVPE of gasoline blend is hard to recognize.
Bays et al. investigated the behaviour of DVPE of gasoline blend with higher ethanol
concentrations. They explained it with the forces between molecules in gasoline blend
and ethanol. There are mainly van der Waal’ forces in gasoline blend when it does not
contain ethanol. While, the 10 mol% addition of ethanol into it causes a disruption to
these forces. Adding even more ethanol, hydrogen starts to form bonds with oxygen
of ethanol molecules that forms small clusters which could increase DVPE. The addi-
tion of ethanol over 20 mol% causes the formation of the wider hydrogen bonding
network that decreases the small ethanol clusters but increases the larger hydrogen-
bonding networks that might decrease DVPE. (Bays et al., 2019.)
55
60
65
70
75
80
85
90
95
0 10 20 30
DV
PE
Ethanol addition, %28.3% Aromatics, 20% Olefins, 0% Ethers 20% Aromatics, 20% Olefins, 11% MTBE
45% Aromatics, 5% Olefins, 0% Ethers 20% Aromatics, 17.5% Olefins, 22% ETBE
Figure 10. The 5% addition of ethanol could increase the DVPE rapidly (Rose, 2009).

29
Da Silva et al. noticed that ETBE in high aromatic blend decreases DVPE linearly
when ethanol content increases, while the trend is opposite in paraffinic and naph-
thenic blend, in which the additions of ETBE increase DVPE. Whereas, MTBE in-
creases the DVPE in both blends and even more in gasoline blend with low aromatic
content. (Da Silva et al., 2005.)
4 Renewable feedstocks for the future production of
gasoline
27% of the CO2 emissions in EU are caused by transportation and 41% of these emis-
sions produces passenger cars (Transport and environment, 2018). These numbers
show that there is a huge need for the development of more sustainable fuels to de-
crease those emissions. To decrease the carbon footprint of fuels, refineries should
start to utilize renewable raw materials instead of fossil ones. Moreover, the price of
crude oil increases that could increase the costs of the refining and decrease its profit-
ability (Masum et al., 2015). There are still challenges to produce profitable gasoline
from renewable feedstocks in the refineries and the yield of the conversion routes af-
fect strongly to future gasoline production. For instance, the 2nd generation feedstock,
forest residue, needs the pre-treatment before its utilization (Naik et al., 2010). These
pre-treatment methods are energy consuming processes that decreases their utilization
(Dutta et al., 2014).
Renewable feedstocks are divided into four generation that all have their own ad-
vantages and disadvantages. This chapter lists the different generations and provides
three renewable compound examples that are possible feedstocks for the more sustain-
able gasoline production.
4.1 From the 1st generation biofuels to electrobiofuels
1st generation: Food and plant based and 2nd generation: Residue and waste
based
The feedstocks for first generation biofuels are oilseed, corn, wheat and sugarcane that
compete against food production and thus, they are not reasonable alternatives to pro-
duce biofuels. The competition for land use against food production increases food
prices and, also reduces the available food for animals. The utilizing of the 1st gener-
ation feedstocks to produce biofuels could reduce emissions like CO, particulate mat-
ters and smoke emissions. However, the direct use of vegetable oils for instance in
the diesel engines contaminates them with wax and gum. (Dutta et al., 2014.)

30
There are many drawbacks in the utilization of 1st generation feedstocks, but their use
is also acceptable, if it is done in the sustainable way. To verify the responsibility of
renewable products is to utilize only the certificated feedstocks. It ensures that the
cultivation does not occur in the forbidden areas such as rainforests, biodiversity is
preserved, and the production of feedstocks does not disrupt the human rights. (Neste,
2019c.)
2nd generation biofuels do not compete against the food production and their raw ma-
terials are for instance lignocellulosic feedstocks such as cereal straw and forest resi-
dues. Ethanol is also produced from the 2nd generation feedstocks such as forest resi-
dues and organic part of municipal waste by fermentation. This production does not
consume the environment and has not impact on the food production like the utilization
of 1st generation feedstocks have. (Dutta et al., 2014.) Moreover, possible feedstocks
for the production 2nd generation biofuels are plastic wastes that are concerned poten-
tial raw materials for the fuel production. The use of plastics has increased 5% every
year since 1990, and the highest users of them are the packing materials, households,
agriculture and cars. The plastic waste is divided into the municipal and industrial
waste from which the industrial waste is more homogenous and, also less contami-
nated. (Kunwar et al., 2016.)
Plastics consist of hydrocarbons, they have not oxygen that provides them high heating
value and moreover, they are non-acidic and non-corrosive raw materials. There are
several factors in the plastic wastes that influence on their utilization in the gasoline
production such as feed composition, particle size and catalysts. The thermally degra-
dation of plastic wastes increases its popularity, because it could produce smaller hy-
drocarbon chains that are possible raw materials for gasoline. It is possible to convert
plastics to fuels with or without catalyst, pyrolysis of plastics or conversion of polyvi-
nyl chloride (PVC). However, the main problem of PVC in the fuel applications is its
large production of hydrogen chloride (HCl). Its removal has been researched a lot
and the possible methods are applying adsorbents after pyrolysis or its removal already
before pyrolysis. (Kunwar et al., 2016.)
There are still challenges in the plastic pyrolysis such as a high viscosity and a low
thermal conductivity of plastics. The reduction of viscosity is an important part of the
plastics modification to fuels in which vacuum gas oil or waste oils can provide help,
because their addition into stream decreases the viscosity. Kunwar et al. researched
the mixture of low-density polyethylene plastics and lubricant oil for the fuel produc-
tion using two different catalysts. They noticed that change of catalyst produces dif-
ferent hydrocarbons, aromatics and olefins that are viable hydrocarbons in gasoline
blending components. (Kunwar et al., 2016; Ratnasari et al., 2017.)
There are two possible ways, esterification or hydrotreating of vegetable oils (HVO)
in the production of biofuels from 1st and 2nd generation feedstocks. The name HVO
is misleading, because in general, it hydrotreats wastes and residues, not only vegeta-
ble oils. Difference between these two processes is the composition of the end-product
that in the case of esterification is fatty acid methyl ester (FAME) that contains oxygen,

31
while HVO process produces oxygen free paraffinic biofuel that Figure 11 presents.
(Neste, 2016.)
The esterification produces biodiesel, FAME, otherwise HVO produces renewable
diesel that Figure 11 illustrates. Due to oxygen in biodiesel, it is polar compound, has
lower LHV than renewable diesel and its density is higher. (Neste, 2016.)
Neste uses its developed “Next Generation Biomass To Liquid” (NEXBTL) technol-
ogy to produce its own renewable diesel product Neste MY Renewable DieselTM that
uses wastes and residues as raw materials. The technology can utilize multiple low-
quality raw materials without losing the quality of renewable diesel. The NEXBTL
applies hydrogen for removing oxygen from triglyceride vegetable oil molecules and
then hydrogen divides triglyceride into the three chains that are chemically similar as
conventional diesel fuel components. There is also included isomerization unit in the
NEXBTL technology to improve cold properties of renewable diesel like the cloud
point. (Neste, 2016.)
Because Neste MY Renewable DieselTM is paraffinic, it meets the EN 15940 standard
for paraffinic diesel that also allows the use of FAME in diesel blends, but Neste MY
Renewable DieselTM does not contain it. In addition, it meets completely the require-
ment of the European diesel fuel standard EN 590, except the density, that is below
lower limits. However, Neste MY Renewable DieselTM can be blended into fossil
diesel according to EN 590 within a range of density. (Neste, 2016.)
3rd generation: Algal based
Algae are aquatic, photosynthetic microorganisms that exist in the marine environ-
ments and in fresh water. They are promising feedstocks for 3rd generation biofuels,
because they can be cultivated in the low lagoons or ponds and therefore, they do not
compete against the food production. After the cultivation, biomass is harvested from
the lagoons and the oil extraction, transesterification, gasification or biochemical pro-
cesses upgrade it to biofuels. The production of algal biofuel is possible throughout
Figure 11. The esterification of wastes and residues produces FAME, while the hy-
drotreating produces HVO ((Neste, 2016), [Modified 17.9.2019]).

32
the year, but it is dependent of light irritation and its oil yield is in the same range than
from rich oilseed crops. (Dutta et al., 2014 ¸ Lü et al., 2011.)
4th generation: Solar biofuels-photobiological fuels and electrobiofuels
Typical 4th generation biofuels are biodiesel, bioethanol, syngas, biobutanol and bio-
hydrogen that are considered as clean and environmentally suitable fuels (Dutta et al.,
2014; Lü et al., 2011). Their feedstock is solar energy that is by photobiological or
photochemical reactions converted into biofuels using endless and cheap feedstocks:
water and CO2 as substrates. The three ways to produce 4th generation biofuels are:
● By photosynthetic micro-organisms,
● by combining photovoltaics and microbiological fuel production or
● by synthetic cell factories or organelles. (Aro, 2016.)
There is difference in the production of 4thgeneration biofuels and current biomass
feedstock biofuels, because former applies of cells that emit the product out of the cell.
It could avoid the costly fermentation that is common in the production of biomass -
based biofuels. Also, the operational costs could decrease in the production of 4th
generation biofuel compared to the conventional methods, because the amount of the
process steps decreases. (Dutta et al., 2014; Lü et al., 2011.)
4th generation fuels are promising alternatives for fossil fuels, but there are still tech-
nical risks in their production and, more knowledge is needed. Table 3 summarizes
the advantages and challenges of different generation biofuels.
Table 3. The advantages and challenges of biofuels produced from different generation feedstocks
(Dutta et al., 2014).
Generation Advantages Challenges
1st: Food and plant Simple conversion routes Competition with food production
GHG savings Low yield depends on the source
2nd: Residue and waste Util ize wastes Expensive pre-treatment of l ignocellulose
No food crop competitionNeed of advanced technology for
biomass conversion
GHG savings
3rd: Algal No food crop competition Energy consuming cultivation
Simple to cultivate Low lipid content of biomass
Can util ize waste water
4th: CO2 High yield Early stage
No need for biomass Expensive photo-bioreactor
CO2 extraction

33
4.2 The possible feedstocks to produce renewable gasoline
For substituting crude oil in the future is necessary to research the renewable feed-
stocks. There might be challenges in these feedstocks such as oxygen that has an in-
fluence on the reactions and the catalysts in the conventional upgrading units (Masum
et al., 2015). Qian et al. listed three main criteria to produce gasoline in the future:
● carbon is obtained from the atmosphere,
● the combustion of gasoline must be effective without engine modifications and
● production of gasoline is economic. (Qian et al., 2015.)
This section of the thesis presents the renewable feedstocks to the existing upgrading
units in the refineries that they could modify into gasoline blending components. Some
feedstocks are already possible to blend gasoline without upgrading.
Furans
Furans are heterocyclic organic compounds which can be produced from biomass. For
instance, methyl- and dimethylfurans have high octane-number and are possible blend-
ing components. They also reduce the acetaldehyde emissions of gasoline approxi-
mately 40% and formaldehyde 20% compared to fossil-based (Qian et al., 2015).
However, they also produce gum that is harmful for the engines. (The U.S. Depart-
ment of Energy, 2018.)
DMF has high RON and therefore, high knocking resistance, it decreases the density
and DVPE of gasoline blends but increases their viscosity. Two possible process path-
ways to produce DMF from biomass are to pre-treat biomass and split it to glucose
and fructose and then remove oxygens to form 5-hydroxymetylfurfural (HMF) that the
hydrogenolysis transforms DMF. Another possible pathway it to dehydrate biomass
to 5-chloromethylfurfural (CMF) and then hydrogenate it to DMF. (Qian et al., 2015.)
The one fourth addition of DMF to gasoline blends could increase its thermal effi-
ciency and decrease its consumption. (Liu et al., 2019.) However, NOx and particu-
late emissions might increase, because DMF has fast burning speed that causes the
high temperature during combustion. DMF has higher heating value than ethanol and
n-butanol, but lower compared to fossil gasoline. Its DVPE is significantly lower com-
pared to gasoline that may cause start-up problems during winter. (Qian et al., 2015.)
This master thesis investigates DMF as a potential feedstock for the upgrading units
to produce renewable gasoline blending components otherwise its use straight as gas-
oline blending component. Figure 12 shows the reaction method to remove oxygen
and double bonds from DMF.

34
The removal is called hydrodeoxygenation (HDO) that releases water when DMF re-
acts with four hydrogen molecules as Figure 12 presents. During the reaction also the
two double bonds are hydrogenated. The final product is n-hexane that is a possible
feedstock for instance into the isomerization unit. (Sacia et al., 2015.)
Ketones
Ketones are bio-derived molecules that have oxygen attached them by double bond.
Their possible use as a feedstock for gasoline production requires the removal of oxy-
gen that can be executed by the HDO method. It consists of three steps: reduction of
ketones to alcohols, dehydration of alcohols to alkenes and hydrogenation of alkenes
to alkanes. Figure 13 summarizes those three reaction steps to produce nonane from
5-nonanone. (Jenkins et al., 2017.)
Figure 13. The HDO of 5-nonanone consists of three reaction steps (Jenkins et al., 2017).
Jenkins et al. applied supported Ni and Pd catalysts to reduce ketone to alcohol and
aluminosilicate zeolite (HZSM-5) solid acid catalyst to dehydrate alkenes. The results
show that the conversion of reduction is over 88% and dehydration over 99%, while
Figure 12. DMF is a potential renewable feedstock in the gasoline upgrading units and, also
straight as gasoline blending component ((Sacia et al., 2015), [Modified 4.9.2019]).

35
straight HDO of 5-nonanone to nonane with combination of these catalyst has 99%
conversion. (Jenkins et al., 2017.) Alotaibi et al. investigated also the HDO of ketone,
methyl-isobutyl ketone (MIBK), with bifunctional Pt/HZSM-5 catalyst as Figure 14
shows. Their study shows that the conversion of MIBK to 2-methylpentane is over
99%. (Alotaibi et al., 2012.)
Figure 14. The production of 2-methylpentane from MIBK (Alotaibi et al., 2012).
The HDO pointed to be a viable process pathway to produce hydrocarbons from ke-
tones that could form gasoline blending components. There have been founded 2-
methylpentane in the HDO of MIBK that could be possible feedstock into isomeriza-
tion unit.
Terpenes
Terpenes are organic compounds, that plants, especially softwoods produce and, also,
they exist in the industrial waste streams (Tsolakis et al., 2019). They are components
of essential oils of plants and flowers that perfumery and traditional medicines apply.
Terpenes are hydrocarbons and therefore, do not contain oxygen that provides poten-
tial for their use as feedstocks for gasoline production. Co-optima introduced mono-
terpenes that are terpenes with two isoprene units that Figure 15 shows (The U.S. De-
partment of Energy, 2018). Limonene, myrcene and α-pinene, that Figure 16 presents,
are examples of monoterpenes that are possible feedstocks in the gasoline upgrading
units.
Figure 15. Isoprene unit is a building block of monoterpenes (ChemSpider, 2019c).

36
Figure 16. The structure of monoterpenes: α -limonene, myrcene and α -pinene (Weyrich and
Hölderich, 1997; ChemSpider, 2019a; Tracy et al., 2009).
α-limonene, left hydrocarbon in Figure 16, is a natural terpene that is a by-product
from the orange juice production and the paper industry. Figure 17 shows the reaction
pathway in which double bonds are hydrogenated from α-limonene that forms p-men-
thane (Weyrich and Hölderich, 1997).
Figure 17. Hydrogenation of 𝝰-limonene to p-menthane in the presence of noble metal catalyst
(Tracy et al., 2009).
Tracy et al. investigated the hydrogenation of α-limonene to p-menthane with two dif-
ferent noble metal catalyst, palladium supported activated carbon and platinum sup-
ported alumina pellets. The gas chromatography (GC) shown the composition of hy-
drogenated limonene to be 72.4 wt% of p-menthane and 25.3 wt% of m-cymene.
(Tracy et al., 2009.) P-menthane is a possible feedstock for instance into reformation
unit that could aromatize it.
Myrcene is polyolefinic monoterpene, in the middle of Figure 16, that appears in tree
oils. Tracy et al. investigated its hydrogenation and results show that the hydrogena-
tion produces over 84.5 wt% 2,6-dimethyloctane and under 9 wt% cyclohexane.
(Tracy et al., 2009.) 2,6-dimethyloctane could be fed into the reformation unit that
upgrades it into high octane gasoline blending component via cyclization and aroma-
tization. Moreover, Tracy et al. analysed the distillation of hydrogenated myrcene and
α-limonene and noticed their very high final boiling points, 363.7 and 359.8°C (Tracy

37
et al., 2009). The FQD limits the final boiling point on 210 °C that these monoterpenes
exceed (2009/30/EC, 2009). However, the further upgrading of them could decrease
it by shorten carbon chain length.
α-pinene is monoterpene and by-product from Kraft pulping process in the paper mills.
It is a natural product that medicine and fuel industry utilize, but its separation from
the trees is still hard and inefficient. (Yang et al., 2013.) Roberge et al. investigated
crude sulphate turpentine (CST), the most used feedstock for α-pinene to the produc-
tion of p-cymene. The concentration of α-pinene in CST varies depending on the re-
gion, tree species and the season. The distillation and desulphurization units could
remove α-pinene from CST that also exist in the most oil refineries (Erman and Kane,
2008). Roberge et al. found out three other possible products beside p-cymene that
the modification of α-pinene could produce and they are presented in Figure 18. (Rob-
erge et al., 2001.)
Figure 18. The four possible compounds from the hydrogenation and dehydrogenation of α-pi-
nene (Roberge et al., 2001).
Roberge et al. applied Pd supported on high surface area carriers -catalyst in the dehy-
drogenation reaction of α-pinene (Roberge et al., 2001). In Figure 18 are presented
results from the hydrogenation of α-pinene that produces side products 1 and 2. Those
products are possible feedstocks for the gasoline upgrading units.
In addition to monoterpene, Tracy et al. have studied production of gasoline from
triterpene, squalene, which structure Figure 19 presents (Tracy et al., 2011).
.
Figure 19. The structure of squalene, triterpene, is an optimal feedstock for the gasoline produc-
tion (Tracy et al., 2011).

38
There are six double bonds in Squalene and its carbon chain is 24 carbon long which
includes six methyl groups as Figure 19 presents. Algae, especially microalgae pro-
duce these long-chain molecules that are possible to exploit as feedstocks for gasoline
production, especially for the fluidized catalytic cracking. Also genetically modified
E. coli bacteria is possible raw material which from squalene can be extracted. (Tracy
et al., 2011.)
5 Collection of the database
The purpose of the thesis is to collect property database for gasoline blending compo-
nents that contains input data for the future gasoline blending calculator. The data is
from the daily gasoline analysis that have been measured in the laboratories in Neste
Porvoo refinery which the Neste laboratory management system (LIMS) reports. The
time interval for the gasoline analysis is two and half years, but the database has also
older analysis to ensure the data from components that are more seldom analysed. The
database is provided only for the use of Neste and the Digifuels project.
With the help of the database is explained how components blend together and pro-
vided the advices to the selection of viable renewable feedstocks for the upgrading
units to produce existing gasoline blending components. In this chapter are introduced
the collecting process of the database and the properties of gasoline that it includes.
5.1 PONA analysis
To examine the chemical structure of hydrocarbon mixtures is applied the PONA anal-
ysis that is a GC-method. The word PONA is abbreviation from paraffins, olefins,
naphthenes and aromatics, but it also offers detail chemical structure of oxygenates.
During the analysis fractions are separated and quantitated from gasoline blending
components with GC to classify them according to the hydrocarbon group, carbon
number and hydrocarbon or oxygenates name. (Shimadzu Global analytical and meas-
uring instruments, 2019.)
There are PONA analyses in the Neste LIMS that this thesis utilizes to examine the
structure of gasoline blending components. These analyses list chemical compounds
and identifies their quantities from gasoline blending components. Those analysed
hydrocarbon groups are n- and isoparaffins, paraffin-and olefin-naphthenes, olefins,
aromatics and oxygenates.

39
5.2 The defined properties of gasoline blending components
In the database is reported properties for the gasoline blending components that this
section presents below detailed.
• Density
The LIMS analysis provides densities of gasoline blending components that are re-
ported as median values in database in the unit kg/m3 from the earlier specified time
frame.
● Hydrocarbons
In the database, hydrocarbons are presented as the volumetric percent of each gasoline
components.
○ Paraffins
There are paraffins of gasoline blending components in the database that are divided
into n-and isoparaffins that are results of the LIMS analysis.
○ Olefins
The content of olefins is from the LIMS analyses for all gasoline blending components
as median values.
○ Aromatics
From the LIMS analyses are also obtained the content of aromatics for all gasoline
components as median values.
○ Naphthenes
In the LIMS is provided naphthene contents as median values for each gasoline blend-
ing components.
○ Benzene
There are reported benzene contents in the LIMS for each gasoline blending compo-
nents.
● Oxygen, oxygenates and ethanol
The database reports oxygen content in the mass percent and oxygenates and ethanol
in the volume percent that are from the LIMS as median values.
• DVPE
DVPE is reported in the database in the units of kPa and it is from the LIMS analyses
as median value.
● RON and MON
RON and MON are from the LIMS analyses, except for butane, n-and isopentane and
ethanol they are from the literature applying the octane numbers of pure compounds
(Christensen et al., 2011; Ghosh et al., 2006).
● Sensitivity
Equation 7 shows how the sensitivity is calculated for each gasoline blending compo-
nents.
𝑆𝑒𝑛𝑠𝑖𝑡𝑖𝑣𝑖𝑡𝑦 = 𝑅𝑂𝑁 − 𝑀𝑂𝑁 (7)
● AKI
According to Equation 8 is calculated AKI for each gasoline blending components.

40
𝐴𝐾𝐼 =𝑅𝑂𝑁+𝑀𝑂𝑁
2 (8)
● Sulphur
Sulphur content is in the unit mg/kg and it is a median value from the LIMS analyses.
● Distillation
There are reported the distillation curves for gasoline blending components in the da-
tabase according to EN ISO 3405 -standard from the LIMS analyses. The database
also reports the distilled fractions at 70 and 100 °C for gasoline blending components
according to the LIMS analysis.
● C-H-relation and carbon number
Based on the analyses of the LIMS are listed the carbon numbers and C-H -relation of
each gasoline blending component in the database. The carbon numbers of more com-
plicate components such as reformate and Cat gas, refer to their typical composition.
● LHV
There are presented the LHVs in the unit MJ/kg and MJ/l in the database that are cal-
culated applying PONAs from the LIMS to investigate the composition of gasoline
components. In addition, the Automotive Fuel Reference Book provides the LHVs for
individual hydrocarbon compounds. In the LHV calculations are considered hydro-
carbons that are over 0.5 wt% present in gasoline blending components. The database
reports the average value of the LHV to present the LHV of gasoline component. N-
pentane, ETBE, MTBE, TAME and ethanol have heating values from literature apply-
ing the LHVs of pure compounds (EFOA, 2006; Owen and Coley, 1995; Christensen
et al., 2011).
5.3 The evaluated upgrading units to produce renewable gas-
oline
In the thesis, four upgrading units, reforming, isomerization, hydrotreating and FCC
are researched considering their raw materials. The other units in the refinery like
MTBE and alkylation receive their feeds from these units and therefore, they are not
included in this evaluation. Thesis researches the operation principles of the units and
according that it forms the proposals for the future renewable feedstocks. The reac-
tions, reaction rates and composition of feeds of each upgrading unit are defined to
ensure the possible upgrading of renewable feedstocks in them.
6 Results and analysis
The results and analysis chapter presents hydrocarbon compounds that are present in
gasoline blending components, the collected database; analysed blending components

41
and their properties with figures, and the ideal renewable feedstocks into chosen gas-
oline upgrading units. In the end, the chapter provides the octane blending behaviour
of hydrocarbons and oxygenates.
6.1 Explanations for the RON of hydrocarbons in gasoline
blending components
Hydrocarbons have different RONs, depending on their structure such as straight chain
or cyclic, aromatic ring or double bonds. The results of PONA from LIMS analyses
show hydrocarbons that are present in gasoline blending components over 0.5 wt%.
This section presents those hydrocarbons and their RONs from literature sources
(Owen and Coley, 1995; Ghosh et al., 2006; Schobert, 2013).
Paraffins
In Figure 20 are presented the results of n-paraffins that are present over 0.5 wt% in
gasoline blending components and their RONs a function of their carbon number.
Figure 20 shows clearly that the longer chain length of n-paraffins decreases their
RON, because the amount of reactive secondary C-H bonds increases. For instance, in
Figure 20, n-butane has approximately RON 90 otherwise n-pentane has around 60.
The RON of n-octane and n-nonane are even negative. In addition to the n-paraffins,
gasoline contains also isoparaffins that are listed in Table 4. Moreover, Table 4 shows
-30
-10
10
30
50
70
90
110
3 4 5 6 7 8 9 10
RO
N
CARBON NUMBER
N-BUTANE N-PENTANE N-HEXANE
Figure 20. The relations of structure of n-paraffins to their RON (Ghosh et al., 2006; Owen and
Coley, 1995).

42
the carbon number, RONs and number of methyl groups of isoparaffins that are present
in gasoline blending components over 0.5 wt%.
Table 4. Isoparaffins of gasoline blending components (Owen and Coley, 1995; Schobert, 2013).
What stands out in Table 4 is the wide amount of isoparaffins in gasoline blend-
ing components and they differ among their C-number and number of methyl
groups. Figure 21 presents the RON a function of C-number of isoparaffins
when the number of methyl groups differs.
Isoparaffins C-number RON Methyl groups
2-methylbutane 5 99 1
2,3-dimethylbutane 6 92 2
2-methylpentane 6 73 1
3-methylpentane 6 86 1
2,2-dimethylbutane 6 92 2
2,3-dimethylpentane 7 87 2
2-methylhexane 7 44 1
2,3-dimethylpentane 7 87 2
3-methylhexane 7 56 1
2,4-dimethylpentane 7 77 2
3-Methylheptane 8 30 1
iso-octane 8 100 3
2,5-dimethylhexane 8 - 2
2,4-dimethylhexane 8 65 2
2,2,3-trimethylpentane 8 105 3
2,3,4-trimethylpentane 8 97 3
2,3,3-trimethylpentane 8 100 3
2-methylheptane 8 13 1
2,3-dimethylhexane 8 71 2
4-methylheptane 8 31 1
4-methyloctane 9 - 1
3-methyloctane 9 - 1
2-methyloctane 9 - 1
2,2,5-trimethylhexane 9 91 3

43
What is clear in Figure 21 is the declining trend of RON when the carbon number of
isoparaffins increases. There are still exceptions in this trend, because the amount of
methyl groups influences on the RON significantly. Green triangles are always top of
the blue squares when the carbon number stays same in Figure 21 which proves that
the RON increases when hydrocarbon is more branched. For instance, C8 isoparaffins
could have one methyl group, two or three and Figure 21 shows that the highest RON
belongs to compounds with the three methyl groups. Explanation for that is the in-
crease of the primary C-H bonds in their carbon backbone. Those bonds are less reac-
tive than secondary ones that isoparaffins with one or two methyl groups have. De
Bruycker et al. explained the difference between RONs of isoparaffins with BDE. The
primary C-H bonds has higher BDE that decreases their reactivity and increases their
RONs (De Bruycker et al., 2016).
In addition to the amount of methyl groups, their position in the carbon backbone af-
fects to the RON that Table 4 illustrates with blue colour between 2-methylpentane
and 3-methylpentane and with green colour between 2-methylheptane and 4-
methylheptane. If the methyl group is in the more centre of the carbon backbone, it
increases the RON. The reason for that is the shorter paraffin chain length that reduces
the reactivity of compound. Therefore, the reactivity of 3-methylpentane and 4-
methylheptane decreases and their RONs increase.
Figures 20 and 21 show the same trend when carbon number increases, but the RONs
of isoparaffins are always higher with the same carbon number than those of n-paraf-
fins. Schobert noticed this trend and explained it with the smaller surface area of iso-
paraffins (Schobert, 2013). Higher surface area of n-paraffins forms more reactive
Figure 21. More branched isoparaffins have higher RON (Owen and Coley, 1995; Schobert,
2013).
0
20
40
60
80
100
4 5 6 7 8 9
RO
N
CARBON NUMBER
Isoparaffins with one methyl group
Isoparaffins with two methyl groups
Isoparaffins with three methyl groups

44
radicals during the bimolecular initiation reactions that interact via London-forces with
oxygen. While the branching causes smaller surface area to isoparaffins that prevents
the formation of reactive radicals that decreases the probability of their autoignition.
Aromatics
Table 5 shows the results of aromatics that are present over 0.5 wt% in gasoline blend-
ing components. It also presents the C-number, RON and amount of methyl, ethyl and
propyl groups in compounds.
Table 5. The PONA results of aromatics in gasoline blending components (Owen and Coley, 1995;
Schobert, 2013).
Table 5 shows that RONs are high and their variation between different aromatics are
significant. For instance, ortho-ethyltoluene and meta-ethyltoluene have the RONs
125 and 162 as Table 5 indicates with the blue colour even though the only difference
between them is the position of methyl groups. Figure 22 shows the RON a function
of carbon number when number of methyl groups increases in aromatics.
Aromatics C-number RON Methyl groups Ethyl groups Propyl groups
BENZENE 6 99 0
TOLUENE 7 124 1
ETHYLBENZENE 8 124 0 1
META-XYLENE 8 145 2
PARA-XYLENE 8 146 2
ORTO-XYLENE 8 120 2
ISOPROPYLBENZENE 9 132 0 1
N-PROPYLBENZENE 9 127 0 1
META-ETHYLTOLUENE 9 162 1 1
PARA-ETHYLTOLUENE 9 155 1 1
1,3,5-TRIMETHYLBENZENE 9 171 3
ORTO-ETHYLTOLUENE 9 125 1 1
1,2,4-TRIMETHYLBENZENE 9 148 3
1,2,3-TRIMETHYLBENZENE 9 118 3
1-METHYL-3-PROPYLBENZENE 10 1 1
C4-BENZENE 10 114
1,2,4,5-TETRAMETHYLBENZENE 10 4
1,2,3,5-TETRAMETHYLBENZENE 10 154 4

45
What stands out from Figure 22 is the linear increase of RON from aromate with one
methyl group to aromate with three methyl groups. The highest and lowest RONs
belong to aromatics with three methyl groups. Table 5 shows with green colour that
1,3,5-trimethylbenzene and 1,2,4-trimethylbenzene have RONs of 171 and 148, while
1,2,3-trimethylbenzene has only 118. The positions of methyl groups in aromatic ring
could explain the low RON value, 118. 1,2,3-trimethylbenzene has methyl groups in
the adjacent carbons, while the methyl groups of other two aromatic compounds are
further each other. Boot et al. researched the effect of the methyl groups on the RON
of aromatics and noticed that they boost it, because they form resonance stable radicals
during bond scission (Boot et al., 2017). Those stable radicals are not reactive that
reduces their autoignition reactions with oxygen. There is not a lot research available
about the position of the methyl, ethyl and propyl groups in aromatic ring that would
be interesting to research more to find out its influence on the RON of gasoline. Al-
ready Figure 22 proves that the positions need to be considered to evaluate the RON
of aromatics.
The longer side group such as ethyl or propyl groups decreases the RON compared to
the same carbon number aromatics that Table 5 shows with red colour. Those longer
groups increase the number of the secondary C-H -bonds that increase the reactivity
of compound. There are still exceptions in this trend such as aromatic that has methyl
group and in addition to that ethyl group that the Table 5 shows with yellow colour.
Figure 23 presents the RON in a function of carbon number when the length of the
side group increases.
Figure 22. The side groups increase the RON of aromatics (Owen and Coley, 1995; Schobert,
2013).

46
In Figure 23, the highest RONs belongs to aromatics with ethyl and methyl group,
because the methyl group increases the amount of primary C-H -bonds that increases
its RON. There can be seen the same trend in Figure 23 that the thesis noticed before
in the case of 1,2,3-trimethylbenzene in Figure 22. One aromatic with ethyl group and
methyl group has the lowest RON of C9 aromatics that is explained by the position of
the side groups. Table 5 indicates with blue colour compound to be ortho-ethyltoluene
that has methyl and ethyl groups in the adjacent carbons and therefore, it has lower
RON compared to para-ethyltoluene or meta-ethyltoluene.
Naphthenes
Naphthenes are cyclic hydrocarbons, with or without double bonds, that are favoured
feedstock compounds into the gasoline upgrading units. They have high RONs that
Table 6 presents, but they are more reactive than aromatics, because the absence of
delocalized electrons. In Table 6 are presented the results of naphthenes that exist in
gasoline components over 0.5 wt%.
100
110
120
130
140
150
160
170
6 7 8 9 10 11
RO
N
CARBON NUMBER
Aromatic with ethyl group
Aromatics with propyl group
Aromatic with ethyl group and methyl group
Figure 23. The longer side groups decrease the RON compared to methyl groups (Owen and
Coley, 1995; Schobert, 2013).

47
Table 6. Naphthenes of gasoline blending components (Schobert, 2013).
What stands out from Table 6 is the highest RON of simple cycloalkanes, cyclopentane
with the blue colour, otherwise methylcyclopentane with the green colour has dis-
tinctly lower RON. Table 6 indicates the same in the case of cyclohexane with the
yellow colour and methylcyclohexane with the grey colour, even though the difference
is not as high in that case. The difference between RONs of cyclopentane and methyl-
cyclopentane depends on the amount of secondary C-H -bonds. Methylcyclopentane
has four secondary carbons and one tertiary carbon that increases its reactivity. While
cyclopentane has five secondary carbons but does not contain any tertiary ones. What
is also relevant this Table 6 is the slight difference between RONs of cyclohexane and
methylcyclopentane. The eight secondary C-H bonds in methylcyclopentane explains
its lower reactivity compared to cyclohexane that has 12 of those bonds.
There is also naphthene that has two methyl groups with the red colour in Table 6, cis-
1,3-dimethylcyclohexane and it has the lowest RON among naphthenes. The expla-
nation for that is the highest number of tertiary C-H bonds that increases its reactivity.
Olefins
Olefins are the fourth hydrocarbon group in gasoline that have an influence on the
RON. Table 7 shows the results of olefins that are present over 0.5 wt% in gasoline
blending components and lists their RONs, carbon numbers and indicates the carbon
that has the methyl group.
Naphthenes C-number RON
cyclopentane 5 101
cyclohexane 6 83
methylcyclopentane 6 91
cis-1,3-dimethylcyclopentane 7 -
trans-1,3-dimethylcyclopentane 7 -
methylcyclohexane 7 75
ethylcyclopentane 7 -
cis-1,3-dimethylcyclohexane 8 67
C3-cyclohexane 9 -

48
Figure 24 indicates the differences of the RONs between olefins that have double bond
or methyl group in the different positions of carbon backbone.
0
50
100
150
200
4 5 6 7 8
RO
N
Carbon Number
Meth. G. in 2nd. C. with Doub. B. in 1st. C.
Meth. G. in 3rd C. with Doub. B. in 1st. C.
Meth. G. in 2nd. C. with Doub. B. in 2nd. C.
Meth. G. in 3rd. C. with Doub. B. in 2nd. C.
Table 7. The RONs of olefins that exist in gasoline over 0.5 wt% (Owen and Coley, 1995).
Figure 24. The position of double bond in olefin influence on its reactivity and in addition to
that, the position of methyl group affects to their RON, too (Owen and Coley, 1995).
Olefins C-number RON
Place of the methyl group
in the carbon backbone
3-methyl-1-butene 5 129 3
2-methyl-1-butene 5 146 2
trans-2-pentene 5 150
Cis-2-pentene 5 154
2-methyl-2-butene 5 176 2
trans-4-methyl-2-pentene 6 130 4
2-methyl-1-pentene 6 126 2
Cis-3-hexene 6
trans-3-hexene 6 137
trans-2-hexene 6 134
2-methyl-2-pentene 6 159 2
cis-2-hexene 6 -
trans-3-methyl-2-pentene 6 130 3
C7 olefin 7 -
2-methyl-2-hexene 7 129 2
C8 olefin 8 -

49
There can be noticed the obvious trend of olefins with methyl group and double bond
in the second carbon in Figure 24. It presents the linear decrease of RON when the
carbon number increases of these compounds that table 7 present with the blue colour.
There can be noticed also difference of RONs in Figure 24 when the position of double
bond changes in olefins. For instance, olefins with red colour in Figure 24 have double
bond in the first carbon that increases their reactivity and decreases their RON com-
pared to olefins with blue colour in Figure 24 that have the same carbon number, but
their double bond is in the second carbon. Bounaceur et al. noticed this same trend
and explained the effect of position of double bond to the RON by BDE (Bounaceur
et al., 2009). The BDE of tertiary C-H bonds is the lowest and the bond breaks easy,
while secondary and primary C-H bonds have higher BDEs. Table 7 shows the RON
of trans-3-hexene with the yellow colour to be 137 otherwise trans-2-hexene with the
orange colour has RON 134. They both have four secondary C-H -bonds, but trans-3-
hexene has a shorter paraffinic carbon backbone that explains its lower reactivity. In
Table 7 is shown also the difference of RONs between 2-methyl-2-butene with the
blue colour and 2-methyl-1-butene with the green colour, 176 and 146. The latter has
significantly lower RON, because it has only six primary C-H bonds compared to nine
of 2-methyl-2-butene.
What is also interesting in Figure 24 is the difference of RONs between three com-
pounds with the carbon number five. These compounds have different amount of the
primary bonds that influence on their reactivity. There are compounds with green and
red colour in Figure 24 that have lower RON than compound with blue colour, because
they contain only six primary C-H -bonds. While compound with blue colour has nine
C-H -bonds. What needs to be still explained is the difference of RON between the
red and green compounds in Figure 24. It depends on the amount of the tertiary bonds
that green compound has more and therefore, its RON is also lower.
The above-mentioned hydrocarbons are results of the PONA analysis of gasoline
blending components and the RONs are literature values. The reliability of the analy-
sis is high, because the PONA analysis is an accurate method to analyze the composi-
tion of gasoline blending components. However, the time interval of the analysis is
15 years as longest and therefore, the changes in the compositions of components are
possible. Nevertheless, the operating principles of the upgrading units are continu-
ously similar that does not cause significant variations for the composition of blending
components.
Three different sources provide the RON values that also increases inaccuracy, be-
cause the methods to calculate them might differ. However, their order of magnitude
is more important than the exact values, because the target of the thesis is to present
differences between RONs of hydrocarbon groups to prove their influence on RON of
gasoline.

50
6.2 The properties of gasoline blending components
The property database for gasoline blending components is built on based on the prop-
erties that are used in the blending design and, also properties, which are expected to
be useful in the future. Moreover, the FQD has limits for most of those values that
gasoline production needs to follow. Table 8 presents those properties and Table 9
lists gasoline blending components.
Table 8. The properties of gasoline blending components to optimize blending.
Table 9. Gasoline blending components.
Aromatics and paraffins are the main hydrocarbon groups in gasoline blending com-
ponents and olefins and naphthenes are the minority groups according to the database.
Olefins are hydrogenated from light gasoline fractions before more upgrading and
therefore, their share is low. In the database are classified paraffins into n-and isopar-
affins that provides more accurate explanations to the octane numbers of blending
components.
What is important to notice from the database is the oxygenate content of blending
components that is almost zero, while for ether blending components and ethanol it is
high. Ethanol is usually denatured by ethers for instance, and therefore, it is not pure.
Density RON and MON Sulphur LHV
Hydrocarbon contents: n-and
isoparaffins, olefins,
aromatics, naphthenes,
benzene
Oxygen,
oxygenates and
ethanol
Distillation curve and
evaporated volumes at 70
and 100 °C
Sensitivity
AKI DVPEC/H relation and Carbon
number
The amount of
analysis per
component
Properties
Isopentane TAME
n-pentane Ethanol
Butane Cat gas
Alkylate Reformate
Isomerate ETBE
Light gasoline component MTBE
Gasoline blending components

51
Oxygenates are important blending components for gasoline production due to their
high RON, but oxygen in their structure decreases the energy density of gasoline.
The hydrocarbon structure is the key property for the gasoline production, because it
forecasts other properties of gasoline such as RON and DVPE. Heavier blending com-
ponents have lower DVPE than lighter ones that needs to consider in the gasoline
blending during the different seasons. Figure 25 shows how much the density could
vary between different gasoline blending components.
Figure 25. There are variations among densities in the gasoline blending components (LIMS,
Neste).
There are variations in the DVPE between light and heavy components, for instance
butane is the lightest component like Figure 25 shows, and it has the highest DVPE.
While reformate is the heaviest component that indicates its low DVPE. Moreover,
the EN 228 limits the density of gasoline, from 720 to 775 kg/m3 and assets limitations
for blending of the heaviest components together.
The most aromatic components have the highest RONs of non-oxygenate blending
components compared to mainly n-paraffinic components. MTBE, ETBE and ethanol
have been noticed to have even higher RONs. The MONs of blending components are
lower than RONs for almost every component, except n-paraffinic components.
Longer chain length of n-paraffins increases the MON and decreases the RON. Their
difference is called sensitivity, and the database reports that value. Higher sensitivity
500550600650700750800850900
Den
sity
, [kg
/m3]

52
is considered valuable property in the downsized boosted SI-engines in the future, be-
cause it could improve the ignition properties of gasoline. Figure 26 presents the var-
iations of sensitivity of gasoline blending components.
Figure 26. The sensitivity describes the difference between RON and MON (LIMS, Neste).
In Figure 26 is shown that oxygenates have the highest sensitivity otherwise n-and
isoparaffinic components have the lowest. N-paraffinic components have even
slightly negative referring to higher MON than RON. Generally, can be concluded
that aromatic and oxygenate components have high sensitivity that rises their interest
as gasoline blending components, while the sensitivity of paraffins is almost zero or
even negative in the case of long n-paraffins.
In addition to sensitivity, LHV is an important value to evaluate the possible future
feedstocks for gasoline production, because it describes how much energy gasoline
releases during combustion. Therefore, high LHV is favoured to minimize the fuel
consumption and emissions. Also, in the case of higher ethanol contents of gasoline
blends the heating value need to be consider, because LHV of ethanol is significantly
lower than gasoline. Figure 27 shows the heating values of gasoline blending compo-
nents in the units of megajoules per litre.
-1,01,03,05,07,09,0
11,013,015,017,019,0
Sen
siti
vity

53
Figure 27. The high LHV is desired property in gasoline (LIMS, Neste).
Usually, the heat release from gasoline is wanted to know per litre, because gasoline
is also purchased by the customers in the same unit in the fuel stations. Heaviest gas-
oline components have the highest volumetric LHVs, otherwise ethanol has the lowest,
because of oxygen in its structure that contains no energy. Moreover, the carbon chain
of ethanol is short that causes the high oxygen-to-carbon ratio. Paraffins and light
gasoline component have also low volumetric LHVs and the latter even lower than
ethers. Figure 28 shows the mass based LHVs of gasoline components.
05
10152025303540
LHV,
[M
J/l]
05
101520253035404550
LHV
, [M
J/kg
]
Figure 28. The LHV in the units of MJ/kg (LIMS, Neste).

54
What is obvious in Figures 27 and 28 is that the density of components explains the
differences between the released heat during combustion; higher density components
release more energy with equal volume than lighter ones and therefore, heavier com-
ponents can be applied less to fill the needed energy output.
An interesting property to consider for gasoline is the C/H-relation, because it has an
influence on gasoline consumption due to higher energy content of hydrogen com-
pared to carbon. This thesis found earlier that the 2% decrease of carbon content will
decrease the CO2 emissions 5%. Therefore, gasoline components with lower C/H-
relation bring more energy into gasoline.
The comparison of C/H-relations of blending components shows that oxygenates has
lower compared to hydrocarbons. Moreover, paraffins have low relations, because
their short carbon backbones and single bonds. These results promote the use of these
components in gasoline blending to decrease fuel consumption and CO2 emissions.
In the database are reported also the distillation curves of each blending component,
except butane which distillation data was not available. Figure 29 presents the distil-
lation curves for the blending components.
20
45
70
95
120
145
170
195
0 5 10 20 30 40 50 60 70 80 90 95 100
Tem
per
atu
re, [
°C]
vol%Alkylate Light gasoline component
Cat gas Isomerate
isopentane n-pentane
Reformate Ethanol
ETBE MTBE
Figure 29. The distillation end point of gasoline is 210 ��C according the FQD which all gas-
oline components need to also fulfill (LIMS, Neste).

55
Figure 29 shows that lighter blending components, isomerate, light gasoline compo-
nent, paraffins and oxygenates have the lowest boiling points. While the highest boil-
ing points belong to alkylate, Cat gas and reformate. Compared the distillation curves
in Figure 29 to the DVPEs of blending components is noticed their relation. Gasoline
components that have high DVPE have also their final point of distillation at lower
temperatures. While gasoline components that have low DVPE reach their final point
of distillation at higher temperatures. Almost pure blending components, n-and iso-
pentane, distillates within 10 °C and that same distillation behaviour has ethanol as
noticed from Figure 29.
There are also sulphur contents of gasoline blending components in the database, be-
cause the FQD limits it to 10 mg/kg. Sulphur is known as the catalyst poison and
therefore, the feed into the upgrading units such as into reforming and FCC, is hy-
drotreated before them. The hydro-desulphurization units remove sulphur from blend-
ing components.
6.3 The possible future feeds to the gasoline upgrading units
This section presents the ideal feed for the FCC, isomerization, reforming and hy-
drotreating units and proposes the possible renewable feed them in the future. In the
literature part of this thesis is researched the renewable feedstocks, and this section
presents their upgrading methods in the four units. Table 10 concludes the feed, reac-
tions, reaction rates and the hydrocarbon structure of produced gasoline blending com-
ponents from these four units.
unit feed reactions reaction rates main products
FCC C20-C25
paraffins, long
olefins, cyclo
naphthenes
(C10)
cracking,
isomerization,
hydrogen
transfer
- olefins (C5-C8), isoparaffins (C5-C9),
aromatics (C6-C10), p-naphthenes (C6-
C9), o-naphthenes (C6-C9)
Hydrotreating C5-C12 paraffins,
alkenes and
cycloalkenes
hydrogenation
of alkenes and
cycloalkenes
hydrogenation
>hydrocracking
C7-C11 naphthenes, hexane, n-and
isopentane and C3/C4-fractions
Reforming heavy naphtha
range
hydrocarbons:
C6-C11
naphthenes and
paraffins
aromatization,
isomerization,
cyclization,
dealkylation,
hydrocracking
aromatization>isom
erization>cyclization
3/4 aromatics (C7-C9) and 1/4
isoparaffins (C7-C8)
Isomerization
n-pentane and n-
hexane
isomerization isomerization>hydro
genation and
decyclization
isopentane, 2-methylpentane, 3-
methylpentane, 2,2-dimethylbutane
and 2,3-dimethylbutane
Table 10. The presentation of the four gasoline upgrading units according their feed, reactions,
reaction rates and the hydrocarbon structure of produced gasoline blending components.

56
In Table 10, the feed column is the most important for estimation the renewable feed-
stocks for the future. Moreover, the reactions that occur in the units and their reaction
rates are valuable information for that. What is clear in Table 10 is the variation of
feed properties that provides the possibility to use versatile hydrocarbon sources.
However, it is also challenging, because the same feed cannot utilize for all units. Ta-
ble 10 shows that hydrotreating unit handles C5-C12 paraffins, alkenes and cycloal-
kenes that are suitable after treating to the reforming and the isomerization units.
Therefore, one renewable feedstock for the hydrotreating unit could increase produc-
tion of renewable gasoline also in other units.
Hydrotreating
There are several hydrotreating units in the refineries and they pre-treat the feeds into
next upgrading units by removing sulphur with hydrogen. Simultaneously, it hydro-
genates alkenes and cycloalkenes to paraffins and naphthenes. The unit produces pen-
tanes and hexanes for the isomerization, heavy gasoline component for the reforming
and liquefied gases.
In the ideal feed into hydrotreating unit consists of low aromatic, C5-C12 short carbon
chain paraffins, alkenes or cycloalkenes that it hydrogenates. At higher temperature,
hydrocracking could also occur. The products of the unit consist of straight chain and
cyclic C7-C11 hydrocarbons, n-and iso-pentanes and liquefied gas fractions. Table 11
summarizes the feed with red colour, reactions and with the yellow colour products in
the hydrotreating unit.
Table 11. The feed, reactions and products of the hydrotreating unit.
What is noticed in Table 11 are the two reaction pathways for producing different
hydrocarbon structures. From these two, the hydrogenation of alkenes and cycloal-
kenes is the main reaction pathway in the unit besides sulphur removal reactions. Hy-
drocracking reactions are not prominent and desired, because they decrease the activity
of catalyst and partial pressure of hydrogen. However, during hydrogenation of high
olefinic compounds, is extremely important to control the outlet temperature of hy-
drotreating reactor and the need of preheating of feed to avoid too high temperatures.
It could be also possible to hydrotreat oxygen containing components in these units
Reactions C7-C11 to reformingHexane to
isomerizationn- and iso-pentane C3/C4-fractions
Hydrogenation of alkenes
and cycloalkenesC5-C12 C5-C12 C5
The fraction is
removed by
butane removal
Hydrocracking C5-C12 C5-C12 C5-C12 -

57
such as ketones and furans with the catalyst modification in the future and thus, widen
the raw material options. Because the hydrotreating is a pre-treatment unit of the three
other units, its alternative feeds are presented in the next sections.
Fluidized catalytic Cracking
Cat gas consists mainly the three hydrocarbon groups: olefins, aromatics and isopar-
affins that shares vary in the gasoline component depending on the refineries. The
versatile composition of Cat gas proves the complexity of FCC unit and, also it is a
challenge to find ideal feed for it. The various hydrocarbon groups in Cat gas improve
its blending with other blending components but can also be a disadvantage due to
different chemistry of the hydrocarbon groups.
There are long chain hydrocarbons in ideal feed for the FCC unit that cracking, isom-
erization and hydrogen transfer upgrade to iso-olefin, aromatic and iso-paraffinic rich
blending component. Optimal hydrocarbons for these reactions are paraffins and ole-
fins. Aromatics and especially, polyaromatics, are problematic feedstocks because
they form coke that decreases the activity of catalyst and increases its regeneration
need. Table 12 concludes the ideal feed with red colour, reactions and with yellow
colour desired hydrocarbons in the FCC unit.
Table 12. The ideal reactions in the FCC unit and the ideal feed for these reactions to produce
Cat gas gasoline blending component.
Table 12 shows the different reaction pathways to produce many hydrocarbon struc-
tures only changing the feedstock such as cracking produces olefins, isoparaffins and
aromatics. However, all reactions cannot produce aromatics and olefins and therefore,
the reaction conditions or feedstock need to define the way that the production is opti-
mized.
The possible renewable feedstocks for the cracking reactions are squalene and α-limo-
nene. α -limonene is cracked into aromatics and paraffins, while squalene is cracked
into shorter olefins. Other option is to first hydrogenate squalene to remove double
Reactions olefins aromatics isoparaffins
Cracking Long olefins
Aromatics with long
alkyl chain
(ArC10H2)
Aromatics with long
alkyl chain (ArC10H2),
long paraffins, cyclic
naphthenes
Isomerization
Olefin bond shift
in olefin structure,
n-olefins
- n-paraffins
Hydrogen transfer -Long olefins, Long
olefin + naphthene
Long olefins, Long olefin
+ naphthene

58
bonds in the hydrotreating unit from heavy gas oil fractions. The hydrotreating of squa-
lene could produce long isoparaffins that are possible feed into FCC unit where they
are cracked shorter chains.
Other reaction type in the FCC unit is hydrogen transfer that produces aromatics and
paraffins as well. α -limonene and α -pinene are possible for this reaction with the pre-
treatment. The first step is their hydrogenation to produce C10 naphthenes that then
react in the FCC unit with squalene via hydrogen transfer reaction to produce aromat-
ics and paraffins. However, those paraffins from hydrogen transfer reactions might be
too long for Cat gas component that requires their cracking to C5-C9 paraffins.
Reforming
There are roughly 85% of aromatics and 15% of isoparaffins in the hydrocarbon com-
position of reformate. The carbon number of aromatics is from C7 to C9 and of iso-
paraffins C7. Those hydrocarbons together increase the RON of reformate and increase
its value as gasoline blending component.
The ideal feedstocks into the reforming unit are from C7 to C11 n- and isoparaffins
and naphthenes. In the hydrotreating unit, the double bonds of feedstocks are hydro-
genated that produces heavy gasoline component. This gasoline components are ap-
plied straight as a blending component or dehydrogenated in the reforming unit to in-
crease its RON. Table 13 presents the ideal reactions in the reforming unit, its optimal
hydrocarbon structure of feed with red colour and desired products with yellow colour.
Table 13. The reactions and the reactants to produce the reformate blending component.
From Table 13 can be concluded that the aromatization, isomerization, dehydrocy-
clization and dealkylation are the main reactions in the reforming unit. The reforming
unit dehydrogenates naphthenes into aromatics and isomerizes n-paraffins to isoparaf-
fins or dehydrocyclizes them to aromatics. Aromatics can also be feedstocks, if they
have long side chains or multiple side chains. Those aromatics are dealkylated into
aromatic ring and paraffins. The aromatization occurs most likely in the reforming
reaction conditions, while cyclization and isomerization are next reactions before hy-
drocracking. Table 14 shows the reactions rates of the reforming reactions.
Reactions Aromatics Paraffins
dehydrogenation/aromatizationnaphthenes with
side chains -
isomerization - n-paraffins
dehydrocyclization paraffins -
dealkylationAromatic compounds with alkyl side
chains

59
Table 14. The reaction rates in the reforming unit.
What stands out in Table 14 is the ten times higher probability of the aromatization
than the isomerization and even 100 times higher than the hydrocracking in reforming
conditions. The advantage of these reaction rates is the high yield of aromatics and
less hydrocracked hydrocarbons that are not desired because they increase hydrogen
consumption and decrease the activity of catalyst.
There are α -limonene and α -pinene, the possible renewable feeds to produce aromat-
ics in the reforming unit. First the hydrotreating unit hydrogenates α -limonene to
cyclohexane with one methyl group and isopropyl group and α -pinene to cyclohexane
with four methyl groups. Roberge et al. and Tracy et al. studied the hydrogenation of
these monoterpenes and they managed to remove double bonds and obtained naph-
thenes that are possible to further upgrade into gasoline blending components (Rob-
erge et al., 2001; Tracy et al., 2009).
The hydrotreating of high concentration olefinic compounds is a challenge for the op-
eration of the unit, because the temperature could increase significantly in the reactor.
However, with a proper control of preheating and outlet temperature of reactor is pro-
duced desired naphthenes that the reforming unit aromatizes to produce C4-aromatics.
The further reaction is still possible after aromatization, the dealkylation that removes
alkyl side chains from aromatics.
Other method to produce aromatics is dehydrocyclization of paraffins that follows
their aromatization. For this reaction the possible renewable feedstock is monoter-
pene, myrcene that loses its double bonds during hydrogenation and then the reforming
unit cyclizes and aromatizes it. However, the reaction rates reveal the isomerization
reaction to be more rapid than cyclization. Therefore, myrcene is most likely to be
isomerized first in the reforming unit that produces desired isoparaffins. Moreover,
the hydrocracking is a possible reaction, but it is undesired due to its high hydrogen
consumption. That reaction has the lowest reaction rate and therefore, it is not proba-
ble reaction to occur before isomerization of myrcene.
Isomerization
Isomerate blending component is mainly isoparaffinic with low amounts of n-paraffins
and naphthenes. Main isoparaffins are isopentane and different isomers of isohexane,
while its aromatic and olefin contents are practically zero. In the isomerization unit,
Reaction Reaction rate
Aromatization 100
Isomerization 10
Cyclization and hydrocracking 1

60
the main reaction is isomerization, while hydrogenation and decyclization are the side
reactions. Table 15 presents those reactions and with the red colour hydrocarbon
groups that form iso-pentanes and iso-hexanes that yellow colour indicates.
Table 15. The isomerization of n-paraffins produces high octane isoparaffins.
The hydrogenation of benzene is a possible reaction as Table 15 shows, but it is exo-
thermic and therefore, it increases temperature that causes challenges for temperature
controlling during isomerization reactions. While the other side reaction, decycliza-
tion of naphthenes, decreases the activity of catalyst and thus, reduces reaction rate of
isomerization. Therefore, the best feeds for the isomerization unit are n-pentane and
n-hexane to avoid those side reactions.
DMF could be a potential feedstock for renewable gasoline production that isomeriza-
tion unit upgrades. The feed into isomerization unit comes from the hydrotreating unit
that purifies it from sulphur and saturates double bonds. Moreover, DMF contains ox-
ygen that HDO removes releasing simultaneously water unlike the conventional hy-
drotreating. Sacia et al. studied the HDO of DMF and managed to produce n-hexane
applying four hydrogen molecules during reaction (Sacia et al., 2015). The release of
water is a problem with the existing catalysts in the hydrotreating, but their modifica-
tion to treat water could allow the utilization of DMF.
In the isomerization unit n-hexane is isomerized rapidly into 3- or 2-methylpentane,
while the reverse reaction back to n-hexane is not likely due to higher reaction rate
from n-hexanes to isohexanes. The isomerization reactions proceed further to form
2,3-dimethylbutane, but the lower reaction rate retards their formation. Therefore, the
production of 3-and 2-methylpentane is more probable in the isomerization conditions.
In addition to DMF, 2,5-dimethyltetrahydrofuran could be a possible feedstock into
isomerization unit. Its chemical structure is similar than DMF except the absence of
double bonds that decreases the hydrogen consumption during the hydrotreating. The
isomerization of 2,5-dimethyltetrahydrofuran follows the same reaction rates than
DMF has.
In addition to furans, ketones are possible renewable feedstocks into isomerization
unit, especially MIBK, is an option. It is six-carbon ketone and a renewable feedstock.
As furans, also MIBK runs through the hydrotreating unit that removes oxygen and
produces 2-methylpentane. This compound is an ideal feedstock for the isomerization,
because its further isomerization reactions produce more branched isoparaffins, 2,3-
Reactions Isopentane Isohexane
Isomerization n-pentane n-hexane
Hydrogenation - Benzene
Decyclization Naphthenes

61
dimethylbutane, if the temperature stays low. Moreover, its de-isomerization to n-
hexane is improbable.
This section proposed the renewable feedstocks in the existing gasoline upgrading
units attempting to produce renewable gasoline in the future. The problems of the
feedstocks concern their too long carbon chain, several double bonds and the presence
of oxygen in them. The development of catalysts and optimizing the right process
conditions like temperature could solve these problems. However, these feedstock
proposals need still more investigation about their availability and viability in the gas-
oline production.
6.4 Blend proposals
In the results of database is proved gasoline blending components to consist over ten
blending components that have hundreds of different hydrocarbons. The octane blend-
ing of these components together can be linear or non-linear. This section shows,
which hydrocarbon groups and other organic compounds blend together linearly and
which synergistic or antagonistic. Table 16 concludes the octane blending behaviour
of hydrocarbons and other organic compounds. It indicates with green colour the
linearity, with the red and yellow antagonism and synergism and with the blue colour
is indicated the need for more research.

62
Table 16. The summary of octane blending behavior of hydrocarbons and other organic com-
pounds (Ghosh et al., 2006; Boot et al., 2017; Farrell et al., 2019).
Pa-raffins
Ole-fins
Aro-matics
Napht-henes
Et-hanol
Fu-rans
Cyclic ke-tones
Es-ters
Paraffins 2 2 2
Olefins 2 2 2
Aromatics 1 2 2 2
Naphthenes 2 2 2
Ethanol 1
Furans 2 2 2 2 Cyclic keto-nes 2 2 2 2
Esters 2 2 2 2
1 Blending would be more linear when the amount of methyl groups increases in the aromatic ring
Linear 2 With all hydrocarbons, not specified group
Synergy
Antagonism
More re-search
There is not a lot of green colour in Table 16 that indicates that the octane blending of
hydrocarbon groups is mainly non-linear. Paraffins blend linearly with paraffins and,
also olefins with olefins that can be explained by their similar functionalities. What is
interesting in Table 16 is the linear blending of naphthenes with olefins even though
their chemical structure, double bonds versus cyclicity, differs from each other signif-
icantly. The one possible explanation for that is the possibility of naphthenes to be
also olefinic that is seldom separated in the studies. However, the share of those hy-
drocarbons is low in gasoline, but according to their high RONs and linear blending
they could be desired structures in the future.
The non-linear octane blending is still unclear among most of hydrocarbons and, there-
fore, the research is necessary to obtain the clear trends how hydrocarbons interact
with each other in gasoline blends. There have been already found some interactions
in Table 16 such as aromatics blend with olefins and paraffins antagonistic, but their
blending with ethanol is more complicate, because the methyl groups in aromatic ring
could reduce their antagonistic blending and turn it towards linear blending. However,

63
the universal trend of blending ethanol with aromatics is hard to draw, and more re-
search is needed to measure how large the reduction of antagonism would be. Gasoline
can contain only 35 vol% of aromatics and 10 vol% ethanol that demands 55 vol% for
other hydrocarbons. They could have an influence on the RON of gasoline that needs
to be investigated, because normally aromatics have been noticed to show synergistic
blending with ethanol. This synergy could be the solution to compose high RON
blends of aromatics and ethanol.
What is also interesting in Table 16 is the blending of aromatic compounds together,
because those blends could have higher or lower RON than linear blending indicates.
Table 16 shows also that the octane blending of naphthenes together cannot be pre-
dicted precisely. Their cyclic structure and different amount of side groups in their
structure might be the reasons for that.
In Table 16, oxygenates, ethanol, furans and cyclic ketones, blend non-linearly with
hydrocarbons, but mainly synergistically. There is predicted ethanol to blend with
paraffins and olefins synergistic and with aromatics antagonistic in Table 16, while its
blending with other compounds is still under the research. There is also one oxygenate
group, esters, that blends antagonistic with hydrocarbons in Table 16. However, the
specific hydrocarbons are not defined that needs more investigation to enable the broad
utilization of renewable feedstocks.
As the summary of Table 16 can be concluded that the octane blending of olefins and
paraffins with other compounds is the most known. There can be seen in Table 16 that
the octane blending of oxygenates needs the most research, but it is understandable,
because their use in the gasoline blending is new. In addition to the octane blending,
other properties need to consider when gasoline blend are formed. For instance, par-
affinic blending components are very light as noticed in the section 6.2, that might be
a problem in the blending, because the lower limit for density according to the EN 228
is 720 kg/m3. Figure 25 shows for instance the density of n- and isopentane to be
approximately 640 kg/m3.
Ethanol has also a significant effect on the DVPE of gasoline blend already with its
small concentrations. Ethanol could increase it rapidly with 5 vol% additions, but with
the higher volumes DVPE starts to decrease slowly as the thesis has concluded earlier.
This turns the ethanol blending even more challenging and limits it with high vapour
pressure components like n- and isoparaffins. While aromatics have lower DVPE and
their blending with ethanol is more moderate, because aromatics and ethanol form
azeotrope mixture. That kind of blending behaviour promotes the aromatics utilization
as blending component besides their high RON.
7 Conclusions and proposals for the future study
Gasoline consists of hydrocarbons that can be divided to n-paraffins, isoparaffins, ole-
fins, naphthenes and aromatics. Moreover, ethanol and ethers are added to gasoline to

64
increase its properties such as RON. High RON is an important property to avoid
knocking in the engines, because otherwise it could damage engine parts. Some hy-
drocarbons have a significant role to mitigate that phenomenon and gasoline blending
components that contains these are viable in the gasoline blending.
Highly branched hydrocarbon backbone, the length of the backbone, bonds between
carbons, OH-groups and the positions of double bonds and methyl groups in the carbon
backbone have been noticed to influence on the reactivity of hydrocarbons. Especially,
the thesis noticed the position of methyl groups in aromatics to have an influence on
their RON. For instance, RON of ortho-xylene is significantly lower than RON of
para- and meta-xylenes, because their methyl groups are not in the adjacent carbons as
ortho-xylene has. These compounds with higher RON have low reactivity that reduces
their autoignition reactions and the knocking. Therefore, the knowledge of structure
of hydrocarbons could help to optimize the RON of gasoline blend. There are also
other high RON compounds in gasoline like oxygenates, olefins and isoparaffins.
Thus, the main strategies to increase RON of gasoline are to crack long paraffins to
shorter ones, add chain branching into hydrocarbon backbone and aromatic ring and
to dehydrogenate naphthenes to aromatics.
There are different strategies in the blending of gasoline such as available raw materi-
als, operability of refinery, economy targets and directives. These strategies create the
guidelines for the composition and properties of gasoline that blending implements.
The FQD requires the RON to be 95 at least and therefore, refineries need to blend
gasoline components that have high enough RONs. However, this property is not easy
to adjust, because it differs depending on blended gasoline components. They behave
together differently in gasoline depending on their hydrocarbon structure that could
shift the octane blending from linear to non-linear.
The non-linear blending can be synergistic, the RON of gasoline is higher than linearly
assumed, or antagonistic, it is lower. There have been noticed that aromatics blend
antagonistic with paraffins and olefins in this thesis but blending of aromatic com-
pounds together is more complicate. While ethanol blends synergistic with paraffins
and olefins, but its blending with aromatics is noticed to be antagonistic. Normally,
there have been detected synergy between ethanol and aromatics in gasoline blends
that could be explained by the methyl groups in aromatic ring. They could reduce the
antagonistic blending and turn it more linear or even synergistic. However, deeper
understanding of the chemistry behind the non-linear octane blending is necessary to
optimize the required RON of gasoline and for that the future research should focus
on.
There are guided also the other properties of gasoline such as the density and the DVPE
in the FQD and EN 228. The thesis noticed differences between densities of gasoline
blending components that need to be considered in the blending to produce gasoline
that density is between 720 kg/m3 and 775 kg/m3. The DVPE is also an important
property, because it defines the volatilization of gasoline components. Higher DVPE
increase the volatilization of gasoline and facilitates its ignition. Moreover, the LHV

65
become more important when the utilization of new renewable feedstocks begins in
the future. The LHVs are noticed to be almost same for all fossil gasoline blending
components, because they consist of hydrogen and carbon. However, ethanol and
ethers have lower LHVs, because they contain also oxygen that reduces the released
energy of gasoline during the combustion. The ethanol limit is at maximum 10 vol%
according to the FQD that does not cause the significant reduction of the energy release
of gasoline. However, its higher addition could increase the consumption of gasoline
in the consumer point of view in the future. Therefore, the research of new renewable
feedstocks needs to consider the LHVs.
The potential renewable feedstocks into the existing upgrading units are terpenes, ke-
tones and furans. In the hydrotreating units are removed the double bonds from feed-
stocks and reformation, FCC and isomerization units upgrade the feed into high octane
gasoline components. However, some challenges are still present especially in the
hydrotreating unit that needs to remove oxygen from furans and ketones. Therefore,
the next step could be the development of the catalysts for the HDO in the hydrotreat-
ing unit to handle renewable feedstocks and enable the production of more sustainable
gasoline in the future.

66
References
2009/30/EC. 2009. Fuel quality directive. Official Journal of the European Union.
pp. 26.
Alotaibi, M.A., Kozhevnikova, E.F. and Kozhevnikov, I.V. 2012. Hydrogenation of
methyl isobutyl ketone over bifunctional Pt–zeolite catalyst. Journal of cataly-
sis. Vol. 293. pp. 141-144.
Aro, E. 2016. From first generation biofuels to advanced solar biofuels. Ambio. Vol.
45. no. 1. pp. 24-31.
Badra, J., AlRamadan, A.S. and Sarathy, S.M. 2017. Optimization of the octane re-
sponse of gasoline/ethanol blends. Applied Energy. Vol. 203. pp. 778-793.
Battin-Leclerc, F. 2008. Detailed chemical kinetic models for the low-temperature
combustion of hydrocarbons with application to gasoline and diesel fuel surro-
gates. Progress in Energy and Combustion Science. Vol. 34. no. 4. pp. 440-498.
Bays, T., Andersen, A., Sung Han, K., Grubel, K., Phillips, S. and C, J. 2019. Con-
necting the Molecular Inhomogeneity of Fuel Molecules to Macroscopic Fuel
Behaviour, Co-Optimization. 23.7.2019.
Boot, M.D., Tian, M., Hensen, E.J. and Sarathy, S.M. 2017. Impact of fuel molecular
structure on auto-ignition behavior–Design rules for future high performance
gasolines. Progress in Energy and Combustion Science. Vol. 60. pp. 1-25.
Bounaceur, R., Warth, V., Sirjean, B., Glaude, P., Fournet, R. and Battin-Leclerc, F.
2009. Influence of the position of the double bond on the autoignition of linear
alkenes at low temperature. Proceedings of the Combustion Institute. Vol. 32.
no. 1. pp. 387-394.
Budak, O., Hoppe, F., Burke, U., Minwegen, H., Heufer, A., Heuser, B. and Pis-
chinger, S. 2016. "Investigations on Hot Surface Induced Pre-Ignition with Tai-
lor-Made Fuels from
Biomass in a Direct Injection Spark-Ignition Engine". 21.6.2016.
ChemSpider. 2019a. 19.9.2019-last update. (±)-α-Pinene. Available:
http://www.chemspider.com/Chemical-Structure.6402.html.
ChemSpider. 2019b. 19.9.2019-last update. 1-hexene. Available:
http://www.chemspider.com/Chemical-Structure.11109.html.
ChemSpider. 2019c. 8.10.2019-last update. Isoprene. Available:
http://www.chemspider.com/Chemical-Structure.6309.html.

67
Christensen, E., Yanowitz, J., Ratcliff, M. and McCormick, R.L. 2011. Renewable
oxygenate blending effects on gasoline properties. Energy & Fuels. Vol. 25. no.
10. pp. 4723-4733.
Clayden, J. and Clayden, J. 2001. Organic chemistry. Oxford University Press. Ox-
ford.
Da Silva, R., Cataluna, R., de Menezes, E.W., Samios, D. and Piatnicki, C.M.S.
2005. Effect of additives on the antiknock properties and Reid vapor pressure of
gasoline. Fuel. Vol. 84. no. 7-8. pp. 951-959.
Davidson, P. 2013. E20/25 Technical Development Study, Task 1:Review of E20/25
parameters and test methods. pp. 23.
De Bruycker, R., Herbinet, O., Carstensen, H., Battin-Leclerc, F. and Van Geem,
K.M. 2016. Understanding the reactivity of unsaturated alcohols: Experimental
and kinetic modeling study of the pyrolysis and oxidation of 3-methyl-2-butenol
and 3-methyl-3-butenol. Combustion and Flame. Vol. 171. pp. 237-251.
De Vleeschouwer, F., Van Speybroeck, V., Waroquier, M., Geerlings, P. and De
Proft, F. 2007. Electrophilicity and nucleophilicity index for radicals. Organic
letters. Vol. 9. no. 14. pp. 2721-2724.
Dutta, K., Daverey, A. and Lin, J. 2014. Evolution retrospective for alternative fuels:
First to fourth generation. Renewable Energy. Vol. 69. pp. 114-122.
EFOA. 2006. ETBE (Cas number 637-92-3). pp. 28.
El-Fattah, M.A., El-Kady, M. and Batah, A. 2008. The effect of heavy naphtha on
the blended gasolines and oxygenates. Oriental Journal of Chemistry. Vol. 24.
no. 1. pp. 53.
Erman, M.B. and Kane, B.J. 2008. Chemistry Around Pinene and Pinane: A Facile
Synthesis of Cyclobutanes and Oxatricyclo‐Derivative of Pinane from cis‐and
trans‐Pinanols. Chemistry & biodiversity. Vol. 5. no. 6. pp. 910-919.
European Commission 2019. 19.9.2019-last update. Transport. [Homepage of Euro-
pean Union]. [Online]. Available: https://ec.europa.eu/info/topics/transport_en:
[2019, 9/2019].
Farrell, J., Wagner, R., Gaspar, D. and Moen, C. 2019. Co-Optima FY18 YEAR IN
REVIEW. U.S. Department of Energy. USA.
Ghosh, P., Hickey, K.J. and Jaffe, S.B. 2006. Development of a detailed gasoline
composition-based octane model. Industrial and Engineering Chemistry Re-
search. Vol. 45. no. 1. pp. 337-345.

68
Harjanne, A. and Korhonen, J.M. 2019. Abandoning the concept of renewable en-
ergy. Energy Policy. Vol. 127. pp. 330-340.
Heger, S., Bluhm, K., Du, M., Schäffer, A. and Hollert, H. 2016. Green Toxicology
for Green Biofuels – Integrating Bioassays in the Development of Novel Fuels.
21.6.2016.
Jenkins, R.W., Moore, C.M., Semelsberger, T.A. and Sutton, A.D. 2017. Heteroge-
neous Ketone Hydrodeoxygenation for the Production of Fuels and Feedstocks
from Biomass. ChemCatChem. Vol. 9. no. 14. pp. 2807-2815.
Kalghatgi, G.T. 2015. Developments in internal combustion engines and implications
for combustion science and future transport fuels. Proceedings of the combus-
tion institute. Vol. 35. no. 1. pp. 101-115.
Kalghatgi, G.T. 2001. Fuel anti-knock quality-Part II. Vehicle Studies-how relevant
is Motor Octane Number (MON) in modern engines? SAE Transactions. pp.
2005-2015.
Koistinen, A. 2018. 27082018-last update. Biolttoaineista jättilasku autoilulle 2030,
varoittaa St1-Ministeri puolustautuu: Pumpulla korotus jää alla 10 senttiin lit-
ralta. [Homepage of YLE]. [Online]. Available: https://yle.fi/uutiset/3-
10367503:.
Koivisto, E., Ladommatos, N. and Gold, M. 2015. Systematic study of the effect of
the hydroxyl functional group in alcohol molecules on compression ignition and
exhaust gas emissions. Fuel. Vol. 153. pp. 650-663.
Kortelainen, J. 2019. Päästöt ylös bensa-autojen myötä. Energia uutiset.
Kroyan, Y. 2018, Modelling the impact of fuel properties on SI-engine performance,
Aalto University.
Kunwar, B., Cheng, H., Chandrashekaran, S.R. and Sharma, B.K. 2016. Plastics to
fuel: a review. Renewable and Sustainable Energy Reviews. Vol. 54. pp. 421-
428.
Liu, H., Wang, X., Zhang, D., Dong, F., Liu, X., Yang, Y., Huang, H., Wang, Y.,
Wang, Q. and Zheng, Z. 2019. Investigation on Blending Effects of Gasoline
Fuel with N-Butanol, DMF, and Ethanol on the Fuel Consumption and Harmful
Emissions in a GDI Vehicle. Energies. Vol. 12. no. 10. pp. 1845.
Lü, J., Sheahan, C. and Fu, P. 2011. Metabolic engineering of algae for fourth gener-
ation biofuels production. Energy & Environmental Science. Vol. 4. no. 7. pp.
2451-2466.

69
Masum, B., Masjuki, H.H., Kalam, M.A., Palash, S. and Habibullah, M. 2015. Effect
of alcohol–gasoline blends optimization on fuel properties, performance and
emissions of a SI engine. Journal of Cleaner Production. Vol. 86. pp. 230-237.
Masum, B., Masjuki, H., Kalam, M., Fattah, I.R., Palash, S. and Abedin, M. 2013.
Effect of ethanol–gasoline blend on NOx emission in SI engine. Renewable and
Sustainable Energy Reviews. Vol. 24. pp. 209-222.
Mikkonen, S. and Nuottimäki, J. 2019. “Energy model for achieving low well-to-
wheels CO2". pp. 4.
Naik, S.N., Goud, V.V., Rout, P.K. and Dalai, A.K. 2010. Production of first and
second generation biofuels: a comprehensive review. Renewable and sustaina-
ble energy reviews. Vol. 14. no. 2. pp. 578-597.
Neste. 2019a. 19.9.2019-last update. Neste My Renewable gasolineTM. [Homepage
of Neste]. [Online]. Available: https://www.neste.com/companies/products/re-
newable-fuels/neste-my-renewable-gasoline.
Neste. 2019b. 19.9.2019-last update. Safety data sheet-neste renewable Naphtha.
[Homepage of Neste]. [Online]. Available: https://www.neste.fi/sta-
tic/ktt/14689_eng.pdf.
Neste. 2019c. 4.10.2019-last update. Sertifioitu toimitusketju - raaka-ainetuotannosta
lopputuotteeseen. Available: https://www.neste.com/fi/konserni/vastuul-
lisuus/vastuullinen-toimitusketju/sertifikaatit.
Neste. 2016. Neste Renewable Diesel Handbook. pp. 56.
Neste. 2015. Bensiiniopas. pp. 3-40.
Oduola, M. and Iyaomolere, A. 2015. Development of model equations for predict-
ing gasoline blending properties. American Journal of Chemical Engineering.
Vol. 3. no. 2-1. pp. 9-17.
OECD. 2019. 19.9.2019-last update. Crude oil production. [Homepage of Organisa-
tion for Economic Co-operation and Development]. [Online]. Available:
https://data.oecd.org/energy/crude-oil-production.htm: [2018, .
Olsen, T. 2014. An Oil Refinery Walk-Through. Chemical Engineering Progress.
Vol. 110. no. 5. pp. 34-40.
Owen, K. and Coley, T. 1995. Automotive fuels reference book. 2nd edn. Society of
Automotive Engineers, Inc. Warrendale, PA, U.S.A.
Qian, Y., Zhu, L., Wang, Y. and Lu, X. 2015. Recent progress in the development of
biofuel 2, 5-dimethylfuran. Renewable and Sustainable Energy Reviews. Vol.
41. pp. 633-646.

70
Ratcliff, M.A., Burton, J., Sindler, P., Christensen, E., Fouts, L. and McCormick,
R.L. 2018. Effects of Heat of Vaporization and Octane Sensitivity on Knock-
Limited Spark Ignition Engine Performance. SAE Technical Papers. Vol. 2018-
April.
Ratnasari, D.K., Nahil, M.A. and Williams, P.T. 2017. Catalytic pyrolysis of waste
plastics using staged catalysis for production of gasoline range hydrocarbon oils.
Journal of Analytical and Applied Pyrolysis. Vol. 124. pp. 631-637.
Rausser, G.C., Adams, G.D., Montgomery, W.D. and Smith, A.E. 2005. The social
costs of an MTBE ban in California.
Roberge, D.M., Buhl, D., Niederer, J.P.M. and Hölderich, W.F. 2001. Catalytic as-
pects in the transformation of pinenes to p-cymene. Applied Catalysis A: Gen-
eral. Vol. 215. no. 1-2. pp. 111-124.
Rose, K.D. 2009. Ethanol/Petrol Blends: Volatility Characterisation in the Range 5-
25 vol% Ethanol Interim Report. CONCAWE. Belgium.
Sacia, E.R., Deaner, M.H. and Bell, A.T. 2015. Synthesis of biomass-derived
methylcyclopentane as a gasoline additive via aldol condensation/hydrodeoxy-
genation of 2, 5-hexanedione. Green Chemistry. Vol. 17. no. 4. pp. 2393-2397.
Sadeghbeigi, R. 2012. "6. Chemistry of FCC Reactions" in Fluid Catalytic Cracking
Handbook - An Expert Guide to the Practical Operation, Design, and Optimiza-
tion of FCC Units. 3rd edn.
Schobert, H.H. 2013. Chemistry of Fossil Fuels and Biofuels. Cambridge University
Press. Cambridge, NY.
SFS-EN 228: 2012 + A1:2017. 2017. Automotive fuels. Unleaded petrol. Require-
ments and test methods. pp. 18.
Shimadzu Global analytical and measuring instruments. 2019. 19.9.2019-last update.
PONA Analysis (GC). Available: https://www.shimadzu.com/an/in-
dustry/machineryautomotive/fuel_battery0403020.htm.
Sinervä, I. 2018. Raakaöljyn hinta luisuu jälleen-Eurooppa tuottaa nyt bensiiniä pal-
jon yli oman kulutuksensa. Aamulehti. Vol. Energia.
Tao, L., Tan, E.C., McCormick, R., Zhang, M., Aden, A., He, X. and Zigler, B.T.
2014. Techno‐economic analysis and life‐cycle assessment of cellulosic isobuta-
nol and comparison with cellulosic ethanol and n‐butanol. Biofuels, Bioproducts
and Biorefining. Vol. 8. no. 1. pp. 30-48.
The U.S. Department of Energy. 2018. CO-OPTIMIZATION OF FUELS & EN-
GINES FY17 YEAR IN REVIEW. U.S. Department of energy.

71
Topgül, T. 2015. The effects of MTBE blends on engine performance and exhaust
emissions in a spark ignition engine. Fuel Processing Technology. Vol. 138. pp.
483-489.
Totten, G.E., Totten, G.E., Westbrook, S.R. and Shah, R.J. 2003. Fuels and lubri-
cants handbook: technology, properties, performance, and testing. ASTM Inter-
national. West Conshohocken, PA.
Tracy, N.I., Chen, D., Crunkleton, D.W. and Price, G.L. 2009. Hydrogenated mono-
terpenes as diesel fuel additives. Fuel. Vol. 88. no. 11. pp. 2238-2240.
Tracy, N.I., Crunkleton, D.W. and Price, G.L. 2011. Catalytic cracking of squalene
to gasoline-range molecules. Biomass and Bioenergy. Vol. 35. no. 3. pp. 1060-
1065.
Transport and environment. 2018. CO2 emissions from cars: the facts. European
Federation for Transport and Environment AISBL. Belgium.
Tsolakis, N., Bam, W., Srai, J.S. and Kumar, M. 2019. Renewable chemical feed-
stock supply network design: The case of terpenes. Journal of Cleaner Produc-
tion. Vol. 222. pp. 802-822.
Wang, H., Meng, X., Zhao, G. and Zhang, S. 2017. Isobutane/butene alkylation cata-
lyzed by ionic liquids: A more sustainable process for clean oil production.
Green Chemistry. Vol. 19. no. 6. pp. 1462-1489.
Weyrich, P.A. and Hölderich, W.F. 1997. Dehydrogenation of α-limonene over Ce
promoted, zeolite supported Pd catalysts. Applied Catalysis A: General. Vol.
158. no. 1. pp. 145-162.
Whitmore, L.S., Parthasarathi, R., Davis, R., George, A. and Hudson, C.M. 2016.
RON Prediction Models for the New Fuels and Vehicles Systems. 21.6.2016.
Yang, J., Nie, Q., Ren, M., Feng, H., Jiang, X., Zheng, Y., Liu, M., Zhang, H. and
Xian, M. 2013. Metabolic engineering of Escherichia coli for the biosynthesis of
alpha-pinene. Biotechnology for biofuels. Vol. 6. no. 1. pp. 60.
Young, R.E. 2006. Petroleum refining process control and real-time optimization.
IEEE Control Systems Magazine. Vol. 26. no. 6. pp. 73-83.