louisiana department of public safety and corrections book/oct 17/demographic...black white other...
TRANSCRIPT

This document represents a demographic snapshot of the adult inmates
sentenced to the Department's custody and housed in local jails, and 1,065 adults in
contract transitional work programs for a total of 35,001 DOC offenders.
19,276 adults, which includes 1,909 adults in non-contract transitional work programs,
Total Population
Demographic Profiles of theAdult Correctional Population
Louisiana Department of Public Safety
and Corrections
Secretary
Corrections Services
35,001James M. Le Blanc
FACT SHEETSeptember 30, 2017
in the state correctional system on September 30, 2017
Presently there are 15,725 adult inmates incarcerated in state prison facilities, an additional
Institutions45%
Local Jails47%
Contract Transitional Work Programs
3%
Non-Contract Transitional Work
Programs5%
Male94.1
Female5.9
0.0 20.0 40.0 60.0 80.0 100.0
Sex
Black66.3
White33.2
Other0.5
0.0 20.0 40.0 60.0 80.0 100.0
Race
39,709 40,170
39,299
38,030
36,377 35,682
35,001
32,000
33,000
34,000
35,000
36,000
37,000
38,000
39,000
40,000
41,000
2011 2012 2013 2014 2015 2016 2017
Trend
35

Violent Crimes
Drug Crimes
Property Crimes
All Other Crimes
Total Population 35,001 16.7 15,725 24.8 19,276 10.0
Parole Eligible 10,113 15.7 3,673 28.3 6,440 8.6Dim.Sent.Eligible 14,486 15.5 4,908 24.4 9,578 10.9
1791 5.1 202 1.3 1589 8.2
3018 8.6 324 2.1 2694 14.0
4921 14.1 864 5.5 4057 21.0
7470 21.3 2084 13.3 5386 27.9
4407 12.6 1535 9.8 2872 14.9
2587 7.4 1340 8.5 1247 6.5
4862 13.9 4833 30.7 29 0.2
72 0.2 72 0.5 0 0.0
35001 100.0 15725 100.0 19276 100.0
140216.8 4471 7.3
# Inmates in
State Facilities
28.4
*Avg Time Served: 5.98 Yrs
Avg Sentence Length: 16.10 Yrs
45.6
20.9
16.3
17.2
% of Total Pop
Maximum YearsSentenced
% of Local Pop# Inmates in
Local Pop% of State Pop
Average Maximum Years Sentenced
CategoryAvg. Max Sent. In
Local Pop
# Inmates in
Local Pop
Avg. Max Sent. in
State Facilities
3-4
*(Includes Life computed as 21 years and Death as 13 years.)
0.000.00
Years
>20
(Fixed Term)
# Inmates in
Total Pop
Death
Life
0-2
17 - 20
11-16
5873
PercentMost Serious Crime
Commitment
** Offender class is the number of sequential felonies committed for which an offender has been convicted
Pending Calculation/
Re-calculation0.00
# Inmates in
State Facilities
Avg. Max
Sentence in
Tot Pop
# Inmates in
Total Pop
7-10
5-6
September 30, 2017FACT SHEET
Adult Correctional PopulationDemographic Profiles of the
Adult Correctional PopulationDemographic Profiles of the
3 16 85563
2,907
5,2765,424 5,486
4,2173,471
2,949
4,604
0
2000
4000
6000
8000
# In
mat
es
Current Age: 37.0 yrs
avg. age
6.63.4
7.911.7
2.8
15.6
3.2 2.56.1
2.8
37.4
0.0
10.0
20.0
30.0
40.0
50.0
Per
cen
t
Parishof
Commitment
10,398 9,0547,221
4,259
2,071 1,527471
0
5000
10000
# In
mat
es
* OffenderClass
28

Black White Other
Male 68.0 31.5 0.5 100.0
Female 39.3 60.5 0.2 100.0
FACT SHEET
September 30, 2017
on September 30, 2017.
Female Population
Adult Male and Female Correctional PopulationsDemographic Profiles of the
female offenders in the custody of the state correctional system
male offenders in the custody of the state correctional system and the 2,093
This document represents a demographic snapshot of the 32,908
32,908Male Population
Louisiana Department of Public Safety
and Corrections
Secretary
Corrections Services
James M. Le Blanc
2,093
Black68.0
Black39.3
White31.5
White60.5
Other0.5
Other0.2
0.0 20.0 40.0 60.0 80.0 100.0
Male
Female
Race
Male Offenders9
4.1%
Female Offenders5
.9%
214486
897
6,4846,367
5,484
4,430
3,103
2,178
1,549 1,456
260
3 11 14
260388
423 365
240 159 103 81 460
1000
2000
3000
4000
5000
6000
7000#
Inm
ates
Male Female
Male Age at Conviction
33.1 yrs. avg. age
Female Age at Conviction
32.8 yrs. avg. age
37,325 37,781 37,071 35,955 34,331 33,701 32,908
2,384 2,389 2,228 2,075 2,046 1,981 2,093
-
10,000
20,000
30,000
40,000
2011 2012 2013 2014 2015 2016 2017
Trend
Male Female
29
FACT SHEETSeptember 30, 2017
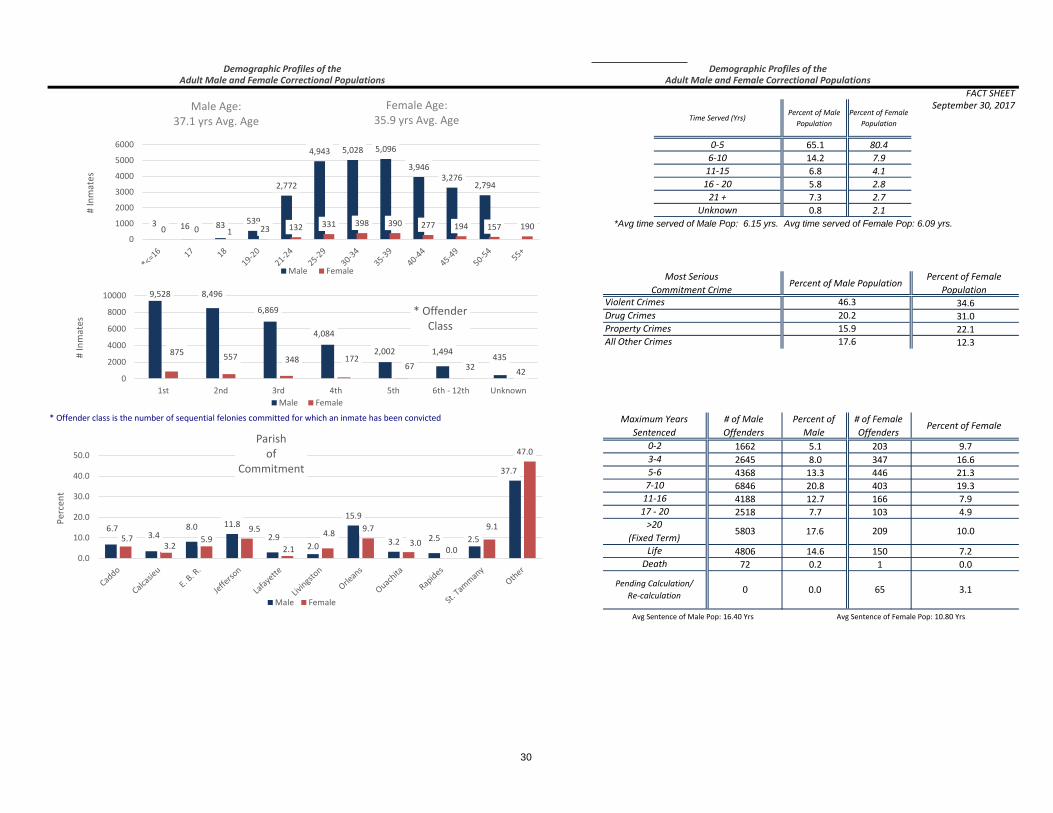
65.1 80.4
14.2 7.9
6.8 4.1
5.8 2.8
7.3 2.7
0.8 2.1
*Avg time served of Male Pop: 6.15 yrs. Avg time served of Female Pop: 6.09 yrs.
34.6
31.0
22.1
12.3
* Offender class is the number of sequential felonies committed for which an inmate has been convicted
Male Female
Parish of CommitmentPercent 1662 5.1 203 9.7
Caddo 6.7 5.7 2645 8.0 347 16.6
Calcasieu 3.4 3.2 4368 13.3 446 21.3
E. B. R. 8.0 5.9 6846 20.8 403 19.3
Jefferson 11.8 9.5 4188 12.7 166 7.9
Lafayette 2.9 2.1 2518 7.7 103 4.9
Livingston 2.0 4.8
Orleans 15.9 9.7
Ouachita 3.2 3.0 4806 14.6 150 7.2
Rapides 2.5 0.0 72 0.2 1 0.0
St. Tammany 5.9 9.1
Other 37.7 47.0
100.0 100.0
Adult Male and Female Correctional PopulationsDemographic Profiles of the
6-10
11-15
11-16
16 - 20
21 +
Unknown
0-2
Percent of Female
Population46.3
Drug Crimes 20.2
Percent of Female
0-5
Demographic Profiles of theAdult Male and Female Correctional Populations
Percent of Male
Population
Percent of Female
PopulationTime Served (Yrs)
Most Serious
Commitment Crime
15.9
All Other Crimes 17.6
Avg Sentence of Male Pop: 16.40 Yrs
Maximum Years
Sentenced
# of Male
Offenders
Percent of
Male
# of Female
Offenders
Percent of Male Population
Violent Crimes
Property Crimes
Death
0.0
7-10
Life
3-4
5-6
17 - 20
>20
(Fixed Term)17.6
65
Avg Sentence of Female Pop: 10.80 Yrs
10.0
3.1
209
0
5803
Pending Calculation/
Re-calculation
3 16 83 539
2,772
4,943 5,028 5,096
3,9463,276
2,794
0 0 1 23 132 331 398 390 277 194 157 190
0
1000
2000
3000
4000
5000
6000
# In
mat
es
Male Female
Female Age: 35.9 yrs Avg. Age
Male Age:37.1 yrs Avg. Age
6.73.4
8.0 11.8
2.92.0
15.9
3.2 2.5 2.5
37.7
5.73.2
5.99.5
2.1
4.89.7
3.00.0
9.1
47.0
0.0
10.0
20.0
30.0
40.0
50.0
Per
cen
t
Parishof
Commitment
Male Female
9,528 8,496
6,869
4,084
2,002 1,494435
875 557 348 17267 32
420
2000
4000
6000
8000
10000
1st 2nd 3rd 4th 5th 6th - 12th Unknown
# In
mat
es
* OffenderClass
Male Female
30
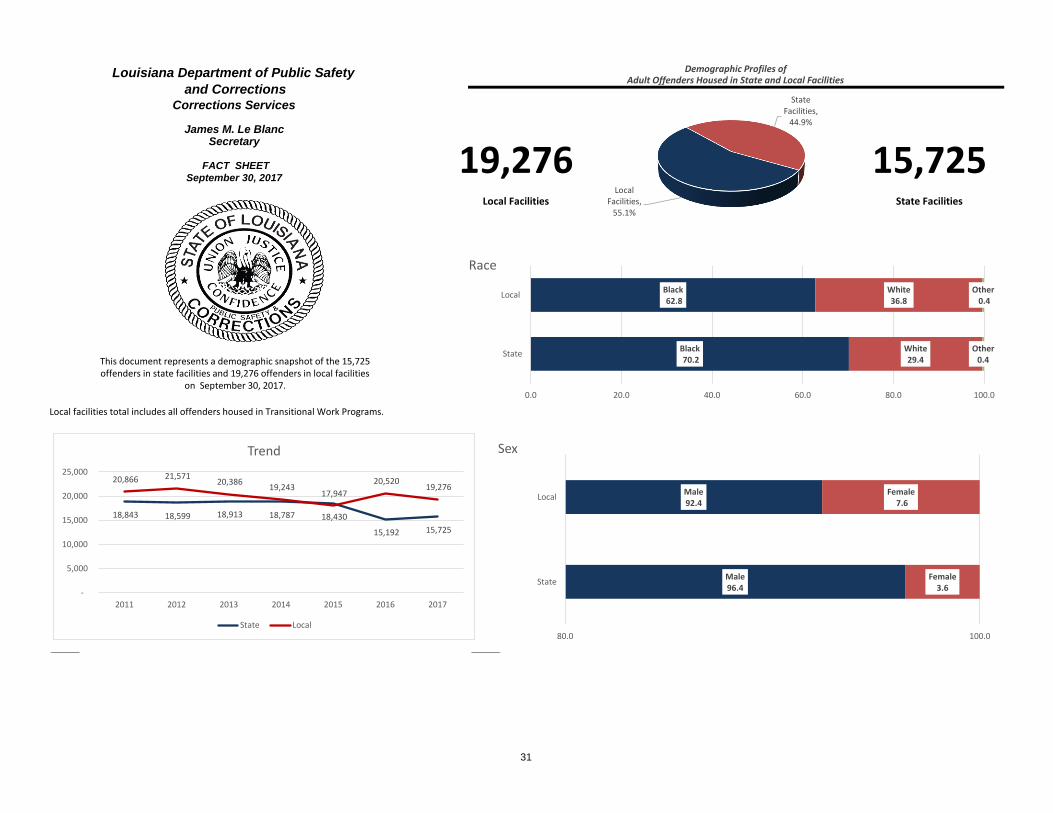
Local facilities total includes all offenders housed in Transitional Work Programs.
offenders in state facilities and 19,276 offenders in local facilitiesThis document represents a demographic snapshot of the 15,725
on September 30, 2017.
Louisiana Department of Public Safety
and Corrections
Secretary
Corrections Services
James M. Le Blanc
Demographic Profiles ofAdult Offenders Housed in State and Local Facilities
19,276 15,725 FACT SHEET
September 30, 2017
Local Facilities State Facilities
Male96.4
Male92.4
Female3.6
Female7.6
80.0 100.0
State
Local
Sex
Black70.2
Black62.8
White29.4
White36.8
Other0.4
Other0.4
0.0 20.0 40.0 60.0 80.0 100.0
State
Local
Race
Local Facilities,
55.1%
State Facilities,
44.9%
18,843 18,599 18,913 18,787 18,430
15,192 15,725
20,866 21,571 20,386
19,243 17,947
20,520 19,276
-
5,000
10,000
15,000
20,000
25,000
2011 2012 2013 2014 2015 2016 2017
Trend
State Local
31

FACT SHEETSeptember 30, 2017
43.1 86.0
19.5 8.4
11.1 2.6
10.2 1.4
14.6 0.31.4 1.3
*Avg time served of State Pop: 10.2 yrs. *Avg time served of Local Pop: 2.27 yrs.
25.7
29.7
23.0
21.6
** Offender class is the number of sequential felonies committed for which an inmate has been convicted
Parish of CommitmentState Local 202 1.3 1589 8.2
Caddo 6.2 7.2 324 2.1 2694 14.0
Calcasieu 3.4 3.3 864 5.5 4057 21.0
E. B. R. 8.7 7.3 2084 13.3 5386 27.9
Jefferson 13.5 10.0 1535 9.8 2872 14.9
Lafayette 2.5 3.0 1340 8.5 1247 6.5
Orleans 21.0 10.4
Ouachita 2.4 4.1
Rapides 2.0 2.6 4833 30.7 29 0.0
St. Tammany 6.9 5.3 72 0.5 0 0.0
Other 33.4 46.8100.0 100.0
Adult Offenders Housed in State and Local FacilitiesDemographic Profiles of
Unknown
7.3
0.0
Time Served (Yrs)
Percent of
State
28.4
0.0
Percent of Local
Population
Percent of State
Population
Property Crimes
3-4
7-10
Maximum Years
Sentenced
# of State
Offenders
Drug Crimes
Avg Sentence of State Pop: 23.4 Yrs
1402
0
Death
0
4471
Percent of Local
Population
Avg Sentence of Local Pop: 9.7 Yrs
Demographic Profiles ofAdult Offenders Housed in State and Local Facilities
21 +
16 - 20
11-15
6-10
0-5
0-2
Pending Calculation/
Re-calculation
Life
11-16
67.7
17 - 20
>20
(Fixed Term)
# of Local
Offenders
11.6
Violent Crimes
All Other Crimes
5-6
12.1
8.6
Most Serious
Commitment CrimePercent of State Population
Percent of Local
Population
3 14 27 129
7351,604
1,8372,218
2,112 1,9211,783
3,342
02
55427
2,154
3,713 3,6403,304
2,117
1,543 1,164
1,157
0500
100015002000250030003500400045005000
# In
mat
es
State Local
Current Local Pop Age: 33.5 yrs Avg. Age
Current State PopAge: 41.0 yrs Avg. Age
6.23.4
8.713.5
2.5
21.0
2.4 2.06.9
33.4
7.2
3.37.3
10.0
3.0
10.4
4.1 2.65.3
46.8
0.0
10.0
20.0
30.0
40.0
50.0
Parishof
Commitment
State Local
5,186
3,9222,939
1,811865 653 349
5,0575,189
4,322
2,490
1,231887
1000
2000
4000
6000
# In
mat
es
*OffenderClass
State Local
32
Black White Other
62.8 36.8 0.4 100.0
Male Female
Sex 92.4 7.6 100.0
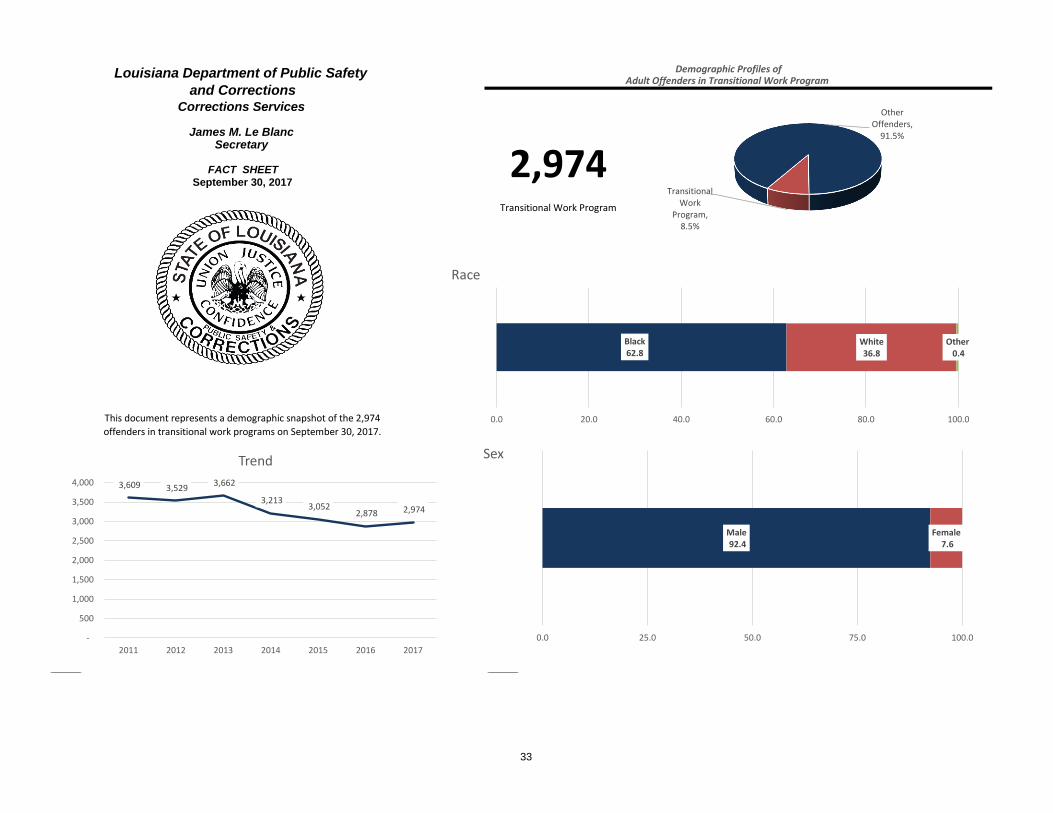
offenders in transitional work programs on September 30, 2017.
This document represents a demographic snapshot of the 2,974
FACT SHEET
September 30, 2017
Demographic Profiles ofAdult Offenders in Transitional Work Program
Louisiana Department of Public Safety
and Corrections
Secretary
Corrections Services
James M. Le Blanc
2,974Transitional Work Program
Male92.4
Female7.6
0.0 25.0 50.0 75.0 100.0
Sex
Black62.8
White36.8
Other0.4
0.0 20.0 40.0 60.0 80.0 100.0
Race
Other Offenders,
91.5%
Transitional Work
Program, 8.5%
3,609 3,529 3,662
3,213 3,052
2,878 2,974
-
500
1,000
1,500
2,000
2,500
3,000
3,500
4,000
2011 2012 2013 2014 2015 2016 2017
Trend
33
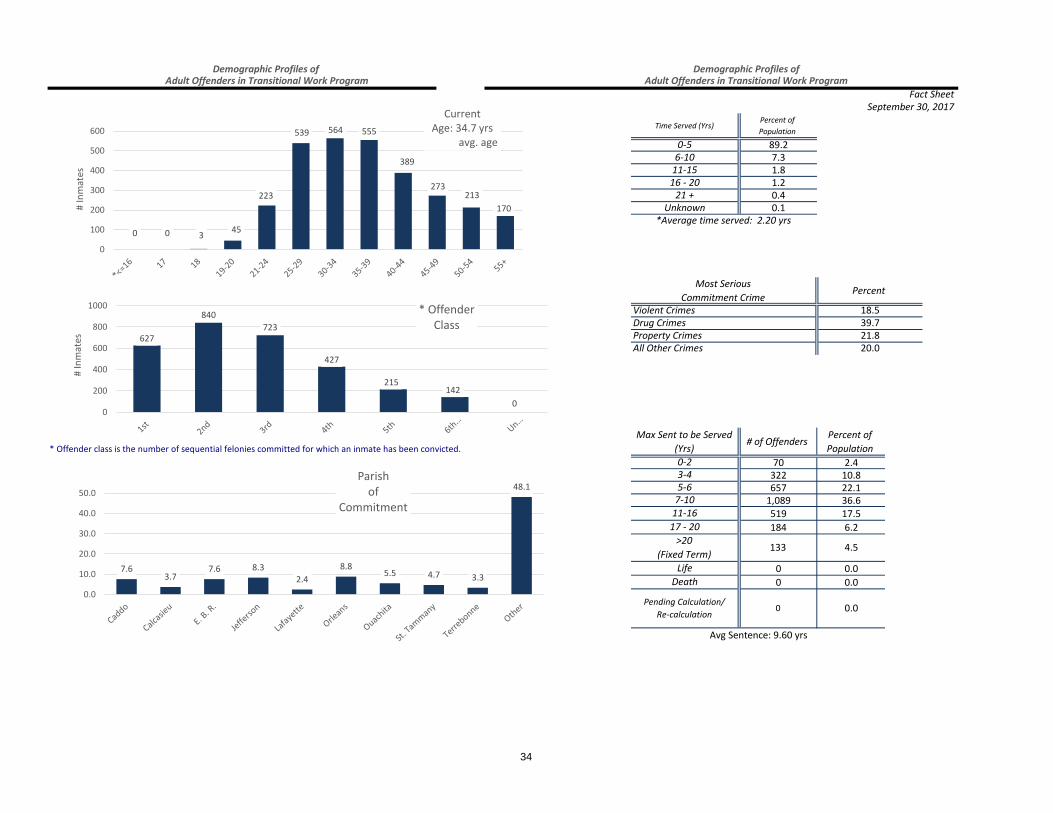
89.27.31.81.20.40.1
* Offender class is the number of sequential felonies committed for which an inmate has been convicted.
70 2.4322 10.8657 22.1
1,089 36.6519 17.5
184 6.2
0 0.0
0 0.0
11-167-10
September 30, 2017
*Average time served: 2.20 yrs
# of OffendersMax Sent to be Served
(Yrs)
All Other Crimes
Percent of
Population
0-2
17 - 20
>20
(Fixed Term)4.5
Death
Pending Calculation/
Re-calculation
Adult Offenders in Transitional Work Program
11-15
Time Served (Yrs)
21.8
Percent
18.5Drug CrimesViolent Crimes
0-5
16 - 20
6-10
21 +
39.7
Unknown
Property Crimes
Fact Sheet
Demographic Profiles of
Most Serious
Commitment Crime
Demographic Profiles of
Percent of
Population
Adult Offenders in Transitional Work Program
20.0
3-45-6
133
Life
Avg Sentence: 9.60 yrs
0 0.0
0 0 345
223
539 564 555
389
273213
170
0
100
200
300
400
500
600
# In
mat
es
Current Age: 34.7 yrs
avg. age
7.63.7
7.6 8.32.4
8.85.5 4.7 3.3
48.1
0.0
10.0
20.0
30.0
40.0
50.0
Parishof
Commitment
627
840
723
427
215142
00
200
400
600
800
1000
# In
mat
es
* OffenderClass
34
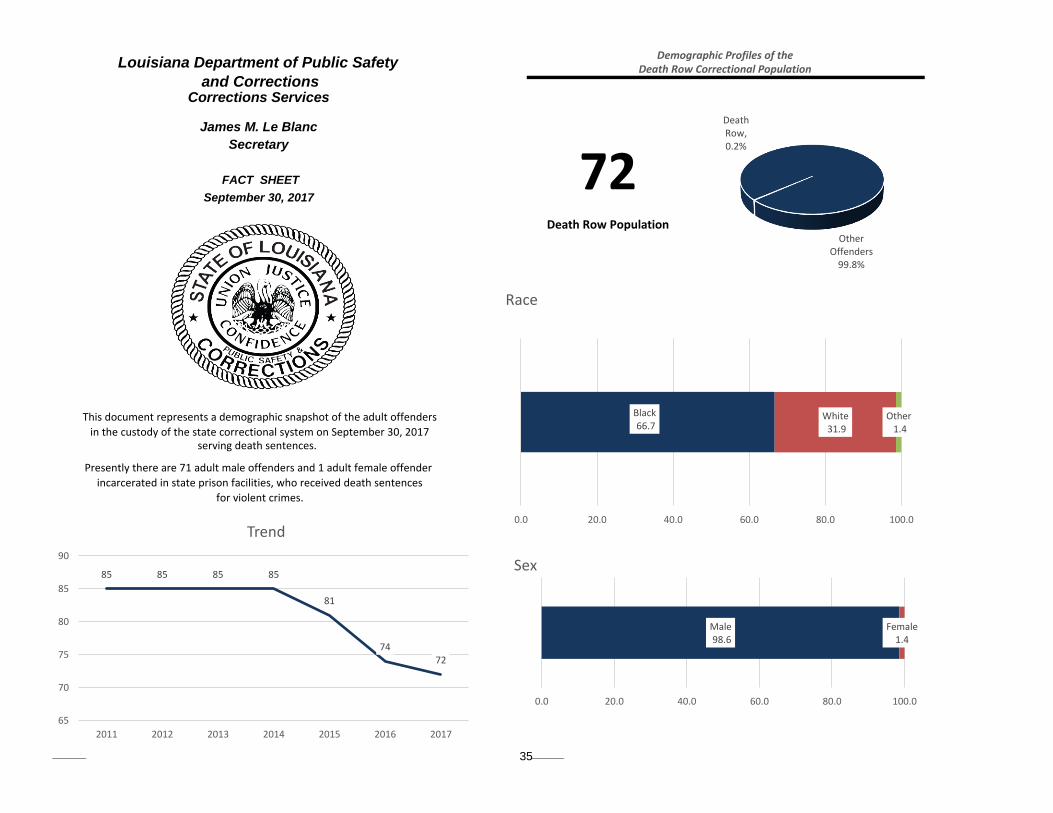
Death Row Correctional PopulationDemographic Profiles of the
for violent crimes.
incarcerated in state prison facilities, who received death sentences
Presently there are 71 adult male offenders and 1 adult female offender
72Death Row Population
in the custody of the state correctional system on September 30, 2017
Louisiana Department of Public Safety
and Corrections
Secretary
September 30, 2017
This document represents a demographic snapshot of the adult offenders
Corrections Services
James M. Le Blanc
FACT SHEET
serving death sentences.
Black66.7
White31.9
Other1.4
0.0 20.0 40.0 60.0 80.0 100.0
Race
Other Offenders
99.8%
Death Row, 0.2%
Male98.6
Female1.4
0.0 20.0 40.0 60.0 80.0 100.0
Sex85 85 85 85
81
7472
65
70
75
80
85
90
2011 2012 2013 2014 2015 2016 2017
Trend
35

FACT SHEET
Percent of
Population
5.6
11.1
11.1
37.5
31.9
2.8
0.0
* Offender class is the number of sequential felonies committed for which an offender has been
convicted.
0-5
31+
*Average time served: 15.7 yrs.
Time Served (Yrs)
Unknown
16 - 20
21-30
11-15
6-10
September 30, 2017
Death Row Correctional PopulationDemographic Profiles of the
Death Row Correctional PopulationDemographic Profiles of the
Demographic Profiles of the
0 0 0 0 0
23
8
18
15
7
19
0
3
6
9
12
15
18
21
# In
mat
es
Current Age: 45.1 yrs avg. age 31
23
10 71 0 0
0
25
50
# In
mat
es
*OffenderClass
0 01
1816
18
15
21 1
0 00
5
10
15
20
# In
mat
es
ConvictionAge: 28.0 yrs
avg. age18.1
5.6
19.4
12.59.7
5.64.2 4.2
2.8
15.1
0
5
10
15
20
25
% o
f In
mat
es
Parishof
Commitment
36

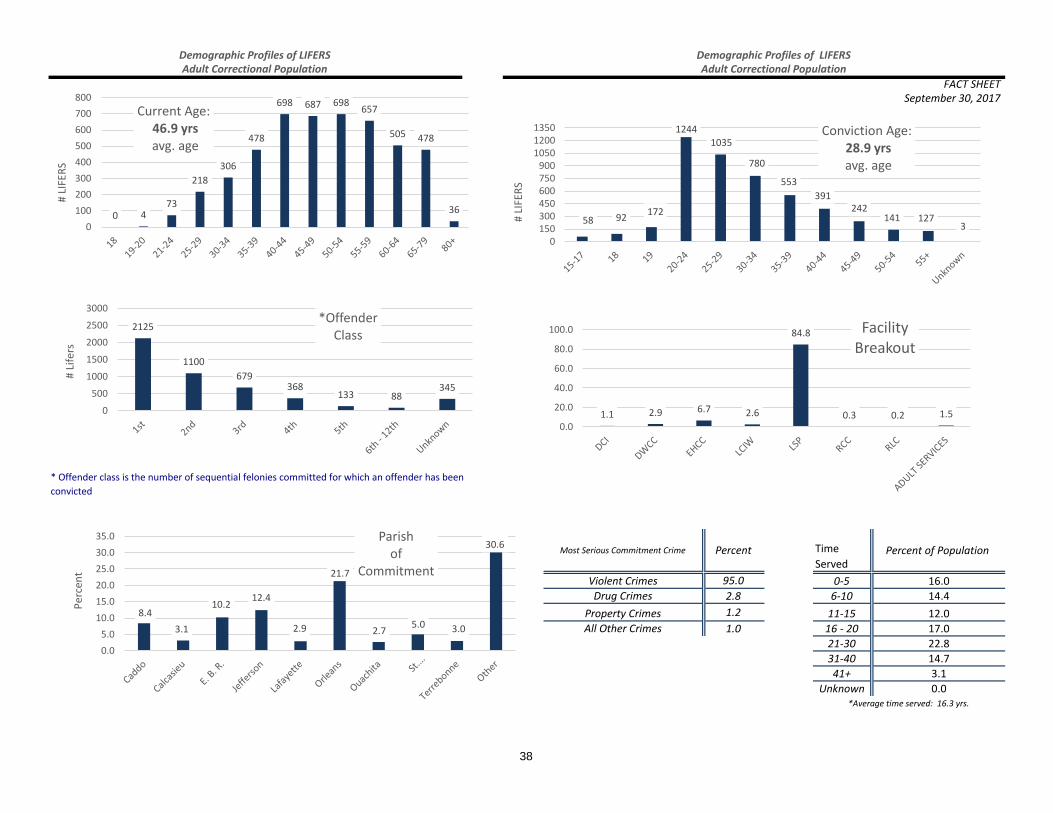
serving natural life sentences.
James M. Le Blanc
FACT SHEET
facilities with life sentences.
Presently there are 4,838 adult offenders incarcerated in state prison
Demographic Profiles of LIFERS
in the custody of the state correctional system on September 30, 2017
Louisiana Department of Public Safety
and Corrections
Secretary
September 30, 2017
This document represents a demographic snapshot of the adult offenders
Corrections Services
Adult Correctional Population
4,838Lifer Population
Male97.0
Female3.0
0.0 20.0 40.0 60.0 80.0 100.0
Sex
Black74.0
White25.5
Other0.5
0.0 20.0 40.0 60.0 80.0 100.0
Race
Lifers13.8%
Other Offenders
86.2%
4,599
4,660
4,733
4,786
4,870 4,859 4,838
4,450
4,500
4,550
4,600
4,650
4,700
4,750
4,800
4,850
4,900
2011 2012 2013 2014 2015 2016 2017
Trend
37
FACT SHEETSeptember 30, 2017
95.0 0-5 16.0
2.8 6-10 14.4
1.2 11-15 12.0
1.0 16 - 20 17.0
21-30 22.8
31-40 14.7
41+ 3.1
Unknown 0.0
Adult Correctional PopulationDemographic Profiles of LIFERS
Most Serious Commitment Crime
Property Crimes
Drug Crimes
Violent Crimes
Demographic Profiles of LIFERSAdult Correctional Population
*Average time served: 16.3 yrs.
Percent of PopulationPercent
* Offender class is the number of sequential felonies committed for which an offender has been
convicted
All Other Crimes
Time
Served
0 473
218
306
478
698 687 698657
505 478
36
0
100
200
300
400
500
600
700
800
# LI
FER
S
Current Age:46.9 yrs avg. age
2125
1100
679368
133 88345
0
500
1000
1500
2000
2500
3000
# Li
fers
*OffenderClass
58 92172
1244
1035
780
553
391242
141 1273
0150300450600750900
105012001350
# LI
FER
S
Conviction Age:28.9 yrs avg. age
8.4
3.1
10.212.4
2.9
21.7
2.75.0 3.0
30.6
0.0
5.0
10.0
15.0
20.0
25.0
30.0
35.0
Per
cen
t
Parishof
Commitment
1.1 2.9 6.7 2.6
84.8
0.3 0.2 1.50.0
20.0
40.0
60.0
80.0
100.0 Facility Breakout
38

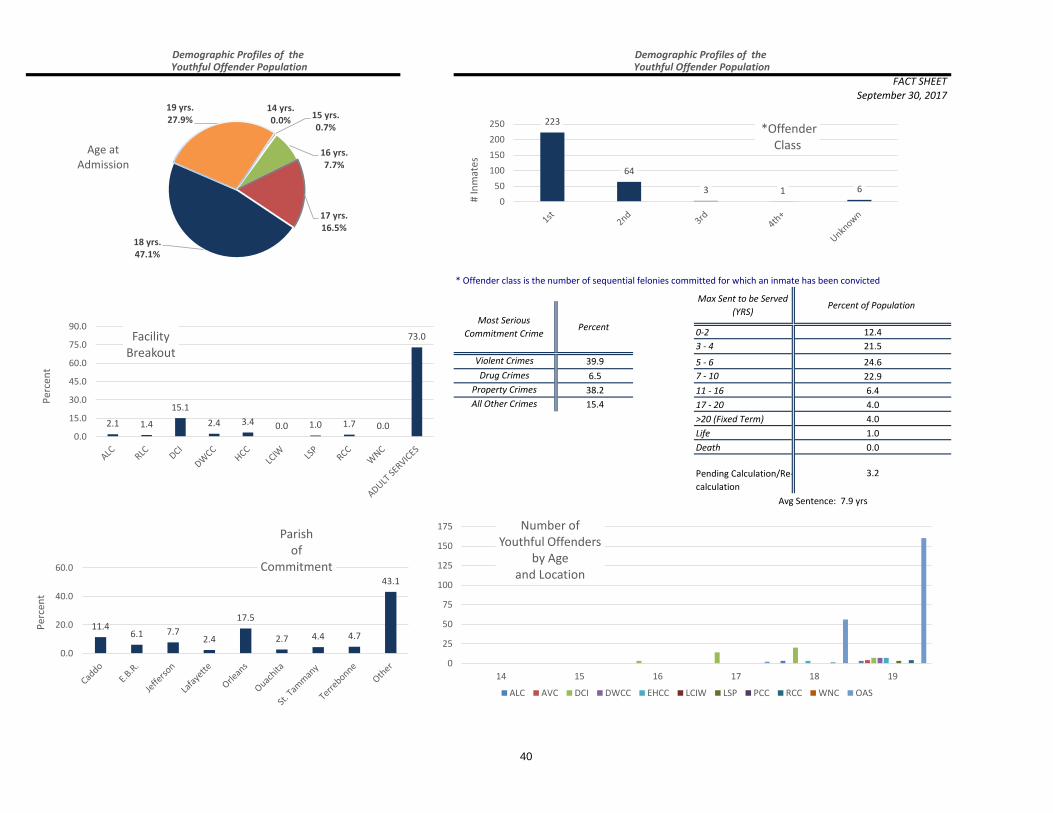
Demographic Profiles of the Youthful Offender Population
297Youthful Offender Population
in the state correctional system on September 30, 2017.
This document represents a demographic snapshot of the youthful offenders
Louisiana Department of Public Safety
and Corrections
Secretary
September 30, 2017
criminal court and sentenced to the custody of the Department.
currently 16, 17, 18 and 19 years of age and who were convicted in
prisons. The youthful offender population is composed of offenders who are
Presently, there are 297 offenders who are youthful offenders housed in state
Corrections Services
FACT SHEET
James M. Le Blanc
0 0 316
83
195
0
100
200
300#
Inm
ates
Current Age: 18.6 yrs avg. age
Black81.1
White18.5
0.0 20.0 40.0 60.0 80.0 100.0
Race
Male97.6
Female2.4
0 10 20 30 40 50 60 70 80 90 100
Sex
547
453 470406
344290 297
0
100
200
300
400
500
600
2011 2012 2013 2014 2015 2016 2017
Trend
39
FACT SHEET
0-2
3 - 4
39.9 5 - 6
6.5 7 - 10
38.2 11 - 16
15.4 17 - 20
>20 (Fixed Term)
Life
Death
September 30, 2017
24.6
4.0
Max Sent to be Served
(YRS)
12.4
Avg Sentence: 7.9 yrs
Percent
Violent Crimes
Drug Crimes
Property Crimes
Demographic Profiles of the Demographic Profiles of the
Percent of Population
Pending Calculation/Re-
calculation
21.5
0.0
6.4
22.9
3.2
Youthful Offender Population Youthful Offender Population
* Offender class is the number of sequential felonies committed for which an inmate has been convicted
All Other Crimes
1.0
4.0
Most Serious
Commitment Crime
11.46.1 7.7
2.4
17.5
2.7 4.4 4.7
43.1
0.0
20.0
40.0
60.0
Per
cen
t
Parish of
Commitment
223
64
3 1 60
50
100
150
200
250
# In
mat
es
*OffenderClass
2.1 1.4
15.1
2.4 3.4 0.0 1.0 1.7 0.0
73.0
0.0
15.0
30.0
45.0
60.0
75.0
90.0
Per
cen
t
FacilityBreakout
0
25
50
75
100
125
150
175
14 15 16 17 18 19
Number of Youthful Offenders
by Age and Location
ALC AVC DCI DWCC EHCC LCIW LSP PCC RCC WNC OAS
14 yrs.0.0%
15 yrs.0.7%
16 yrs.7.7%
17 yrs.16.5%
18 yrs.47.1%
19 yrs.27.9%
Age atAdmission
40

September 30, 2017
Corrections Services
James M. Le Blanc
FACT SHEET
Geriatric Correctional PopulationDemographic Profiles of the
This document represents a demographic snapshot of the geriatric population in the custody of the state correctional system on
September 30, 2017
are now computed as 20 years.
standards by ASCA (see asca.net/projects/1 for calculation information). These sentences
*As of December 31, 2013 the computation for life and death sentences is based on national
correctional system who fall within the age range of 50+ years (inclusive).Presently there are 7,471 adult offenders in the custody of the state
7,471Aged Population
Louisiana Department of Public Safety
and Corrections
Secretary
Male95.5
Female4.5
0.0 20.0 40.0 60.0 80.0 100.0
Sex
Black63.1
White36.6
Other0.3
0.0 20.0 40.0 60.0 80.0 100.0
Race
Other Offenders
78.7%
Geriatric Population
21.3%
6,630
7,081 7,251 7,314 7,310
7,464 7,471
6,000
6,500
7,000
7,500
8,000
2011 2012 2013 2014 2015 2016 2017
Trend
41

FACT SHEET
September 30, 2017
53.4
13.4
14.1
19.1
39.9
14.7
9.9
9.5
11.6
10.6
2.0
Unknown 1.8
Max Sent to be Served
(Yrs)Percent of Population
All Other Crimes
Property Crimes
Drug Crimes
Violent Crimes0-2
3-4
Most Serious
Commitment Crime
4.4
3.3
Demographic Profiles of theGeriatric Correctional Population
Demographic Profiles of theGeriatric Correctional Population
* Offender class is the number of sequential felonies committed for which an offender has been convicted.
*Average time served: 12.7 yrs.
7.6
12.0
9.6
Death
5-6
7-10
11-16
17 - 20
41+
Pending Calculation/
Re-calculation0.6
Avg Sentence: 22.80 Yrs
0.3 6-10
>20 (Fixed Term)
Life
Percent of PopulationTime Served
8.1
22.1
32.0 0-5
31-40
11-15
16 - 20
21-30
Percent
7.03.4
8.012.0
2.9
18.7
2.8 2.36.1
2.6
34.2
0
5
10
15
20
25
30
35
40
Per
cen
t
Parishof
Commitment
2909
2224
1308
637
237100 56
0
600
1200
1800
2400
3000
3600
# G
eria
tric
Po
pu
lati
on
Current Age:55.7 yrsavg. age 2040
1434 1356 1023677 764
1770
2000
4000 *OffenderClass
19 35 59
416525 555
677847
1141
1630 1537
30
0
400
800
1200
1600
2000
# G
eria
tric
Po
pu
lati
on
Conviction Age:42.3 yrsavg. age
2.56.4
4.89.3
2.3
31.5
4.5 6.6
34.6
0
20
40
Per
cen
t
FacilityBreakdown
42
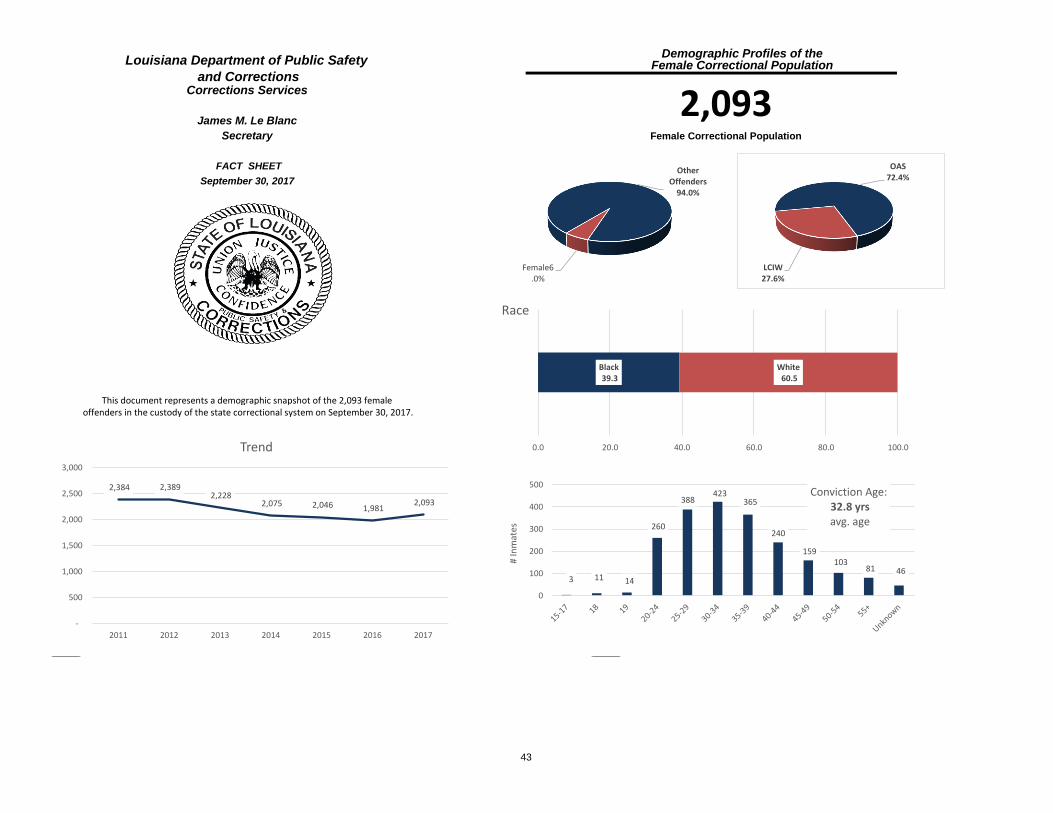
Demographic Profiles of theLouisiana Department of Public Safety
and Corrections
Secretary
September 30, 2017
This document represents a demographic snapshot of the 2,093 female offenders in the custody of the state correctional system on September 30, 2017.
2,093Female Correctional Population
Corrections Services
James M. Le Blanc
FACT SHEET
Female Correctional Population
Black39.3
White60.5
0.0 20.0 40.0 60.0 80.0 100.0
Race
3 11 14
260
388423
365
240
159103
81 46
0
100
200
300
400
500
# In
mat
es
Conviction Age:32.8 yrs avg. age
Other Offenders
94.0%
Female6.0%
LCIW27.6%
OAS72.4%
2,384 2,389 2,228
2,075 2,046 1,981 2,093
-
500
1,000
1,500
2,000
2,500
3,000
2011 2012 2013 2014 2015 2016 2017
Trend
43

FACT SHEET
34.6 80.4
31.0 7.9
22.1 4.1
12.3 2.8
2.7
2.1
*Average time served: 6.09 yrs.
Total Population 2,093 10.8 578 18.0 8
821 7.7 142 14.1 6.3
Dim.Sent.Eligible 849 12.5 259 18.5 9.8
203 9.7 5 0.9 198
347 16.6 34 5.9 313
446 21.3 67 11.6 379
402 19.2 117 20.2 285
165 7.9 49 8.5 116
103 4.9 42 7.3 61
150 7.2 130 22.5 20
1 0.0 1 0.2 0
2093 100.0 578 100.0 1515 100.0
Unknown
Average Maximum Sentence
Category# Inmates in
Total Pop
*(Includes Life computed as 21 and Death as 13 years.)
Parole Eligible
Avg. Max
Sentence in
Tot Pop
# Inmates in
State
Facilities
Avg. Max Sent. In
Local Jails# Inmates in Local Jails
4.0
Death
** Offender class is the number of sequential felonies committed for which an offender has been
convicted
Years
Maximum Years
Sentenced
0.2 66
0.0
22.8 77 5.1
Life
>20
(Fixed Term) 10.0 132209
17 - 20
Demographic Profiles of theFemale Correctional Population Female Correctional Population
16 - 20
21 +
Property Crimes
Drug Crimes
Violent Crimes
Time Served (Yrs)
Percent of
Population
0-5
6-10
11-15
All Other Crimes
Demographic Profiles of the
PercentMost Serious
Commitment
Crime
5-6 25.0
0-2 13.1
3-4 20.7
# Inmates
in Total
Pop
679
590
Avg. Max
Sent. in State
Facilities
1,515
September 30, 2017
Avg Sentence Length: 10.90 Yrs
% of Local Pop
# Inmates
in Local
Pop
% of State
Pop
# Inmates in
State
Facilities
% of Total
Pop
7-10 18.8
11-16 7.7
4.467
1.3
Pending Calculation/
Re-calculation3.2 1
0 0 123
132
331
398 390
277
194157
190
0
100
200
300
400
500
# In
mat
es
Current Age: 35.9 yrs avg. age
875
557
348
17267
3242
0
200
400
600
800
1000
# In
mat
es
OffenderClass
5.7 5.99.5
2.14.8
9.7
3.0
9.1
50.2
0.0
10.0
20.0
30.0
40.0
50.0
60.0
Per
cen
t
Parishof
Commitment
44
Demographic Profiles of theLouisiana Department of Public Safety
and Corrections
Secretary
September 30, 2017
Corrections Services
James M. Le Blanc
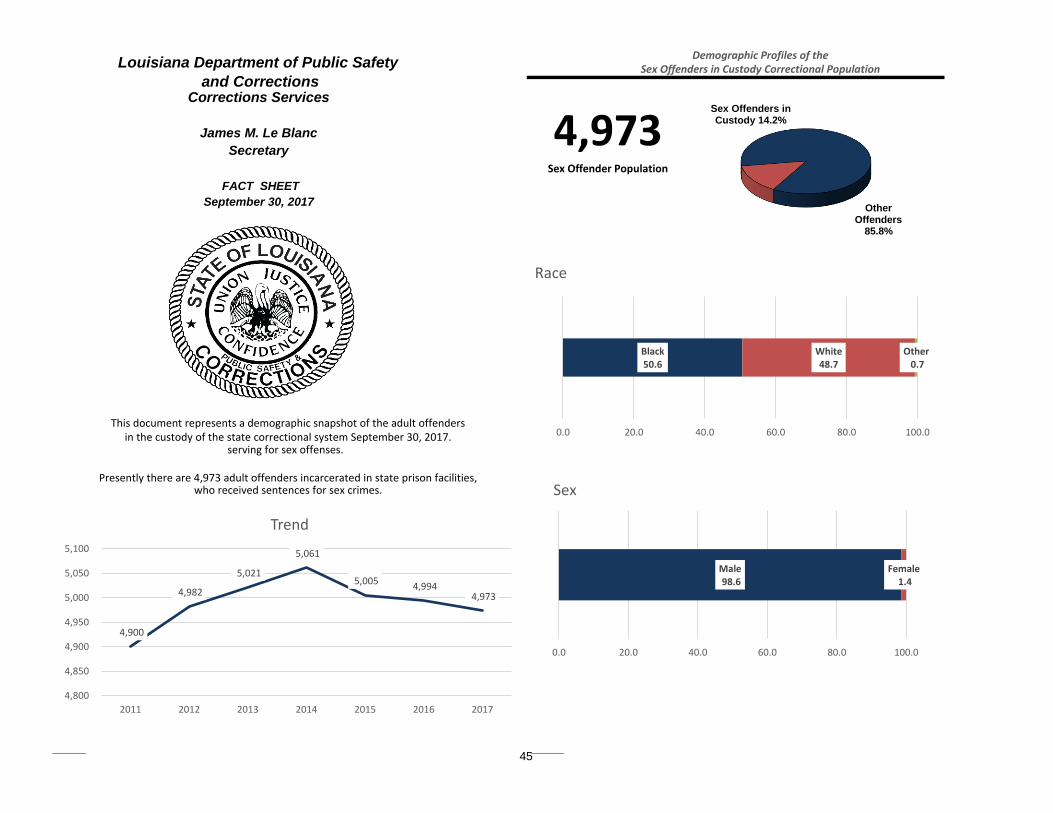
serving for sex offenses. in the custody of the state correctional system September 30, 2017.
This document represents a demographic snapshot of the adult offenders
who received sentences for sex crimes.Presently there are 4,973 adult offenders incarcerated in state prison facilities,
4,973Sex Offender Population
FACT SHEET
Sex Offenders in Custody Correctional Population
Male98.6
Female1.4
0.0 20.0 40.0 60.0 80.0 100.0
Sex
Black50.6
White48.7
Other0.7
0.0 20.0 40.0 60.0 80.0 100.0
Race
Sex Offenders in Custody 14.2%
Other Offenders
85.8%
4,900
4,982
5,021
5,061
5,005 4,994
4,973
4,800
4,850
4,900
4,950
5,000
5,050
5,100
2011 2012 2013 2014 2015 2016 2017
Trend
45

FACT SHEET
50.4 58.6
20.4 1.2
10.3 1.4
6.7 38.8
12.0
0.2
`
>20 (Fixed Term)
Demographic Profiles of theSex Offenders in Custody Correctional Population
Time Served (Yrs)
All Other Crimes
21 +
September 30, 2017
Demographic Profiles of the
Property Crimes
** Offender class is the number of sequential felonies committed for which an
Percent
Sex Offenders in Custody Correctional Population
offender has been convicted
Violent Crimes
Most Serious
Commitment Crime
Percent of
Population
6-10
11-15
16 - 20
Max Sent to be Served
(YRS)
17 - 20
11 - 16
7 - 10
5 - 6
3 - 4
0-2
Pending Calculation/Re-
calculation
*Average time served: 8.48 yrs.
Unknown
0.3
0-5
3.0
48.0
Percent of Population
4.1
0.0
10.1
13.9
Drug Crimes
8.1
11.1
1.4
Death
Life
0 2 12 35
221
433549 550 583
653 644
1291
0100200300400500600700800900
10001100120013001400
# In
mat
es
Current Age: 41.8 yrs avg. age
2487
1161716
328 135 71 750
400800
1200160020002400
# In
mat
es
OffenderClass
32 61119
726 771 772700
585
434323
449
10
200
400
600
800
1000
# In
mat
es
Conviction Age: 34.0 yrs avg. age
6.84.5
8.7 9.4
3.1
10.6
3.3 3.07.1
3.5
40.0
0.0
10.0
20.0
30.0
40.0
Per
cen
t
Parishof
Commitment
46
Demographic Profiles of theLouisiana Department of Public Safety
and Corrections
Secretary
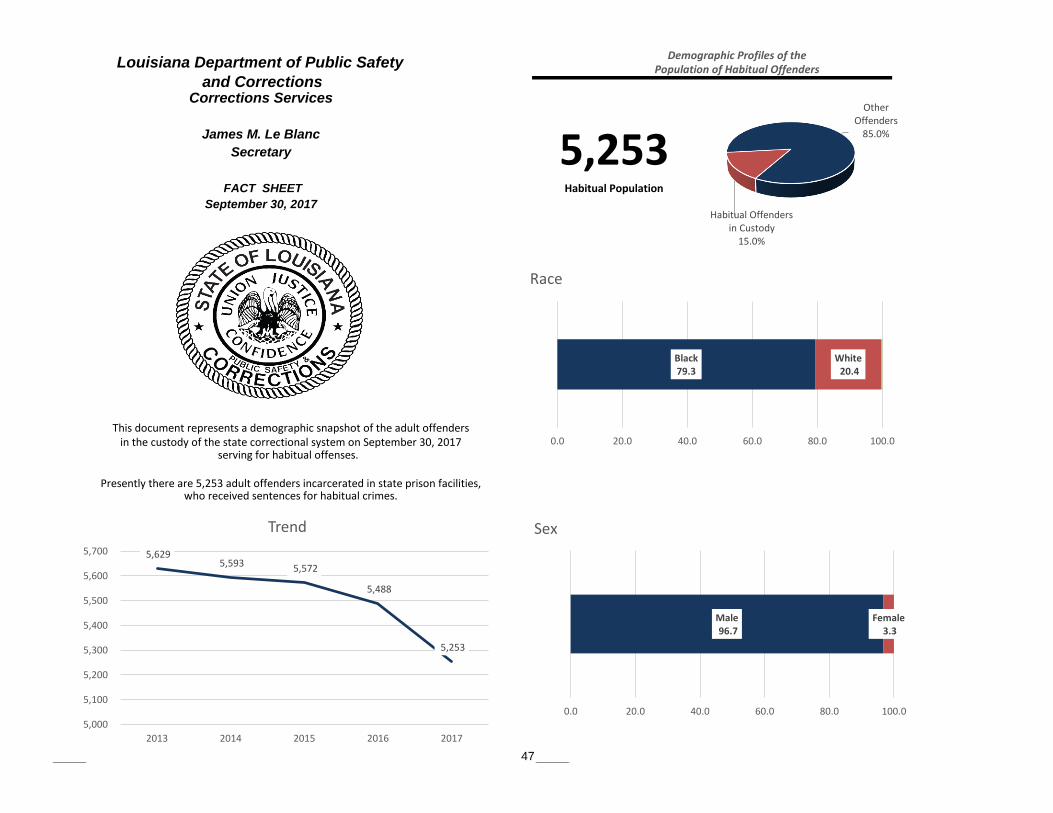
This document represents a demographic snapshot of the adult offendersin the custody of the state correctional system on September 30, 2017
serving for habitual offenses.
Presently there are 5,253 adult offenders incarcerated in state prison facilities,who received sentences for habitual crimes.
September 30, 2017
Corrections Services
James M. Le Blanc
FACT SHEET
Population of Habitual Offenders
5,253Habitual Population
Male96.7
Female3.3
0.0 20.0 40.0 60.0 80.0 100.0
Sex
Black79.3
White20.4
0.0 20.0 40.0 60.0 80.0 100.0
Race
Habitual Offenders in Custody
15.0%
Other Offenders
85.0%
5,629 5,593 5,572
5,488
5,253
5,000
5,100
5,200
5,300
5,400
5,500
5,600
5,700
2013 2014 2015 2016 2017
Trend
47
Percent of
Population
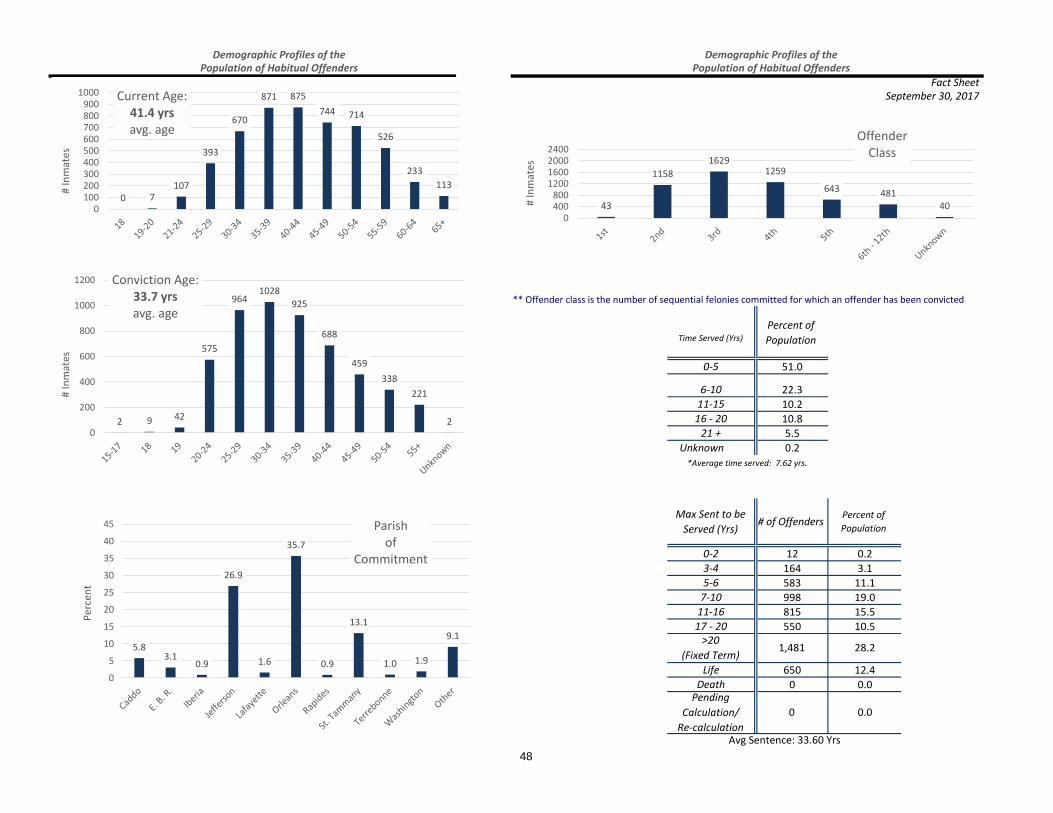
51.0
22.3
10.2
10.8
5.5
Unknown 0.2
12 0.2
164 3.1
583 11.1
998 19.0
815 15.5
550 10.5
650 12.4
0 0.0
Percent of
Population
Max Sent to be
Served (Yrs)
0-2
Avg Sentence: 33.60 Yrs
Pending
Calculation/
Re-calculation
0
>20
(Fixed Term)
0.0
28.2
*Average time served: 7.62 yrs.
Death
17 - 20
# of Offenders
3-4
11-16
7-10
Life
1,481
5-6
** Offender class is the number of sequential felonies committed for which an offender has been convicted
Demographic Profiles of thePopulation of Habitual Offenders
Demographic Profiles of thePopulation of Habitual Offenders
September 30, 2017Fact Sheet
Time Served (Yrs)
21 +
16 - 20
11-15
6-10
0-5
0 7107
393
670
871 875
744 714
526
233
113
0100200300400500600700800900
1000
# In
mat
es
Current Age: 41.4 yrs avg. age
43
1158
16291259
643 48140
0400800
1200160020002400
# In
mat
es
OffenderClass
2 9 42
575
9641028
925
688
459
338
221
20
200
400
600
800
1000
1200
# In
mat
es
Conviction Age: 33.7 yrs avg. age
5.83.1
0.9
26.9
1.6
35.7
0.9
13.1
1.0 1.9
9.1
0
5
10
15
20
25
30
35
40
45
Per
cen
t
Parishof
Commitment
48
FACT SHEET
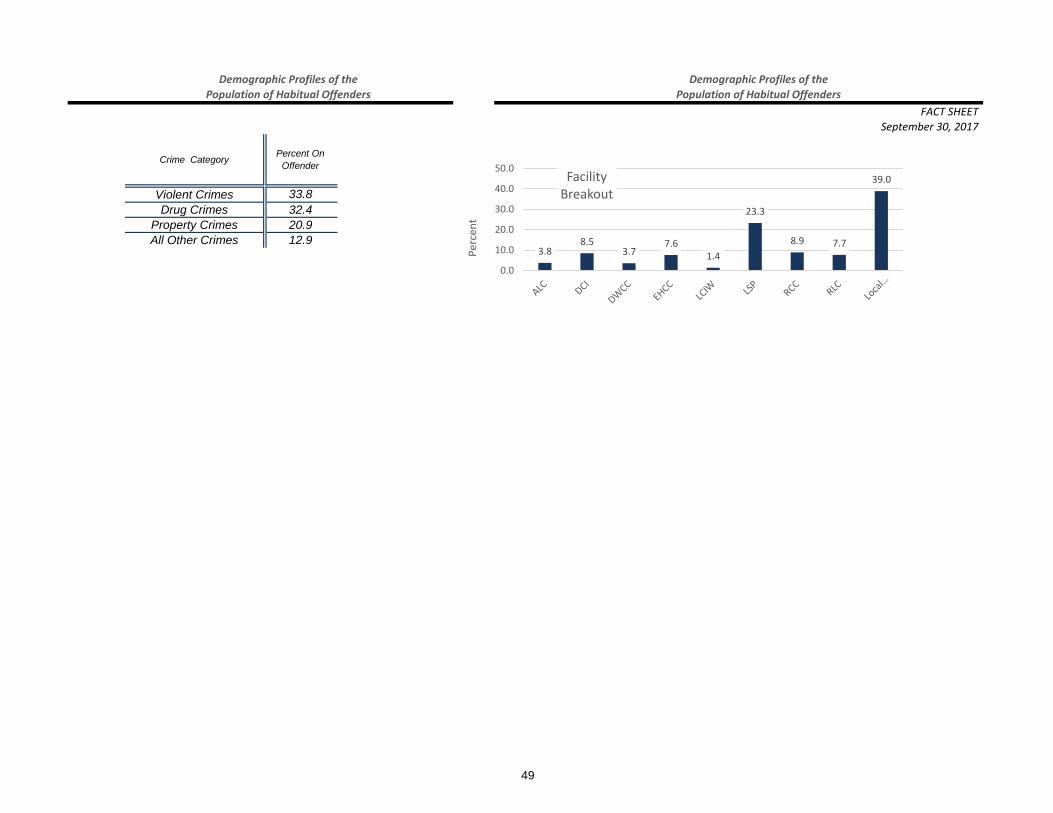
33.8
32.4
20.9
12.9
Crime Category
September 30, 2017
All Other Crimes
Demographic Profiles of the Demographic Profiles of the
Population of Habitual Offenders Population of Habitual Offenders
Percent On
Offender
Property Crimes
Drug Crimes
Violent Crimes
3.88.5
3.77.6
1.4
23.3
8.9 7.7
39.0
0.0
10.0
20.0
30.0
40.0
50.0
Per
cen
t
Facility Breakout
49