low carbon futures and natural gas: bridge or … carbon futures and natural gas: bridge or barrier?...
TRANSCRIPT

Low Carbon Futures and Natural
Gas: Bridge or Barrier?
Ralph Torrie
Carleton University, Ottawa, February 26, 2013
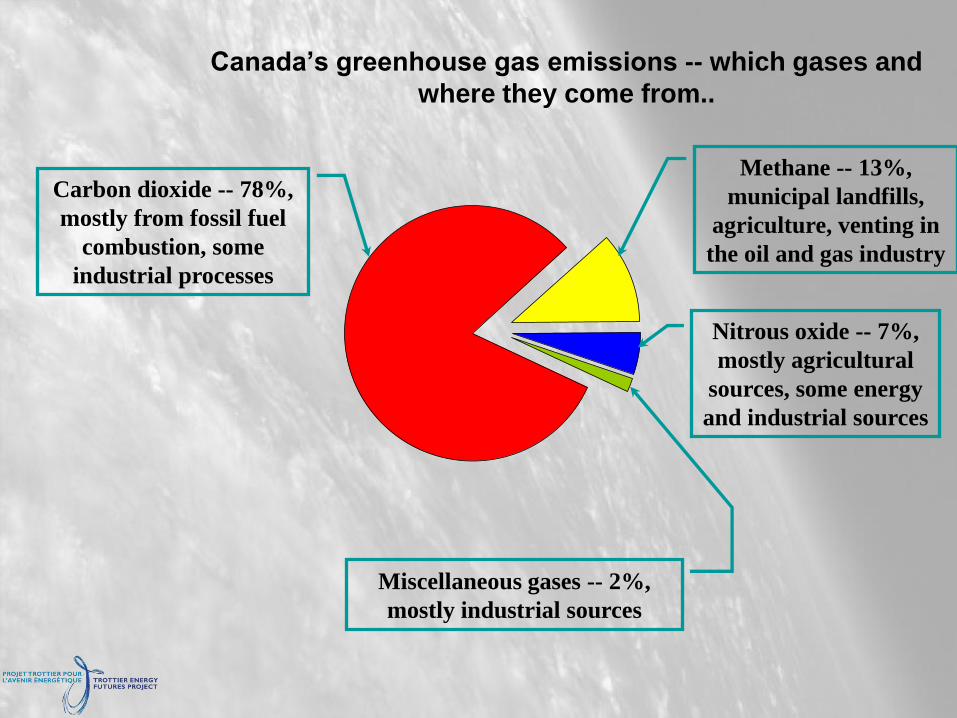
Canada’s greenhouse gas emissions -- which gases and
where they come from..
Miscellaneous gases -- 2%,
mostly industrial sources
Methane -- 13%,
municipal landfills,
agriculture, venting in
the oil and gas industry
Nitrous oxide -- 7%,
mostly agricultural
sources, some energy
and industrial sources
Carbon dioxide -- 78%,
mostly from fossil fuel
combustion, some
industrial processes
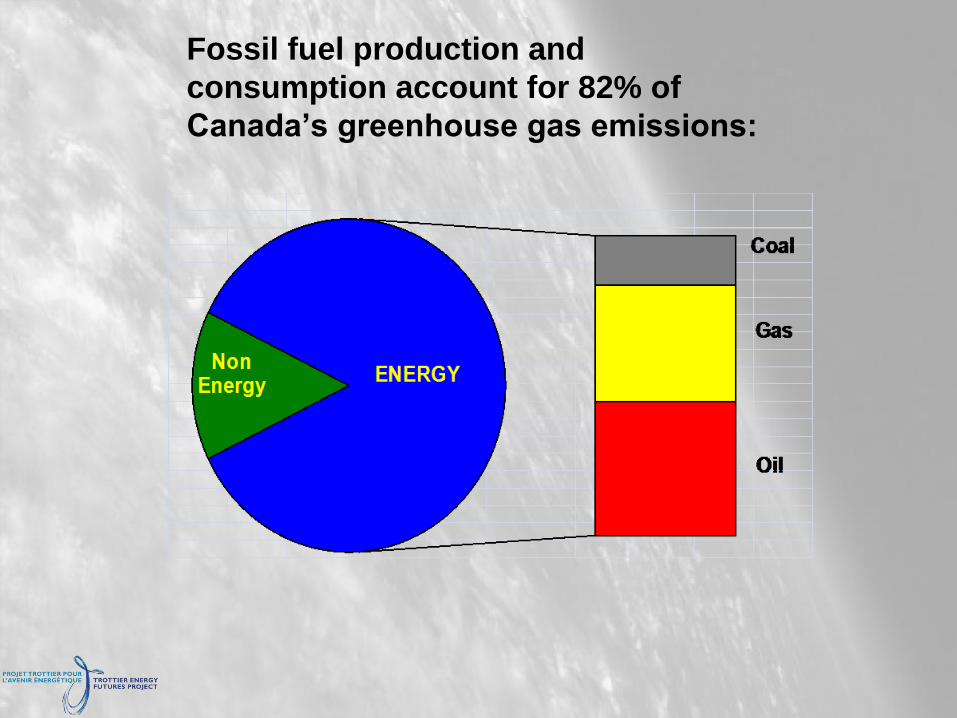
Fossil fuel production and
consumption account for 82% of
Canada’s greenhouse gas emissions:

Emissions from two perspectives…
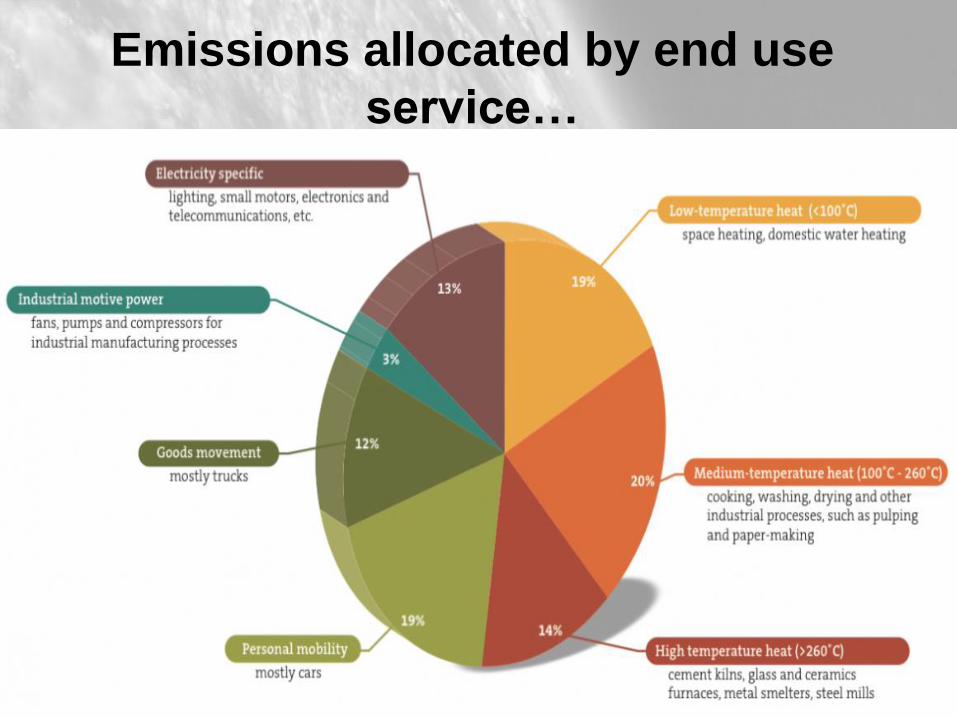
Emissions allocated by end use
service…
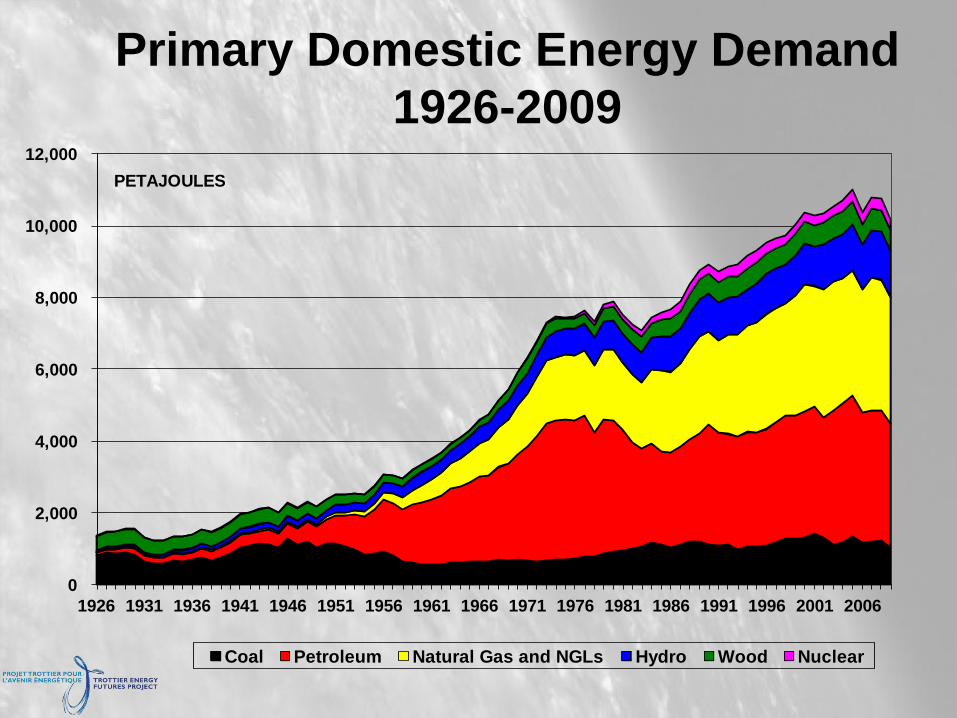
Primary Domestic Energy Demand
1926-2009
0
2,000
4,000
6,000
8,000
10,000
12,000
1926 1931 1936 1941 1946 1951 1956 1961 1966 1971 1976 1981 1986 1991 1996 2001 2006
PETAJOULES
Coal Petroleum Natural Gas and NGLs Hydro Wood Nuclear

0
100
200
300
400
500
600
1926 1936 1946 1956 1966 1976 1986 1996 2006
Energy Related GHG Emissions in Canada (Mt CO2e)1926-2009

Mt CO2e
?
To reduce Canadian energy-related GHG emissions by 80% relative
to 1990 implies reducing them to 100 Mt CO2e, about the level they
were at just prior to World War II:
0
100
200
300
400
500
600
1926 1946 1966 1986 2006 2026 2046
Target Emissions Level: 100 Mt CO2e

Selected Indicators from Low Carbon Scenarios
AUSI 2002
(Australia)
EREC 2010
(Canada)
RMI 2011
(USA)
PMO 2009
(Finland)
MIES 2004
(France)
BMU 2008
(Germany)
IVL 2010
(Sweden)
EKERC
2009
(UK)
Per capita end use of energy, GJ
In 2009 140 216 181 180 96 103 137 84
In 2050 129 96 111 115 91 78 125 58% Reduction 8% 56% 39% 36% 5% 24% 9% 31%
End use energy per GDP, GJ
in 2009 5.8 8.6 4.9 6.8 4.2 4.2 4.4 3.1
In 2050 3.9 0.7 1.8 1.2 0.5 0.3 1.1 1.6Energy
Productivity
Improvement
33% 92% 63% 82% 88% 93% 75% 48%
Carbon intensity of end use of energy, kg CO2e/GJ
In 2009 127.7 71.5 93.1 57.1 57.0 88.9 32.8 89.7
In 2050 30 7 16 11 6 4 9 27Reduction in
Carbon
Intensity of
Energy
77% 90% 83% 81% 89% 96% 73% 70%
Emissions intensity of GDP, kg CO2e per thousand USD
In 2009 738 615 457 390 241 375 146 278
In 2050 77 17 26 24 11 7 17 32
Reduction
Emissions
Intensity of
GDP
90% 97% 94% 94% 95% 98% 88% 88%
Per capita greenhouse gas emissions, tonnes CO2e
In 2009 17.9 15.4 16.9 10.3 5.5 9.2 4.5 7.5
In 2050 3.9 0.7 1.8 1.2 0.5 0.3 1.1 1.6
Reduction
per capita
GHG
emissions
78% 95% 89% 88% 91% 97% 76% 79%
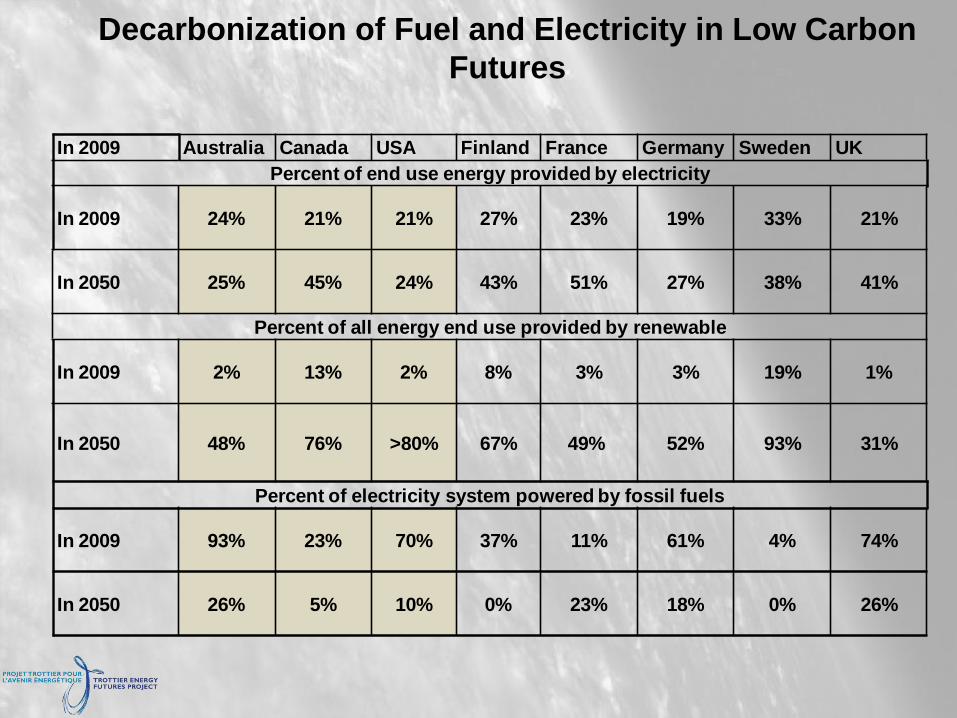
Decarbonization of Fuel and Electricity in Low Carbon
Futures
In 2009 Australia Canada USA Finland France Germany Sweden UK
Percent of end use energy provided by electricity
In 2009 24% 21% 21% 27% 23% 19% 33% 21%
In 2050 25% 45% 24% 43% 51% 27% 38% 41%
Percent of all energy end use provided by renewable
In 2009 2% 13% 2% 8% 3% 3% 19% 1%
In 2050 48% 76% >80% 67% 49% 52% 93% 31%
Percent of electricity system powered by fossil fuels
In 2009 93% 23% 70% 37% 11% 61% 4% 74%
In 2050 26% 5% 10% 0% 23% 18% 0% 26%

2050 Electricity Supply in Low Carbon Scenarios (PJ)
Petajoules
AUSI 2002
(Australia)
EREC
2010
(Canada)
RMI
2011
(USA)
FPMO
2009
(Finland)
MIES 2004
(France)
BMU 2008
(Germany)
IVL 2010
(Sweden)
UKERC
2009
(UK)
Hydro electricity 0 1,572 995 55 89 245 31
Wind electricity 500 396 5,897 67 672 188
Solar photovoltaics 100 43 5,163 0 100 0
Concentrated solar power
0 0 920 0 327 0
Electricity from Biomass
157 7 192 14 194 59 38
Geothermal 91 0 228 0 128 387
Wave or tidal energy 0 50 0 0 64
Unspecified caarbon-free electricity
0 0 0 0 924 190 263 0
Nuclear0 0 0 150 1710 0
Included above
769
Total carbon-free electricity
847 2,041 13,395 286 2,634 1,699 566 1,477
Carbon-free as percent of electricity supply
74% 95% 90% 100% 77% 82% 100% 74%
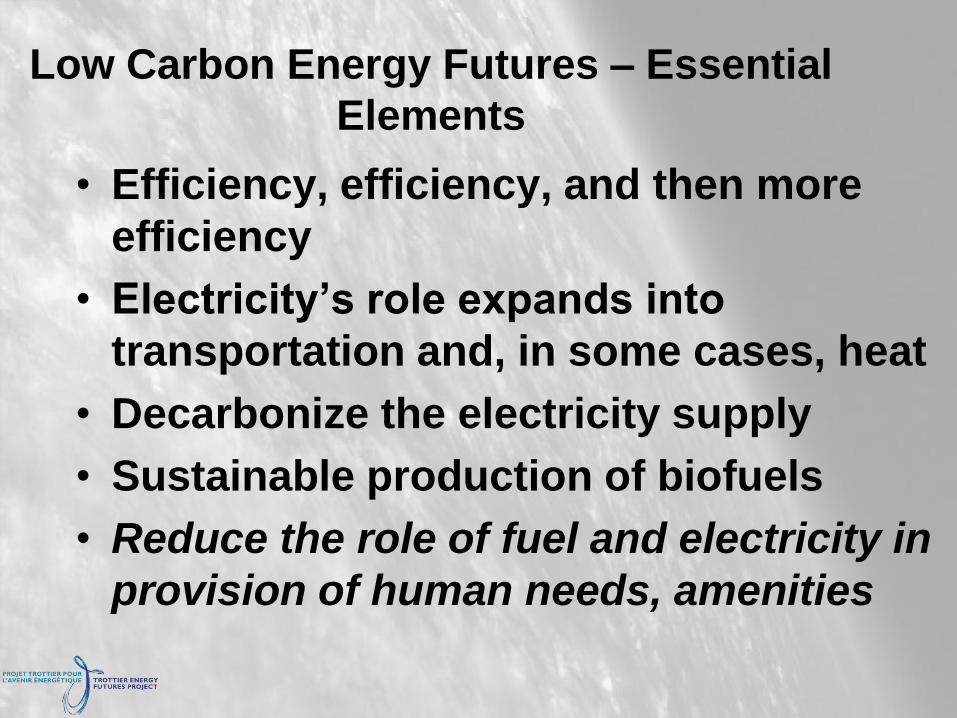
Low Carbon Energy Futures – Essential
Elements
• Efficiency, efficiency, and then more
efficiency
• Electricity’s role expands into
transportation and, in some cases, heat
• Decarbonize the electricity supply
• Sustainable production of biofuels
• Reduce the role of fuel and electricity in
provision of human needs, amenities

Turkey
Mexico Chile SWEDEN
Hungary Portugal Switzerland
France Slovak Spain
Iceland Italy New Zealand Slovenia
Poland UNITED KINGDOM Austria Norway
Greece Denmark
Japan Israel Ireland
Germany Belgium
FINLAND
Czech Korea Netherlands Estonia
CANADA
US
Australia
0
2
4
6
8
10
12
14
16
18
20
0% 5% 10% 15% 20% 25% 30% 35% 40% 45% 50%
Percent of Primary Energy Provided by Natural Gas
Per capita GHG Emissions for OECD vs. Percent of Primary Energy Provided by Natural Gas
Per capita GHG
Emissions (tonnes)

0
2,000
4,000
6,000
8,000
10,000
12,000
1926 1931 1936 1941 1946 1951 1956 1961 1966 1971 1976 1981 1986 1991 1996 2001 2006
PETAJOULES
Hydro Biomass Nuclear Natural Gas
If all Canada's fossil fuel
consumption were natural
gas...
What if?...

0
100
200
300
400
500
600
0
2,000
4,000
6,000
8,000
10,000
12,000
1926 1931 1936 1941 1946 1951 1956 1961 1966 1971 1976 1981 1986 1991 1996 2001 2006
Mt CO2 PETAJOULES
Hydro Biomass
Nuclear Natural Gas
What if?...
GHG emissions if all Canada's
fossil fuel consumption were
natural gas...
Actual historical GHG
emissions from
Canadian primary
0
100
200
300
400
500
600
700
800
0
2,000
4,000
6,000
8,000
10,000
12,000
1926 1931 1936 1941 1946 1951 1956 1961 1966 1971 1976 1981 1986 1991 1996 2001 2006
Mt CO2e Petajoules
Hydro Biomass Nuclear
Coal Oil Emissions if no natural gas
Actual GHG Emissions
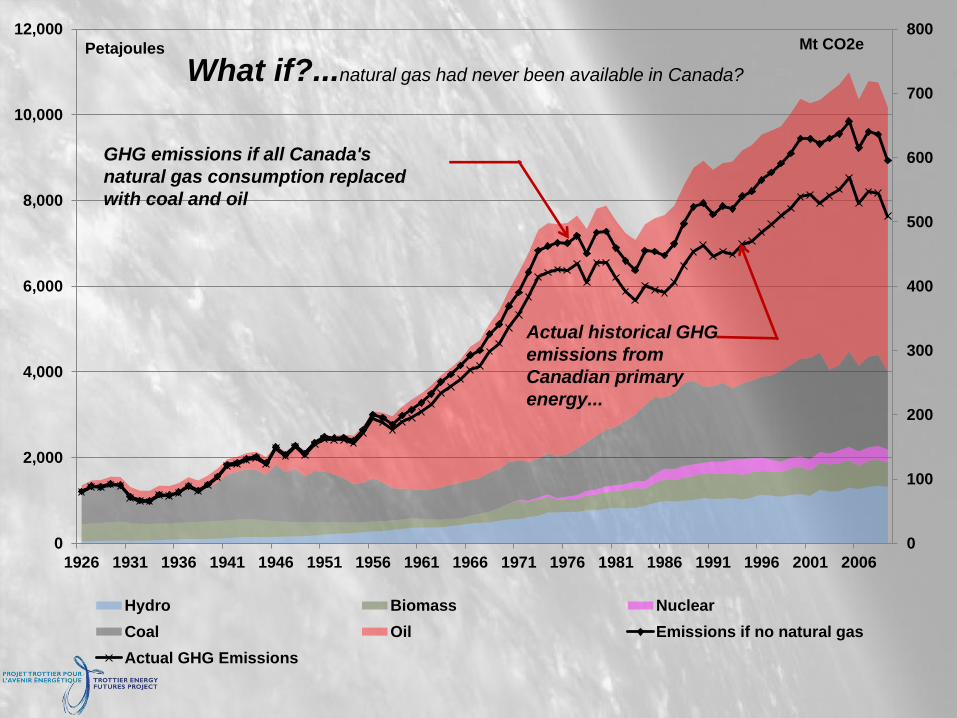
What if?...natural gas had never been available in Canada?
Actual historical GHG
emissions from
Canadian primary
energy...
GHG emissions if all Canada's
natural gas consumption replaced
with coal and oil

0
100
200
300
400
500
600
700
800
0
2,000
4,000
6,000
8,000
10,000
12,000
14,000
1926 1931 1936 1941 1946 1951 1956 1961 1966 1971 1976 1981 1986 1991 1996 2001 2006
Mt CO2e Petajoules
Biomass Nuclear
Coal Oil
Natural Gas Augmented Emissions if hydro replaced with gas power
Actual Emissions
GHG emissions if all hydro replaced
with gas power plants
Actual historical GHG
emissions from Canadian
primary energy...
What if?... hydroelectricity replaced with gas plants?
0
100
200
300
400
500
600
700
0
2,000
4,000
6,000
8,000
10,000
12,000
14,000
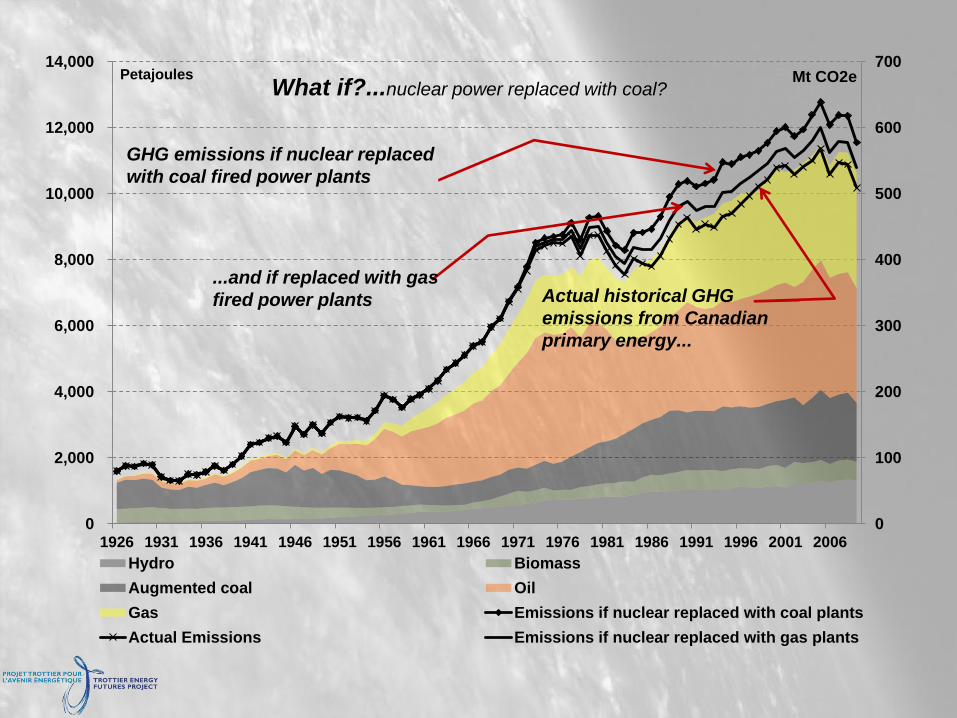
1926 1931 1936 1941 1946 1951 1956 1961 1966 1971 1976 1981 1986 1991 1996 2001 2006
Mt CO2e Petajoules
Hydro Biomass
Augmented coal Oil
Gas Emissions if nuclear replaced with coal plants
Actual Emissions Emissions if nuclear replaced with gas plants
GHG emissions if nuclear replaced
with coal fired power plants
Actual historical GHG
emissions from Canadian
primary energy...
...and if replaced with gas
fired power plants
What if?...nuclear power replaced with coal?

Analyzing energy productivity…
“I’m right there in the room, and no one even acknowledges me.”

Relative growth of population, energy,
CO2 emissions and GDP – the long view…
-
2
4
6
8
10
12
14
16
18
20
1926 1931 1936 1941 1946 1951 1956 1961 1966 1971 1976 1981 1986 1991 1996 2001 2006
1926-1.0
GDP CO2 Emissions Domestic Energy Demand Population

0
5,000
10,000
15,000
20,000
25,000
Coal Oil Gas Hydro Wood Nuclear Energy Productivity
Petajoules
Two eras of post-War energy: from 1946 to early 1970’s, fuel
and electricity grew with economic output, starting in the
1970’s energy productivity improvements have outstripped
fuel and electricity growth.

(500)
0
500
1,000
1,500
2,000
2,500
3,000
3,500
Coal Oil Gas Hydro Wood Nuclear Energy
Productivity
Petajoules
New sources of energy from 1946 to 1971,
when growth in oil, gas and hydropower
tracked GDP:
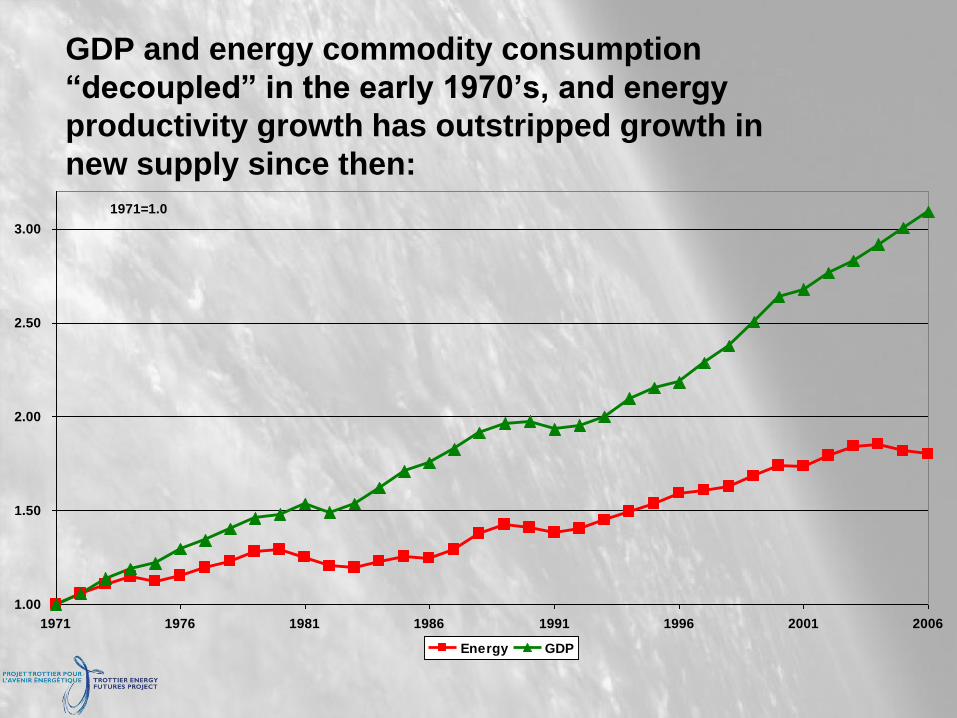
1.00
1.50
2.00
2.50
3.00
1971 1976 1981 1986 1991 1996 2001 2006
1971=1.0
Energy GDP
GDP and energy commodity consumption
“decoupled” in the early 1970’s, and energy
productivity growth has outstripped growth in
new supply since then:

0
1,000
2,000
3,000
4,000
5,000
6,000
7,000
8,000
9,000
Coal Oil Gas Hydro Wood Nuclear Energy
Productivity
Petajoules
New supply from 1971-2006
compared to energy productivity
growth over the same period:
0
200
400
600
800
1,000
1,200
1,400
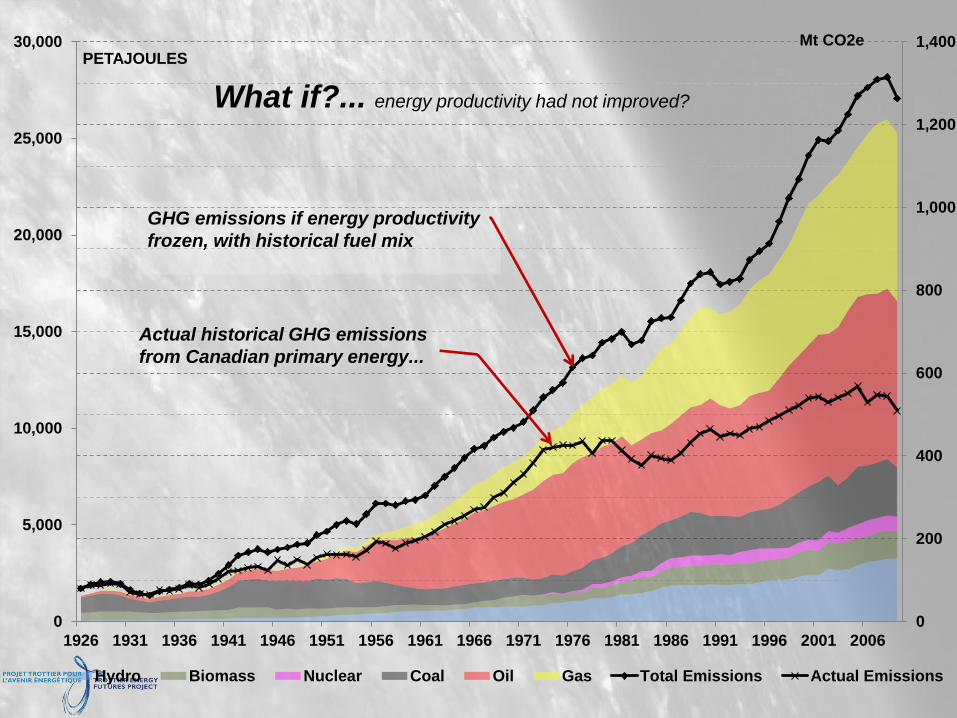
0
5,000
10,000
15,000
20,000
25,000
30,000
1926 1931 1936 1941 1946 1951 1956 1961 1966 1971 1976 1981 1986 1991 1996 2001 2006
Mt CO2e PETAJOULES
Hydro Biomass Nuclear Coal Oil Gas Total Emissions Actual Emissions
Actual historical GHG emissions
from Canadian primary energy...
What if?... energy productivity had not improved?
GHG emissions if energy productivity
frozen, with historical fuel mix

0
200
400
600
800
1000
1200
1400
1926 1931 1936 1941 1946 1951 1956 1961 1966 1971 1976 1981 1986 1991 1996 2001 2006
Emissions without energy productivityimprovements
Emissions if only fossil fuels were coal and oil
ACTUAL HISTORICAL EMISSIONS
Emissions if all fossil fuel were natural gas

Reference Case Emissions by Sector
0
100
200
300
400
500
600
700
800
1978 1983 1988 1993 1998 2003 2008 2013 2018 2023 2028 2033 2038 2043 2048
Mt
Oil and Gas
elec gen
industrial
freight transport
passenger transport
commercial
residential

Conceptual Framework for
Reducing Energy-Related GHGs
Three broad levers available to lower
emissions:
* Carbon management (CCS) considered final lever due to cost/tonne
Consumption Per Unit
of Activity
Decarbonization/
Fuel Switching Activity Level
• The efficiency with
which fuel, electricity
are used to deliver
energy services
• No- and low-carbon
fuels
• Carbon capture
• The level and pattern
of activity in the
economy that
generates demand for
energy services
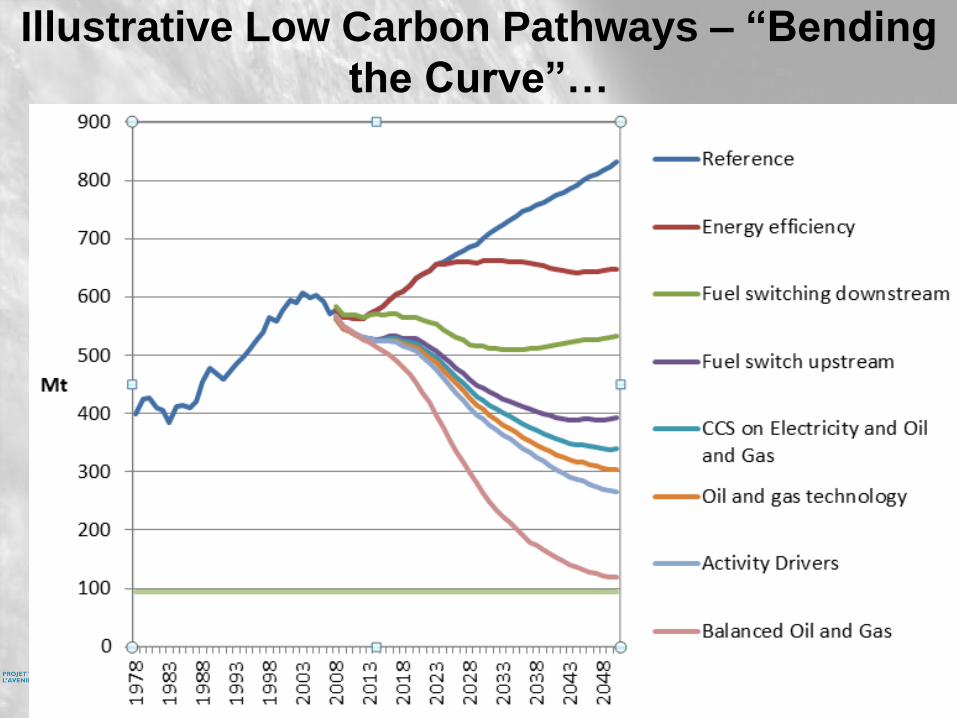
Illustrative Low Carbon Pathways – “Bending
the Curve”…
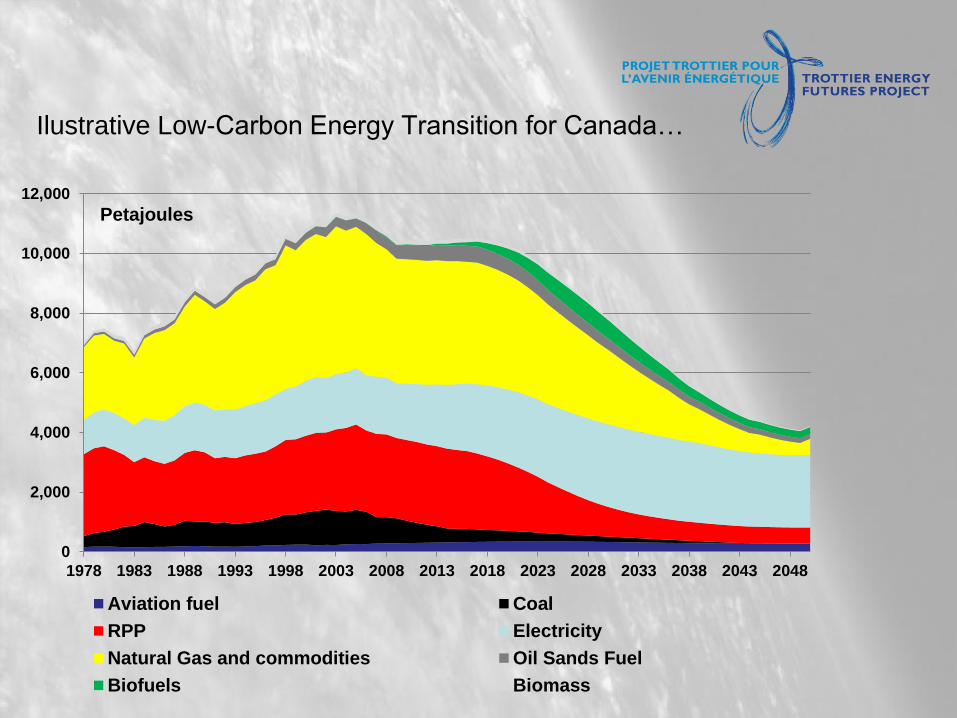
0
2,000
4,000
6,000
8,000
10,000
12,000
1978 1983 1988 1993 1998 2003 2008 2013 2018 2023 2028 2033 2038 2043 2048
Aviation fuel Coal
RPP Electricity
Natural Gas and commodities Oil Sands Fuel
Biofuels Biomass
Petajoules
Ilustrative Low-Carbon Energy Transition for Canada…

Synthesis: Energy
Subsystem Transformed
Energy Intensive Industries Integrative
Industrial Design
Access/ Mobility/ Personal Transport
Supply Chains and
Goods Movement
Buildings: Comfort,
Convenience and Health
Electricity and the Future Grid
Fossil Fuel Production
Bioenergy
Education/Training
Investment/Finance
Industrial Strategy
The Trottier Challenges of a Low Carbon Future…
For more see http://www.trottierenergyfutures.ca/the-challenges/

Low Carbon Futures and Natural Gas: Bridge or Barrier? Ralph Torrie, Managing Director
Trottier Energy Futures Project [email protected]
www.trottierenergyfutures.ca
THANK YOU!