low cost and practical solar fruit drying …pdf.usaid.gov/pdf_docs/pnabd887.pdfa mechanical fan or...
TRANSCRIPT

LOW COST AND PRACTICAL SOLAR FRUIT DRYING SYSTEMFOR DEVELOPING COU1~RIES
FINAL REPORTContract No. DAN-5053-G-SS(October 1987 - June 1989)
U. S. AGENCY FOR INTERNATIONAL DEVELOPMENTWashington, D. C..
By
D. Y. Goswami, A. Shahbazj, A. Lavania and M. Mahmood
North Carolina A &T State University'Greensboro, N. C. 27411
November, 1989

S. No. TITLE
TABLE OF CONTENTS
PAGE
1. INTRODUCTION 1
2. LITERATURE REVIEW 5
3. DESIGN AND FABRICATION OF GEODESIC DOME 8
Is. INSTRUMENTATION AND PROCEDURE 32
5. THERMAL SIMULATION OF THE SOLAR FRUIT DRYER 37
6. RESULTS 4-3
7. CONCLUSIONS 69
REFERENCES 70

CHAPTER 1
INTRODUCTION
Drying involves the process of removing moisture from agricultural
crops and products for high quality,nd safe storage. The process in
cludes both heat and mass transfer. Drying is accomplished by solar
energy or other resources such as natural gas, propane, oil and wood.
Uti';zation af solar energy for drying is the process in which solar
radiation is converted to thermal energy.
Most driers in the U.S.A are run on fossil fuels. Whenever solar
energy is utilized, it is in the form of supplemental heat. The main
reason for the low use of solar energy is that long term thermal storage
of solar energy has been impractical or inefficient. However in develop
ing countries where fossil fuel is a rare commodity, solar energy holJS
much greater potential.
Solar dryers can be classified into two categories, i.e. natural
convection dryer~ and forced convection dryers. Natural convection
dryers do not require any mechanical or electrical power to circulate
the air through the product. Natural or forced convection dry~rs can
also be classified into three categories, depending upon their heating
modes.
1. Direct solar dryers in which the product directly collects
energy from the sun.
2. Indirect solar dryers in which the product is dried with warm
air heated separately by solar air heaters. The product to be
dried does not see the sun directly in this case. Figure 1.1
shows a simple solar dryer that is a combination of the direct
and the indirect types.
3. Industrial type dryers in ~hich the system utilizes solar and
non-solar heating energy. These dryers usually are of continuoustype and have large capacities. Figure 1.2 shows an industrial
type paral191 flow fruit dryer.
A greenhouse type of solar drier can be set up as an indirect or a
direct drier depending on whether a layer of opaque absorber is placed
between the outer transparent glazing and the product, or not. Such a
cryer can be set up to work in the natural convection or the forced con
vection mode. For drying purposes, the amount of solar energy collected
is an important critel"ion. The geometric shape of the greenhouse deter
mines the amount of energy collected at any location. It was estimated
that a geodasic dome performs better than other geometric shapes. Figure
1.3 shows the structure of a geodesic dome. A complete design procedure
for geodesic dome greenhouse is given in Chapter 3. A geodesic dome
type of solar fruit dryer ~as designed and constructed. It is located at
the Enviromental Laboratory at the N.C.A&T State University form. In
this study experiments on drying grapes were cond~cted uSing these
facilities. Complete data were recorded using a portable automatic data
acquisition system. The data obtained was plotted and compared with
theort>ical simulation results.
2

CHAPTER 2LITERATURE REVIEW
In direct solar dryers, the material is placed in shallow layers on
trays inside a hot box and is 1irectly exposed to solar radiation. A
dryer of this type consists of an enclosure with a transparent cover
which produces a greenhouse environment in~ide the enclosure. These
dryers are sometimes called cabinet dryers. In this case one side of the
cabinet is glazed to admit solar radiation. This radiation is then co~
verted to low grade heat which heats up the air and the product inside
the cabinet. The solar heat causes the product moisture to evaporate and
move away with the circulating air. Air circulation is produced
naturally by the temperature difference between the hot air inside and
the cooler air outside. Drying is less 0fficient in these units and
takes more time. The efficiency can be significantly improved by adding
a mechanical fan or blower to these units. The fan forces the warm air
through the product and moves the mois~ air out of the cabinet. Lawand
[1J reported on a cabinet dryer which had 1.3 sq.meter drying bed. This
dryer reduced the drying time of various fruits by 5~_ to 65_ over
open-air sun drying.
Usually, direct solar dryers are relatively small. They come in
many different designs and are extensively used by individual farmers or
families of farmers in developing countries. Large direct dryers for use
in commercial operation, should be built as greenhouse- type structures.
Some advantages of greenhouse dryers over cabinet dryers are their large
capacities and greater degree of control over the drying process.
Gutierrez [2] used a 10x12 foot glass house for drying fruits. He
used a forced-air configuration in which the greenhouse air enters under
the thermal absorber, travels to the back of the greenhouse and then
rises to the top. The duct at the ~op brings the air down and forces it
through the fruit trays. This configuration provides a temperature rise
of 20-25 F above ambient. This drying facility can eaSily be scaled up
to a commercial size operation according to Gutierrez. Another
greenhouse-type solar dryer was desiged and studied by Huang [3]. The
unit is made up of a large multidirectional solar collector with a
transparent cover at the outside and interchangeable inner chambers with
black absorbing bodies for drying and curing purposes. Two types of
drying configurations can be placed inside the greenhouse; (a) a per-

r- ~utiet Port
Air Hea ter --
Insulat:or
;/
Drying T&ay~__~__~_
rr2.nsparentCover
1'ransparent Cover _--+-~
ig. 1.1 Cabinet type Solar Dryer with separate air heater
Discharge
South----~>--
Solar Collectors
Air
Fan
Hot air from solarCollectors
~~.~
I c===.:.::::::-= --=. --=--:-====-~======-
Frui t Carts
Fig. 1.2 Industrial type parallel flow dryer with solar collectors
4

(a) Perspective view of dome.
(b) Top view of dome.
Fig. 1.3 Geodesic - dome solar fruit dryer.
-5

forated and rotating drum, used
bulk rack for curing tobacco.~ruits. Curing tobacco in this
47 to 54% fuel saving over the
for drying groin and peanuts, and (b) a
The bulk rack can be modified for drying
facility provides quality tobacco with
conventional bulk-barn curing.
In Indirect solar dryers, the fruit is not exposed to direct solar
radiation. Mast designs in this category are made up of a hot air solar
collection system and a drying chamber. The chamber is usually insulated
and contains a series of screened trays to support the drying fruits.
The hot air from the solar collectors is fed into the drying chamber via
on inlet port at the bottom of the chamber. The hot air ascends up the
chamber drying the fruits and exits from the exhaust port at the top of
the drying chamber. These dryers result in higher temperature than the
direct dryers (cabinet or open air sun drying). A disadvantage of these
dryer is that it is difficult to maintain a constant operating condition
within the drying chamber because of fluctuation in the temperature of
the air leaving the solar collector. The air is circulated through the
system either by natural convection or by means of a mechanical blower.
In Industrial type dryers, the product can be dried by solar energy
as well as by fossil fuels. These dryers normally have large capacity,
run continuously and prov:de the shortest drying time. Some of the ear
lier investigations on energy efficient dehydrators were performed by
Cruss and Christie [4J. They used a tunnel dryer which consisted of a
long rectangular structure. The carts containing the fruits would enter
from one end of the structure,moving at a constant speed, and exit at
the other end. Heated air was used as a substi~ute for sun drying of
prunes in this experiment. In 1929, Christie and Nichols [5J studied the
effect of air temperature, humidity, fruit variety, pretreatment of the
fruit and air speed on the drying time. Mark [6] showed that non-uniform
flow o~ air has significant effect on the fruits leaving the tunnel with
variable moisture content. Most investigators agreed that relative
humidities of the exhaust air in counter current flow tunnels should be
in the range of 35%-40%.
Gentry [7J demonstrated that concurrent (parallel) flow operation of
a tunnel designed for traditional counter flow operation would sig
nificantly decrease drying time. Since then, many of tho. older tunnels
have been converted to concurrent flow operation and new tunnels are
designed for this mode of operation. Robert [8] studied drying of prunes
in parallel flow operation and found 33% faster drying than countercur
rent drying with less fuel consumption. Most of the earlier designs were
6

based on the Rodda and Gentry [9] work. Air flow uniformity was not in
cor~orated as a design consideration, but some of the tunnels hod turn
ing vanes in the top airchamber of the dehydrator.
Cheng [1~] analyzed the Gffect of a suction slot located just above
the front cars. The flow diverters were arranged such that the air is
directed upward, allowing the first set of vanes to turn the flow 90 de
grees while leaving enough space to locate the lower set of vanes above
the pathway of the cars. Croh [11] suggested that increased recircula
tion anduse of heat exchangers would reduce energy use. In 1980, Car
negie [12] analyzed the effectiveness of various heat exchanger systems
for recovering heat from exhaust air. Thompson [13] discussed the ther~
mal losses associated with tunnel dehydrators and the methods to mini
mize these losses. The main area of heat losses are exhau~t air, burner
inefficiency and air leaks. Heat lost by conduction through the wall and
by hot fruits and trays leaving the tunnel is relatively small. A heat
shield was placed by Thompson behind the rear wall(burner) to stop con
vective heat loss and also to absorb radiant heat from the heat from the
steel plate. Adams [14J conducted experiments on the performance of con
current dehydrator maintaining more uniform flow using flow diverters
an': turntng vanes.
Thermal response of a solar drier can be analyzed by using the
analogy between electrical current flow and heat flow. This method,
called the Thermal Circuit Method has been used by many investigators
(15-17) to study rates of heat flow through walls and roofs subjected to
unsteady atmospheric conditions. 8uchberg (18) used this method as an
analog computer technique to study the temperature-time response os a
structure the rate of heat transfer of the space in the structure. Jen
sen and Lieberman (19) discussed the application of an Electrical Cir
cuit Analysis Program (ECAP) in the analysis of thermal systems. Huang
et. a1. (20-23) used PCAP (Princeton Circuit Analysis Program), which is
a modified version of ECAP, to study the dynamic system response of
agricultural thermal systems. Later, Huang and El Sheik (24) used this
technique to study the thermal response of a Greenhouse Solar Drying
System for dryng peanuts and grains. Results showed good agreement be
tween the computer predictions and the measured thermal behaviour of the
solar dr'ier. Ozlsic and Huang (25) applied the some technique to stUdy
the heat and moss transfer in grain drying in a greenhouse solar drying
system using rotary drums 1n the greenhouse as solar collectors.
7

CHAPTER 3
Design and Fabrication of
Geodesic Dome
3.1 Introduction
This chopter drows heavily on the material presented in references
[26]-[28]. Dome is a multifaced polyhedron in which all the vertices lie
on the surface of a sphere. Domes are developed from the tetrahedron and
the icosahedron. Most of the domes are derived from icosahedron. The
triangles of the icosahedron are subdivided into smaller triangles to
form a geodesic dome. The geodesic dome has produced a building technol
ogy which can be applied to many shapes.
Dome (frame type) construction integrates the structure into a
continuous surface and di3tributes the surface forces by triangulating
the convex curve. In addition to being li~ht weight, the dome structure
has the following advantages.
1. The entire structure is in a state of compression.
2. Trianguler elements of the geodesic dome provides lateral
stability.
3.2 Materials for the dome frame
Possible materials for the dome frame are:
(a) Wood, Bamboo
(b) PVC Plastic pipe.
(c) Aluminum.
(0) Wood Is strong, relative~y cheap, lightweight and can be cut
out and assembled with hand taols. Wood con be cut easily at
any angle, and shape. To increase the l~fe of wood a coat af
wood preservative such as creosote oil helps. An important advantage of wood is that it is available in all parts of the
world. Bamboo may be a more appropriate choice in some develop
ing countries.

(b) PVC Plastic pipe is not streng for a framework, because it
gets brittle and shows crocks after some time.
(c) Aluminum is two or th~ee times more expen~ive than other
materials. If light"ess and corrosion resistance are important,
it might be worth it.
(d) Electrical Conduit pipe with the ends crimped and drilled is
probably the cheapest and the simplest frame in the U.S.A. An
eye bolt can be used at the hubs. Unavailability of electrical
conduit pipe in some countries 1s a drawback.
3.3 Design specifications
Figures 3.10 to 3.1f explain the terminology used in the design and
construction of geodesic domes.
The following specifications were used for the design of a dome for
testing:
Diameter 258 inches
Height 117 inches
3/8 sphere, 4 frequ:::ncy, icosahedron, Geodesic type
Standard values of chord factor(cf), axial angle(AA),
face angle(FA} and dihedral angle(DA)
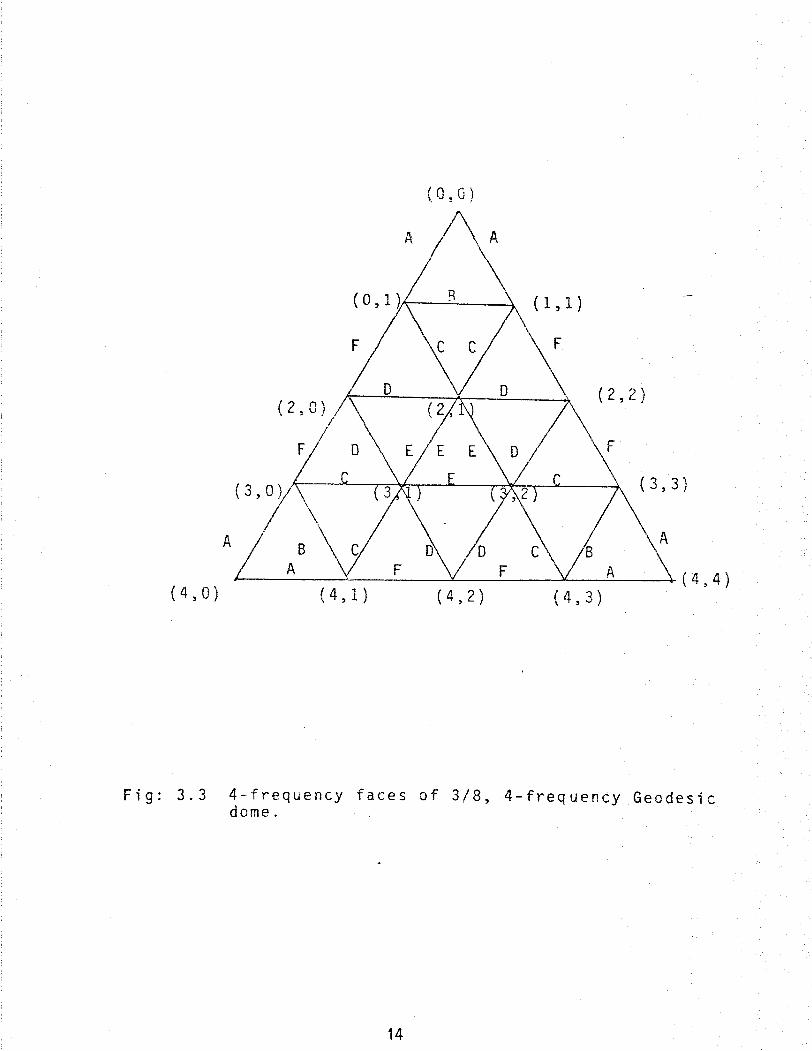
Figures 3.2 and 3.3 show the arrangement of members for a 3/8, 4
frequency , icosahedron geodesic dome. The length and angles of the mem
bers for the above specification are calculated as shown below. The
values are given in the tables 3.1 to 3.6.
Member-8
AA= 18~ - CA / 2
CA= 18~ - (AA1 -AA2)
cf= 2(S1n CA/2)
L= cf . r
Where AA is axial angle
CA is central angle
9

(a) Geodesic
(b) Icosahedron
(
Fig: 3.1(a,b) Basic definitions of Geodesic Math.
10

l-v
(c) Frequency
2-v 3-v
( d)
(0,0,0)
Central Angle and
Center of polyhedron.
Axi al Angl e
(e) Face Angle and Di hedral Angl e
Fig: 3.1(c,d,e) Basic definations of Geodesic Math.
11

3/8 Sphere
5/8 Sphere
Fig: 3.1 f Shows two ways of geodes}c domestructure.
12

Fig: 3.2 4-frequency icosahedron of 3/8 spheregeodesic dome.
13
(O~O)
( 3, 3 )
\ A
( 2 , 2 )
( 1 , 1 )
( 4 , 2 )
A
( 4 , 1 )
B
I--__A__l-- ..::t.-_...:.--_-"'-_--'-'-A---+ ( 4 , 4 )
( 4 , 3 )
A
( 4 , 0)
Fig: 3.3 4-frequency faces of 3/8, 4-frequency Geodesicdome.
14
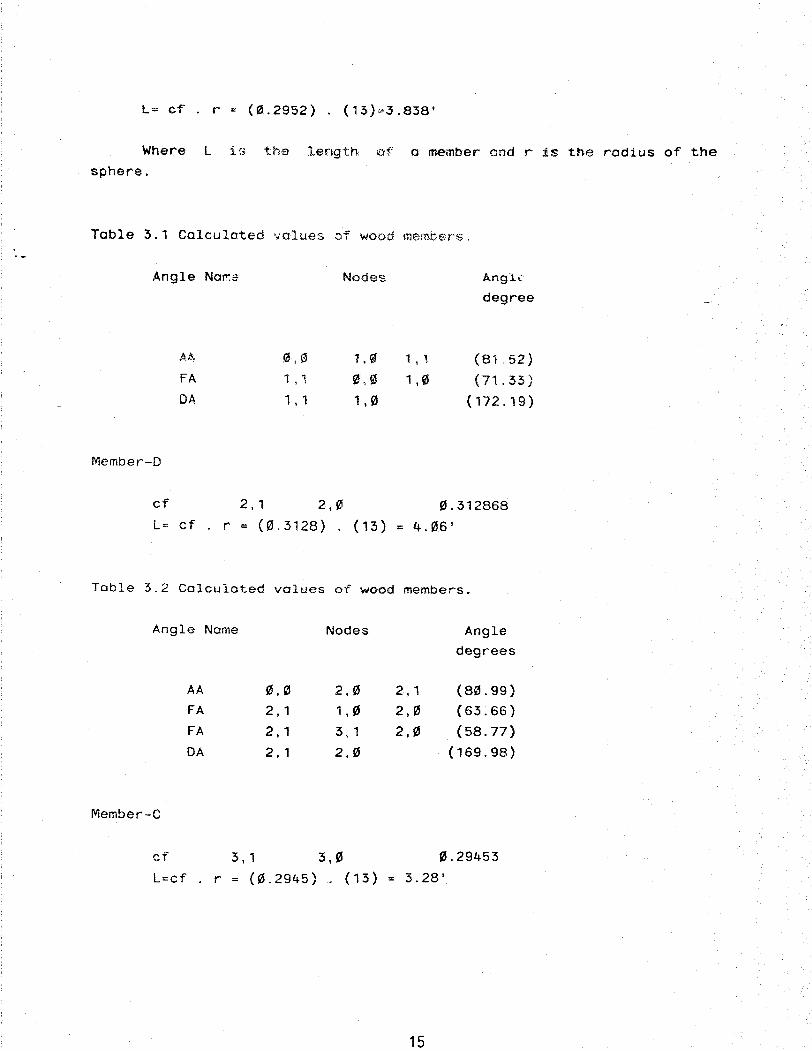
l= cf . r ~ (0.2952) . (13)~3.838'
Where Lis t;he length ~)f 0 member and r 1s the radius of thesphere.
Table 3.1 Calculated values of wood members.
Angle Norr:& Nodes Angl..:degree
Member-D
AA ",0 1. f:f 1 • 1 (81.52)FA 1 ,1 e,0 1,0 (71.33)DA 1 • 1 1,0 (172.19)
cf 2,1 2,0
L= cf . r = (0.3128) . (13) =0.312868
4.06'
Table 3.2 Calculated values of wood members.
Angle Name Nodes Angledegrees
AA 0,0 2," 2,1 (80.99)FA 2,1 1,0 2,0 (63.66)FA 2,1 3,1 2,0 (58.77)DA 2,1 2,0 (169.98)
Member-C
cf 3,1 3,0 0.29453
L=cf . r = (0.2945) . (13) = 3.28'
15

Table 3.3 CalcLlated value of wood member.
Angle Name Nodes A.ngle
degrees
AA 0,0 3,0FA 3,1 2,0 3,0FA 3.1 4,1 3.0DA 3,1 3,0
(81.35)
(57.53)
(59.92)
(169.61)
cf 3,2 3,1
l = cf . r = (0.3249) . (13)
0.3249
4.22'
Table 3"4 Calculated value of wood members.
Angle Nome Nodes Angle
degrees
AA 0,~ 3,1 3,2 (80.65)FA 3,2 2,1 3,' (59.99)FA 3,2 4,2 3,1 (62.56)DA 3,2 3,1 (169.64)
Member-A
cf 4,1 4,0
l= cf . r = (0.2531) . (13)0.25318
3.30'
Table 3.5 Calculated value of wooe! members.
Angle Name Nodes Angle
degreE3s
AA 0,0 4,0 4,1 (82. Tn
FA 4,1 3,0 4,0 (54.33)'
DA 4,1 4,0 (169.49)
16

Member-F
cf 4,2 4,1
L= cf. r = (0.2985).(13)0.29858
3.86'
Table 3.6 Calculated values of wood members.
Angle Name
AAFADA
0,04,2
4,2
Nodes
4,4
3,1
4,1
4,2
4,1
Angle
degrees
(81.42)
(58.79)(169.50)
3.4 Fabrication and Instalation
As shown in figure 3.4, the designed dome structure consists of ten
hexagons, five pentagons and a five corner top structure. Using the
dimensions of A,B,C,D,E and F as calculated above, required dimensions
for all the members of dome were specified. Details of the dimensions
are given in tables 3.7 to 3.13 and figures 3.6 ta 3.9. Type of members
and accessories used are shown in figure 3.5.
Table 3.7 Data for the members of the pentagons (Figure 3.6)
Member Type Dimensi.on QuantityLi l2 W t (For 5 Pentagons)
A1 A 2" 3'-6" 1'_5" 1 " 25A2 8 2" 3'-1" 1'-5" 1" 25

Table:3.8 Hub Sizes far five Pentagons
Hub Type Dimensions Quantity
0 t (Far 5 Pentagons)
A3 E 6" 1!2 tX S
A4 G 1" 1/2" 5
A5 F 6" 1/2" 1~
AS E 6" 1/2'" 15
Table:3.9 Data for Members of the Hexagons (Figure 3.7)
Member Type Dimension QuantityL1 L2 \II t ( For 5 Hexagons)
81 A 2" 4'-2" 1'-5" ,.. 1082 8 2" 3'-8" 1'-5" 1 It 5083 8 2" 4'-06" "-5" ," 2"84 B "l" 4'-06" 1'-5" 1" 20'-
85 8 2" 3'-8" 1'-5" 1" 20
Table 3.10 Hub Sizes for the Hexagons ( Figure 3.7)
Member Type Dimension QuantityD t (For 5 Hexagons)
A4 E 6" 1/2" 5A3 G 1" 1/2" 5
A6 F 6" '/2" H'lA7 E 6" 1/2" H'l
18

Fig: 3.4 Top view of dome,shows number of pentagonshexagons and top frame.
19
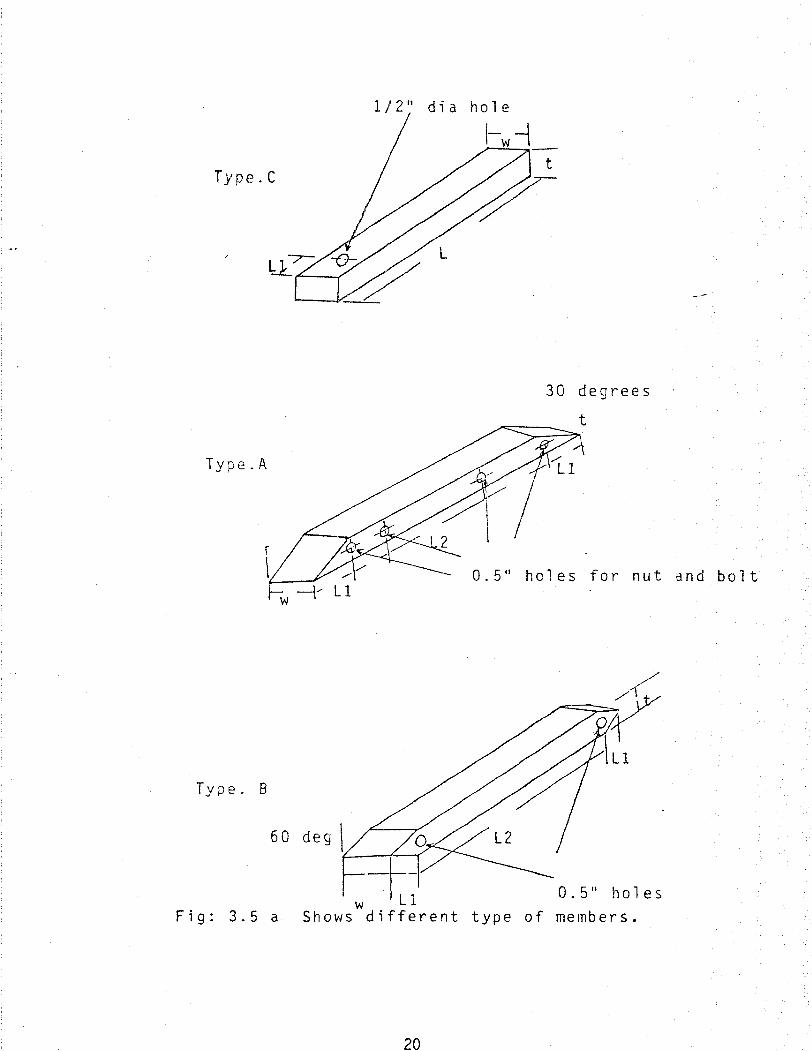
1/2 11 dia hole
Type.C
30 degrees
t
Type.A
0.5 11 holes for nut and bolt
Type. B
60 deg \f.----{-.,..-
Fig: 3.5 a
20
type of members.

0.5" holes
Type.E
6" 2"
/
o
o
o
I ~60 deg'-_. 0 Dia=61<
0--- Type. G
t=O.5 11, D=1 11
Type . F
0.5" hole I~I
o Dia=6 11
/'
o},\60 deg
/- 0I
Round Head
Dia
1 .5 11
Fig: 3.5 b Shows different type of accessories.
')1

AS
Detail of joint
Fig: 3.6 Arrangement of wood me~bers fnr pentagon
22

B2
A3
.O. 5 • !<,I~ uta nd B0 1t
Fig: 3.7 Arrangement of wood members for ahexagon
23

A7
yY~~.~
A7
8282
/f~ A3A6 C~
Bl ~CJA6
0.5' Not and2Bolt
A5
Fig: 3.8 Arrangement of wood members for a hexagon.

A4
A3
A2
\'\
72 degrees
A7
Fig: 3.9 Arrangement of wood members for top frame.
25

Table 3.1' Date for Members of the Hexagons(Figure 3.8)
Member
81
82
83
84
85
Type
A
B
B
8
B
Quantity
(For 5 Hexagons)
6
3~
18
18
18
Table 3.12 Hub Sizes for the Hexagons (Figure 3.8)
Hub Quant~ty
A4 6
A3 6
A7 12
Table: 3.13 Member sizes for top structure (Figure 3.9)
Member
A2
Type
B
Quantity
5
Figure 3.10 shows dimension of the members as given in the above tables.
3.6 Structure
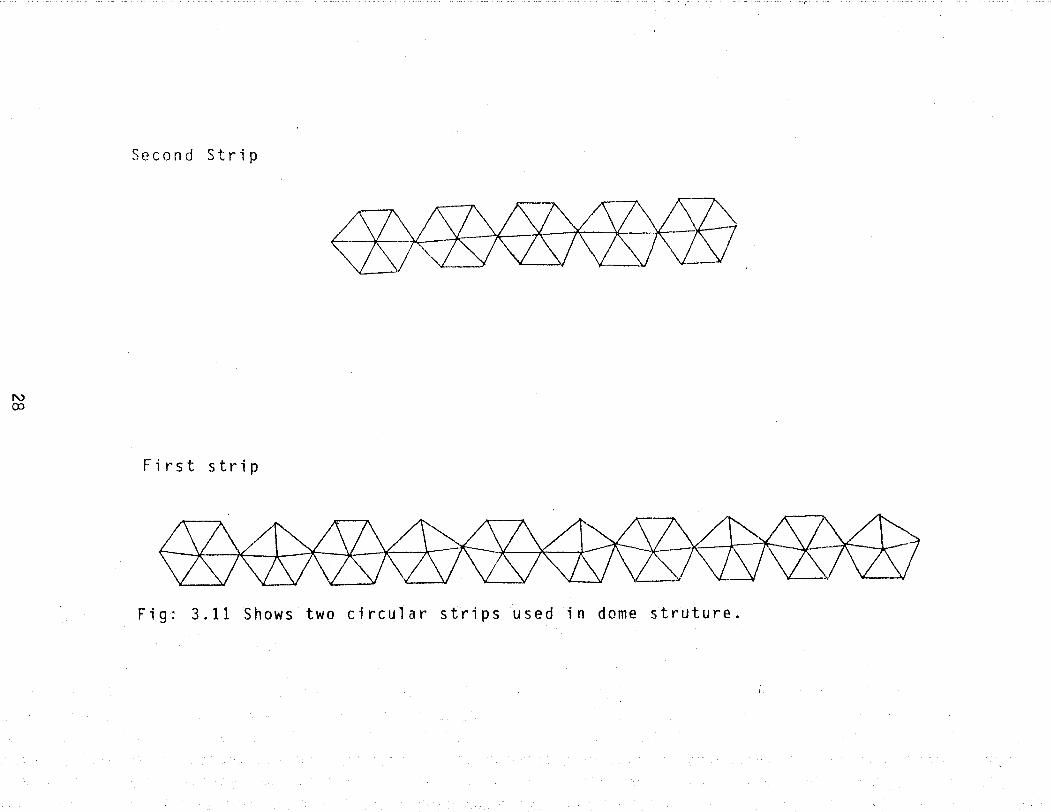
Referring to figure 3.11 the structure consists of two circular strips
made up of hexagons pentagons and a top frar;,e. which wer-e assembled as
explained below.
First Strip: Five pentagons and five hexagons were assembled
alternately using nuts, bolts and hubs.
Second Strip: Five hexagons were attached to the top of the first strip.
Top Frome: Top of the hexagons from the second layer was joined with
the five corner top frame.
26
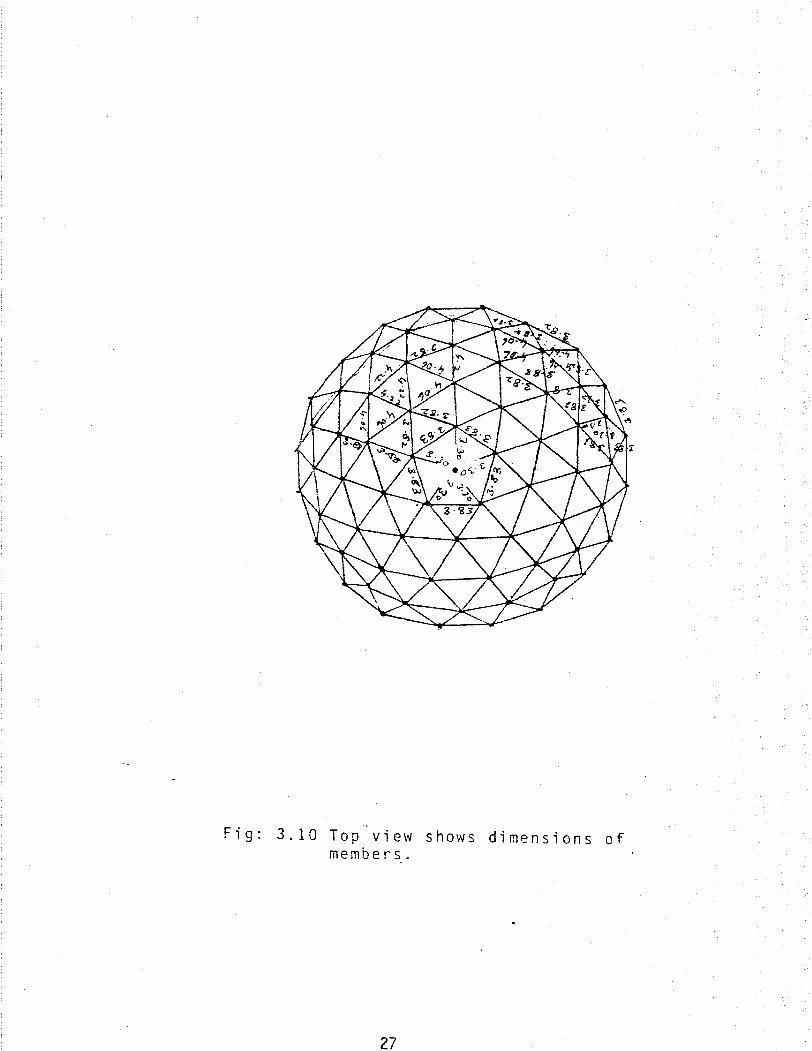
Fig: 3.10 Top view shows dimensions ofmembers.
27
0.
.....-0CouQ)
V)
28
0.
.....
Q)
Eo"C.....til0
......uo3:+oJ
til
3:o~(/)
.....

Fig: 3.12 Shows outside frame of geodesic dome.

Fig: 3.13 Shows outside frame and inside frame withblack plastic.
30
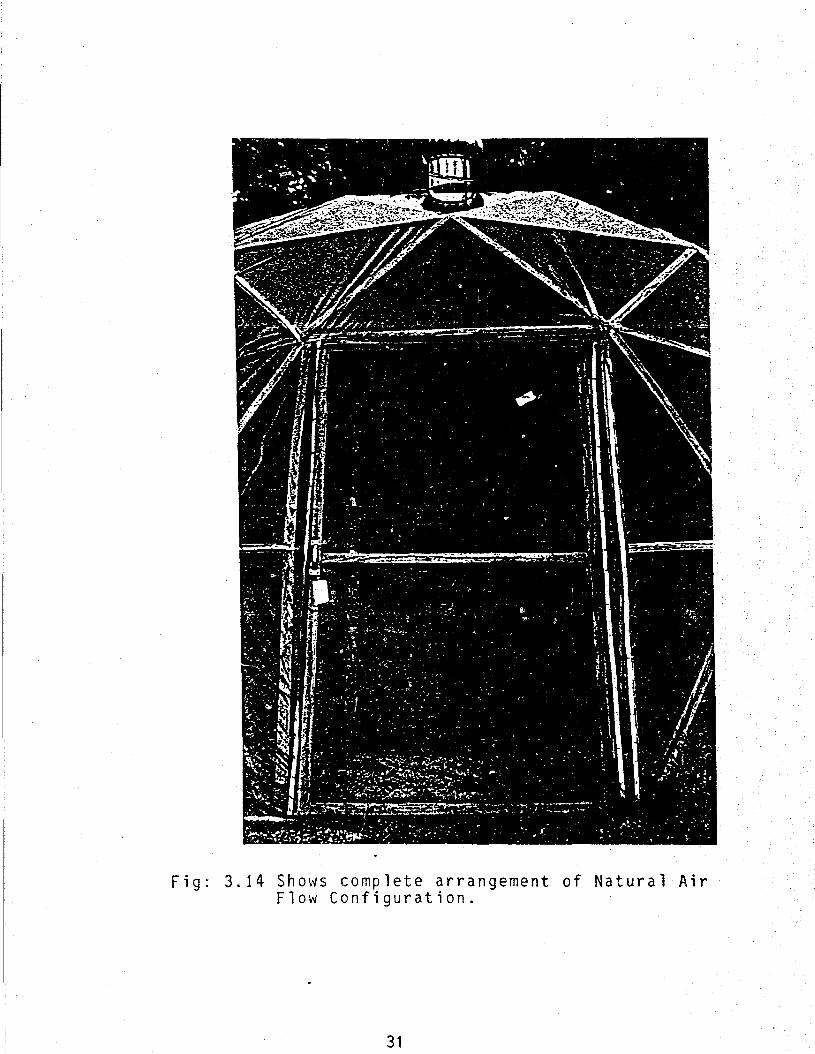
Fig: 3.14 Shows complete arrangement of Natural AirFlow Configuration.
31
CHAPTER 4
INSTRUMENTATION AND PROCEDURE
A Disk Data Acquisition System(DDAS) as shown 1n figure 4.1, was
used to acquire temperature and relative humidity data at various loca
tions and under varying solar radiation levels at the experimental site.
The location of the sensors is shown in Figure 4.2. A wooden box was in
stalled outside the greenhouse for DDAS system equipment and
occessories. A PVC pipe was used to run the wires from DDAS to
greenhouse.
The DDAS system includes an IBM compatible portable computer with
512 K memory and one 3 1/2" disk drive,one sam 8.12.4 Data Aquisition
Module, RS-232 data cable, Ni-Cad batteries, a charger, a powerline
filter, a surge suppressor and "dlogger. Bas" data logging software. The
Ni-Cod batteries that can run the system for a few hours when fully
charged. The system can also be run continuously with the charger
plugged into 110 Vac.
Fi·e sensors were used for temperature and two for relative
humidity measurements. For humidity measurements "Two-Wire Humidity and
Temperature Transmitters" were used with following characterstic.
Measuring Range
Accuracy at +20 C
Temperature Coefficient
Sensor
" - 100% RH+2% to -2% RH(0- 90% RH)
+3% to -3% RH(90-100~ RH)
- 0.04~ RH I C
- HUMICAP 1638 HM
Veloci ty was measured by "DATA METRICS" 100 VT Air flo'"", Meter.
PROCEDURE
Solar dryer was tested for drying grapes and the performance was
evaluated. The dryer is built out of 4 feet 10ng(1.25"x 2.00") woodenmembers. It is covered by a transparent tedlar plastic(outer shell) and
a black absorber (inner shell). These two shells creat an air space
32

about two feet wtde. This dryer was tested for two different arrange
ments with fan and without fan, as shown in figures 4.3a and 4.3b. In
the first case a fan was used to push the air into the space between two
shells and in the second case natural convection was used for suction of
the outside air, and a ventilator was used at the exhaust to help in
crease the airflow. Two trays were filled with grapes. The rest of the
trays were covered with a plastic sheet so that all of the heated air
went up through the two trays. Fresh gropes were loaded after sunset
time, and were weighed every morning (at sun rise time) and every eve
ning at sunset to check the weight loss due to evaporation of moisture.
Fan was turned on during the day time only (For the first arrangement).
Five thermocouples were used to record temperature of the air at dif
ferent locations as shown in figure 4.2. Relative Humidity of the air at
the inlet and the outlet and solar radiation were also recorded.
Velocity at the outlet(top of the dome) was measured and overage
air velocity was calculated to find the mass flow rate. From the
measurements of the relative humidity, the temperatures and the air
flow rate, increase in the moisture content of the air between the inlet
and the exit was calculated by use of a computer program given in the
appendix.S

1 . Power Line2 . Power Supply3 . Power Jumper4. Power5 . computer ON/OFF6. Computer7 . RS-2328. Power9. Sam
10. Sensors
10
6
Fig: 4.1 Portable Data Acquisition System.
34

a IJ
1L , 13
~I'1D DOA.s
o 0
12, 13
A Sensors on inside surface of outer shell• Location of sensors inside the black Plastic.
Temperature Sensors(1,2,3,4,5,6,7,8,lO,12)Relative Humidity sensors(9,13)
Fig: 4.2 Location of Sensors.
35
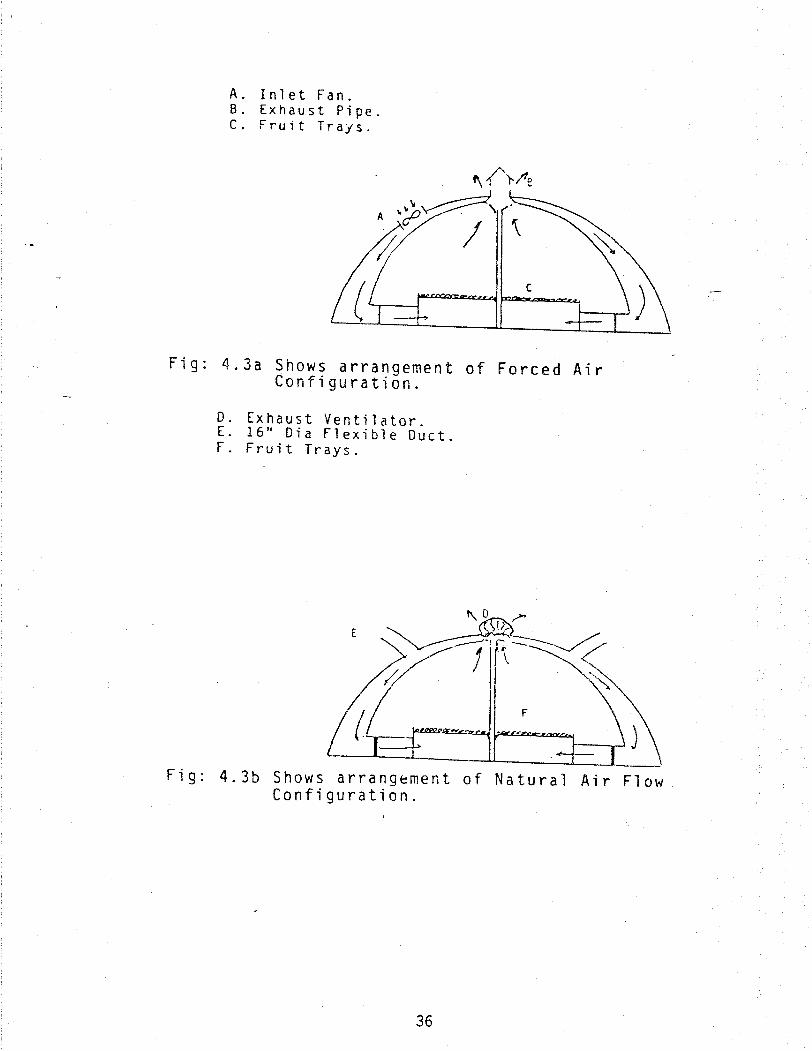
A. Inlet Fan.B. Exhaust Pipe.C. Fruit Trafs.
...A ";;0
/c
Fig: 4.3a Shows arrangement of Forced AirConfiguration.
D. EXhaust Ventilator.E. 16" Dia Flexible Duct.F. Frui t Trays.
E
Fig: 4.3b Shows arrangement of Natural Air FlowConfiguration.
36

Chapter 5Thermal simulation of the solar fruit dryer
Temperature response of the solar dryer under unsteady outsidecondi t ions can be studied by simulation using thermal-e lectricalsystem analogies. Electrical systems are analogous to many other'systems including thermal, mechanical and hydraulic systems. Thermalcircui t principle and dynamic system analogies have been appl iedvery successfully to study the rate of heat flow through walls androof subjected to steady periodic variations in the weatherelements. The method is based on the fundamental similarity betweenthe flow of heat wi thin a rigid body and that i.n a noninduct i veelectric circuit. The analysis is based directly on the identity ofthe equation governing transient heat flow and the flow ofelectricity in resistance capacitance circuit.
Princeton Circuit Analysis (PCAP) which is a modified andimproved version of Electronic Circuit Analysis Program (ECAP) hasbeen used in this study to obtain the thermal response and theinside air temperature of the solar fruit dryer. The whole model isconsidered as a solid mass with the temperature changing with timeand location as a result of heat exchange with the surrounding.
All lumped properties (k,h,C ,p) are considered to be constantp
over the temperature range encountered and the space temperatureis considered uniform at any instant. In order to simplify thesteady-state heat transfer analysis for solar heating of theair, heat capac i ty of the structure elements and conduct i ve heatlosses through the floor to the ground are neglected. In drawingthe thermal circuit for the solar dryer, the system components areidealized and represented by circuit elements. The thermal circuitrepresent ing the solar dryer is shown in figure 5.1. The heattransfer system represented by the circuit is composed of discreteelements or lumps. Table 5.1 shows the analogies in the!"'aml andelectrical systems
Table 5.1. Comparision of Thermal and Electrical Systems
Thermal System
Temperature, THeat flow, QThermal capacity, CThermal conductivity, kThermal resistance
Electrical System
VoltageCurrentCapacitanceConductanceResistance
~7

Analogous variables of different physical systems can beinterrelated quantitatively. Inter conversion of correspondingthermal and electrical quantities can be obtained by defining ascale factor' as:
Magnitude of quantity unit in electrical circuitScale Factor =
Magnitude of quantity unit in thermal circuit
The Scale factors used to convert the thermal units into theco::--responding electrical units are tabulated in table 5.2.
Table 5.2. Scale Factors for Thermal and Electrical Units
Quantity Thermal System Electrical System Scale factor
Potential Temperature (0 K) Voltage(volt) 1
Energy flow Heat flow ( W) Current (amp) 1. 27 x 10-7
6Resistance OThermal resistance Resistance 8 x 10
( K/W) (ohm)
Capaci ty TherBal Capacity Capacitance 1. 25 x 10-7
(J/ K) (farad)
The circuit element in figure 5.1 consists of basically three parts:
1. Parallel lumped R-C networks representing thermal conductionpath through the structur~l elements.
2. A resistance network representing radiation exchange betweenall interior surfaces.
3. Temperature sources connected through appropriate thermalresistance to the network and heat source at various pointsin the network representing boundary conditions.
The calculation procedures in the analysis are summarized andillustrated by the following steps:
Thermal capacitance:
Thermal capacitance is calculated from the following relation
(5.1)
-7C = Ctx 1.25 x 10 (farad)
(5.2)

Thermal convection coefficient:
Convection coefficient is defined by l/h A, where h is obtainedconsidering the wind velocity.
(5.3)(ohm)6x 8 x 10Ah
co
=Rco
Outside convective coefficient1
Inside convective coefficient1
R . =Cl
6---- x 8 x 10h .A
Cl
(ohm) (5.4)
Radiation exchange network accounting for direct radiation of thecollector and the radiation between surfaces within the solarcollector was calculated using the relation:
1 -cR =ri
34 A c s Tav
6x 8 x 10 (ohm) (5.5)
The value of surface emissivity used in the c~kcula\i~s was 0.95and the Stefan-Boltzman constant was 5.569 x 10 J/K m s. A directradiation resistance and equivalent electric resistances between theinternal members were calculated using following relation:
1
4 Ah
F. IT TIn av
3
6x 8 x 10 (ohm) (5.6)
Calculated values of the resistances and the capacitances are shownin table 5.3.
Table 5.3. Calculated Values of Resistances and Capacitances
R 0.85 ohm ~= 1.2534= x 10 ohms
R = .. _.. ohm (R - ) = 776.87 ohmg rl s
R = 23099.39 ohm (R ')h = 1186 ohmsh rl
R = 40887.84 ohm (R .) = 2067.267 ohmsg
5rl g
~g= 1. 14 x 10 ohm C = 10.29 farad
10-3a
10-3C = 1. 98 x farad Ch = 3.85 x farads -3C = 1. 7991 x 10 farad
g

The solar heat input (Q) absorbed by various surfaces ( absorber andground) ~iaS calculated using coefficient of transparency as 0.75and absorptivity of the black sheet as 0.95.
Current I = Q X 1.25 x 10⁻⁷
(ampere) (5.7)
Figure 5.2 shows the measured air temperature and the computed airtemperature inside the solar house. Coefficient of heat transferwas estimated (ref) considering the air leakage of the airleaVing the exhaust pipe. During our experiments flow rate of theair before entering the tray was measured and compared wi ththe capaci ty of the fan to i.ncorporate the air leakage incalculating convective heat transfer coefficient. Two curves arein very good agrement wi th each other. By comput ing the airtemperature we can design and calculate the efficiency of thesolar fruit dryer.
Nomenclature (Used in this chapter):
Symbols Subscripts
A (m2 ) air= area a =C = thermal capaci tance (J/
oC)O ci = inside convection
C = specific hea~ (Kj/Kg C) cO = outside convectionV = volume em ) g = groundh = coefficient of convective h = black absorber sheet
heat transfer (Kj/m hI'0 k) ri radiation resistance=
I = current (ampere) s = transparent sheetK thermal conductivity (Kj/hr
0K) t thermal unit= m =
Q = heat flow (Kj/hr)R = resistance
40

Fig.5.1 Thermal circuit simulation model
JlA
CRf2) h CRf2) h
lh

----Corrlp-- --~
-- --- - - - Exp
// ,..J..- ''',
/._~ •.__.L~
/ '--~---!... "-I _._- "-
/ --- ,
/ ~/ ~
/ ~J
/ ~ '\
'\~N
/')~. I
u 50,~...-/
CDL:J
'-1-.1 40oL
CDCl.~
E 30G)~-
.L 20«
CD
~ 10(f)
c /"I
/
/
//
I
/
/
,../'
I --./'~
,,~ I
o~. I r I I I I I I I I I I I I I I-I I I I I I I I I I I I I.,. 1 I I I I I I I I I I I I I I I I I I I I I I I I I I I6 7 8 9 10 11 12 13 14 15 16 17 '18
Time(Hr)Fig: 5.2 Inside air temperature

temperatures,
12 hours and
6.2.
CHAPTER 6
RESULTS
This section describes the results of the experiments conducted to
find out the performance of the solar dryer. First. three sets of dat.q
were recorded with the fan turned on, as shown in figure 4.3.a then the
set up was changed as shown in figure 4.3.b.
Experiment No:1
Table 6.1 Shows the weight data for 15 days including 4 cloudy days,
that shows the amount of moisture removed from the grapes during thisperiod.
Complete data for the inside and outside ambient
and the moisture loss from the grapes was recorded every
plotted with respect to time as shown in figures 6.1 and
TABLE 6.1 Measured Weight of Grapes for the Farced Air Configuration
Date Time Wt(kg) ;, Moisture Remarks
Reduction
01-27-89 4:50 pm 7.82 Sunny
01-28-89 7:00 am 7.55 3.45 Sunny
6:00 pm 7.2 8. £18
01-29-89 7:05 am 7.1 9.46 Sunny
6: 15 pm 6.9 12.27
01-30-89 7: 1£I am 6.7 15.16 Sunny
43

Table 6.1 (cont'd)
01-30-89 S:05 pm 6.5 18.14
01-31-89 7: 15 om 6.45 18.91 Sunny5:30 pm 6.21 22.63
02-01-89 7: 10 am 6.1 24.43 Sunny5:00 pm 5.85 28.53
~.,_.- -02-02-89 7: 15 am 5.75 30.23 Sunny5:00 pm 5.50 34.57
02-03-89 7:20 am 5.35 37.37 Sunny5: 15 pm 5.12 41.67
02-04-89 1 : 30 pm* 5.00 43.97 Cloudy
02-06-89 9:30 am* 4.75 48.97 Cloudy
02-07-89 6:30 pm 4.60 52.12 Cloudy
02-08-89 2:35 pm 4.49 54.52 Sunny
02-09-89 5:30 pm 4.30 58.57 Sunny
!1l2-10-89 4:30 pm 4. 1 iO 63.4- Sunny
* Rain Period
44

/ -
100---~
'fJ
-2 n / \ Q J \ / 'd0 \L
<)) \ rJJ /Q 40-~ 'd
.t::- f-CJ1
T0--0--20 -j Ti -8---
200150100Time (Hr)
500, t r t I I I! I I I r I I I I I I I I I I I I I r I I r I I I I I I II I I I I
o
Fig: 6. 1 Me 0 sured val ue 0 f Tem pera t urein sola r dryer.(Forced Air Configuration)

.<l)
C:.-.~
i--co(J)".;::;>
0L,......,
:=1
~.0
1"'"---"l.+
-
ee
o0
~U
U::.JL
-0
.-Q
)<t:0
:::-0<l>
Q)
:.-.U
:=1L
.......,0(f)L
L.-
...............o~
oo-.:;j-
oot"")
oo
------.LI
0"-/
oNQ
)E;-
~-'--......--..--.-~---~.---..--.--..........--,.-..,---,-,--,--,r--r-r-r-T
'-r-"T
--r--r--r-1-0
oo<D
46
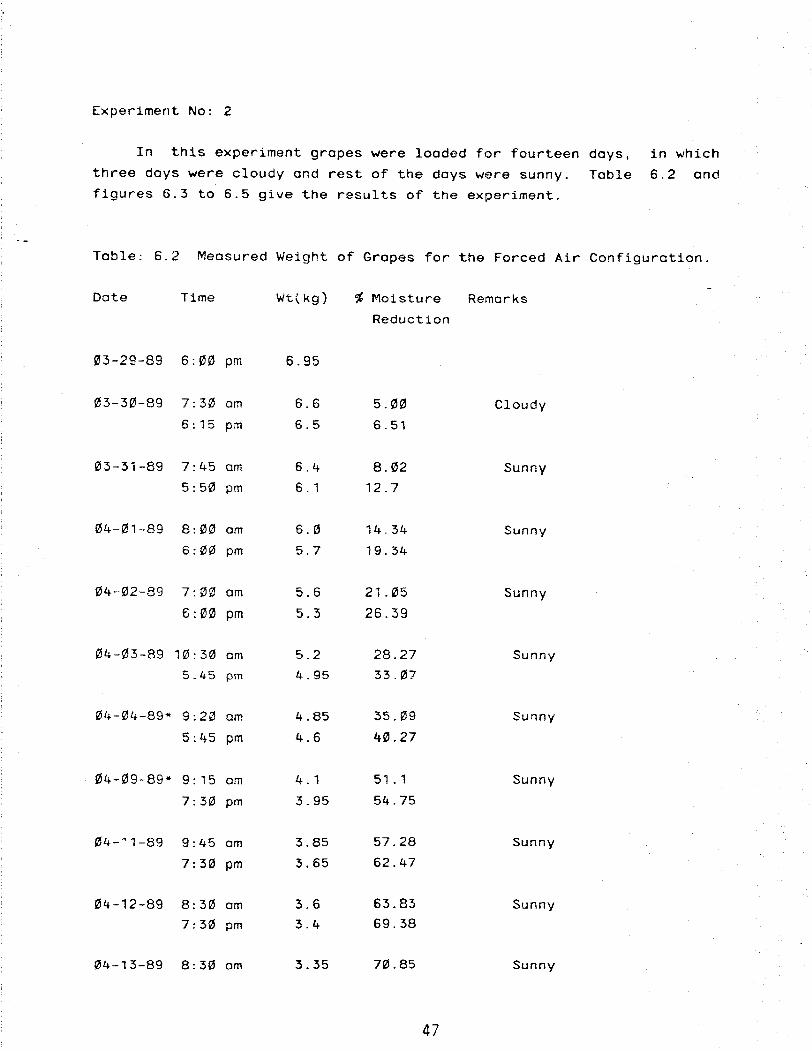
Experiment No: 2
In this experiment grapes were loaded for fourteen
three days were cloudy and rest of the days were sunny.
figures 6.3 to 6.5 give the results of the experiment.
days,
Table
in which
6.2 and
Table: 6.2 Measured Weight of Grapes for the Forced Air Configuration.
Date Time Wt(kg) ~ Moisture Remarks
Reduction
03-29-89 6:00 pm 6.95
03-30-89 7:30 am 6.6 5.00 Cloudy
6: 15 pm 6.5 6.51
03-31-89 7:45 am 6.4 8.02 Sunny
5:50 pm 6.1 12.7
04-01-89 8:00 om 6.0 14.34 Sunny
6:00 pm 5.7 19.34
04-02-89 7:00 am 5.6 21.05 Sunny
6:00 pm 5.3 26.39
04-03-89 10:30 om 5.2 28.27 Sunny
5.45 pm 4.95 33.07
04-04-89* 9:20 am 4.85 35.09 Sunny
5:45 pm 4.6 40.27
04-09-89* 9: 15 am 4.1 51.1 Sunny
7:30 pm 3.95 54.75
04-~1-89 9:45 am 3.85 57.28 Sunny
7: 30 pm 3.65 62.47
04-12-89 8:30 om 3.6 63.83 Sunny
7:30 pm 3.4 69.38
04-13-89 8:30 om 3.35 70.85 Sunny
47

-' ,-,- ~'"
100.00
0.00 I I I I I i I I I I I I r r I I I r i I I I I I r r I II I I J I J I I I I I I I r I I I I r I I I Io 25 50 75 100 125 150 175 200 225 250
Time ( Hour )
80.00~
LL
'--" 60.00v'-
40.00 ~'m ~ N ""\J} , . rn V:J 'I I
Gf \.......0 \ -I <il(it 0L.
(!} ~<1)~ 0. ~ex:>
E<1)I-
20.00 ../ --o--To-0 Ti
Fig: 6.3 _Measured value of Temperature in s010r dryer(Forced Air Configuration)

.,J:>.~
80j
,..--.....
~60-
co
-I-'
U:J
U 40Q)
0:::
Q)L
:J.+.J
.(j)20-o
"'S..,;;:-
~--
,.
u
o-i I I I I I I TTT i I I I I I r I I , I I I Tr", r I r r I r I I I I I I I I I I I I I I I I I J Io 50 100 150 200 250
Time(Hr)
Fig: 6.4 Moisture Reduction (%) vs Time.(Forced Air Configuration) \

200
~
+--'4-
CT 150U>..........c
'":J-t.-'
~100c0.-
+--'0.-
(jl
-0
00 50 ":er::........0-0U)
00
Fig: 6.5
50 100 150Time (Hr)
Measured value of Solar Radiationsurface outside the solar dryer.(Forced Air Configuration)
200 250
on a horizontal
, \
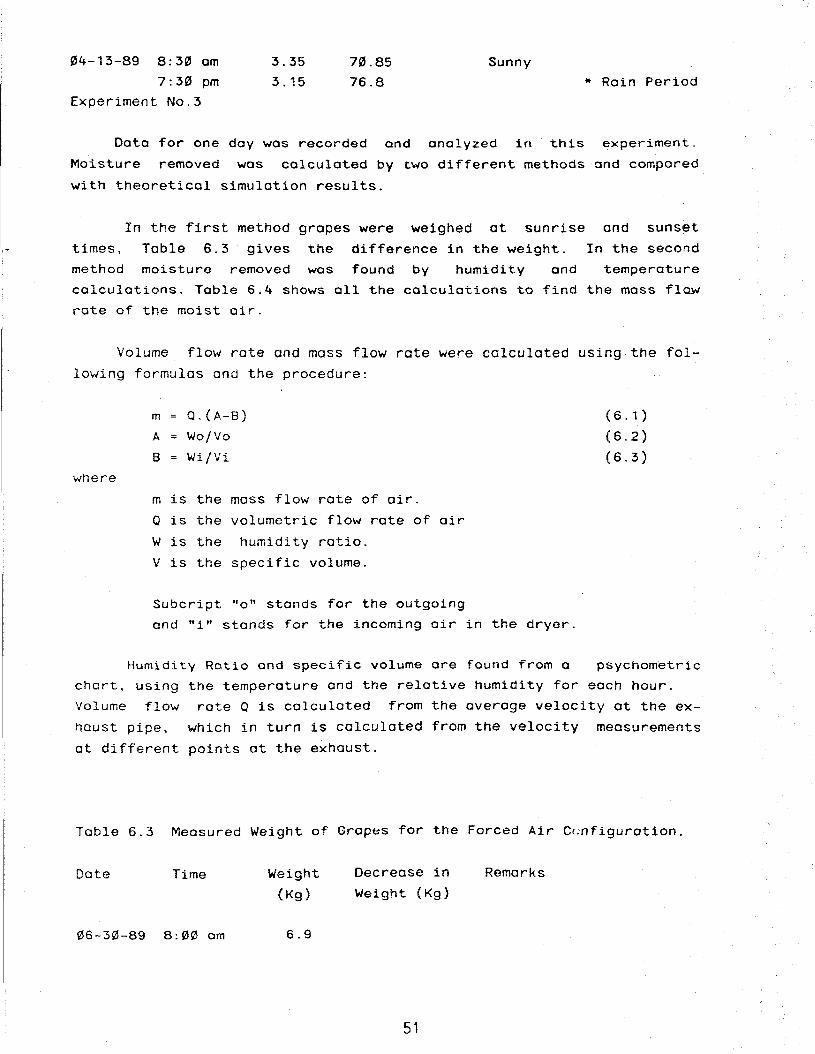
04-13-89 8:3~ am
7:30 pm
Experiment NO.3
3.35
3.15
70.8576.8
Sunny
* Rain Period
Data for one day was recorded and analyzed in this experiment.
Moisture removed was calculated by twO different methods and compared
with theoretical simulation results.
In the first method grapes were weighed at sunrise and sunset
times, Table 6.3 gives the difference in the weight. In the second
method moisture removed was found by humidity and temperature
calculations. Table 6.4 shows all the calculations to find the mass flow
rate of the moist air.
Volume flow rate and mass flow rate were calculated using the fol
lowing formulas and the procedure:
where
m
A
B
O.(A-B)
Wo/Vo
Wi/Vi
(6.1)
(6.2)
(6.3)
m is the mass flow rate of air.
0 is the volumetric flow rate of air
W is the humidity ratio.
V is the specific volume.
Subcript "0" stands for the outgoing
and "i" stands for the incoming air in the dryer.
Humidity Ratio and specific volume are found from a psychometric
chart, using the temperature and the relative humidity for each hour.
Volume flow rote 0 1s calculated from the average velocity at the ex
haust pipe, which in turn is calculated from the velocity measurements
at different points at the exhaust.
Table 6.3 Measured Weight of Grapes for the Farced Air C<;nfiguration.
Date Time Weight Decrease in Remarks
(Kg) Weight (Kg)
06-30-89 8:00 am 6.9
51
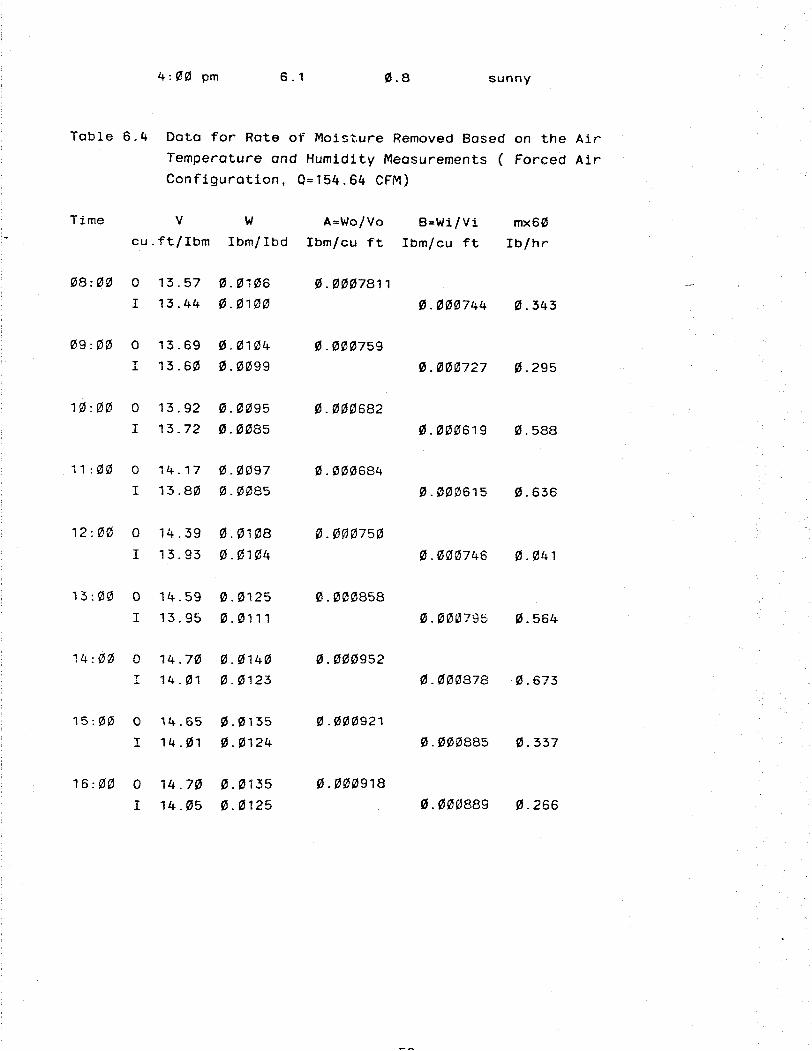
4:00 pm 6.1 0.8 sunny
Table 6.4 Data for Rate of Moisture Removed Based on the Air
Temperature and Humidity Measurements ( Forced AirConfiguration, 0=154.64 CFM)
Time V W A=Wo/Vo B=Wi/Vi mx60cu.ft/lbm Ibm/lbd Ibm/cu ft Ibm/cu ft Ib/hr
08:01Z1 0 13.57 0.0106 0.01Z107811I 13.44 0.010" 0.0"0744 0.343
09:00 0 13.69 0. 0H~4 0.000759
I 13.60 0.0099 0.000727 0.295
10:00 0 13.92 0.0095 0.000682
I 13.72 0.0085 0.0006191 0.588
11:00 0 14.17 0.0097 0.000684
I 13.80 0.0085 0.000615 0.636
12:00 0 14.39 0.0108 0.000750
I 13.93 0.0104 0.000746 0.041
13:00 0 14.59 0.0125 0.000858
I 13.95 0.0111 0.00~795 0.564
14:00 0 14.70 0.0140 0.000952
I 14.01 0.0123 0.000878 0.673
15:00 0 14.65 1.:5.0135 0.000921
I 14.01 0.0124 0.000885 0.337
16:00 0 14.70 0.0135 0.000918
I 14.05 0.0125 0.000889 0.266

Moisture removed was also found theoretically, using the follow
ing relations [29]:
1/n
M(e)=[1-rh/c.T]
Where rh = equilibrium relative humidity
M(e)= equilibrium moisture content, dry basis
T temperature, degrees R
c,n constants
-5
c = 7.13 x HI
n 1.02
{ M(t)-M(e} } / M(a)-M(e) =A e
Where M(t)= moisture content,dry basis,after time t.
M(O)= moisture content,dry basis, at time t=0,
A = 8/Pi =0.811
K = Dv. (Pij2a)
Dv Mass Diffusivity= 5.41 x 10 sq mJ hour
a Half thickness
(6.4)
(6.5)
(6.6)
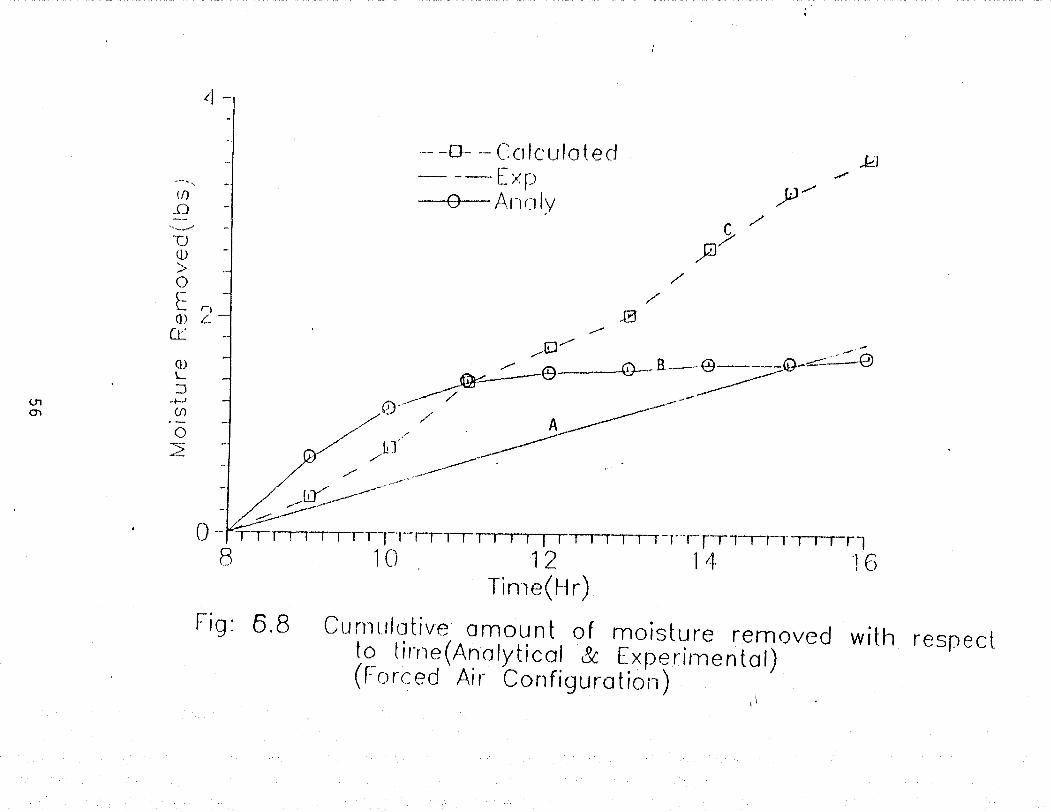
Figures 6.6 and 6.7 show variation of relative humidity; Temperature
between the inlet and the outlet. Figure 6.8 shows comparison between
theoretical results and the experimental results. The deviation between
the theoretical and the experimental results is explained later in this
chapter.
Experiment NO.4
In this experiment we changed the arrangement of the solar dryer,
as shown 1n figure 4.3.b. In this arrangement the air flow occured by
natural convection. Table 6.5 and figures 6.9 to 6.11 give the result of
such arrangement.
53

150
~"100'----"
Q)L
:J4...)
ol._(1)Q.
E 50,(1)t-
~~@
!::}---lY- [) to
_~ -0- .Qj -<9- -0
.-G--Tortl Ti
.\
I I I I I I I I I I I I I I I I I I I Io-tnT, I I I I '8' r I I I I I , ;Id I I I I I I I ;'2 I , I I I I 114 16 18
. Time(Hr)
Fig: t5 .6 Mea sured val ue 0 f Tem peraturein solar dryer.(Forced Air Configuration)

)"0- -0_ 0
- --{i)---Rof+l Ri
o f' /...-J..!.J- .~)
'---(!)-
~
~\\~\(S)
f\J \\ \
"\r.>-
80
(1) "~ _
-5 ~ ~0--Pt---8--€]o(l) 20 _Ct:
r--, 60 -t·()0\ •
'----"A
-+-'
-a.--E :J 40-
I
IIIIIl'III1I'IlIIl!lIlilttlorn",,~ I " " " I 1'1" " I " 1'3 · 15 17Time(Hr)
Fig: 6.7 Mecsured value of Relative Humidity in solardryer.(Forced Air Configuration) II
'I -
kJ.,.....
)J/
c ,/)2)7
._- --0-- -- CCllculoted- --Exp
A Annly
I I I r "' , , i I I r I I I I I r-,-rTl-rr-r I , I rl12 14 16
Tin1e(H r)
//
JB/""
~./'"./'" ...!U 1l ....... -~ \.../ 0- --·0---©-~~g
0'-~ ~/"'J / --/ Ll/ '
/"
/' ----.--------~-~
o-rTTrl I I I Il-r-'
8 10
--",(()
_0--'-../
-cJCD>0
E I")Q) L
CL
(])L:J
01 _~.J
Q') (f).-02
Fig: 6.8 eu n"Hllotive amou n t of moisture removed with respectto ti,-ne (Ana Iytical & Experirnen tal)(Forced Air Configuration) "
1\

TABLE 6.5 Measured Weight of Grapes for the Natural Air FlowCan
Date T .lrne Wt(kg) '1> Moisture Remarks
Reduction
04-29-89 7:45 om 7.4
7:30 pm 6.9 6.75 Sunny
04-30-89 7:30 am 6.8 7.897:45 pm 6.4 13.77 Sunny
05-01-89 7:25 am 6.3 15.336:45 pm 5.9 21.23 Sunny
05-02-89 8:00 am 5.8 22.957:30 pm 5.4 29.83 Sunny
05-03-89 8: 15 am 5.3 31.68
7:00 pm 5.0 37.34 Sunny
05-04-89 8:00 am 4.9 39.34
7:30 pm 4.7 43.4 Y
05-06-89 7:45 am 4.5 47.67
8:04 pm 4.3 52.11 Cloudy
05-07-89 7:30 om 4.2 54.34
6:58 pm 4.0 62.1 Sunny
05-08-89 8: 30 am 3.9 64.6
8:00 pm 3.7 69.72 Sunny
05-09-89 7:45 am 3.65 71.07
6:55 pm 3.40 Sunny
57

120
100.............LL'--'"
Q) 80I....::J
.........0I....Q)
60CL
EU"I Q)
ex:> I-
40 ---e---Tom Ti
20 ~ I I I I I I I I I I I I I I I I I I I I I I I I I I I I I I I I I 1" I I I I I rTTrTTTTlo 50 100 150 200 250
Time (Hr)
Fig: 6.9 Measured value of Temperature in solar dryer.( Natural Air Flow Confiquration )

ooN
Q)
E0
'
01
-
oL()
rlrjrjrjrr-r-r-r-r-T-r-T
-r-"T'""T
".,...,..-.,...,..-....-r....-r....-rT"T
""T"T
"",......,......Ti"""T
"T"T
"T".,..-+
-0
o0
00
0CX)
<D~
N
(%)uoQ
Jnp8Cl
8JnfS!OV
\J
59
,,--......c
Q)
0E+--._
0I-L::s
(j).r;::})
>'+
C,---....
0~U
"'"--""
c>
o0
4-,;1
.L<->:::s.L\]«(l)0
:::oL<
D:::s
L____
::J0
cr;Z.-
"---'"o:2oO
Jl.L

0"o
LUV
....--+-'4-
0(j).L..c
"'":J-+-'
~ 100co.-
-+-'ouo
0:::
Loo
(/)
O I ii Ii- r , •
o 50 100 150Time(Hr)
200 250
Fig: 5.11 Measured value of Solar Radiation in solar dryer.( Natural Air Flow Configuration )
1\

Experiment NO.5
Data for one day were recorded and analyzed in this experiment with
the same arrangement as in Experiment No 4. Moisture removed was calcu
lated by two different methods as discussed earlier and compared with
the theoretical simulation results.
Table 6.6 and 6.7 show the data and calculations for both methods
respectively and figures 6.12 and 6.13 show the variation
perature and the relative humidity for each hour,
theoretical calculations.
of the tem
obtained fram
Fig 6.14 shows a comparison of the experimentally measured moisture
loss with the theoretical simulation results.
TABLE: 6.6. Measured Weight of Grapes for the Natural Air Flow
Configuration.
DATE TIME WEIGHT DECREASE in Remarks
Weight (Kg)
06-03-89 7:00 am 8.89
7:30 pm 7.8 1.01 Sunny
TABLE: 6.7 Rate of Moisture Removed Based on the Air Temperature and
Humidity Measurements ( Natural Air Flow Configuration )
Time V W A=Wo/Vo B=Wi/Vi m
cu. f·_, Ib/Ib Ib/cu ft Ib/cu ft Ib/hr
-4
07:00 I 13.70 0.0130 9.46x10 -4
0 13.59 0.0128 9.41x10 0.038
-4
08:00 0 13.74 0.0136 9.8xH5 -4
I 13.61 0.0116 8.52x10 0.980
61

TobIe 6.7 (cont'd)
-4fi59:fi50 0 13.82 fi5.0121 8.7x1fi5 -4
I 14.fi55 fi5.011fi5 7.82x1~ 0.674
-410:00 0 13.98 0.0123 8.79x10
-4I 13.90 0.0122 8.77xHI 0.015
-411:£10 0 14.36 !2l.!2l126 8.77x10 -4
I 14.22 0.!2l12fi5 8.43xHI 0.260
-412:00 0 14.76 fi5.0170 11.5x1fi5 -4
I 14.29 !2l.!2l117 8.18x10 2.54
-413:00 0 15.02 0.0209 13.9x10 -4
I 14.32 0.0139 9.707x10 ;).19
-414:00 0 14.89 0.0167 11.2x10 -4
I 14.30 0.fi5143 HL2x10 0.919
-415:00 0 15.14 0.0223 14.73x10 -4
I 14.30 fi5.0155 10.8x10 3.010
-416:00 0 15.16 ~L 0234 15.3x1fi5 -4
I 14.25 fi5.0155 10.8x10 3.42
-417:00 0 14.96 0.0206 13.77xlfi5 -4
I 14.19 0.fi5161 11.34x10 1.86
-418:00 0 14.80 fi5.fi5186 12.56x10 -4
I 14.18 fi5.0151 1fi5.6xHI 1. 50
62

140
120 -
".--.....
LL~ -
~ 100 ~.:J
+-J
oL(})
0..
E(})I-
60-
./'
~~
0-- -8 - 0-- --0 - <9- -C\- . v"'0
--6--ToPl Ti
40 I I I 1 I T I I I I I I I I I I I I I I I I I I , I I I I , I 1 I I I I I I I I I I I I I II , I I I J I I I I T1 I I I I , I I ,
7 9 11 13 15 17 19Time(Hr)
Fig: 6.12 Measured value of Temperature in solar dryer.( Natural Air Flow Configuration )

100
G/"
Q-./
/0- -G
..--0--0'
-~-6':"" -- -Rorn Ri
-if
~ ~:r----1
'ED'<T"'l
\\
\,Q
"'-(0
""8, """
-60 .:
80 ..:
40 .
20 _
>--+-', .-·0-E=)
I
OJ>.-
+-'
Q.-
:nQ)
~cr:
o -=ITTTI I I I I I II I JTrrl I I 1'1 I I I I r I I r I II , I I I Il I I I I I I I I I I II I I I , I 1" I I lTn
? 9 'I 'j 13 15 17 19Time(Hr)
Fig: 6.13 Measured value of Rt$lative Humidity in solar dryer.(Natural Air Flow Configuration)

20
- -0- -Calculated W1
Exp"
-----..(f)
GY..0
0 Anaiy- "----U
/
QJ JiJ> c0 /
~ 10 )J/0::: /'
QJ;;a
Q') L01 :J
/'
-+-' ur(f).- /0
:2 /)TI
17159o-l~,~, :;:,,;,,; ,;",,;,,: ,T: ,::: ":',, :::
11 13Time(Hr)
Fig: 5. '14 Cumulative amount of moisture removed with respectto time(Ano Iytical & Experi nlental)(Natural Air Flow Configuration) \

j
.- --f.]- -Cnlculoted----- Ht:'(l SCI r~)d
til(J
-0 I)L .-Q)~,
oEQ)
rt:
ill
~, 1-_~_J
(j)
o'""'"...::::::
././
(I): ~/.---
/'
[j]__- ....... I
EJ -- .___-,. --- .....-- ,..-
[l) ~.,....,. ./"
k' -:;:-'". /..--p.--
o- 'I I I III-r";- r--r-r I I I I I I I I I---rl-T 'r',r-'-l-'r-r-TII13 I 1'- 17 'I /-1
" \) ;'1
Time(Hr)
f'jq: 5. '15 Meos1ured ond calculated I yaILle~) of rnoi~.JllJre rernovccJft-0 rn ~jt (l pes. (Caleu Iated v(1 Iues fro rn Ai,~ (J nd RI-l )
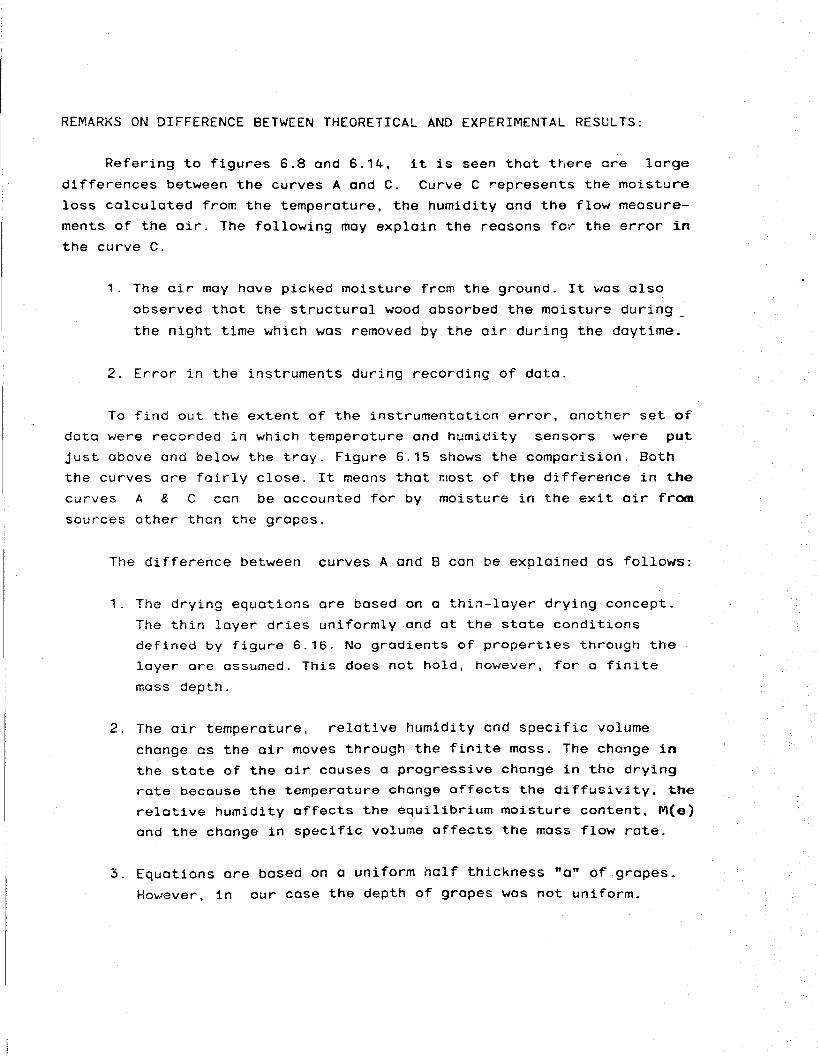
REMARKS ON DIFFERENCE BETWEEN THEORETICAL AND EXPERIMENTAL RESULTS:
Refering to figures 6.8 and 6.14, it is seen that there are large
differences between the curves A and C. Curve C represents the moisture
loss calculated from the temperature, the humidity and the flow measure
ments of the air. The following may explain the reasons fo. the error in
the curve C.
1. The air moy have picked moisture from the ground. It was also
observed that the structural wood absorbed the moisture during_
the night time which was removed by the air during the daytime.
2. Error in the instruments during recording of data.
To find out the extent of the instrumentation error, another set of
data were recorded in which temperature and humidity sensors were put
just above and below the tray. Figure 6.15 shows the comparision. Both
the curves are fairly close. It means that most of the difference in the
curves A & C can be accounted for by moisture in the exit air from
sources other thon the grapes.
The difference between curves A and B can be explained as follows:
1. The drying equations are based on a thin-layer drying concept.
The thin layer dries uniformly and at the state conditions
defined by figure 6.16. No gradients of properties through the
layer are assumed. This does not hold, however, for a finite
mass depth.
2. The air temperature, relative humidity and specific volume
change as the air moves through the finite mass. The change in
the state of the air causes a progressive change in the drying
rate because the temperature change affects the diffuSivity, the
relative humidity affects the equilibrium moisture content, M(a)
and the change in specific volume affects the mass flow rate.
3. Equations are based on a uniform helf thickness "a" of grapes.
However, in our case the depth of grapes was not uniform.

H
~---; VH
Fig: 6.16 The air state change b to d for .a dryingprocess.
68
CHAPTER 7
CONCLUSIONS
Geodesic dome type structure can be easily built with wood or
bamboo, in short time. and is economical because wood 1s cheap and
available in most parts of the world.
Tests showed that a geodesic solar dryer requires 7-8 sunny dOt~
to dry grapes. Results between the two experiments showed that a Natural
Air Configuration with a ventilator is a better choice than a Forced Air
Configuration. Tables 6.2 and 6.5 show that the moisture removed is al
most the same and it is convenient for the developing countries where
electricity is not available in some parts.
Data from the tables indicates that the ground moisture has sig
nificant effect on the drying process. For efficient drying, the mois
ture release from the ground should be minimized by covering the ground.

REFERENCES
1. Lawand, T.A., "A Solar Cabinet Dryer", Solar Energy, 1B (4),
i58, 1966
2. Gutierrez- Medina, J. A.,"Adoptive Use oT Greenhouse Structure Tor
Fruit Drying", M.S. Thesis, University of Arizona. Tuscon. AZ .• 1981
3. Huang, B. K. and Bowers. C.G.,"Development of Greenhouse Solar
Systems for Bulk Tobacco Curing and Plant Production", Energy 1n
Agriculture, 5, 267-284. 1986
4. Cruss, W. V. and Christie, A. W.. "Some Factors oT Dehydrator
EfTiciency". California Agriculture Experiment Station. Bulletin 337:
284-287. 1921
5. Christie, A. W. and Nichols, P.F., "The Dehydration of Prunes",
California Agriculture Experiment Station, Bulletin 404: 10-19, i927
6. Mark, E. M.• "Dehydration of Fruits". Agriculture Engineering 19: (8)
349-352, 1938
7. Genrty,J. P., Miller, M. W. and Claypool, l. L.,"Engineering and
Fruit Drying Aspects of Prune Dehydration in Parallel and Counter
flow Tunnels, Food Technology, 19:(9), 121-125. 1965
8. Robert, A. Parsons, Parallel Flow Fruit Drying, 1968
9. Rodda. E. D. and Gentry, J. P.,"New Concept in Fruit Dehydration
Construction", Transaction of ASAE, 12: (4), 540-542, 1969
10. Cheng, P. K., Control of Flow Seperation, McGraw Hill, New York.
1976
11. Groh, J. E.,"Energy Conssrvation in Fruit Dehydrators Utilizing
Recirculation oT Exhaust Air and Heat Recovery !'~at Exchangers".
Final Report for contact No.E (11-1) -2916, U.S. Energy Research and
Development Administration, 1978
12. Carnegie, E. J., Heat Recovery on a Tunnel Dehydrator. Paper
presented at the ASAE meeting in San Antonio, TX, June 15-18. Paper
70
13. Thomson, F. J. , Chinnan, M. W. , and Knutson, G. D. ,"Energy Conservation of Drying of Fruits in TunnelDehydrators" , Journal of Food Process Engineering, 4,p.15S-169.
14. Adam, "Types of Solar Agricultural dryers", Sunworld, 4.(6), 181, 1980
15. Paschkins, V ,"Periodic heat flow in building wallsdetermined by electrical analogy method", Trans. ASHVE48:75-90, 1942
16. Paschkins, V. and Baker, H. D. "A method fordetermining unsteady-state heat transfer by means of anelectrical analogy", Trans. ASHE 64: 10S-112, 1942.
17. Nottage, H. B. and Parmelee, G. V. "Circuit analysisapplied to load estimating. Trans. ASHVE 60: 59-102,1954.
18. Buchberg, H., 10 Electrical analogue predictionthermal behavior of an inhabi table enclosure.ASHVE 61: 339-386, 1955.
of theTrans.
19. Jenson, W.R. and Lieberman, M.D., "IBM electronic circuitanalysis program (ECAP) techniques and applications.Prentice-Hall Inc., Englewood Cliffs, N.J., 1968.
20. Huang, B. K. , "Digi tal simulation analysis of biophysicalsystems", Trans. IEEE BME-19(2): 128-139, 1974.
21. Huang, B. K. , "Electronic circui t analysis programapplication", Agriculture Engineering, 55(7) : 52, 1974.
22. Jordan, K. A., Huang, B. K. and Magee, C., "ECAP inagriculture engineering, teaching and research", Trans.ASAE 18(3) : 596-600, 1975.
23. Huang, B. K. ,"Dynamic system analogies and mathematicalinterpretation", ASAE winter meeting, Dec. 11-14, paperno. 73-5549, 1973.
24. Huang, B.K. and El-Shaik, N.M., "Simulation analysis ofgreenhouse solar drying system for peanuts and grains",ASAE 1979 summer meeti~g, paper no. 79-3082, 1979.
25. Ozisik, N.M. and Huang, B.K., "Utilizing of solar energyin grain drying", Final Report, North Carol ina EnergyInstitute, Research Triangle Park, N.C. 27709, July 1979.
26. "Dome Book 1", Shelter Publications, Box 279, Bolinas,CA
27. "Dome Book 2". Shelter Publications. Bolinas. CA
71

28. "Shelter II", Shelter Publications, Bolinas, CA
29. Henderson, S. M. and Perry, R. L.," Agricult ural ProcessEngineering", AVI Publishing, Westport, CT 06880
72