low emission diesel (led) study: biodiesel and renewable
TRANSCRIPT

i
Final Report
Low Emission Diesel (LED) Study: Biodiesel and Renewable Diesel Emissions in Legacy
and New Technology Diesel Engines
Prepared for: California Air Resources Board
1001 "I" Street P.O. Box 2815
Sacramento, CA 95812
November 2021
Submitted by: Dr. Thomas D. Durbin Dr. George Karavalakis
Dr. Kent C. Johnson Dr. Cavan McCaffery
Mr. Hanwei Zhu Mr. Huawei Li
University of California CE-CERT
Riverside, CA 92521 951-781-5791
951-781-5790 (fax)

ii
Disclaimer
The statements and conclusions in this report are those of the contractor and not necessarily those of the California Air Resources Board (CARB). The mention of commercial products, their source, or their use in connection with material reported herein is not to be construed as actual or implied endorsement of such products.
Acknowledgments
The authors thank the following organizations and individuals for their valuable contributions to this project.
The authors acknowledge CARB for assistance in developing the test plan procedures and assisting with data analysis.
We acknowledge funding from CARB under contract No. 18ISD027 and an engine for testing.
We acknowledge the National Biodiesel Board (NBB) and Renewable Energy Group, Inc. for providing test fuels as an in-kind contribution. We acknowledge NBB for providing a test engine as in-kind support. We acknowledge Deere and Company, Cummins Inc., Caterpillar Inc., and the Truck and Engine Manufacturers Association for providing technical assistance with the installation and operation of the engines on the engine dynamometer.
We acknowledge Mr. Mark Villela, Mr. Dany Gomez, Mr. Victor Moran, Mr. Tianbo Tang, Mr. Daniel Hartnett, Mr. Nathaniel Wilde, and Mr. Franklin Ippoloti of the University of California, Riverside for their contributions in conducting the emissions testing and fuel blending for this program.

iii
Table of Contents
Abstract vii Executive Summary x 1 Introduction 1 2 Objectives 3 3 Experimental Procedures 4
3.1 Test Fuels ....................................................................................................................4 3.2 Test Engines ................................................................................................................9 3.3 Emissions Testing ...................................................................................................... 10 3.4 Test Matrix and Test Sequence .................................................................................. 12
3.4.1 Off-Road Legacy Engine ....................................................................................... 13 3.4.2 On-Road NTDE ..................................................................................................... 15 3.4.3 Off-Road NTDE .................................................................................................... 15
4 Engine Testing Results 18 4.1 NOx Emissions .......................................................................................................... 18
4.1.1 Off-Road Legacy Engine NOx Emissions .............................................................. 18 4.1.2 On-Road NTDE NOx Emissions ............................................................................ 19 4.1.3 Off-Road NTDE NOx Emissions ........................................................................... 22
4.2 PM Emissions ............................................................................................................ 26 4.2.1 Off-Road Legacy Engine PM Emissions ................................................................ 26 4.2.2 On-Road NTDE PM Emissions .............................................................................. 27 4.2.3 Off-Road NTDE PM Emissions ............................................................................. 28
4.3 THC Emissions .......................................................................................................... 30 4.3.1 Off-Road Legacy Engine THC Emissions .............................................................. 30 4.3.2 On-Road NTDE THC Emissions ........................................................................... 31 4.3.3 Off-Road NTDE THC Emissions ........................................................................... 32
4.4 CO Emissions ............................................................................................................ 32 4.4.1 Off-Road Legacy Engine CO Emissions ................................................................ 32 4.4.2 On-Road NTDE CO Emissions .............................................................................. 34 4.4.3 Off-Road NTDE CO Emissions ............................................................................. 35
4.5 CO2 Emissions ........................................................................................................... 37 4.5.1 Off-Road Legacy Engine CO2 Emissions ............................................................... 37 4.5.2 On-Road NTDE CO2 Emissions............................................................................. 38 4.5.3 Off-Road NTDE CO2 Emissions ............................................................................ 39
4.6 Brake Specific Fuel Consumption (BSFC) ................................................................. 40 4.6.1 Off-Road Legacy Engine BSFC ............................................................................. 40 4.6.2 On-Road NTDE BSFC........................................................................................... 41 4.6.3 Off-Road NTDE BSFC .......................................................................................... 42
4.7 Total and Solid Particle Number Emissions ............................................................... 43 4.8 Particle Size Distributions .......................................................................................... 47
4.8.1 Off-Road Legacy Engine PSDs .............................................................................. 47 4.8.2 On-Road NTDE PSDs ........................................................................................... 48
5 Summary and Conclusions 50 Appendix A: Cummins FTP Outlier Discussion A-1Appendix B: CARB Reference Fuel Certificate of Analysis B-1Appendix C: Southwest Research Institute Fuel Analysis Results C-1

iv
Appendix D: Laboratory Resources D-1Appendix E: QA/QC Procedures E-1Appendix F: Test Cycles F-1Appendix G: Detailed Emissions Test Results G-1
Table of Tables
Table 3-1. CARB Reference Fuel and Renewable Diesel Analysis Results and Specifications 6 Table 3-2. Biodiesel (B100) Fuel Analysis Results and Specifications 7 Table 3-3. Fuel Property Analysis Results and Properties 8 Table 3-4. General Description of Test Engines 9 Table 3-5. Specifications of the Test Engines 10 Table 3-6. Measurements Type and Instrumentation Used for Data Other Than Emissions 12 Table 3-7. Test Cycles to Be Used for Each Engine 13 Table 3-8. Test Sequence to Be Used for each Test Cycle for the Off-Road Legacy Engine 15 Table 3-9. Test Sequence for the FTP and RMC/SET Cycles on the On-Road NTDE 15 Table 3-10. Test Sequence for the NRTC Cycle on the Off-Road NTDE 16 Table 3-11. Test Sequence for the Ramped Modal C1 Cycle on the Off-Road NTDE 16 Table 3-12. Full Test Matrix for All Engines and Cycles 17 Table 4-1. NOx Emissions, and Percentage Differences and Statistical Comparisons Between
Biofuels and the CARB Reference Fuel for the Off-road Legacy Engine 19 Table 4-2. NOx Emissions, and Percentage Differences and Statistical Comparisons Between
Biofuels and the CARB Reference Fuel for the On-Road NTDE Testing 20 Table 4-3. NOx Engine-Out Emissions (g/bhp-hr), Percentage Differences Between the Biofuels
and the CARB reference fuel, and Statistical Significance for On-Road NTDE Testing 21 Table 4-4. Average NOx Engine-Out Emissions (g/bhp-hr) Compared to Tailpipe-Out Emissions
Percentage Differences Between Biofuels and the CARB Reference Fuel for the On-Road NTDE RMC Testing 21
Table 4-5. NOx Emissions, and Percentage Differences and Statistical Comparisons Between Biofuels and the CARB Reference Fuel for the Off-Road NTDE Testing 23
Table 4-6. Engine Out NOx Emissions, and Percentage Differences and Statistical Comparisons Between Biofuels and the CARB Reference Fuel for the Off-Road NTDE Testing 24
Table 4-7. NOx Engine-Out Emissions (g/bhp-hr) Compared to Tailpipe-Out Emissions Percentage Differences Between Biofuels and the CARB Reference Fuel for Caterpillar Off-Road NTDE Testing 25
Table 4-8. PM Emissions, and Percentage Differences and Statistical Comparisons Between Biofuels and the CARB Reference Fuel for the Off-Road Legacy Engine 27
Table 4-9. PM Emissions, and Percentage Differences and Statistical Comparisons Between Biofuels and the CARB Reference Fuel for the On-Road NTDE 28
Table 4-10. PM Emissions, and Percentage Differences and Statistical Comparisons Between Biofuels and the CARB Reference Fuel for the Off-Road NTDE Testing 29

v
Table 4-11. THC Emissions, and Percentage Differences and Statistical Comparisons Between Biofuels and the CARB Reference Fuel for the Off-Road Legacy Engine 31
Table 4-12. THC Emissions, and Percentage Differences and Statistical Comparisons Between Biofuels and the CARB Reference Fuel for the On-Road NTDE Testing 32
Table 4-13. CO Emissions, and Percentage Differences and Statistical Comparisons Between Biofuels and the CARB Reference Fuel for the Off-Road Legacy Engine 34
Table 4-14. CO Emissions, and Percentage Differences and Statistical Comparisons Between Biofuels and the CARB Reference Fuel for the On-Road NTDE Testing 35
Table 4-15. CO Emissions, and Percentage Differences and Statistical Comparisons Between Biofuels and the CARB Reference Fuel for the Off-Road NTDE Testing 36
Table 4-16. CO2 Emissions, and Percentage Differences and Statistical Comparisons Between Biofuels and the CARB Reference Fuel for the Off-Road Legacy Engine 38
Table 4-17. CO2 Emissions, and Percentage Differences and Statistical Comparisons Between Biofuels and the CARB Reference Fuel or the On-Road NTDE Testing 39
Table 4-18. CO2 Emissions, and Percentage Differences and Statistical Comparisons Between Biofuels and the CARB Reference Fuel for the Off-Road NTDE Testing 40
Table 4-19. BSFC (gal/bhp-hr), and Percentage Differences and Statistical Comparisons Between Biofuels and the CARB Reference Fuel for the Off-Road Legacy Engine 41
Table 4-20. BSFC, and Percentage Differences and Statistical Comparisons Between Biofuels and the CARB Reference Fuel for the On-Road NTDE Testing 42
Table 4-21. Average BSFC and Percentage Differences Between the Renewable/Biodiesel Fuels and the CARB Reference Fuel for the Off-Road NTDE Testing 43
Table 4-22. TPN Emissions, and Percentage Differences and Statistical Comparisons Between Biofuels and the CARB Reference Fuel for the Off-Road Legacy Engine Testing 45
Table 4-23. SPN Emissions, and Percentage Differences and Statistical Comparisons Between Biofuels and the CARB Reference Fuel for the Off-Road Legacy Engine Testing 46
Table 4-24. TPN Emissions, and Percentage Differences and Statistical Comparisons Between Biofuels and the CARB Reference Fuel for the On-Road NTDE Testing 46
Table 4-25. SPN Emissions, and Percentage Differences and Statistical Comparisons Between Biofuels and the CARB Reference Fuel for the On-Road NTDE Testing 46
vi
Table of Figures
Figure 4-1. Average NOx Emission Results for the Off-Road Legacy Engine Testing 19 Figure 4-2. Average NOx Emission Results for the On-Road NTDE Testing 20 Figure 4-3. Average Sensor-Based NOx Emissions for the On-Road NTDE RMC cycle 22 Figure 4-4. Average NOx Emission Results for the Off-Road NTDE Testing 23 Figure 4-5. Average Engine Out and Tailpipe NOx Emissions for the Off-Road NTDE 24 Figure 4-6. Average PM Emission Results for the Off-Road Legacy Engine Testing 26 Figure 4-7. Average PM Emission Results for the On-Road NTDE Testing 28 Figure 4-8. Average PM Emission Results for the Off-Road NTDE Testing 29 Figure 4-9. Average THC Emission Results for the Off-Road Legacy Engine Testing 30 Figure 4-10. Average THC Emission Results for the On-Road NTDE Testing 31 Figure 4-11. Average CO Emission Results for the Off-Road Legacy Engine Testing 33 Figure 4-12. Average CO Emission Results for the On-Road NTDE Testing 34 Figure 4-13. Average CO Emission Results for the Off-Road NTDE Testing 36 Figure 4-14. Average CO2 Emission Results for the Off-Road Legacy Engine Testing 37 Figure 4-15. Emission Results for the On-Road NTDE Testing 38 Figure 4-16. Average CO2 Emission Results for the Off-Road NTDE Testing 39 Figure 4-17. Average Brake Specific Fuel Consumption Results for the Off-Road Legacy Engine
Testing 41 Figure 4-18. Average BSFC Results for the On-Road NTDE Testing 42 Figure 4-19. Average BSFC Results for the Off-Road NTDE Testing 43 Figure 4-20. Average Total Particle Number and Solid Particle Number Emissions for the Off-
Road Legacy Engine and On-Road NTDE Testing 44 Figure 4-21. Particle Size Distributions for the Off-Road Legacy Engine Testing on (a) NRTC
cycle and (b) D2 cycle 48 Figure 4-22. Particle Size Distributions for the On-Road NTDE (a) on FTP cycle and (b) RMC
cycle 49

vii
Abstract
For the purposes of this study, emissions and operation data using renewable diesel/biodiesel fuel blends and a petroleum-based reference California Air Resources Board (CARB) diesel will be gathered from a “legacy” (older) engine without a modern emissions control system, and two types of new technology diesel engines (NTDE), which are more current engines with emission control systems including selective catalytic reduction (SCR) and diesel particulate filters (DPF).
This study aims to:
1. Evaluate the NOx and PM emissions resulting from use of renewable diesel fuel andselected renewable diesel/biodiesel fuel blends in a legacy off-road engine.
2. Evaluate the NOx and PM emissions resulting from use of renewable diesel fuel andselected renewable diesel/biodiesel fuel blends in on-road and off-road NTDEs.
The three engines types were an off-road legacy engine, an on-road heavy-duty NTDE, and an off-road NTDE. The off-road legacy engine was a 2009 model year John Deere. The on-road NTDE was a 2019 Cummins engine, and the off-road NTDE was a 2018 Caterpillar engine. For this study, the emissions and performance effects of three renewable diesel/biodiesel blends – 100 percent renewable diesel (R100), 65 percent renewable diesel/35 percent biodiesel (R65/B35), and 50 percent renewable diesel/50 percent biodiesel (R50/B50) were tested in each engine against a petroleum-based CARB reference fuel (CARB reference fuel). The emissions test cycles for each test engine and fuel included an engine-appropriate transient cycle and an engine-appropriate steady state cycle.
Results and Conclusions:
NOx emissions in the legacy off-road engine for both cycles were reduced when using R100 fuel compared to the CARB reference fuel. There was no difference in NOx emissions for both cycles when compared to the CARB reference fuel for the R65/B35 blend (highest ratio of renewable diesel to biodiesel), while there were increased NOx emissions compared to the CARB reference fuel for the R50/B50 blends (lowest ratio of renewable diesel to biodiesel) for both transient and steady state cycles.
The results for this legacy engine are consistent with previously observed reductions in NOx emissions with R100 as the test fuel, and increased emissions of NOx from the use of biodiesel in fuel. They are also consistent with the observations that renewable diesel in a renewable diesel/biodiesel blend can reduce NOx emissions arising from the use of biodiesel, with the highest ratio of renewable diesel to biodiesel (R65/B35) in this study resulting in NOx emissions that were not significantly different from CARB reference fuel (also referred to as a NOx-neutral ratio), where the R50/B50 blend (the lowest ratio of renewable diesel to biodiesel) did result in higher NOx emissions than CARB reference fuel. Therefore, the renewable diesel in the R50/B50 blend did not sufficiently reduce NOx emissions from biodiesel such that emissions were NOx neutral, while the R65/B35 blend did result in NOx-neutral emissions.
PM emissions in the legacy off-road engine showed statistically significant reductions in comparison to the CARB reference fuel for all test biofuels and both cycles, with the greatest PM

viii
reductions observed in the renewable diesel/biodiesel blends with the highest biodiesel concentrations, confirming previous observations that biodiesel does act to reduce PM emissions in legacy diesel engines.
NOx emissions from both NTDEs with R100 as the test fuel were not statistically different than the CARB reference fuel. NOx emissions in the renewable diesel/biodiesel blends were statistically higher than the CARB reference fuel for both NTDEs, with emissions increasing as the renewable diesel to biodiesel ratio decreased (i.e., biodiesel concentration increased and renewable diesel concentrations decreased), although the NOx emissions increases were not linear. These results indicate that in these particular NTDEs, equipped with state-of-the-art emissions control systems, NOx emissions resulting from the two renewable diesel/biodiesel blends tested (R65/B35 and R50/B50) were not completely controlled, i.e., were not NOx-neutral relative to CARB reference fuel, although the NOx emissions overall in the NTDE engines were orders of magnitude lower than those from the off-road legacy engine.
There were no statistical differences in PM emissions in the NTDEs observed in any test fuel or test cycle compared to the CARB reference fuel, indicating that PM emissions are effectively controlled by the exhaust aftertreatment systems, no matter the biofuel blend or test cycle.

ix
Acronyms and Abbreviations
ADF ................................................. Alternative Diesel Fuel APC ................................................. AVL particle counter BSFC ............................................... brake specific fuel consumption CAI .................................................. California Analytical Instruments CARB .............................................. California Air Resources Board CE-CERT ........................................ Bourns College of Engineering-Center for Environmental
Research and Technology (University of California, Riverside)
CCR ................................................. California Code of Regulations CFR ................................................. Code of Federal Regulations CO ................................................... carbon monoxide CO2 .................................................. carbon dioxide COA ................................................ Certificate of Analysis CPC ................................................. condensation particle counter CVS ................................................. Constant Volume Sampling DPF ................................................. diesel particle filter ECM ................................................ engine control module EEPS ............................................... Engine Exhaust Particle Sizer EPA ................................................. U.S. Environmental Protection Agency FTP .................................................. Federal Test Procedure g/bhp-hr ........................................... grams per brake horsepower hour hp ..................................................... horsepower kw .................................................... kilowatt LCFS..................................................Low Carbon Fuel Standard LED ................................................. Low Emission Diesel MEL ................................................ CE-CERT’s Mobile Emissions Laboratory NOx ................................................. nitrogen oxides NRTC .............................................. Nonroad Transient Cycle NTDE .............................................. new technology diesel engine PEMS .............................................. portable emissions measurement system PM ................................................... particulate matter PN.................................................... particle number PSD ................................................. particle size distribution RMC ................................................ Ramped Modal Cycle QA ................................................... quality assurance QC ................................................... quality control THC ................................................. total hydrocarbons SCR ................................................. selective catalytic reduction SET .................................................. Supplementary Emissions Test SwRI ................................................ Southwest Research Institute UCR................................................. University of California Riverside ULSD .............................................. ultra-low sulfur diesel

x
Executive Summary
Background
The California Air Resources Board (CARB) must continue to reduce oxides of nitrogen (NOx) and particulate matter (PM) emissions from on-road and off-road diesel-powered vehicles and equipment, including on-road heavy-duty vehicles, off-road engines, stationary engines, portable engines, marine vessels and locomotives, as part of the California’s State Implementation Plan.1 Past studies have indicated that fuels such as renewable diesel, NOx-mitigated biodiesel, renewable diesel/biodiesel blends, cleaner refined diesel, gas to liquid diesel, and compressed natural gas can reduce NOx and/or PM emissions relative to conventional diesel.
Objectives and Methods
This study seeks to further characterize the emissions and performance effects of renewable diesel and renewable diesel/biodiesel blends in legacy engines (i.e., engines without selective catalytic reduction (SCR) exhaust treatment and diesel particulate filters (DPF) – also known as non-new technology diesel engines (non-NTDE)) – and in new technology diesel engines (NTDE). For the purposes of this study, NTDEs are defined as engines with SCR and DPF exhaust aftertreatment systems. Emissions are generally reported in grams/brake horsepower-hour (g/bhp-hr) unless otherwise noted. This study aims to:
1. Evaluate the NOx and PM emissions resulting from use of renewable diesel fuel andselected renewable diesel/biodiesel fuel blends in a legacy off-road engine.
2. Evaluate the NOx and PM emissions resulting from use of renewable diesel fuel andselected renewable diesel/biodiesel fuel blends in on-road and off-road NTDEs.
To achieve the objectives above, emissions testing was conducted using a renewable diesel fuel and renewable diesel/biodiesel blends using an engine dynamometer with an off-road legacy engine, a heavy-duty on-road NTDE, and an off-road NTDE. Performance testing was also conducted to measure changes in fuel economy.
Test Fuels
The test fuels included a CARB reference fuel (a petroleum-based, ultra-low sulfur diesel meeting ASTM 975 specifications and the properties in Table A.9 of the Alternative Diesel Fuel (ADF) regulation) as a baseline fuel, a neat (100 percent or 99 percent) renewable diesel fuel (R100/R99 – referred to as R100 in this study – meeting ASTM975 specifications and Table A.9 of the ADFregulation), a blend of 65 percent renewable diesel and 35 percent biodiesel (R65/B35) with neatbiodiesel meeting ASTM6751 and Table A.8 of the ADF regulation, and a blend of 50 percentrenewable diesel and 50 percent biodiesel (R50/B50).
1 CARB. 2017. Revised Proposed 2016 State Strategy for the State Implementation Plan. March 7. Available at: https://www.arb.ca.gov/planning/sip/2016sip/rev2016statesip.pdf. Accessed: January, 2017.

xi
Test Engines
There were three test engines used in the study: an off-road legacy engine, an on-road heavy-duty NTDE, and an off-road NTDE, as shown in Table ES-1. The selected off-road legacy engine was a John Deere 4045HF285 engine that has been used in previous biodiesel and renewable diesel engine testing conducted by University of California, Riverside (UCR) Bourns College of Engineering-Center for Environmental Research and Technology (CE-CERT) and CARB.2 The on-road heavy-duty and off-road NTDEs were late-model engines to ensure that the engines were equipped with the most advanced emissions control technology currently available, including SCR and DPF. The on-road heavy-duty NTDE was a Cummins engine. Cummins engines are a staple of the California diesel engine market in Class 7 or Class 8 trucks. The off-road NTDE was a Caterpillar engine, which represents one of the most common engines in the off-road equipment category in California. The table below is a summary of the engines’ characteristics:
Table ES-1. General Description of Test Engines
No. Engine Type SCR-Equipped?
DPF-Equipped? HP Model
Year Vocation Manufacturer
1 Off-Road Legacy No No 115 2009 Construction John Deere
2 On-Road Heavy-Duty NTDE Yes Yes 450 2019 T7 or T8
Truck Cummins
3 Off-Road NTDE Yes Yes 225 2018 Industrial Off-road Caterpillar
Test Procedures
The test cycles used for this program included the Federal Test Procedure (FTP), the Non-Road Transient Cycle (NRTC), and steady state Ramped Modal Cycles (RMC). The NRTC is the transient test used in the engine certification procedure for off-road diesel-fueled engines, and the FTP is the transient test used for engine certification for heavy-duty diesel fueled on-highway engines. The RMCs are steady state cycles used in engine certification for both on-highway and off-road engines, with different steady state cycles used for the different engines. For the John Deere off-road legacy engine, a five-mode D2 ISO 8718 steady state cycle was utilized (D2 cycle), which is the cycle typically used for certification of constant speed off-road engines.3 For the Cummins on-road heavy-duty NTDE, a 13-mode, Supplementary Emissions Test (SET) RMC steady state cycle was used, as is used in the federal certification of this engine. For the Caterpillar off-road NTDE, an eight-mode C1 ISO 8718 steady state cycle was used (C1 cycle), which is the cycle typically used for certification of variable speed off-road engines.
2 Durbin et al. 2011. CARB Assessment of the Emissions from the Use of Biodiesel as a Motor Vehicle Fuel in California, “Biodiesel Characterization and NOx Mitigation Study,” Final Report. October. Available at: https://www.arb.ca.gov/fuels/diesel/altdiesel/20111013_CARB%20Final%20Biodiesel%20Report.pdf. 3 https://www.epa.gov/compliance-and-fuel-economy-data/annual-certification-data-vehicles-engines-and-equipment.
The engine emissions testing was performed at the UCR's college of Engineering-Center for Environmental Research and Technology's (CE-CERT) heavy-duty engine dynamometer

xii
laboratory. This engine dynamometer test laboratory is equipped with a 600-hp General Electric DC electric engine dynamometer.
Emissions of NOx, PM, non-methane hydrocarbons (NMHC), total hydrocarbons (THC), carbon monoxide (CO), and carbon dioxide (CO2) were measured during all tests, along with a determination of fuel consumption made via carbon balance. The emissions measurements were made using the standard analyzers in CE-CERT’s heavy-duty Mobile Emissions Laboratory (MEL) trailer.
Results
Summary results for each of the pollutants are provided below. All statistical analyses are in comparison to the CARB reference fuel. For the discussion in this report, results are considered to be statistically significant for p values ≤0.05 using a using a 2-tailed, 2-sample, equal-variance t-test, meaning that the probability that the compared emissions differences would arise by chanceis less than or equal to 5 percent. Comparisons where 0.05 ≤p values <0.1 were consideredmarginally statistically significant for this report, and are also noted in the text. Statisticallysignificant results are bolded and the percent difference compared to CARB reference fuel isshown in red text in the tables. It should be noted that for the on-road heavy-duty NTDE, a subsetof outlier tests were observed over the FTP that were not included in the data presented in theExecutive Summary. These data are discussed in greater detail in Appendix A.
NOx Emissions
Average NOx emissions, and percentage differences and statistical comparisons between the test biofuels and CARB reference diesel for the off-road legacy engine are shown in Table ES-2. For the off-road legacy engine, NOx emissions were lower for the R100 fuel than those from the CARB reference fuel for both the NRTC and D2 cycles. The R100 fuel showed statistically significant NOx reductions of 5.4% for the NRTC and 4.9% for the D2 cycle. The R65/B35 blend showed no statistically significant difference compared to the CARB reference fuel for either the NRTC or D2 cycles. The R50/B50 showed statistically significant increases in NOx emissions of 1.8% for the NRTC and 4.2% for the D2 cycle in comparison to the CARB reference fuel.

xiii
Table ES-2. NOx Emissions, and Percentage Differences and Statistical Comparisons Between Biofuels and the CARB Reference Fuel for the Off-Road Legacy Engine
Cycle Fuel Type Ave. NOx Emissions (g/bhp-hr)
% Diff vs. CARB p-value(t-test)
. NRTC
.
.
CARB reference fuel 2.09 - - R100 1.98 -5.4 0.00
R65/B35 2.07 -1.2 0.18 R50/B50 2.13 1.8 0.05
. D2 . .
CARB reference fuel 2.01 - - R100 1.91 -4.9 0.00
R65/B35 2.01 0.0 0.97 R50/B50 2.09 4.2 0.02
Statistically significant results are bolded and their percent differences are in red text.
Average NOx emissions, and percentage differences and statistical comparisons between the test biofuels and CARB reference diesel for the on-road heavy-duty NTDE are shown in Table ES-3. For the on-road NTDE, no statistically significant NOx emissions differences were found between the CARB reference fuel and R100 for either the FTP or RMC cycles. The FTP cycle showed statistically significant increases of 46.6% for R65/B35 and 49.5% for R50/B50. The RMC cycle showed statistically significant increases of 14.2% for R65/B35 and 15.4% for R50/B50. Engine out NOx sensor data for the RMC cycle showed that there are increases in engine out NOx levels for the biodiesel blends, which is likely a key factor contributing to the higher tailpipe emissions for the renewable diesel/biodiesel blends. Comparison of the engine out and tailpipe out (after emissions control system) NOx data showed that the SCR provided a 95% to 96% reduction in NOx emissions for the different fuels.
Table ES-3. NOx Emissions, and Percentage Differences and Statistical Comparisons Between Biofuels and the CARB Reference Fuel for the On-Road NTDE
Cycle Fuel Type NOx Emissions (g/bhp-hr) % Diff vs. CARB p-value
(t-test) .
FTP . .
CARB reference fuel 0.11 - - R100 0.12 4.8 0.34
R65/B35 0.16 46.6 0.00 R50/B50 0.17 49.5 0.00
. RMC
.
CARB reference fuel 0.13 - - R100 0.14 2.3 0.19
R65/B35 0.15 14.2 0.00 R50/B50 0.15 15.4 0.00
Statistically significant results are bolded and their percent differences are shown in red.
Average NOx emissions, and percentage differences and statistical comparisons between the test biofuels and CARB reference diesel for the off-road NTDE are shown in Table ES-4. For the off-road NTDE testing, NOx emissions showed no statistically significant differences between R100 and the CARB reference fuel for either test cycle. For the NRTC cycle, statistically significant increases of 88.3% for the R65/B35 blend and 146.9% for the R50/B50 blend were observed. For

xiv
the C1 cycle, statistically significant increases of 55.1% for the R65/B35 blend and 119.4% for the R50/B50 blend were observed.
The engine-out data for the off-road NTDE did not show any statistically significant differences between the R100 and the CARB reference fuel for either cycle. The engine out data show consistently higher and statistically significant increased NOx emissions for the R65/B35 blends and the R50/B50 fuels blends compared with the CARB reference fuel for both cycles. Comparison of the engine out and tailpipe NOx data showed that the SCR provided NOx reduction efficiencies of 93% for the CARB reference fuel, 91% for R100, 88% for R65/B35, and 85% for R50/B50. The SCR provided NOx reductions of 98% to 99% for all fuels for the C1 cycle.
Table ES-4. NOx Emissions, and Percentage Differences and Statistical Comparisons Between Biofuels and the CARB Reference Fuel for the Off-Road NTDE
Cycle Fuel Type NOx Emissions (g/bhp-hr) % Diff vs. CARB p-value
(t-test).
NRTC . .
CARB reference fuel 0.18 - - R100 0.22 20.1 0.11
R65/B35 0.34 88.3 0.00 R50/B50 0.45 146.9 0.00
. C1 . .
CARB reference fuel 0.014 - - R100 0.015 10.5 0.56
R65/B35 0.021 55.1 0.01 R50/B50 0.030 119.4 0.01
Statistically significant results are bolded and their percent differences are shown in red text.
PM Emissions
Average PM emissions, and percentage differences and statistical comparisons between the test biofuels and CARB reference fuel for the off-road legacy engine are presented in Table ES-5. PM emissions decreases were observed for the renewable diesel and the renewable diesel/biodiesel blends for both the NRTC and the D2 cycles. The reductions for the NRTC when compared to the CARB reference fuel were 38% for R100, 53% for R65/B35, and 63% for R50/B50. The reductions for the D2 compared to the CARB reference fuel were 27% for R100, 51% for R65/B35, and 58% for R50/B50.

xv
Table ES-5. Average PM emissions, and Percentage Differences and Statistical Comparisons Between the Test Biofuels and CARB Reference Fuel for the Off-Road
Legacy Engine
Cycle Fuel Type PM Emissions (g/bhp-hr) % Diff vs. CARB p-value
(t-test)
NRTC CARB reference diesel 0.061 - -
R100 0.038 -38 0.00 R65/B35 0.028 -53 0.00 R50/B50 0.023 -63 0.00
D2 CARB reference diesel 0.052 - -
R100 0.038 -27 0.00 R65/B35 0.025 -51 0.00 R50/B50 0.022 -58 0.00
Statistically significant results are bolded and their percent differences are shown in red.
For the on-road NTDE, PM mass emissions in general were low and near background levels, and averaged less than 0.001 g/bhp-hr for all tests conditions and both cycles. As the PM standard for heavy-duty on-road engines is 0.01 g/bhp-hr, the PM emissions observed are for the most part at least 20-fold lower than the PM standard. The PM emissions for the different fuels generally did not show statistically significant differences, with the exception of the R50/B50, which had emissions that were lower than those for the CARB reference fuel at a marginally statistically significant level over the FTP cycle.
For the off-road NTDE, PM mass emissions were more than a factor of 30 below the 0.015 g/bhp-hr PM standard for Tier 4 off-road engines in this size category for all test conditions and both cycles. No statistically significant differences in PM mass emissions were seen between fuels for either test cycle.
Total Hydrocarbon (THC) Emissions
For the off-road legacy engine, THC emissions showed significant decreases for renewable diesel and the renewable diesel/biodiesel blends for both the NRTC and D2 cycles. The reductions for the NRTC compared to the CARB reference fuel were 45% for R100, 49% for R65/B35, and 66% for R50/B50. The reductions for the D2 cycle compared to the CARB reference fuel were 35% for R100, 58% for R65/B35, and 71% for R50/B50.
For the on-road NTDE, THC emissions were near or below background levels for all tests conditions and both cycles. For the FTP, only R50/B50 showed a statistically significant reduction relative to the CARB reference fuel, with R100 and R65/B35 showing no statistically significant differences in THC emissions relative to the CARB reference fuel. For the RMC cycle, THC emissions levels were below the background levels for all tests, and hence there were no measurable THC emissions.
For the off-road NTDE, THC emissions were below the background levels for both the NRTC and C1 cycles and for all fuels. Therefore, there were no statistically significant differences in THC emissions relative to the CARB reference fuel.

xvi
CO Emissions
For the off-road legacy engine, CO emissions showed statistically significant decreases for the renewable diesel and the renewable diesel/biodiesel blends for both the NRTC and D2 cycles. The reductions for the NRTC compared to the CARB reference fuel were 22% for R100, 26% for R65/B35, and 32% for R50/B50. The reductions for the D2 cycle compared to the CARB reference fuel were 14% for R100, 28% for R65/B35, and 32% for R50/B50.
For the on-road NTDE, the FTP showed no statistically significant changes in CO emissions for any of the test biofuels relative to the CARB reference fuel. The RMC showed a slight reduction of 5% with R100, with no statistical difference in CO emissions observed with the R65/B35 and R50/B50 blends.
For the off-road NTDE, for the NRTC, measurable, but low CO emissions were found for the CARB reference fuel and R100. The NRTC CO emissions for the R100 fuel were 44% lower than those for the CARB reference fuel. The NRTC CO emissions for the R65/B35 and R50/B50 fuels were much lower than those for the CARB reference fuel and R100 fuels, and were near or below the background levels for all tests. For the C1 cycle, CO emissions were near or below background levels for all tests.
CO2 Emissions
For the off-road legacy engine, statistically significant reductions in CO2 emissions from the NRTC of 4.1% for R100, 2.6% for R65/B35, and 1.7% for R50/B50 were observed in comparison to the CARB reference fuel. For the D2 cycle, the R100 showed a statistically significant reduction in CO2 emissions of 4.6% compared to the CARB reference fuel, while the R65/B35 and R50/B50 fuels did not show statistically significant differences compared to the CARB reference fuel.
For the on-road NTDE, CO2 emissions from the FTP showed statistically significant decreases of 3.2% for R100, 0.9% for R65/B35, and 0.8% for R50/B50 compared to the CARB reference fuel. The steady state cycle showed statistically significant decreases of 2.9% for R100 and 0.5% for R65/B35, and a marginally statistically significant increase of 0.3% for R50/B50 compared to the CARB reference fuel.
For the off-road NTDE, CO2 emissions showed statistically significant reductions for the R100 of 3.8% for the FTP and of 3.0% for the D2 cycle compared to the CARB reference fuel. CO2 emissions did not show statistically significant differences for the R65/B35 and R50/B50 fuels compared to the CARB reference fuel for either the NRTC or C1 cycles.
Brake Specific Fuel Consumption (BSFC)
For the off-road legacy engine, BSFC, measured in gallons/bhp-hr, showed statistically significant increases in the NRTC ranging from 3.5% for R100, 3.8% for R65/B35, and 4.4% for R50/B50 fuels compared to the CARB reference fuel. For the D2 cycle, there was no statistically significant change in BSFC for R100. For the D2 cycle, the R65/B35 showed a statistically significant BSFC

xvii
increase of 4.5% and the R50/B50 showed a marginally statistically significant BSFC increase of 3.4% compared to the CARB reference fuel.
For the on-road NTDE, BSFC for the transient cycle showed statistically significant increases in fuel consumption per bhp-hr for all of the biofuels, ranging from 4.8% for R100, 6.0% for R65/B35, and 57% for R50/B50. The steady state cycle also showed statistically significant increases in fuel consumption for all of the biofuels, ranging from 5.1% for R100, 6.6% for R65/B35, and 7.0% for R50/B50 when compared to the CARB reference fuel.
For the off-road NTDE, BSFC showed statistically significant increases for the NRTC BSFC ranging from 4.1% for R100, 5.8% for R65/B35, and 6.1% for the R50/B50 fuels compared to the CARB reference fuel. For the C1 cycle, BSFC showed statistically significant increases ranging from 5.0% for R100, 5.1% for R65/B35, and 5.2% for the R50/B50 fuels when compared to the CARB reference fuel.
Total and Solid Particle Number Emissions
As diesel particulate emissions have been shown to result in adverse health impacts, some additional particle measurements were included in this study to characterize particulate emissions in regard to biofuels. The number of particles is especially important given the fact that a measurement of total mass gives no indication as to the relative count of fine particles compared to the larger particles. Clinical and toxicological studies have shown that ultrafine particles (less than 100 nm diameter) can act through mechanisms not shared with larger particle sizes. 4 , 5 Measurements of total particle number (TPN) (greater than 3 nm diameter) and solid particle number (SPN) emissions were made for the off-road legacy engine and the on-road NTDE. SPN represents the number of solid particles greater than 23 nm in diameter (equivalent to 0.023 microns, as compared to the common 2.5 micron (PM2.5) metric for fine particulate air pollution), as defined by the European Union solid particle number emissions regulations. For both engines, the biofuels showed reductions in both TPN and SPN emissions, with the exception of TPN for R100 for the legacy off-road engine D2 cycle, which also showed a relatively large measurement variability. TPN and SPN emissions for both engines were seen in lower concentrations for the higher biodiesel blends relative to R100 and CARB reference fuel. These trends are consistent with those seen for the PM mass for the off-road legacy engine, where the PM mass emissions are well above the background levels.
Particle Size Distributions
Diesel-generated combustion particles are typically divided in three modes, nucleation mode (5-50 nm diameter), accumulation mode (50-1,000 nm diameter), and coarse mode (1,000-10,000 nm diameter). The nucleation mode typically consists of organic volatile compounds and can contain
4Solid Particle Number Emission Factors of Euro VI Heavy-Duty Vehicles on the Road and in the Laboratory Int J Environ Res Public Health. 2018 Feb; 15(2): 304. Published online 2018 Feb 9. doi: 10.3390/ijerph15020304, Barouch Giechaskiel https://www.ncbi.nlm.nih.gov/pmc/articles/PMC5858373/. 5 Review of evidence on health aspects of air pollution – REVIHAAP Project Technical Report, WHO 2013, https://apps.who.int/iris/bitstream/handle/10665/341712/WHO-EURO-2013-2663-42419-58845-eng.pdf?sequence=1.

xviii
ash and soot particles. Most soot particles agglomerate, however, and are usually found in the accumulation mode. Coarse mode particles are typically from larger soot particles breaking off of the exhaust walls.
For the off-road legacy engine, the R100, R65/R35, and R50/B50 fuels showed reductions in particle counts per bhp-hr over most of the particle size range compared to the CARB reference fuel for both cycles. These reductions were most significant for the larger particles in the accumulation mode, although reductions were also found in the nucleation mode size range, peaking around 30 nm for most of the biofuels relative to the CARB reference fuel. The R100 showed higher particle counts than the R65/B35 and R50/B50 fuels in the nucleation mode size range for both cycles and in the accumulation mode particle size range for the NRTC.
For the on-road NTDE, nucleation mode particles were about an order of magnitude lower than those measured for the off-road legacy engine. Surprisingly, the R65/B35 fuel showed the highest emissions for the FTP cycle, but also showed large measurement variability. Over the full test matrix, however, the use of biofuel blends generally resulted in lower particle counts in the different size ranges compared to the CARB reference fuel.
Conclusions
For NOx emissions, the results for this legacy engine are consistent with previously observed reductions in NOx emissions with R100 as the test fuel, and increased emissions of NOx from the use of biodiesel in fuel. They are also consistent with the observations that renewable diesel in a renewable diesel/biodiesel blend can reduce NOx emissions arising from the use of biodiesel, with the highest ratio of renewable diesel to biodiesel (R65/B35) in this study resulting in NOx emissions that were not significantly different from CARB reference fuel (also referred to as a NOx-neutral ratio), while the R50/B50 blend (the lowest ratio of renewable diesel to biodiesel) did result in higher NOx emissions than CARB reference fuel. Therefore, the renewable diesel in the R50/B50 blend did not sufficiently reduce NOx emissions from biodiesel such that emissions are NOx neutral, while the R65/B35 blend did result in NOx-neutral emissions.
NOx emissions from both NTDEs with R100 as the test fuel were not statistically different than the CARB reference fuel. NOx emissions in the renewable diesel/biodiesel blends were statistically higher than the CARB reference fuel for both NTDEs, with emissions increasing as the biodiesel to renewable diesel ratio increased (i.e., biodiesel concentration increased and renewable diesel concentrations decreased), although the NOx emissions increases were not linear. These results indicate that in these particular NTDEs, equipped with state-of-the-art emissions control systems, NOx emissions resulting from the two renewable diesel/biodiesel blends tested (R65/B35 and R50/B50) were not completely controlled, i.e., NOx-neutral relative to CARB reference fuel, although the NOx emissions overall in the NTDE engines were orders of magnitude lower than those from the legacy engine.
PM emissions in the legacy off-road engine showed statistically significant reductions in comparison to the CARB reference fuel for all test biofuels and both cycles, with the greatest PM reductions observed in the blends with the lowest renewable diesel/biodiesel ratios (highest biodiesel concentrations), confirming previous observations that biodiesel does act to reduce PM emissions in legacy diesel engines. There were no statistical differences in PM emissions in the

xix
NTDEs observed in any test fuel or test cycle compared to the CARB reference fuel, indicating that PM emissions are effectively controlled by the exhaust aftertreatment systems, no matter the biofuel blend or test cycle.

1
1 Introduction
The California Air Resources Board (CARB) must continue to reduce oxides of nitrogen (NOx) and particulate matter (PM) emissions from on-road and off-road diesel-powered vehicles and equipment, including on-road heavy-duty vehicles, off-road engines, stationary engines, portable engines, marine vessels and locomotives, as part of the California’s State Implementation Plan.6 Past studies have indicated that fuels such as renewable diesel, NOx-mitigated biodiesel, renewable diesel/biodiesel blends, cleaner refined diesel, gas to liquid diesel, and compressed natural gas (CNG) can reduce NOx and/or PM emissions relative to diesel.
This study seeks to further characterize the emissions and performance effects of renewable diesel and renewable diesel/biodiesel blends in both legacy engines (i.e., engines without selective catalytic reduction (SCR) exhaust treatment and diesel particulate filters (DPF)) and in new technology diesel engines (NTDE). For the purposes of this study, NTDEs are defined as engines with SCR and DPF exhaust treatment.
CARB, in conjunction with researchers from the University of California at Riverside’s (UCR) Bourns College of Engineering-Center for Environmental Research and Technology (CE-CERT), the University of California, Davis (UCD), and others, implemented a study (“joint study”) to characterize the emissions impacts of biodiesel and renewable diesel, relative to CARB ULSD, in several on-road and off-road7 engines under a variety of test conditions.8 Based on the results of the joint study, CARB anticipates that use of certain renewable diesel/biodiesel blends would result in NOx and PM reductions in on-road and off-road legacy engines. However, the joint study did not specifically investigate the emissions impacts of renewable diesel or renewable diesel/biodiesel blends in legacy off-road engines.
Recent studies of on-road heavy-duty NTDEs have shown NOx emissions above engine certification standards as a result of decreased efficiency of SCR systems at low load/low speed engine conditions and malfunction of SCR systems due to engine maintenance issues.9,10 Under these conditions, the emissions performance of an NTDE may be similar to a legacy engine. Although these studies did not consider the impact of renewable diesel or biodiesel in NTDEs under these conditions, the results of the joint study suggest that the use of renewable diesel/biodiesel blends may also result in NOx impacts in on-road and off-road NTDEs under these conditions (i.e., during low loads/low speed engine operation and when engines are experiencing maintenance issues).
6 CARB. 2017. Revised Proposed 2016 State Strategy for the State Implementation Plan. March 7. Available at: https://www.arb.ca.gov/planning/sip/2016sip/rev2016statesip.pdf. Accessed: January, 2017. 7 Renewable diesel was not investigated in off-road engines in this study. 8 Durbin et al. 2011. CARB Assessment of the Emissions from the Use of Biodiesel as a Motor Vehicle Fuel in California, “Biodiesel Characterization and NOx Mitigation Study,” Final Report. October. Available at: https://www.arb.ca.gov/fuels/diesel/altdiesel/20111013_CARB%20Final%20Biodiesel%20Report.pdf. Accessed: August, 2017. 9 Misra, Chandan, et al. In-Use NOx Emissions from Model Year 2010 and 2011 Heavy-Duty Diesel Engines Equipped with Aftertreatment Devices. Environ. Sci. Technol. 2013, 47, 7892-7898. 10 Boriboomsomsin, Kanok, et al. 2017. Collection of Activity Data from On-Road Heavy-Duty Diesel Vehicles. Final Report for the California Air Resources Board. May.

2
A recent chassis dynamometer study has shown potential NOx increases for biodiesel and renewable diesel use relative to CARB ULSD in on-road NTDEs. However, the results depended on blend level (with petroleum diesel) and the driving cycle studied.11 Additionally, a chassis dynamometer may not provide a true representation of fuel-to-fuel differences due to variability resulting from manual operation of the engine. The staff report for the 2015 ADF regulation also states that, for 2007 and later engines equipped with PM filters, there were no meaningful differences in PM emissions between conventional diesel and biodiesel.12 However, the joint study indicates that PM emissions for these engines were essentially at the limit of detection, so differences in PM emissions due to fuels could not be discerned. Thus, further characterization of the NOx and PM emissions impacts from the use of renewable diesel and renewable diesel/biodiesel blends in on-road and off-road NTDEs is needed.
11 Karavalakis, G., Jiang, Y., Yang, J., Durbin, T., et al., Emissions and Fuel Economy Evaluation from Two Current Technology Heavy-Duty Trucks Operated on HVO and FAME Blends, SAE Int. J. Fuels Lubr. 9(1):2016, doi:10.4271/2016-01-0876. 12 CARB. 2015. Proposed Regulation on the Commercialization of Alternative Diesel Fuels – Staff Report: Initial Statement of Reasons. January 2. Available at: https://www.arb.ca.gov/regact/2015/adf2015/adf15isor.pdf.

3
2 Objectives
The purpose of this study is to further evaluate emissions and performance effects resulting from the use of renewable diesel and renewable diesel/biodiesel blends relative to CARB diesel in off-road legacy engines and in NTDEs. Specifically, this study aims to:
1. Evaluate the NOx and PM emissions resulting from renewable diesel fuel and selected renewable diesel/biodiesel fuel blends in a legacy off-road engine.
2. Evaluate the NOx and PM emissions from use of renewable diesel fuel and selected renewable diesel/biodiesel fuel blends in on-road and off-road NTDEs.
To achieve the objectives above, emissions testing was conducted using renewable diesel and renewable diesel/biodiesel blends in an off-road legacy engine, a heavy-duty on-road NTDE, and an off-road NTDE. Performance testing was also conducted to measure changes in fuel consumption.

4
3 Experimental Procedures
3.1 Test Fuels
Testing was conducted using a CARB reference fuel – a petroleum-based, ultra-low sulfur diesel meeting ASTM975 specifications and the properties of Table A.9 of the ADF regulation as a baseline fuel, a neat (100 percent or 99 percent) renewable diesel fuel (referred to as R100 in this study) meeting ASTM975 specifications and Table A.9 of the ADF regulation), a blend of 65 percent renewable diesel and 35 percent biodiesel (R65/B35) with neat biodiesel meeting ASTM6751 and Table A.8 of the ADF regulation, and a blend of 50 percent renewable diesel and 50 percent biodiesel (R50/B50).13
The CARB reference fuel was obtained from a single batch in a volume sufficient for the full test program to minimize variations in fuel properties over the course of the study. The certificate of analysis (COA) for this fuel is provided in Appendix B.
The neat biodiesel was also sourced from a single batch in volumes sufficient for the full test program, while the R100 renewable diesel was sourced in two batches, but from a well-controlled production process where the fuel properties change minimally over time. The neat biodiesel fuel was obtained from a BQ-9000 supplier14 and was a low-saturation biodiesel. The biodiesel met the specifications in Table A.8 of the ADF regulation, with the exception of a higher cetane number.
The R100/R99 fuel was provided by a commercial supplier. Renewable diesel for commercial sale is typically blended as R99, but for simplicity in presenting the results below, this fuel will be denoted as R100 throughout the results and conclusion sections of this report. The neat renewable diesel and neat biodiesel described above were used as the blendstock for the R65/B35 and R50/B50 fuels. Blending of the renewable diesel/biodiesel blends was performed at the CE-CERT facilities in Riverside, California. The R65/B35 and R50/B50 blends were blended gravimetrically in fuel totes large enough to provide for single batches of R65/B35 and R50/B50 fuels that were sufficient for the full test program and were stored under nitrogen blankets to minimize variations in fuel properties over the course of the study.
Some additional blending of R65/B35 and R50/B50 fuels using the same batches of neat renewable diesel and biodiesel was also done in conjunction with the testing on the third engine, the off-road NTDE. Prior to conducting this second round of blending, some additional testing of the neat biodiesel was performed to evaluate its stability and quality, which included acid number, oxidation stability, water content, copper corrosion, and FAME content. These results showed that all of the properties were still within specifications, with the exception of oxidation stability, which had dropped to 1.2 hours. These results were discussed with representatives of the biodiesel industry, and it was determined that the fuel should still be acceptable for testing if an oxidation stability additive could be added to improve the oxidation stability of the biodiesel. The oxidation stability was improved by adding 1,000 ppmv of tert-Butylhydroquinone, which increased the
13 CARB. 2020. Regulation on Commercialization of Alternative Diesel Fuels. Title 13, California Code of Regulations, Appendix 1 of Subarticle 2.14 https://bq-9000.org. 14 https://bq-9000.org.

5
oxidation stability to 4.3 hours. The additional supply of renewable diesel/biodiesel fuels were then blended using the same gravimetric methods as used in the previous round of blending.
Fuel analyses were conducted by Southwest Research Institute (SwRI) on the CARB reference fuel, the neat renewable diesel, the neat biodiesel, and the R65/B35 and R50/B50 blends. The CARB reference fuel and the neat renewable diesel were analyzed for ASTM D975 properties and the properties in Table A.9 of the ADF regulation. These properties, as well as the Certificate of Analysis (COA) results, the fuel analysis results, and the fuel specifications for the CARB reference fuel, are shown in Table 3-1. The neat biodiesel fuel was analyzed for ASTM D6751 properties and the properties in Table A.8 of the ADF regulation. These properties, as well as the results of the fuel analysis and the fuel specifications for the neat biodiesel, are shown in Table 3-2. The R65/B35 and R50/B50 blends were analyzed for biodiesel content, sulfur, nitrogen, density, and distillation temperature at 10 percent, 50 percent, and 90 percent of the sample, as shown in Table 3-3. The carbon/hydrogen/oxygen content was also measured via ASTM D5291 for the CARB reference fuel, the R100, and the B100, as the carbon weight fraction is used to determine the brake specific fuel consumption (BSFC). Full fuel analyses were conducted for one sample per fuel. Triplicate analyses were performed on cetane number and a single analysis was performed on all other fuel properties indicated in Tables 3-1 through 3-3. The fuel analysis results from SwRI for all test fuels are provided in Appendix C.

6
Table 3-1. CARB Reference Fuel and Renewable Diesel Analysis Results and Specifications
Property ASTM
Test Method
Units Certificate of Analysis
Results
Fuel Analysis Results (SwRI)
ULSD Fuel
Specifications
Renewable Diesel Fuel
Analysis Results (SwRI)
Sulfur D5453 ppm <1 <0.5 15 max. <0.5
Aromatics D5186 Vol. % 10.0 9.9 10 max. 1.2 Polycyclic aromatic
hydrocarbons D5186 Wt. % 1.2 1.2 1.4 max. 0.2
Nitrogen content D4629 ppm 5.8 4.9 10 max. <1.0
Unadditized Cetane Number D613 unitless 48.4
48.1 48.3 48.2
48 min. 79.6 80.1 79.8
API Gravity D287 unitless 38.1* 38.0 33-39 49.1
Specific Gravity D287 g/ml - 0.8348 - 0.7835 Carbon weight
fraction D5291 wt% - 86.30 - 84.96
Kinematic Viscosity, 40oC D 445 mm2/s 2.6 2.544 2.0 – 4.1 3.031
Flash Point D93 oF 191 189.0 130 min. 146.0 Distillation
Temperature, atmospheric, IBP
D86-IBP oF 396 395.5 340 – 420 285.8
Distillation Temperature,
atmospheric, T10 D86-T10 oF 436 435.7 400 – 490 487.7
Distillation Temperature,
atmospheric, T50 D86-T50 oF 486 486.5 470 – 560 552.3
Distillation Temperature,
atmospheric, T90 D86-T90 oF 559 559.3 550 – 610 566.9
Distillation Temperature, atmospheric,
TEP
D86-EP oF 600 601.6 580 – 660 586.9
*API gravity for certificate of analysis used ASTM Method D4052.

7
Table 3-2. Biodiesel (B100) Fuel Analysis Results and Specifications Fuel
Property ASTM Test Method Units Analysis
Results (SwRI)
ADF Specification
Distillation, 90% recovery D1160 oF 669.2 620 - 680 API Gravity (by Meter) D287 oAPI 28.6 27 - 33
Specific Gravity D287 g/ml 0.8838 - Kinematic Viscosity @ 40 oC D445-40 mm2/s 4.399 1.9 – 6.0
Trace Nitrogen in Liquid Petroleum Hydrocarbons D4629 ppm
(wt/wt) 13.8 10 max
Sulfur by UVF D5453 ppm (wt/wt) 3.03 15 max
56.7 Cetane Number D613 unitless 55.8 47-50
56.6 Flash Point, Pensky Martens D93 oF 326.0 266 min
FAME content* EN 14078 % Mass 97.3 Report Carbon weight fraction D5291 wt% 77.30
* EN 14078 was substituted for EN 14103 to determine FAME content

8
Table 3-3. Fuel Property Analysis Results and Properties
ASTM Property Test
Method Units R65/R35 R50/B50
1.60
6.8
67.6 67.7 67.7 67.7
38.4
- -
332.1
546.5
597.8
639.4
659.6
49.1
Sulfur Content D5453 ppm 1.34
Nitrogen Content D4629 ppm 4.8
Cetane Number Test #1 D613 unitless 68.4 Cetane Number Test #2 D613 unitless 67.6 Cetane Number Test #3 D613 unitless 67.1
Cetane Number - Average D613 unitless 67.7
API Gravity D287 degAPI 41.5
Viscosity at 40oC, cSt D445 cSt - Flash Point, oF, minimum D93 oF - Distillation Temperature,
atmospheric, IBP D86-IBP oF 315.5
Distillation Temperature, atmospheric, T10 D86-T10 oF 528.3
Distillation Temperature, atmospheric, T50 D86-T50 oF 580.6
Distillation Temperature, atmospheric, T90 D86-T90 oF 630.0
Distillation Temperature, atmospheric, TEP D86-EP oF 654.0
FAME Content % EN14078 % Mass 34.8

9
3.2 Test Engines
As discussed in Section 2, the goal of this test program is to further evaluate the emissions and performance effects of renewable diesel and renewable diesel/biodiesel blends in three engine types: an off-road legacy engine and on-road heavy-duty and off-road NTDEs. Table 3-4 provides a general description of the emissions technologies and engine characteristics of the engines used in this study.
Table 3-4. General Description of Test Engines
No. Engine Type SCR-Equipped?
DPF-Equipped? HP Model
Year Vocation Manufacturer
1 Off-Road No No 115 2009 Construction John Deere
2 On-Road Heavy-Duty Yes Yes 450 2019 T7 or T8
Truck Cummins
3 Off-Road Yes Yes 225 2018 Construction Caterpillar
The specifications of three test engines are provided in Table 3-5. The selected off-road legacy engine was a John Deere 4045HF285 engine that has been used in previous biodiesel and renewable diesel engine testing conducted by UCR CE-CERT and CARB. 15 The on-road heavy-duty and off-road NTDEs were late-model engines to ensure that the test engines were equipped with the most advanced DPF and SCR emissions control technology currently available. The emissions control technology in these late-model engines is becoming more representative of the in-use emissions control technology in the on-road and off-road fleets as the engine inventory turns over. The on-road heavy-duty engine was a Cummins engine. Cummins engines are a staple of the California diesel engine market in Class 7 or Class 8 trucks. Use of this engine also provides a basis to further evaluate the results of a recent chassis dynamometer study that found increases in NOx emissions for biodiesel and some blends of renewable diesel relative to CARB ULSD in two Cummins on-road heavy-duty NTDEs.16 The off-road NTDE was a Caterpillar engine, which represents one of the most common off-road equipment engine manufacturers for California.
15 Durbin et al. 2011. CARB Assessment of the Emissions from the Use of Biodiesel as a Motor Vehicle Fuel in California, “Biodiesel Characterization and NOx Mitigation Study,” Final Report. October. Available at: https://www.arb.ca.gov/fuels/diesel/altdiesel/20111013_CARB%20Final%20Biodiesel%20Report.pdf.16 Karavalakis, G., Jiang, Y., Yang, J., Durbin, T. et al., "Emissions and Fuel Economy Evaluation from Two Current Technology Heavy-Duty Trucks Operated on HVO and FAME Blends," SAE Int. J. Fuels Lubr. 9(1):2016, doi:10.4271/2016-01-0876. 16 Karavalakis, G., Jiang, Y., Yang, J., Durbin, T. et al., "Emissions and Fuel Economy Evaluation from Two Current Technology Heavy-Duty Trucks Operated on HVO and FAME Blends," SAE Int. J. Fuels Lubr. 9(1):2016, doi:10.4271/2016-01-0876.

10
Table 3-5. Specifications of the Test Engines
Category Off-Road Legacy On-Road NTDE Off-Road NTDE
Engine Manufacturer John Deere Cummins Caterpillar
Engine Model 4045HF285 C-15 C7.1 ACERT
Model Year 2009 2019 2018
Engine Family 9JDXL6.8105 KCEXH0912XAW JPKXL07.0BN1
Engine Type In-line 4-cylinder, 4-stroke (Tier 3)
In-line 6-cylinder, 4-stroke
In-line 6-cylinder, 4-stroke (Tier 4)
Displacement 4.5 liters 14.9 liters 7.01 liters
Power Rating 115 hp (86 kW) 450 hp (336 kW) 225 hp (168 kW)
Speed Rating 2400 rpm 1800 rpm 2200 rpm
Fuel Type Diesel Diesel Diesel
Induction Turbocharged Turbocharged Turbocharged Emissions controls:
1. Exhaust Gas Recirculation (EGR)
2. SCR 3. DPF
1. 2. 3.
No No No
1. 2. 3.
Yes Yes Yes
1. 2. 3.
Yes Yes Yes
The CARB reference fuel, neat renewable diesel (R100/R99), and the R65/B35 and R50/B50 blends were tested in all engines.
3.3 Emissions Testing
Testing was conducted in UCR CE-CERT’s heavy-duty engine dynamometer test laboratory. This facility is equipped with a 600 hp General Electric DC electric engine dynamometer that was obtained from the United States Environmental Protection Agency’s (EPA) National Vehicle and Fuels Emission Laboratory in Ann Arbor, MI. The system is installed as a fully Code of Federal Regulations (CFR) compliant laboratory by Dyne Systems of Jackson, Wisconsin. This facility is described in greater detail in Appendix D.
The emissions measurements for this project were conducted with CE-CERT’s heavy-duty Mobile Emissions Laboratory (MEL) trailer. The heavy-duty dynamometer laboratory is in a location that has ready and full access to the MEL. CE-CERT’s MEL is a heavy-duty emissions measurement laboratory with a full dilution tunnel and CFR compliant analytical instrumentation that can be utilized for either stationary or on-road measurements. NOx emissions were measured with a 600 HPLC chemiluminescence analyzer from California Analytical Instruments (CAI). CO and CO2 emissions were measured with a 602P nondispersive infrared (NDIR) analyzer from CAI. THC emissions were measured with 600HFID flame ionization detector (FID) from CAI. Brake specific
11
fuel consumption was obtained via the carbon balance method based on the THC, CO, and CO2 emissions. The MEL is described in greater detail in Appendix D, with associated laboratory quality assurance and quality control procedures described in Appendix E.
The mass concentrations of PM2.5 were determined by gravimetric analysis of particulates collected on 47 mm diameter 2 μm pore Teflon filters (Whatman brand). The filters were weighed to determine the net weight gains between pre- and post-testing using a UMX2 ultra precision microbalance with buoyancy correction following 40 CFR Part 1065 weighing procedure guidelines.
Additional measurements of different particle properties and engine out emissions were collected for different engines, as summarized in Table 3-6. For the off-road legacy engine and the on-road NTDE, additional measurements included particle number (PN) and particle size distributions (PSD). An Engine Exhaust Particle Sizer (EEPS) (TSI 3090, MCU firmware version 3.05) was used to obtain real-time second-by-second PSDs between 5.6 and 560 nm in diameter. PN measurements were made using a TSI 3022 Condensation Particle Counter (CPC). Solid PN measurements were made using an AVL particle counter (APC) with a 23 nm diameter cut point. The APC is designed to meet the requirements for the measurements of solid particles above 23 nm in diameter, as defined by the European Union solid particle number emissions regulations.17
For the off-road NTDE, engine-out emissions were measured with a gas-phase SEMTECH-DS gas-phase analyzer portable emissions measurement system (PEMS) with an associated exhaust flow meter. The PEMS was set up to collect second-by-second engine out emissions, which provided information on the impacts of the R100, R65/B35, and R50/B50 test fuels on the combustion emissions prior to the emission control system, as well as the conversion efficiency for the SCR system.
In conjunction with the emissions measurements, information on the engine parameters were also collected from the engine control module (ECM). For the legacy off-road engine and the off-road NTDE, engine parameters were collected with a HEM data logger. For the on-road NTDE, engine parameters were collected with a Cummins INSITE Engine Diagnostics software package.
17 Solid particle number is defined as the total number of particulates of a diameter greater than 23 nm present in the diluted exhaust gas after it has been conditioned to remove volatile material, as described in Appendix 5 to Annex 4a to the European Union Regulation. 2015. Available at: https://unece.org/fileadmin/DAM/trans/main/wp29/wp29regs/R083r5e.pdf.

12
Table 3-6. Measurements Type and Instrumentation Used for Data Other Than Emissions
Engine Particle Size Distribution (PSD)
Particle Number (PN)
Solid PN Measurements
Engine-Out Emissions
Engine Control Module (ECM) Parameters
Off-Road Legacy
Engine Exhaust Particle Sizer (EEPS) 5.6-560 nm diameter
TSI 3022 Condensation Particle Counter (CPC)
AVL Particle Counter (APC) with greater than 23 nm diameter.18
HEM data logger
On-Road NTDE
Engine Exhaust Particle Sizer (EEPS) 5.6-560 nm diameter
TSI 3022 Condensation Particle Counter (CPC)
AVL Particle Counter (APC) with greater than 23 nm diameter.
Cummins INSITE Engine Diagnostics
Off-Road NTDE
Gas-Phase SEMTECH-DS PEMS with Exhaust Flow Meter
HEM data logger
3.4 Test Matrix and Test Sequence
Three test cycles were used for this program: the NRTC, the FTP, and steady state ramped modal cycles. The NRTC is the transient test used in the engine certification procedure for off-road engines, and the FTP is the transient certification test used for engine certification for on-highway engines. The ramped modal cycles are steady state cycles used in in engine certification for both on-highway and off-road engines, with different cycles run for the different engines. For the John Deere constant speed off-road legacy engine, a 5-mode D2 ISO 8718 cycle was utilized, as per U.S. EPA’s certification.19 For the Cummins on-road NTDE, a 13-mode, supplementary emissions test cycle was used, as was used in the certification of this engine. For the Caterpillar off-road NTDE, an 8-mode C1 ISO 8718 cycle was used, which is the cycle typically utilized for certification of variable speed off-road engines. All of the steady state cycles were run as ramped modal cycles (RMCs), as opposed to having each mode tested as a discrete mode. These cycles are described in greater detail in Appendix F. A summary of the test cycles used for each engine is provided in Table 3-7.
18 https://www.avl.com/documents/10138/885965/AVL+Particle+Counter.pdf 19https://www.epa.gov/compliance-and-fuel-economy-data/annual-certification-data-vehicles-engines-and-equipment

13
Table 3-7. Test Cycles to Be Used for Each Engine
Engine Characteristics Test Cycles
Engine No. Engine Type
SCR-Equipped?
DPF-Equipped? NRTC1 FTP2 RMC3
1 Off-Road
Legacy No No
2
On-Road
Heavy-Duty
NTDE
Yes Yes
3 Off-Road
NTDE Yes Yes
Note: “” denotes cycles that were tested for each engine. Blank cells denotes cycle/engine combinations that were not be tested. 1 NRTC is the transient test used in the engine certification procedure for off-road engines. 2 FTP is the transient certification test used for engine certification for on-highway engines 3 The RMCs are steady state cycles used in in engine certification for both on-highway and off-road engines.
Engine mapping for each test cycle was based on the CARB reference fuel. The test cycles were developed based on an engine map conducted on the CARB reference fuel before the first test on a particular engine. An engine map was run daily on the first fuel to be tested for that day to warm up the engine.
The test sequence for each of the cycles was conducted by alternating among the baseline fuel (i.e., the CARB reference fuel) and the three biofuel blends (i.e., R100/R99, R65/B35, and R50/B50), with the specific sequence of cycles developed for each engine based on manufacturers’ recommendations. The test sequences for each of the individual engines are described below. In the test sequences described below, “C” represents the CARB reference fuel, “B1” represents the neat renewable diesel fuel (R100/R99), “B2” represents the R65/B35 blend, and “B3” represents the R50/B50 blend. The full test matrix showing all engines, test cycles, and fuel test sequences is shown below in Table 3-12.
3.4.1 Off-Road Legacy Engine
The off-road legacy engine was tested over the D2 and NRTC test cycles. The test sequence for the off-road legacy engine is presented in Table 3-8. The D-2 tests were run as hot stabilized tests warmed up prior to the start of the emissions test. The engine temperature was stabilized by bringing the engine to the first operating testing point load for about 250 seconds. The NRTC tests were run as hot start tests with a 20 minute soak in between tests. A preconditioning test was run prior to any tests on a new fuel, or to the extent that the engine had cooled and was outside of the ordinary 20 minute soak. For this engine, a modified version of the NRTC was utilized, as it was not designed to typically operate over such a duty cycle. For this modified NRTC, the rpm was

14
held steady at the maximum rated speed, and then the engine was ramped through the torque profile for the NRTC.

15
Table 3-8. Test Sequence to Be Used for Each Test Cycle for the Off-Road Legacy Engine Day Fuel Test Sequence
1 CCC B1B1B1 B2B2B2 2 B3B3B3 CCC B1B1B1 3 B2B2B2 B3B3B3 CCC 4 B1B1B1 CCC B3B3B3 5 CCC B2B2B2 CCC
C = CARB reference fuel, B1 = R100, B2 = R65/B35 B3 = R50/B50
3.4.2 On-Road NTDE
The on-road NTDE was tested over the FTP and the 13-mode SET test cycles. The test sequence for the on-road NTDE is presented in Table 3-9. The FTP tests were run as hot start tests with a 20 minute soak in between tests. The engine was preconditioned over two hot start FTPs at the beginning of each test day, following a fuel switch, or if the engine has cooled and is outside of the ordinary 20 minute soak. For the on-road SET RMC cycle, the tests were run as hot running tests. For any given fuel, the engine was over a half SET RMC cycle for preconditioning, followed immediately by an official emissions test.
Table 3-9. Test Sequence for the FTP and RMC/SET Cycles on the On-Road NTDE Day Fuel Test Sequence
1 CCC B1B1B1 2 B2B2B2 CCC 3 B1B1B1 B3B3B3 4 CCC B2B2B2 5 B3B3B3 CCC 6 B2B2B2 B1B1B1 7 CCC B3B3B3
C = CARB reference fuel, B1 = R100/R99, B2 = R65/B35 B3 = R50/B50
3.4.3 Off-Road NTDE
The off-road NTDE was run over the NRTC and the C1 steady state RMC. The test sequences used for the NRTC and C1 cycles are provided in Table 3-10 and Table 3-11, respectively.

16
Table 3-10. Test Sequence for the NRTC Cycle on the Off-Road NTDE
Day Fuel Test Sequence
1 CCC CCC 2 B1B1B1 B1B1B1 3 B2B2B2 B2B2B2 4 B3B3B3 B3B3B3 5 B1B1B1 B1B1B1 6 B3B3B3 B3B3B3 7 B2B2B2 B2B2B2 8 CCC CCC
Table 3-11. Test Sequence for the Ramped Modal C1 Cycle on the Off-Road NTDE
Day Fuel Test Sequence
1 CCC B1B1B1
2 B2B2B2 CCC
3 B1B1B1 B3B3B3 4 CCC B2B2B2 5 CCC 6 7
B1B1B1 B2B2B2 B3B3B3
The NRTC tests were run as hot start tests with a 20 minute soak in between tests. Four preconditioning NRTC cycles with 20 minutes soaks in between were run prior to any tests on a new fuel, as per recommendations from the manufacturer. For the C1 cycle, two C1 cycles were run prior to any tests on a new fuel. The C1 tests were run as hot stabilized tests, with the engine warmed up prior to the start of the emissions test. The engine temperature was stabilized by bringing the engine to the first operating testing load point and running the engine for 200 seconds.
Since the off-road NTDE was purchased new, the engine was operated for 50 hours to break it in prior to conducting any emissions testing. The engine break-in was conducted over a series of steady state test points based on recommendations from the engine manufacturer. The engine break-in was performed with a standard market CARB ULSD obtained from a local retail outlet.

17
Table 3-12. Full Test Matrix for All Engines and Cycles Engine
No. Engine Type
Duty Cycle Day 1 Day 2 Day 3 Day 4 Day 5 Day 6 Day 7 Day 8
1
On-Road NTDE
FTP CCC B1B1B1
B2B2B2 CCC
B1B1B1 B3B3B3
CCC B2B2B2
B3B3B3 CCC
B2B2B2 B1B1B1
CCC B3B3B3 -
SET CCC B1B1B1
B2B2B2 CCC
B1B1B1 B3B3B3
CCC B2B2B2
B3B3B3 CCC
B2B2B2 B1B1B1
CCC B3B3B3 -
CCC B3B3B3 B2B2B2 B1B1B1 CCC NRTC B1B1B1 CCC B3B3B3 CCC B2B2B2 - - -
2
Off-Road Legacy
B2B2B2 B1B1B1 CCC B3B3B3 CCC
ISO 8178 D2
CCC B1B1B1 B2B2B2
B3B3B3 CCC
B1B1B1
B2B2B2 B3B3B3
CCC
B1B1B1 CCC
B3B3B3
CCC B2B2B2
CCC - - -
3
Off-Road NTDE
NRTC CCC CCC
B1B1B1 B1B1B1
B2B2B2 B2B2B2
B3B3B3 B3B3B3
B1B1B1 B1B1B1
B3B3B3 B3B3B3
B2B2B2 B2B2B2
CCC CCC
ISO 8178 C1
CCC B1B1B1
B2B2B2 CCC
B1B1B1 B3B3B3
CCC B2B2B2 CCC B1B1B1 B2B2B2
B3B3B3 -
C = CARB reference fuel B1 = R100/R99 B2 = R65/B35 B3 = R50/B5

18
4 Engine Testing Results
The results for each of the confirmatory test comparisons are summarized in this section. The results presented in the figures represent the average of all test runs performed on that fuel sequence. The error bars represent one standard deviation on the average value. The tables show the average emission values for all fuels, the percentage differences for the R100 and the R65/B35 and R50/B50 fuels compared to the CARB reference fuel for each engine and test cycle, and the associated p-values for statistical comparisons between the CARB reference fuel and the R100, R65/B35 and R50/B50 fuels emissions using a 2-tailed, 2-sample, equal-variance t-test. For the discussion in this report, results are considered to be statistically significant for p values ≤0.05, meaning that the probability that the compared emissions differences would occur by chance is less than or equal to 5 percent. Comparisons where 0.05 ≤p values <0.1 were considered marginally statistically significant for this report, and are also noted in the text. Statistically significant results are bolded and the percent differences compared to CARB reference fuel are shown in red text in the tables. More detailed test results are provided in Appendix G.
4.1 NOx Emissions
4.1.1 Off-Road Legacy Engine NOx Emissions
The NOx emission results for the off-road legacy engine are presented in Figure 4-1 on a gram per brake horsepower hour (g/bhp-hr) basis. Table 4-1 shows the average emissions for each test fuel and test cycle, and percentage differences and the associated p-values for statistical comparisons between the CARB reference fuel and the biofuels for each of the test cycles.
R100 fuel resulted in the lowest NOx emissions from biofuel use for both the NRTC and the D2 cycle, with statistically significant reductions of 5.4%, for the NRTC cycle and 4.9% for the D2 cycle compared to the CARB reference fuel. The R65/B35 showed no statistically significant differences compared to the CARB reference fuel for either the NRTC or D2 cycles. The R50/B50 showed statistically significant increases of 1.8% for the NRTC and 4.2% for the D2 cycle compared to the CARB reference fuel.

19
Figure 4-1. Average NOx Emission Results for the Off-Road Legacy Engine Testing
Table 4-1. NOx Emissions, and Percentage Differences and Statistical Comparisons Between Biofuels and the CARB Reference Fuel for the Off-Road Legacy Engine
Cycle Fuel Type Ave. (g/bhp.hr) % Diff vs. CARB p-value (t-test)
NRTC
CARB reference fuel 2.09 - - R100 1.98 -5.4 0.00
R65/B35 2.07 -1.2 0.18 R50/B50 2.13 1.8 0.05
D2
CARB reference fuel 2.01 - - R100 1.91 -4.9 0.00
R65/B35 2.01 0.0 0.97 R50/B50 2.09 4.2 0.02
Statistically significant results are bolded and their percent differences are shown in red text.
4.1.2 On-Road NTDE NOx Emissions
The NOx emission results for the on-road NTDE are presented in Figure 4-2 on a g/bhp-hr basis. Table 4-2 shows the average emissions for each test fuel and test cycle, and percentage differences and the associated p-values for statistical comparisons between the CARB reference fuel and the biofuels for each of the test cycles. It should be noted that for the on-road NTDE, a subset of outlier tests were observed over the FTP that were not include in the data presented in this subsection. These data are discussed in greater detail in Appendix A.
For the on-road NTDE, no statistically significant differences were found between the CARB reference fuel and R100 for either the FTP or RMC cycles. The FTP cycle showed statistically significant increases of 46.6% for R65/B35 blend and 49.5% for the R50/B50 blend. The RMC showed statistically significant increases of 14.2% for the R65/B35 blend and 15.4% for the R50/B50 blend compared to the CARB reference fuel.
0.0
0.5
1.0
1.5
2.0
2.5
NRTC Cycle D2 Cycle
NO
x (g
/bhp
_hr)
CARB Reference R100 R65/B35 R50/B50

20
Figure 4-2. Average NOx Emission Results for the On-Road NTDE Testing
Table 4-2. NOx Emissions, and Percentage Differences and Statistical Comparisons Between Biofuels and the CARB Reference Fuel for the On-Road NTDE Testing
Cycle Fuel Type Ave. (g/bhp.hr) % Diff vs. CARB p-value (t-test)
FTP
CARB reference fuel 0.11 - - R100 0.12 4.8 0.34
R65/B35 0.16 46.6 0.00 R50/B50 0.17 49.5 0.00
RMC
CARB reference fuel 0.13 - - R100 0.14 2.3 0.19
R65/B35 0.15 14.2 0.00 R50/B50 0.15 15.4 0.00
Statistically significant results are bolded and their percent differences are shown in red text.
Additional engine out NOx data was obtained from the engine out NOx sensor equipped on the engine for a subset of RMC tests. Figure 4-3 shows the engine out NOx sensor emissions for the on-road NTDE over the RMC cycle compared to the tailpipe NOx emissions measured with the MEL. Table 4-3 also shows the engine-out emissions (g/bhp-hr) for the RMC, and percentage differences and the associated p-values for statistical comparisons between the CARB reference fuel and the biofuels for the RMC, and Table 4-4 shows a comparison between the engine out and tailpipe emissions for the RMC cycle. Note that the FTP cycle NOx sensor data is not available as it is a hot-start cycle and the NOx sensor did not reach its operation temperature until approximately 300 seconds into the cycle. The engine out NOx sensor data showed no statistically significant difference between R100 and CARB reference fuel. The R65/B35 and R50/B50 blends,
0.00
0.05
0.10
0.15
0.20
0.25
FTP RMC
NO
x (g
/bhp
-hr)
CARB Reference R100 R65/B35 R50/B50

21
on the other hand, showed statistically significant increases in engine out NOx levels compared to the CARB reference fuel. The trends for the engine-out emissions are consistent with the tailpipe-out emissions data, which showed that the R100 fuel was not statistically significantly different from the CARB reference fuel, but the R65/B35 and R50/B50 emissions were higher at a statistically significant level than those for the CARB reference fuel. This suggests the increase in engine-out NOx emissions for the renewable diesel/biodiesel blends is likely a key factor contributing to the higher tailpipe emissions for the renewable diesel/biodiesel blends. Comparison of the engine out and tailpipe out (after emissions control system) NOx data showed that the SCR provided a 95% to 96% reduction in NOx emissions for the different fuels.
Table 4-3. NOx Engine-Out Emissions (g/bhp-hr), Percentage Differences Between the Biofuels and the CARB reference fuel, and Statistical Significance for On-Road NTDE
Testing
Fuel Type Engine-Out
NOx Emissions (g/bhp-hr)
% Diff vs. CARB p-value (t-test)
RMC
CARB reference fuel 3.02 - - R100 2.93 -3.1 -
R65/B35 3.68 21.9 0.00 R50/B50 3.85 27.5 0.00
Statistically significant results are bolded and their percent differences are shown in red text.
Table 4-4. Average NOx Engine-Out Emissions (g/bhp-hr) Compared to Tailpipe-Out Emissions Percentage Differences Between Biofuels and the CARB Reference Fuel for the
On-Road NTDE RMC Testing
Cycle Fuel Type Engine-Out
NOx Emissions (g/bhp-hr)
Tailpipe-Out NOx Emissions
(g/bhp-hr)
Percent NOx Reduction from
SCR
RMC
CARB reference fuel 3.02 0.13 96 R100 2.93 0.14 95
R65/B35 3.68 0.15 96 R50/B50 3.85 0.15 96
Statistically significant results are bolded and their percent differences are shown in red text.

22
Figure 4-3. Average Sensor-Based NOx Emissions for the On-Road NTDE RMC cycle
4.1.3 Off-Road NTDE NOx Emissions
The NOx emission results for the off-road NTDE are presented in Figure 4-4 on a g/bhp-hr basis. Table 4-5 shows the average emissions for each test fuel and test cycle, and percentage differences and the associated p-values for statistical comparisons between the CARB reference fuel and the biofuels for each of the test cycles. In general, emissions were more variable for this engine, as shown by the large error bars in Figure 4.4, and the engine and aftertreatment showed less consistent operation.
For the off-road NTDE, no statistically significant differences were found between the CARB reference fuel and R100 for the NRTC or C1 cycles. The NRTC cycle showed statistically significant increases of 88.3% for R65/B35 blend and 149.6% for the R50/B50 blend. The C1 cycle showed statistically significant increases of 55.1% for the R65/B35 blend and 119.4% for the R50/B50 blend. It should be noted that the emissions for the C1 cycle were very low on an absolute basis, ranging on average from 0.014 g/bhp-hr to 0.030 g/bhp-hr, so the emissions differences between the CARB reference fuel and the renewable diesel/biodiesel blends were also low on an absolute basis, on the order of 0.007 g/bhp-hr to 0.016 g/bhp-hr.
0
1
2
3
4
5
Engine Out NOx Sensor Tailpipe
NO
x (g
/bhp
-hr)
RMC NOx
CARB Reference R100 R65/B35 R50/B50
95-96% SCRReduction Efficiency

23
Figure 4-4. Average NOx Emission Results for the Off-Road NTDE Testing
Table 4-5. NOx Emissions, and Percentage Differences and Statistical Comparisons Between Biofuels and the CARB Reference Fuel for the Off-Road NTDE Testing
Cycle Fuel Type Ave. (g/bhp.hr) % Diff vs. CARB p-value (t-test)
NRTC
CARB reference fuel 0.18 - - R100 0.22 20.1 0.11
R65/B35 0.34 88.3 0.00 R50/B50 0.45 146.9 0.00
C1
CARB reference fuel 0.014 - - R100 0.015 10.5 0.56
R65/B35 0.021 55.1 0.01 R50/B50 0.030 119.4 0.01
Statistically significant results are bolded and their percent differences are shown in red text.
Engine out along with tailpipe NOx are presented in Figure 4-5. The engine-out data seen in Table 4-6 did not show any statistically significant differences between the R100 and the CARB reference fuel for either cycle. The engine-out data did show statistically significant increases in NOx emissions for the NRTC of 12.3% for R65/B35 and 15.9% for R50/B50 fuels compared with the CARB reference fuel. There are also statistically significant increases in engine-out NOx emissions for the C1 cycle of 18.8% for R65/B35 and 23.6% for R50/B50.
0.0
0.1
0.2
0.3
0.4
0.5
0.6
NRTC C1
NO
x (g
/bhp
-hr)
CARB Reference R100 R65/B35 R50/B50

24
Figure 4-5. Average Engine Out and Tailpipe NOx Emissions for the Off-Road NTDE
Table 4-6. Engine Out NOx Emissions, and Percentage Differences and Statistical Comparisons Between Biofuels and the CARB Reference Fuel for the Off-Road NTDE
Testing
Cycle Fuel Type Engine-Out
NOx Emissions (g/bhp-hr)
% Diff vs. CARB p-value (t-test)
NRTC
CARB reference fuel 2.50 R100 2.54 1.4 0.17
R65/B35 2.81 12.3 0.00 R50/B50 2.90 15.9 0.00
C1
CARB reference fuel 1.42 R100 1.47 3.5 0.45
R65/B35 1.69 18.8 0.00 R50/B50 1.75 23.6 0.00
Statistically significant results are bolded and their percent differences are shown in red text.
Engine out NOx emissions along with tailpipe NOx emissions are presented in Table 4-7. Comparison of the engine-out and tailpipe NOx for the NRTC showed SCR reduction efficiencies of 93% for the CARB reference fuel, 91% for R100, 88% for R65/B35, and 85% for R50/B50. The SCR provided NOx reductions of 98% to 99% for the C1 cycle for all fuels.
0.0
0.5
1.0
1.5
2.0
2.5
3.0
3.5
Engine Out Tailpipe Engine Out Tailpipe
NRTC C1
NO
x(g/
bhp-
hr)
Caterpillar Off-Road NTDE NOX
CARB Reference R100 R65/B35 R50/B50
85%-93%SCR
ReductionEfficiency
98%-99% SCR
ReductionEfficiency

25
Table 4-7. NOx Engine-Out Emissions (g/bhp-hr) Compared to Tailpipe-Out Emissions Percentage Differences Between Biofuels and the CARB Reference Fuel for Caterpillar
Off-Road NTDE Testing
Cycle Fuel Type Engine-Out
NOx Emissions (g/bhp-hr)
Tailpipe-Out NOx Emissions
(g/bhp-hr)
Percent NOx Reduction from
SCR
NRTC
CARB reference fuel 2.50 0.18 93 R100 2.54 0.22 91
R65/B35 2.81 0.34 88 R50/B50 2.90 0.45 85
C1
CARB reference fuel 1.42 0.014 99 R100 1.47 0.015 99
R65/B35 1.69 0.021 99 R50/B50 1.75 0.030 98

26
4.2 PM Emissions
4.2.1 Off-Road Legacy Engine PM Emissions
The PM emission results for the testing on the off-road legacy engine are presented in Figure 4-6 on a g/bhp-hr basis. Table 4-8 shows the average emissions for each test fuel and test cycle, and percentage differences and the associated p-values for statistical comparisons between the CARB reference fuel and the biofuels for each of the test cycles.
PM emissions showed decreases for the renewable diesel and the renewable diesel/biodiesel blends for both the NRTC and the D2. The reductions for the NRTC compared to the CARB reference fuel were 38% for R100, 53% for R65/B35, and 63% for R50/B50. The reductions for the D2 compared to the CARB reference fuel were 27% for R100, 51% for R65/B35, and 58% for R50/B50 fuel.
Figure 4-6. Average PM Emission Results for the Off-Road Legacy Engine Testing
0.0000
0.0200
0.0400
0.0600
0.0800
0.1000
NRTC Cycle D2 Cycle
PM M
ass (
g/bh
p_hr
)
CARB ULSD R100 R65/B35 R50/B50

27
Table 4-8. PM Emissions, and Percentage Differences and Statistical Comparisons Between Biofuels and the CARB Reference Fuel for the Off-Road Legacy Engine
Cycle Fuel Type PM Emissions (g/bhp-hr) % Diff vs. CARB p-value (t-test)
NRTC
CARB reference fuel 0.061 - - R100 0.038 -38 0.00
R65/B35 0.028 -53 0.00 R50/B50 0.023 -63 0.00
D2
CARB reference fuel 0.052 - - R100 0.038 -27 0.00
R65/B35 0.025 -51 0.00 R50/B50 0.022 -58 0.00
Statistically significant results are bolded and their percent differences are shown in red.
4.2.2 On-Road NTDE PM Emissions
PM mass emissions for the on-road NTDE are presented in Figure 4-7 for all valid tests. Table 4-9 shows the average emissions for each test fuel and test cycle, and percentage differences and the associated p-values for statistical comparisons between the CARB reference fuel and the biofuels for each of the test cycles. It should be noted that for the on-road NTDE, a subset of outlier tests were observed over the FTP that were not included in the data presented in this subsection. These data are discussed in greater detail in Appendix A. PM mass emissions in general were low and near background levels, and averaged less than 0.001 g/bhp-hr for all tests conditions and both cycles. As the PM standard for heavy-duty on-road engines is 0.01 g/bhp-hr, the PM emissions observed are for the most part at least 20-fold lower than the PM standard. The PM emissions for the different fuels generally did not show statistically significant differences, with the exception of the R50/B50, which had emissions that were lower than those for the CARB reference fuel at a marginally statistically significant level over the FTP cycle.

28
Figure 4-7. Average PM Emission Results for the On-Road NTDE Testing
Table 4-9. PM Emissions, and Percentage Differences and Statistical Comparisons Between Biofuels and the CARB Reference Fuel for the On-Road NTDE
Cycle Fuel Type PM Emissions (g/bhp-hr) % Diff vs. CARB p-value (t-test)
FTP CARB reference fuel 0.00049 - -
R100 0.00036 -28 0.38 R65/B35 0.00052 6 0.86 R50/B50 0.00018 -64 0.06*
RMC CARB reference fuel 0.00018 - -
R100 0.00015 -18 0.66 R65/B35 0.00017 -4 0.94 R50/B50 0.00009 -47 0.26
Statistically significant results are bolded and their percent differences are shown in red text. * Indicates marginally statistically significant result.
4.2.3 Off-Road NTDE PM Emissions
PM mass emissions for the off-road NTDE are presented in Figure 4-8. Table 4-10 shows the average emissions for each test fuel and test cycle, and percentage differences and the associated p-values for statistical comparisons between the CARB reference fuel and the biofuels for each ofthe test cycles. PM mass emissions were more than a factor of 30 below the 0.015 g/bhp-hr PMstandard for Tier 4 off-road engines in this size category for all test conditions and both cycles. Nostatistically significant differences in PM mass emissions were seen between fuels for either testcycle.
0.0000
0.0002
0.0004
0.0006
0.0008
0.0010
FTP RMC
PM M
ass (
g/bh
p-hr
)
CARB Reference R100 R65/B35 R50/B50

29
Figure 4-8. Average PM Emission Results for the Off-Road NTDE Testing
Table 4-10. PM Emissions, and Percentage Differences and Statistical Comparisons Between Biofuels and the CARB Reference Fuel for the Off-Road NTDE Testing
Cycle Fuel Type Ave. (g/bhp.hr) % Diff vs. CARB p-value (t-test)
NRTC CARB reference fuel 0.00026 - -
R100 0.00042 60 0.56 R65/B35 0.00041 56 0.53 R50/B50 0.00031 17 0.86
C1 CARB reference fuel 0.00016 - -
R100 0.00015 -4 0.95 R65/B35 0.00012 -22 0.54 R50/B50 0.00011 -33 0.43
0.0000
0.0002
0.0004
0.0006
0.0008
0.0010
NRTC C1
PM M
ass (
g/bh
p-hr
)CARB Reference R100 R65/B35 R50/B50

30
4.3 THC Emissions
4.3.1 Off-Road Legacy Engine THC Emissions
The THC emission results for the testing on the off-road legacy engine are presented in Figure 4-9 on a g/bhp-hr basis. Table 4-11 shows the average emissions for each test fuel and test cycle, and percentage differences and the associated p-values for statistical comparisons between the CARB reference fuel and the biofuels for each of the test cycles.
THC emissions showed decreases for the renewable diesel and the renewable diesel/biodiesel blends for both the NRTC and the D2 cycles. The reductions for the NRTC compared to the CARB reference fuel were 45% for R100, 49% for R65/B35, and 66% for R50/B50. The reductions for the D2 compared to the CARB reference fuel were 35% for R100, 58% for R65/B35, and 71% for R50/B50.
Figure 4-9. Average THC Emission Results for the Off-Road Legacy Engine Testing
0.0
0.2
0.4
0.6
0.8
1.0
1.2
NRTC Cycle D2 Cycle
THC
(g/b
hp_h
r)
CARB Reference R100 R65/B35 R50/B50

31
Table 4-11. THC Emissions, and Percentage Differences and Statistical Comparisons Between Biofuels and the CARB Reference Fuel for the Off-Road Legacy Engine
Cycle Fuel Type Ave. (g/bhp.hr) % Diff vs. CARB p-value(t-test)
- 0.00 0.00 0.00
- 0.00 0.00 0.00
NRTC CARB reference fuel 0.61 -
R100 0.33 -45R65/B35 0.31 -49R50/B50 0.21 -66
D2 CARB reference fuel 0.98 -
R100 0.64 -35R65/B35 0.41 -58R50/B50 0.29 -71
Statistically significant results are bolded and their percent differences are shown in red text.
4.3.2 On-Road NTDE THC Emissions
THC emissions for the on-road NTDE are presented in Figure 4-10 for all valid tests. Table 4-12 shows the average emissions for each test fuel and test cycle, and percentage differences and the associated p-values for statistical comparisons between the CARB reference fuel and the biofuels for each of the test cycles. It should be noted that for the on-road NTDE, a subset of outlier tests were observed over the FTP that were not include in the data presented in this subsection. These data are discussed in greater detail in Appendix A. THC emissions were near or below background levels for all tests conditions and both cycles. For the FTP, only R50/B50 showed a statistically significant reduction relative to the CARB reference fuel, with R100 and R65/B35 showing no statistically significant differences in THC emissions relative to the CARB reference fuel. For the RMC cycle, THC emissions levels were below the background levels for all tests, and hence did no show measurable THC emissions.
Figure 4-10. Average THC Emission Results for the On-Road NTDE Testing
0.000
0.001
0.002
0.003
0.004
0.005
FTP RMC
THC
(g/b
hp-h
r)
CARB Reference R100 R65/B35 R50/B50

32
Table 4-12. THC Emissions, and Percentage Differences and Statistical Comparisons Between Biofuels and the CARB Reference Fuel for the On-Road NTDE Testing
Cycle Fuel Type Ave. (g/bhp.hr) % Diff vs. CARB (t-test)
FTP
CARB reference fuel 0.003 - - R100 0.003 9 0.77
R65/B35 0.002 -24 0.39 R50/B50 0.001 -71 0.01
RMC
CARB reference fuel 0 - - R100 0 - -
R65/B35 0 - - R50/B50 0 - -
p-value
Statistically significant results are bolded and their percent differences are shown in red text.
4.3.3 Off-Road NTDE THC Emissions
THC emissions were below the background levels for all tests conditions and both the NRTC and C1 cycles, so the test results are reported as zeros, and no fuel differences were seen.
4.4 CO Emissions
4.4.1 Off-Road Legacy Engine CO Emissions
The CO emission results for the testing on the off-road legacy engine are presented in Figure 4-11 on a g/bhp-hr basis. Table 4-13 shows the average emissions for each test fuel and test cycle, and percentage differences and the associated p-values for statistical comparisons between the CARB reference fuel and the biofuels for each of the test cycles.
CO emissions showed statistically significant decreases for the renewable diesel and the renewable diesel/biodiesel blends for both the NRTC and D2 cycles. The reductions for the NRTC compared to the CARB reference fuel were 22% for R100, 26% for R65/B35, and 32% for R50/B50. The reductions for the D2 cycle compared to the CARB reference fuel were 14% for R100, 28% for R65/B35, and 32% for R50/B50.

33
Figure 4-11. Average CO Emission Results for the Off-Road Legacy Engine Testing
0.0
0.5
1.0
1.5
2.0
2.5
3.0
3.5
4.0
NRTC Cycle D2 Cycle
CO (g
/bhp
-hr)
CARB Reference R100 R65/B35 R50/B50

34
Table 4-13. CO Emissions, and Percentage Differences and Statistical Comparisons Between Biofuels and the CARB Reference Fuel for the Off-Road Legacy Engine
Cycle Fuel Type Ave. (g/bhp.hr) % Diff vs. CARB p-value(t-test)
NRTC CARB reference fuel 3.26 - -
R100 2.55 -22 0.00 R65/B35 2.43 -26 0.00 R50/B50 2.22 -32 0.00
D2 CARB reference fuel 2.69 - -
R100 2.32 -14 0.01 R65/B35 1.94 -28 0.00 R50/B50 1.84 -32 0.00
Statistically significant results are bolded and their percent differences are shown in red text.
4.4.2 On-Road NTDE CO Emissions
CO emissions for the on-road NTDE are presented in Figure 4-12 for all tests. Table 4-14 shows the average emissions for each test fuel and test cycle, and percentage differences and the associated p-values for statistical comparisons between the CARB reference fuel and the biofuels for each of the test cycles. It should be noted that for the on-road NTDE, a subset of outlier tests were observed over the FTP that were not include in the data presented in this subsection. These data are discussed in greater detail in Appendix A. For the FTP cycle, no statistically significant changes in CO emissions were found for any of the test biofuels relative to the CARB reference fuel. The RMC cycle showed a slight reduction of 5% with R100, with no statistical difference in CO emissions observed with the R65/B35 and R50/B50 blends.
Figure 4-12. Average CO Emission Results for the On-Road NTDE Testing
0.00
0.05
0.10
0.15
0.20
0.25
0.30
0.35
FTP RMC
CO (g
/bhp
-hr)
CARB Reference R100 R65/B35 R50/B50

35
Table 4-14. CO Emissions, and Percentage Differences and Statistical Comparisons Between Biofuels and the CARB Reference Fuel for the On-Road NTDE Testing
Cycle Fuel Type Ave. (g/bhp.hr) % Diff vs. CARB p-value
(t-test)
FTP
CARB reference fuel 0.30 - - R100 0.28 -5 0.21
R65/B35 0.29 -2 0.74 R50/B50 0.30 -2 0.75
RMC
CARB reference fuel 0.26 - - R100 0.25 -5 0.00
R65/B35 0.26 -2 0.11 R50/B50 0.26 -0 0.93
Statistically significant results are bolded and their percent differences are shown in red text.
4.4.3 Off-Road NTDE CO Emissions
CO emissions for the off-road NTDE are presented in Figure 4-13 for all tests. Table 4-15 shows the average emissions for each test fuel and test cycle, and percentage differences and the associated p-values for statistical comparisons between the CARB reference fuel and the biofuels for each of the test cycles. For the NRTC, measurable, but low CO emissions were found for the CARB reference fuel and R100. The NRTC CO emissions for the R100 fuel were 44% lower than those for the CARB reference fuel. The NRTC CO emissions for the R65/B35 and R50/B50 fuels were much lower than those for the CARB reference fuel and R100 fuels, and were near or below the background levels for all tests. The C1 CO emissions were at or below background levels for all tests. It should be noted that the engine out measurements showed measurable CO emissions were being generated by the engine during combustion for both test cycles and the different fuels, but that most of the CO emissions spikes were low enough that the CO emissions were eliminated by the DOC/DPF to levels where the CO tailpipe emissions were essentially only appreciably above the background levels for the CARB reference fuel and R100 tests for the NRTC cycle.

36
Figure 4-13. Average CO Emission Results for the Off-Road NTDE Testing
Table 4-15. CO Emissions, and Percentage Differences and Statistical Comparisons Between Biofuels and the CARB Reference Fuel for the Off-Road NTDE Testing
Cycle Fuel Type Ave. (g/bhp.hr) % Diff vs. CARB p-value(t-test)
NRTC CARB reference fuel 0.139 - -
R100 0.078 -44 0.00 R65/B35 0.002 -98 0.00 R50/B50 0.000 -100 0.00
C1 CARB reference fuel 0.000 - -
R100 0.000 - - R65/B35 0.001 - - R50/B50 0.000 - -
Statistically significant results are bolded and their percent differences are shown in red text.
0.00
0.04
0.08
0.12
0.16
0.20
NRTC C1
CO(g
/bhp
-hr)
CARB Reference R100 R65/B35 R50/B50

37
4.5 CO2 Emissions
4.5.1 Off-Road Legacy Engine CO2 Emissions
The CO2 emission results for the testing on the off-road legacy engine are presented in Figure 4-14 on a g/bhp-hr basis. Table 4-16 shows the average emissions for each test fuel and test cycle, and percentage differences and the associated p-values for statistical comparisons between the CARB reference fuel and the biofuels for each of the test cycles. For the NRTC, CO2 emissions showed statistically significant reductions of 4.1% for R100, 2.6% for R65/B35, and 1.7% for R50/B50 compared to the CARB reference fuel. For the D2, R100 showed a statistically significant reduction in CO2 emissions of 4.6% compared to the CARB reference fuel, while the R65/B35 and R50/B50 fuels did not show statistically significant differences compared to the CARB reference fuel.
Figure 4-14. Average CO2 Emission Results for the Off-Road Legacy Engine Testing
0
100
200
300
400
500
600
700
800
NRTC Cycle D2 Cycle
CO2 (
g/bh
p-hr
)
CARB Reference R100 R65/B35 R50/B50

38
Table 4-16. CO2 Emissions, and Percentage Differences and Statistical Comparisons Between Biofuels and the CARB Reference Fuel for the Off-Road Legacy Engine
Cycle Fuel Type Ave. (g/bhp.hr) % Diff vs. CARB p-value (t-test)
NRTC
CARB reference fuel 700.1 - - R100 671.5 -4.1 0.00
R65/B35 681.9 -2.6 0.00 R50/B50 687.9 -1.7 0.01
D2
CARB reference fuel 650.2 - - R100 620.5 -4.6 0.02
R65/B35 638.5 -1.8 0.26 R50/B50 634.1 -2.5 0.18
Statistically significant results are bolded and their percent differences are shown in red text.
4.5.2 On-Road NTDE CO2 Emissions
The CO2 emission results for the testing on the on-road NTDE are presented in Figure 4-15 on a g/bhp-hr basis. Table 4-17 shows the average emissions for each test fuel and test cycle, and percentage differences and the associated p-values for statistical comparisons between the CARB reference fuel and the biofuels for each of the test cycles. It should be noted that for the on-road NTDE, a subset of outlier tests were observed over the FTP that were not include in the data presented in this subsection. These data are discussed in greater detail in Appendix A.
For the on-road NTDE, CO2 emissions from the FTP showed statistically significant decreases of 3.2% for R100, 0.9% for R65/B35, and 0.8% for R50/B50 compared to the CARB reference fuel. The RMC showed statistically significant decreases of 2.9% for R100 and 0.5% for R65/B35, and a marginally statistically significant increase of 0.3% for R50/B50 compared to the CARB reference fuel.
Figure 4-15. Emission Results for the On-Road NTDE Testing
400
420
440
460
480
500
520
FTP RMC
CO2
(g/b
hp-h
r)
CARB Reference R100 R65/B35 R50/B50

39
Table 4-17. CO2 Emissions, and Percentage Differences and Statistical Comparisons Between Biofuels and the CARB Reference Fuel or the On-Road NTDE Testing
Cycle Fuel Type Ave. (g/bhp.hr) % Diff vs. CARB p-value (t-test)
FTP
CARB reference fuel 509.4 - - R100 493.3 -3.2 0.00
R65/B35 504.6 -0.9 0.01 R50/B50 505.1 -0.8 0.04
RMC
CARB reference fuel 442.0 - - R100 429.4 -2.9 0.00
R65/B35 440.0 -0.5 0.02 R50/B50 443.5 0.3 0.08*
Statistically significant results are bolded and their percent differences are shown in red text. *Indicates marginally statistically significant result.
4.5.3 Off-Road NTDE CO2 Emissions
CO2 results for the off-road NTDE are presented in Figure 4-16 on a gallons/bhp-hr basis. Table 4-18 shows the average emissions for each test fuel and test cycle, and percentage differences and the associated p-values for statistical comparisons between the CARB reference fuel and the biofuels for each of the test cycles. CO2 emissions showed statistically significant reductions for the R100 fuel of 3.8% for the FTP and of 3.0% for the D2 cycle compared to the CARB reference fuel. CO2 emissions did not show statistically significant differences for the R65/B35 and R50/B50 fuels compared to the CARB reference fuel for either the NRTC or C1 cycles.
Figure 4-16. Average CO2 Emission Results for the Off-Road NTDE Testing
400
440
480
520
560
NRTC C1
CO2(g
/bhp
-hr)
CARB Reference R100 R65/B35 R50/B50

40
Table 4-18. CO2 Emissions, and Percentage Differences and Statistical Comparisons Between Biofuels and the CARB Reference Fuel for the Off-Road NTDE Testing
Cycle
NRTC
C1
Fuel Type Ave. (g/bhp.hr) % Diff vs. CARB p-value(t-test)
CARB reference fuel 536.5 - - R100 516.0 -3.8 0.00
R65/B35 530.3 -1.2 0.24 R50/B50 534.2 -0.4 0.59
CARB reference fuel 479.9 - - R100 465.6 -3.0 0.03
R65/B35 471.0 -1.8 0.22 R50/B50 473.5 -1.3 0.42
Statistically significant results are bolded and their percent differences are shown in red text.
4.6 Brake Specific Fuel Consumption (BSFC)
4.6.1 Off-Road Legacy Engine BSFC
The BSFC results for the off-road legacy engine are presented in Figure 4-17 on a gallons/bhp-hr basis. BSFC was calculated via the carbon balance method. Table 4-19 shows the average BSFC values for each test fuel and test cycle, and percentage differences and the associated p-values for statistical comparisons between the CARB reference fuel and the biofuels for each of the test cycles. BSFC showed statistically significant increases ranging from 3.5% for R100, 3.8% for R65/B35, and 4.4% for R50/B50 compared to the CARB reference fuel for the NRTC cycle. For the D2 cycle, there was no statistically significant change in BSFC for R100. For the D2 cycle, the R65/B35 showed a statistically significant BSFC increase of 4.5% and the R50/B50 showed a marginally statistically significant BSFC increase of 3.4% compared to the CARB reference fuel.

41
Figure 4-17. Average Brake Specific Fuel Consumption Results for the Off-Road Legacy Engine Testing
Table 4-19. BSFC (gal/bhp-hr), and Percentage Differences and Statistical Comparisons Between Biofuels and the CARB Reference Fuel for the Off-Road Legacy Engine
Cycle Fuel Type Ave. (gal/bhp.hr) % Diff vs. CARB p-value
(t-test)-
0.00 0.00 0.00
- 0.13 0.01 0.07*
NRTC CARB reference fuel 0.071 -
R100 0.073 3.5 R65/B35 0.074 3.8 R50/B50 0.074 4.4
D2 CARB reference fuel 0.066 -
R100 0.068 3.0 R65/B35 0.069 4.5 R50/B50 0.068 3.4
Statistically significant results are bolded and their percent differences are shown in red text. * Marginally statistically significant.
4.6.2 On-Road NTDE BSFC
BSFC results for the on-road NTDE are presented in Figure 4-18 on a gallons/bhp-hr basis. BSFC was calculated via the carbon balance method. Table 4-20 shows the average BSFC values for each test fuel and test cycle, and percentage differences and the associated p-values for statistical comparisons between the CARB reference fuel and the biofuels for each of the test cycles. It should be noted that for the on-road NTDE, a subset of outlier tests were observed over the FTP that were not include in the data presented in this subsection. These data are discussed in greater detail in Appendix A.
0.000.010.020.030.040.050.060.070.08
NRTC Cycle D2 Cycle
BSFC
(gal
/bhp
-hr)
CARB Reference R100 R65/B35 R50/B50

42
BSFC for the FTP cycle showed statistically significant increases in fuel consumption per bhp-hr for all of the biofuels, ranging from 4.8% for R100, 6.0% for R65/B35, and 5.7% for R50/B50. The RMC cycle also showed statistically significant increases in fuel consumption for all of the biofuels, ranging from 5.1% for R100, 6.5% for R65/B35, and 7.0% for R50/B50 when compared to the CARB reference fuel.
Figure 4-18. Average BSFC Results for the On-Road NTDE Testing
Table 4-20. BSFC, and Percentage Differences and Statistical Comparisons Between Biofuels and the CARB Reference Fuel for the On-Road NTDE Testing
Cycle Fuel Type Ave. (g/bhp.hr) % Diff vs. CARB p-value
(t-test)
FTP
CARB reference fuel 0.051 - - R100 0.054 4.8 0.00
R65/B35 0.054 6.0 0.00 R50/B50 0.054 5.7 0.00
RMC
CARB reference fuel 0.044 - - R100 0.047 5.1 0.00
R65/B35 0.047 6.5 0.00 R50/B50 0.047 7.0 0.00
Statistically significant results are bolded and their percent differences are shown in red text.
4.6.3 Off-Road NTDE BSFC
BSFC results for the off-road NTDE are presented in Figure 4-19 on a gallons/bhp-hr basis. BSFC was calculated via the carbon balance method. Table 4-21 shows the average BSFC values for each test fuel and test cycle, and percentage differences and the associated p-values for statistical comparisons between the CARB reference fuel and the biofuels for each of the test cycles. BSFC showed statistically significant increases for the NRTC cycle ranging from 4.1% for R100, 5.8% for R65/B35, and 6.1% for the R50/B50 fuels compared to the CARB reference fuel. For the C1
0.040
0.042
0.044
0.046
0.048
0.050
0.052
0.054
0.056
FTP RMC
BSFC
(gal
/bhp
-hr)
CARB Reference R100 R65/B35 R50/B50

43
cycle, BSFC showed statistically significant increases ranging from 5.0% for R100, 5.1% for R65/B35, and 5.2% for the R50/B50 fuels when compared to the CARB reference fuel.
Figure 4-19. Average BSFC Results for the Off-Road NTDE Testing
Table 4-21. Average BSFC and Percentage Differences Between the Renewable/Biodiesel Fuels and the CARB Reference Fuel for the Off-Road NTDE Testing
Cycle Fuel Type Ave. (g/bhp.hr) % Diff vs. CARB p-value (t-test)
CARB reference fuel 0.054 - - NRTC R100 0.056 4.1 0.00
R65/B35 0.057 5.8 0.00 R50/B50 0.057 6.1 0.00 CARB reference fuel 0.048 - -
C1 R100 0.050 5.0 0.00 R65/B35 0.051 5.1 0.00 R50/B50 0.051 5.2 0.01
Statistically significant results are bolded and their percent differences are shown in red text.
4.7 Total and Solid Particle Number Emissions
Measurements of total particle number (TPN) and solid particle number (SPN) emissions were made for the off-road legacy engine and on-road NTDE. SPNs represent measurements of solid particles above 23 nm in diameter, as defined by the European Union solid particle number emissions regulations. TPN and SPN emissions in #/bhp-hr for each engine, fuel, and cycle are shown in Figure 4-20. Note that the off-road legacy engine TPN and SPN emissions are divided by a factor of 1000 in order to effectively show both engines on the same figure. Table 4-22 and Table 4-23 show the average emissions for the legacy off-road engine each test fuel and test cycle,
0.030
0.035
0.040
0.045
0.050
0.055
0.060
NRTC C1
BSFC
(gal
/bhp
-hr)
CARB Reference R100 R65/B35 R50/B50

44
and percentage differences and the associated p-values for statistical comparisons between the CARB reference fuel and the biofuels for each of the test cycles for the TPN and SPN, respectively. Table 4-24 and Table 4-25 show the average emissions for the off-road NTDE each test fuel and test cycle, and percentage differences and the associated p-values for statistical comparisons between the CARB reference fuel and the biofuels for each of the test cycles for the TPN and SPN, respectively. It should be noted that for the on-road NTDE, a subset of outlier tests were observed over the FTP that were not include in the data presented in this subsection. These data are discussed in greater detail in Appendix A.
For both engines, the biofuel blends generally showed a reduction in both TPN and SPN emissions, with the exception of TPN for R100 fuel for the off-road legacy engine D2 cycle that also showed a relatively large measurement variability, as indicated by the wide error bar. TPN and SPN emissions for both engines were seen in lower levels for the higher biodiesel blends relative to R100 and CARB reference fuel. These trends are consistent with those seen for the PM mass from the off-road legacy engine, where the PM mass emissions are well above the background levels.
Figure 4-20. Average Total Particle Number and Solid Particle Number Emissions for the Off-Road Legacy Engine and On-Road NTDE Testing
0.E+00
1.E+11
2.E+11
3.E+11
4.E+11
5.E+11
6.E+11
7.E+11
8.E+11
9.E+11
NRTC Cycle/1000 D2 Cycle/1000 FTP Cycle RMC Cycle
Off-Road Legacy Engine On-Road NTDE
PN (#
/bhp
-hr)
CARB Reference TPN R100 TPN R65/B35 TPN R50/B50 TPN
CARB Reference SPN R100 SPN R65/B35 SPN R50/B50 SPN

45
Table 4-22. TPN Emissions, and Percentage Differences and Statistical Comparisons Between Biofuels and the CARB Reference Fuel for the Off-Road Legacy Engine Testing
Cycle Fuel Type Ave. (#/bhp.hr) % Diff vs. CARB p-value (t-test)
NRTC
CARB reference fuel 5.6E+11 - - R100 4.7E+11 -16 0.00
R65/B35 3.6E+11 -37 0.00 R50/B50 3.2E+11 -43 0.00
D2
CARB reference fuel 4.0E+11 - - R100 4.5E+11 14 0.61
R65/B35 2.0E+11 -50 0.02 R50/B50 2.1E+11 -47 0.01
Statistically significant results are bolded and their percent differences are shown in red text.

46
Table 4-23. SPN Emissions, and Percentage Differences and Statistical Comparisons Between Biofuels and the CARB Reference Fuel for the Off-Road Legacy Engine Testing
Cycle Fuel Type Ave. (#/bhp.hr) % Diff vs. CARB p-value (t-test)
NRTC
CARB reference fuel 6.7E+11 - - R100 5.4E+11 -19 0.00
R65/B35 4.2E+11 -37 0.00 R50/B50 3.5E+11 -48 0.00
D2
CARB reference fuel 5.5E+11 - - R100 4.3E+11 -21 0.00
R65/B35 3.3E+11 -40 0.00 R50/B50 3.5E+11 -37 0.00
Statistically significant results are bolded and their percent differences are shown in red text.
Table 4-24. TPN Emissions, and Percentage Differences and Statistical Comparisons Between Biofuels and the CARB Reference Fuel for the On-Road NTDE Testing
Cycle Fuel Type Ave. (#/bhp.hr) % Diff vs. CARB p-value (t-test)
FTP
CARB reference fuel 6.7E+11 - - R100 5.6E+11 -16 0.00
R65/B35 4.2E+11 -37 0.00 R50/B50 3.5E+11 -48 0.00
RMC
CARB reference fuel 2.6E+11 - - R100 2.2E+11 -14 0.00
R65/B35 1.7E+11 -33 0.00 R50/B50 2.2E+11 -16 0.03
Statistically significant results are bolded and their percent differences are shown in red text.
Table 4-25. SPN Emissions, and Percentage Differences and Statistical Comparisons Between Biofuels and the CARB Reference Fuel for the On-Road NTDE Testing
Cycle Fuel Type Ave. (#/bhp.hr) % Diff vs. CARB p-value (t-test)
FTP
CARB reference fuel 6.6E+11 - - R100 5.2E+11 -22 0.00
R65/B35 3.2E+11 -51 0.00 R50/B50 2.8E+11 -57 0.00
RMC
CARB reference fuel 2.0E+11 - - R100 1.6E+11 -19 0.00
R65/B35 1.2E+11 -40 0.00 R50/B50 1.0E+11 -48 0.00
Statistically significant results are bolded and their percent differences are shown in red text.

47
4.8 Particle Size Distributions
4.8.1 Off-Road Legacy Engine PSDs
Figure 4-21 shows the particle size distributions (PSD) of all fuels/test cycle combinations for the off-road legacy engine. Diesel-generated combustion particles are typically divided into three modes, including the nucleation mode (5-50 nm diameter), the accumulation mode (50-1,000 nm diameter), and the coarse mode (1,000-10,000 nm diameter). The nucleation mode typically consists of organic volatile compounds and can contain ash and soot particles. Most soot particles agglomerate, however, and are usually found in the accumulation mode. Coarse mode particles are typically from larger soot particles breaking off of the exhaust walls.
For the off-road legacy engine, the R100, R65/R35, and R50/B50 fuels showed reductions in particle counts per bhp-hr over most of the particle size range compared to the CARB reference fuel for both cycles. These reductions were most significant for the larger particles in the accumulation mode, although reductions were also found in the nucleation size range, peaking around 30 nm, for most of the biofuels relative to the CARB reference fuel. The R100 showed higher particle counts than the R65/B35 and R50/B50 fuels in the nucleation mode size range for both cycles and in the accumulation mode particle size range for the NRTC.

48
Figure 4-21. Particle Size Distributions for the Off-Road Legacy Engine Testing on (a) NRTC cycle and (b) D2 cycle
4.8.2 On-Road NTDE PSDs
Figure 4-22 shows the PSDs of all fuels/test cycle combinations for the on-road NTDE. The on-road NTDE generally only showed particle sizes less than 100 nm, suggesting the DPF effectively reduced the accumulation and coarse particles. Figure 4-22 was shortened to only show particle size range from 0 to 200 nm in order to better show emission differences between fuels. Nucleation mode particles were about an order of magnitude lower than those measured for the off-road legacy engine. The lower nucleation mode particles for the on-road NTDE were a
0
2E+13
4E+13
6E+13
8E+13
1E+14
1.2E+14
0 100 200 300 400 500 600
Part
icle
Cou
nt (#
/bhp
-hr)
Particle Size (nm)
CARB Reference NRTCR100 NRTCR65/B35 NRTCR50/B50 NRTC
(a)
01E+132E+133E+134E+135E+136E+137E+138E+139E+131E+14
0 100 200 300 400 500 600
Part
icle
Cou
nt (#
/bhp
-hr)
Particle Size (nm)
CARB Reference D2R100 D2R65/B35 D2R50/B50 D2
(b)

49
consequence of the DPF/DOC system. Surprisingly, the R65/B35 fuel showed the highest emissions for the FTP cycle, but also showed large measurement variability, as indicated by the wide error bars. Over the full test matrix, however, the use of biofuel blends generally resulted in lower particle counts in the different size ranges compared to the CARB reference fuel.
Figure 4-22. Particle Size Distributions for the On-Road NTDE (a) on FTP cycle and (b) RMC cycle
0
1E+12
2E+12
3E+12
4E+12
5E+12
6E+12
7E+12
8E+12
0 40 80 120 160 200
Part
icle
Cou
nt (#
/bhp
-hr)
Particle Size (nm)
CARB Reference FTP
R100 FTP
R65/B35 FTP
R50/B50 FTP
(a)
0
1E+12
2E+12
3E+12
4E+12
5E+12
6E+12
7E+12
8E+12
0 40 80 120 160 200
Part
icle
Cou
nt (#
/bhp
-hr)
Particle Size (nm)
CARB Reference RMC
R100 RMC
R65/B35 RMC
R50/B50 RMC
(b)

50
5 Summary and Conclusions
CARB is evaluating the potential for use of renewable diesel and renewable diesel/biodiesel blends to reduce NOx and PM for on-road and off-road diesel-powered vehicles and equipment. The goal of this study was the characterize the emissions and performance of renewable diesel and renewable diesel/biodiesel blends in legacy engines and NTDEs. For this study, emissions testing was conducted on renewable diesel and renewable diesel/biodiesel blends in an off-road legacy engine and heavy-duty on-road and off-road NTDEs using an engine dynamometer. This study focused on engine dynamometer measurements. The engine dynamometer testing included two off-road engines with different levels of emissions control technology (i.e., one legacy and one NTDE) and one on-road heavy-duty NTDE. Testing was conducted on a CARB reference fuel, pure renewable diesel, and two renewable diesel/biodiesel blends. Testing was conducted on at least two test cycles per engine, including the NRTC or FTP transient cycles and different steady state ramped modal cycles.
A summary of the results is below for each of the pollutants measured. It should be noted that for the on-road NTDE, a subset of outlier tests were observed over the FTP that were not included in the data presented in the Summary and Conclusions section. These data are discussed in greater detail in Appendix A.
NOx Emissions
NOx emissions results for the testing on the off-road legacy engine showed the lowest emissions for the R100 for both the NRTC and D2 cycles. R100 showed statistically significant reductions of 5.4% for the NRTC and 4.9% for the D2 cycle compared to the CARB reference fuel. The R65/B35 showed no statistically significant differences compared to the CARB reference fuel for either the NRTC or the D2 cycles. The R50/B50 showed statistically significant increases of 1.8% for the NRTC and 4.2% for the D2 cycle compared to the CARB reference fuel.
For the on-road NTDE, no statistically significant differences in NOx emissions were found between the CARB reference fuel and R100 over either the FTP or RMC cycles. The FTP cycle showed statistically significant increases of 46.6% for R65/B35 and 49.5% for R50/B50. The RMC cycle showed statistically significant increases of 14.2% for R65/B35 and 15.4% for R50/B50. Engine out NOx sensor data for the RMC cycle showed that there are increases in engine out NOx levels for the biodiesel blends, which is likely a key factor contributing to the higher tailpipe emissions for the renewable diesel/biodiesel blends. Comparison of the engine out and tailpipe NOx data showed that the SCR provided a 95% to 96% reduction in NOx emissions for the different fuels.
For the off-road NTDE, no statistically significant differences in NOx emissions were found between the CARB reference fuel and R100 for the NRTC or C1 cycles. The NRTC showed statistically significant increases of 88.3% for R65/B35 blend and 149.6% for the R50/B50 blend. The C1 cycle showed statistically significant increases of 55.1% for the R65/B35 blend and 119.4% for the R50/B50 blend. The engine out data show consistently higher emissions for the R65/B35 and R50/B50 fuels compared with the CARB reference fuel for both cycles. The engine out data did not show any statistically significant differences between the R100 and the CARB reference fuel for either cycle. Comparison of the engine out and tailpipe NOx data showed that

51
the SCR provided NOx reduction efficiencies of 93% for the CARB reference fuel, 91% for R100, 88% for R65/B35, and 85% for R50/B50. The SCR provided NOx reductions of 98% to 99% for all fuels for the C1 cycle.
PM Emissions
For the off-road legacy engine, PM emissions showed decreases for the renewable diesel and the renewable diesel/biodiesel blends for both the NRTC and the D2 cycle. The reductions for the NRTC compared to the CARB reference fuel were 38% for R100, 53% for R65/B35, and 63% for R50/B50. The reductions for the D2 compared to the CARB reference fuel were 27% for R100, 51% for R65/B35, and 58% for R50/B50 fuel.
For the on-road NTDE, PM mass emissions in general were low and near background levels, and averaged less than 0.001 mg/bhp-hr for all tests conditions and both cycles. As the PM standard for heavy-duty on-road engines is 0.01 g/bhp-hr, the PM emissions observed are for the most part at least 20-fold lower than the PM standard. The PM emissions for the different fuels generally did not show statistically significant differences, with the exception of the R50/B50, which had emissions that were lower than those for the CARB reference fuel at a marginally statistically significant level over the FTP cycle.
For the off-road NTDE, PM mass emissions were more than a factor of 30 below the 0.015 g/bhp-hr PM standard for Tier 4 off-road engines in this size category for all test conditions and both cycles. No statistically significant differences in PM mass emissions were seen between fuels for either test cycle.
THC Emissions
For the off-road legacy engine, THC emissions showed significant decreases for renewable diesel and the renewable diesel/biodiesel blends for both the NRTC and D2 cycles. The reductions for the NRTC compared to the CARB reference fuel were 45% for R100, 49% for R65/B35, and 66% for R50/B50. The reductions for the D2 compared to the CARB reference fuel were 35% for R100, 58% for R65/B35, and 71% for R50/B50.
For the on-road NTDE, THC emissions were near or below background levels for all tests conditions and both cycles. For the FTP, only R50/B50 showed a statistically significant reduction relative to the CARB reference fuel, with R100 and R65/B35 showing no statistically significant differences in THC emissions relative to the CARB reference fuel. For the RMC cycle, THC emissions levels were below the background levels for all tests, and hence there were no measurable THC emissions.
For the off-road NTDE, THC emissions were below the background levels for both the NRTC and C1 cycles and for all fuels, so no fuel differences were seen.
CO Emissions
For the off-road legacy engine, CO emissions showed statistically significant decreases for the renewable diesel and the renewable diesel/biodiesel blends for both the NRTC and D2 cycles. The reductions for the NRTC compared to the CARB reference fuel were 22% for R100, 26% for

52
R65/B35, and 32% for R50/B50. The reductions for the D2 cycle compared to the CARB reference fuel were 14% for R100, 28% for R65/B35, and 32% for R50/B50.
For the on-road NTDE, the FTP showed no statistically significant changes in CO emissions for any of the test biofuels relative to the CARB reference fuel. The RMC showed a slight reduction of 5% with R100, with no statistical difference in CO emissions observed with the R65/B35 and R50/B50 blends.
For the off-road NTDE, for the NRTC, measurable, but low CO emissions were found for the CARB reference fuel and R100. The NRTC CO emissions for the R100 fuel were 44% lower than those for the CARB reference fuel. The NRTC CO emissions for the R65/B35 and R50/B50 fuels were much lower than those for the CARB reference fuel and R100 fuels, and were near or below the background levels for all tests. For the C1 cycle, CO emissions were near or below background levels for all tests.
CO2 Emissions
For the off-road legacy engine, for the NRTC, CO2 emissions showed statistically significant reductions of 4.1% for R100, 2.6% for R65/B35, and 1.7% for R50/B50 compared to the CARB reference fuel. For the D2 cycle, R100 showed a statistically significant reduction in CO2 emissions of 4.6% compared to the CARB reference fuel, while the R65/B35 and R50/B50 fuels did not show statistically significant differences compared to the CARB reference fuel.
For the on-road NTDE, CO2 emissions from the transient cycle showed statistically significant decreases of 3.2% for R100, 1.0% for R65/B35, and 0.9% for R50/B50 compared to the CARB reference fuel. The steady state cycle showed statistically significant decreases of 2.9% for R100 and 0.5% for R65/B35, and a marginally statistically significant increase of 0.3% for R50/B50 compared to the CARB reference fuel.
For the off-road NTDE, CO2 emissions showed statistically significant reductions for the R100 of 3.8% for the FTP and of 3.0% for the D2 cycle compared to the CARB reference fuel. CO2 emissions did not show statistically significant differences for the R65/B35 and R50/B50 fuels compared to the CARB reference fuel for either the NRTC or C1 cycles.
Brake Specific Fuel Consumption (BSFC)
For the off-road legacy engine, BSFC showed statistically significant increases ranging from 3.5% for R100, 3.8% for R65/B35, and 4.4% for R50/B50 compared to the CARB reference fuel for the NRTC cycle. For the D2 cycle, there was no statistically significant change in BSFC for R100. For the D2 cycle, the R65/B35 showed a statistically significant BSFC increase of 4.5% and the R50/B50 showed a marginally statistically significant BSFC increase of 3.4% compared to the CARB reference fuel.
For the on-road NTDE, BSFC for the transient cycle showed statistically significant increases in fuel consumption per bhp-hr for all of the biofuels, ranging from 4.8% for R100, 6.0% for R65/B35, and 57% for R50/B50. The steady state cycle also showed statistically significant increases in fuel consumption for all of the biofuels, ranging from 5.1% for R100, 6.6% for R65/B35, and 7.0% for R50/B50 when compared to the CARB reference fuel.

53
For the off-road NTDE, BSFC showed statistically significant increases for the NRTC BSFC ranging from 4.1% for R100, 5.8% for R65/B35, and 6.1% for the R50/B50 fuels compared to the CARB reference fuel. For the C1 cycle, BSFC showed statistically significant increases ranging from 5.0% for R100, 5.1% for R65/B35, and 5.2% for the R50/B50 fuels when compared to the CARB reference fuel.
Total and Solid Particle Number Emissions
Additional measurements of total and solid particle number emissions were made for the off-road legacy engine and on-road NTDE. Solid particle number represent measurements of solid particles greater than 23 nm in diameter, as defined by the European Union solid particle number emissions regulations. For both engines, the biofuel blends generally showed a reduction in both TPN and SPN emissions, with the exception of total particle number for R100 fuel for the D2 cycle that also showed a relatively large measurement variability. TPN and SPN emissions for the higher biodiesel blends were lower than the R100 and CARB reference fuel. These trends are consistent with those seen for the PM mass from the off-road legacy engine, where the PM mass emissions are well above the background levels.
Particle Size Distributions
For the off-road legacy engine, the R100, R65/R35, and R50/B50 fuels showed reductions in particle counts per bhp-hr over most of the particle size range compared to the CARB reference fuel for both cycles. These reductions were most significant for the larger particles in the accumulation mode (50-1,000 nm), although reductions were also found in the nucleation size range (5-50 nm), peaking around 30 nm, for most of the biofuels relative to the CARB reference fuel. The R100 showed higher particle counts than the R65/B35 and R50/B50 fuels in the nucleation mode size range for both cycles and in the accumulation mode particle size range for the NRTC.
For the on-road NTDE, nucleation mode particles were about an order of magnitude lower than those measured for the off-road legacy engine. The R65/B35 fuel showed the highest emissions for the FTP cycle, but also showed large measurement variability. Over the full test matrix, however, the use of biofuel blends generally resulted in lower particle counts in the different size ranges compared to the CARB reference fuel.
Conclusions
For NOx emissions, the results for this legacy engine are consistent with previously observed reductions in NOx emissions with R100 as the test fuel, and increased emissions of NOx from the use of biodiesel in fuel. They are also consistent with the observations that renewable diesel in a renewable diesel/biodiesel blend can reduce NOx emissions arising from the use of biodiesel, with the highest ratio of renewable diesel to biodiesel (R65/B35) in this study resulting in NOx emissions that were not significantly different from CARB reference fuel (also referred to as a NOx-neutral ratio), while the R50/B50 blend (the lowest ratio of renewable diesel to biodiesel) did result in higher NOx emissions than CARB reference fuel. Therefore, the renewable diesel in the R50/B50 blend did not sufficiently reduce NOx emissions from biodiesel such that emissions are NOx neutral, while the R65/B35 blend did result in NOx-neutral emissions.

54
NOx emissions from both NTDEs with R100 as the test fuel were not statistically different than the CARB reference fuel. NOx emissions in the renewable diesel/biodiesel blends were statistically higher than the CARB reference fuel for both NTDEs, with emissions increasing as the renewable diesel to biodiesel ratio decreased (i.e., biodiesel concentration increased and renewable diesel concentrations decreased), although the NOx emissions increases were not linear. These results indicate that in these particular NTDEs, equipped with state-of-the-art emissions control systems, NOx emissions resulting from the two renewable diesel/biodiesel blends tested (R65/B35 and R50/B50) were not completely controlled, i.e., were not NOx-neutral relative to CARB reference fuel, although the NOx emissions overall in the NTDE engines were orders of magnitude lower than those from the legacy engine.
PM emissions in the legacy off-road engine showed statistically significant reductions in comparison to the CARB reference fuel for all test biofuels and both cycles, with the greatest PM reductions observed in the blends with the renewable diesel/biodiesel ratios (highest biodiesel concentrations), confirming previous observations that biodiesel does act to reduce PM emissions in legacy diesel engines. There were no statistical differences in PM emissions in the NTDEs observed in any test fuel or test cycle compared to the CARB reference fuel, indicating that PM emissions are effectively controlled by the exhaust aftertreatment systems, no matter the biofuel blend or test cycle.

A-1
Appendix A: Cummins FTP Outlier Discussion
It should be noted that for the on-road NTDE, there were a number of outlier tests for the FTP, where the engine appeared to be running in a slightly different operating mode compared to the other tests. The NOx emissions for these outlier tests showed emissions that were on the order of twice the NOx emissions for the non-outlier tests, with these differences being statistically significant for the test fuels that showed multiple outlier points. These same test points also showed statistically significant differences for CO and CO2 emissions, and brake specific fuel consumption, as shown below. The FTP outlier tests also showed some differences in the ECM parameters for the engine, as shown below in Figure A-1 for the average turbocharger actuator position.
Table A-1 shows the average emissions for the FTP outlier tests for each of the measured pollutants for each test fuel, and percentage differences and the associated p-values for statistical comparisons between the CARB reference fuel and the biofuels for each of the test cycles. It should be noted that only a single outlier test was found for the R100 and R65/B35 fuels, so statistical comparisons could not be made for those fuels.
The NOx emission results for the on-road NTDE FTP outlier tests are presented in Figure A-2 on a g/bhp-hr basis. The R50/B50 showed statistically significant increases in NOx emissions compared to the CARB reference fuel, consistent with the results in section 4.1.2. For the other measurements, only BSFC showed statistically significant increases for the R50/B50 compared to the CARB reference fuel, consistent with the results in section 4.1.2
Figure A-1. Average Turbo Actuator Valve Position for the Non-Outlier and Outlier FTP Tests for the On-Road NTDE Testing
2530354045505560657075
Turbocharger Actuator
Posi
tion
(%)
Non-Outlier Outlier

A-2
Figure A-2. Average FTP Outlier NOx Emission Results for the On-Road NTDE Testing
0.00
0.05
0.10
0.15
0.20
0.25
0.30
0.35
FTP Outliers
NO
x (g
/bhp
-hr)
CARB Reference R100 R65/B35 R50/B50

A-4
Table A-1. FTP Outlier Emissions for NOx, PM, THC, CO, CO2, BSFC, TPN, and SPN, and Percentage Differences and Statistical Comparisons Between Biofuels and the CARB
Reference Fuel for the On-Road NTDE
Emissions Fuel Type Ave. (g/bhp.hr) % Diff vs. CARB p-value (t-test)
NOx
CARB reference fuel 0.25 - - R100 0.32 26.9 -
R65/B35 0.27 9.3 - R50/B50 0.28 13.5 0.09*
PM
CARB reference fuel 0.00069 - - R100 0.00050 -27 -
R65/B35 0.00021 -69 - R50/B50 0.00022 -67 0.29
THC
CARB reference fuel 0.001 - - R100 0.000 -84 -
R65/B35 0.000 -72 - R50/B50 0.000 -100 0.12
CO
CARB reference fuel 0.25 - - R100 0.25 -3 -
R65/B35 0.26 1 - R50/B50 0.29 13 0.13
CO2
CARB reference fuel 495.4 - - R100 486.2 -1.9 -
R65/B35 501.3 1.2 R50/B50 503.9 1.7 0.15
BSFC
CARB reference fuel 0.050 - - R100 0.053 6.2 -
R65/B35 0.054 8.3 - R50/B50 0.054 8.5 0.00
TPN
CARB reference fuel 6.3E+11 - - R100 - - -
R65/B35 - - - R50/B50 - - -
SPN
CARB reference fuel 6.1E+11 - - R100 - - -
R65/B35 - - - R50/B50 2.2E+11 -63 -
Statistically significant results are bolded and their percent differences are shown in red text. * Marginally statistically significant.

B-1
Appendix B: CARB Reference Fuel Certificate of Analysis

C-1
Appendix C: Southwest Research Institute Fuel Analysis Results
Table C-1. Fuel Analysis Results for CARB Diesel, B100, and R100

C-2
Table C-2. Fuel Analysis Results for R65/B35 and R50/B50 Blends

D-1
Appendix D: Laboratory Resources
CE-CERT Mobile Emissions Laboratory
Controlling emissions from heavy-duty diesel engines is a major priority for the regulatory community and industry. To assist with this effort, CE-CERT has worked with regulatory agencies, engine manufacturers, exhaust aftertreatment companies, fuel companies, and vehicle end users over the past year and a half to understand the scope of the diesel exhaust issue and articulate a research program designed to improve our understanding of the problem and potential solutions. CE-CERT also has developed new research capabilities, including a unique emissions measurement laboratory and an enhanced environmental modeling group. Together, these resources can shed important light on critical emissions issues and contribute to efficient, effective environmental strategies and to greater industry/government/academic cooperation. This program plan describes the technical vision and contemplated approach for achieving these objectives.
CE-CERT has constructed an emissions laboratory contained within a 53-foot truck trailer, designed to make laboratory-quality emissions measurements of heavy-duty trucks under actual operating conditions (Figure D-1).
The laboratory contains a dilution tunnel, analyzers for gaseous emissions, and ports for particulate measurements. Although much of the system is custom-designed, the laboratory was designed to conform as closely as possible to Code of Federal Regulations requirements for gaseous and particulate emissions measurement. The laboratory is designed to operate as a class 8 tractor is pulling it over the road (or on a closed track over a repeatable cycle); it is not a roadside testing laboratory. It also is used to measure emissions from heavy-duty stationary engines, such as pipeline pumps and backup generators, as they operate under actual loads.
With laboratory development and validation nearly complete, CE-CERT intends to embark on a research program to explore the following topics:
• “Real world” emissions of gaseous and particulate pollutants from on-road heavy-duty engines.
• The effects of alternative diesel fuel formulations, alternative fuels, alternative powertrains, and emission control technologies on emissions and energy consumption.
• The effects of driving cycles on emissions.
• Modal emissions modeling for heavy-duty trucks.

D-2
Figure D-1. Mobile Emissions Laboratory
CE-CERT Heavy-Duty Engine Dynamometer Test Facility
CE-CERT’s Heavy-Duty Engine Dynamometer Test Facility is designed for a variety of applications including verification of diesel aftertreatment devices, certification of alternative diesel fuels, and fundamental research in diesel emissions and advanced diesel technologies. The engine dynamometer facility components were provided as a turnkey system by Dyne Systems of Wisconsin. CE-CERT’s Mobile Emissions Laboratory (MEL) is used directly in conjunction with this facility for certification type emissions measurements.
The test cell is equipped with a 600 horsepower (hp) GE DC electric engine dynamometer that was obtained from the EPA’s National Vehicle and Fuels Emission Laboratory in Ann Arbor, MI. The dynamometer is capable of testing approximately 85% of the engines used in on-road applications, and is primarily be used for engines in the 300 to 600 hp range. A charge air conditioning system was obtained from Dyno Air of North Carolina to provide temperature/ humidity control for the engine intake air, with an accuracy of ±2°C from the setpoint.

D-2
Figure D-2. CE-CERT’s Heavy-Duty Engine Dynamometer Facility

E-1
Appendix E: QA/QC Procedures
Internal calibration and verification procedures are performed in MEL regularly in accordance with the CFR. A partial summary of routine calibrations performed by the MEL staff as part of the data quality assurance/quality control program is listed in Table E-1.
Table E-1. Sample of Verification and Calibration Quality Control Activities EQUIPMENT FREQUENCY VERIFICATION PERFORMED CALIBRATION PERFORMED
CVS
Daily Differential Pressure Electronic Cal
Daily Absolute Pressure Electronic Cal
Weekly Propane Injection
Monthly CO2 Injection
Per Set-up CVS Leak Check
Second by second Back pressure tolerance ±5 in H20
Cal system MFCs Annual Primary Standard MFCs: Drycal Bios Meter
Monthly Audit bottle check
Analyzers
Pre/Post Test Zero Span
Daily Zero span drifts
Monthly Linearity Check
Secondary System Integrity and MFCs
Semi-Annual Propane Injection: 6 point primary vs secondary check
Semi-Annual MFCs: Drycal Bios Meter & TSI Mass Meter
Data Validation Variable Integrated Modal Mass vs Bag Mass
Per test Visual review
PM Sample Media Weekly Tunnel Banks
Monthly Static and Dynamic Blanks
Temperature Daily Psychrometer Performed if verification fails
Barometric Pressure Daily Aneroid barometer ATIS Performed if verification fails
Dewpoint Sensors Daily Psychrometer Chilled mirror Performed if verification fails
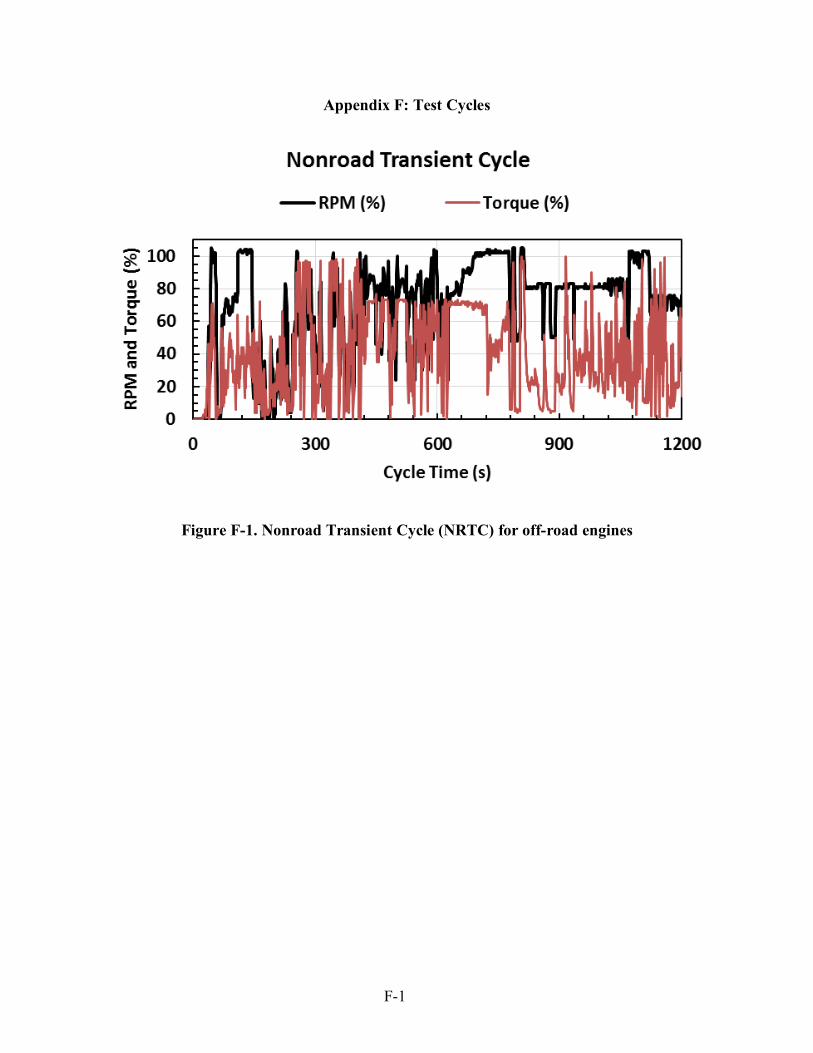
F-1
Appendix F: Test Cycles
Figure F-1. Nonroad Transient Cycle (NRTC) for off-road engines
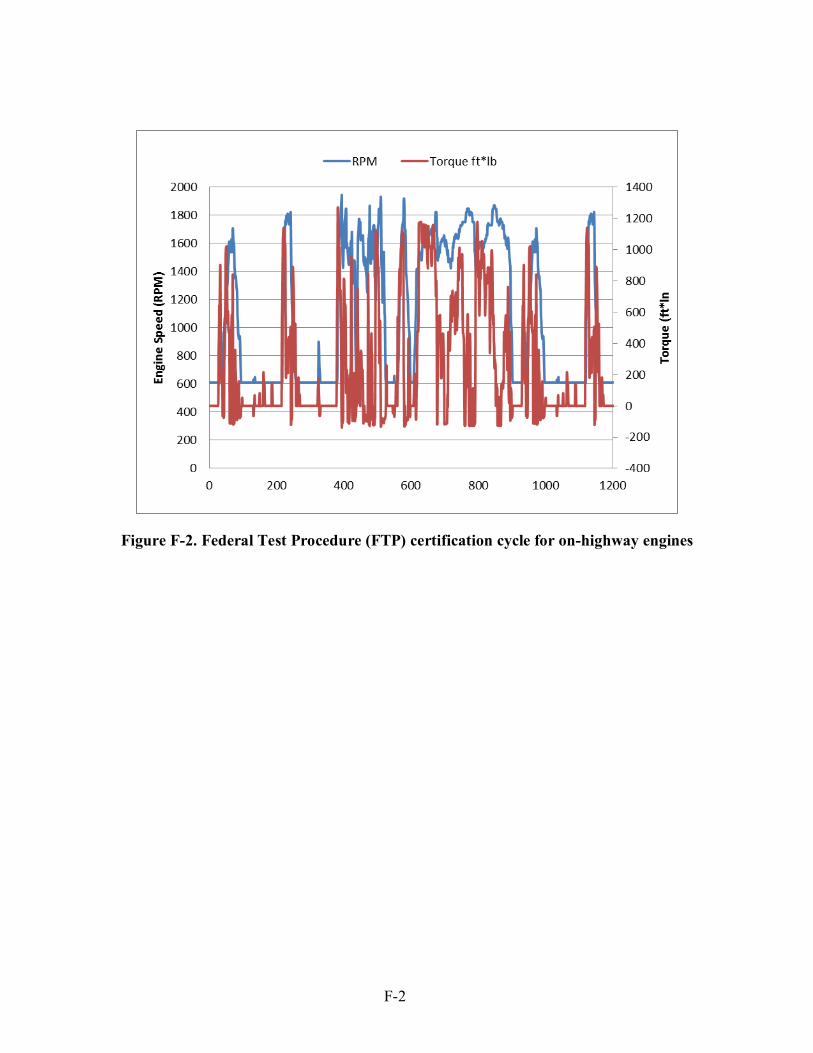
F-2
Figure F-2. Federal Test Procedure (FTP) certification cycle for on-highway engines

F-3
Figure F-3. Test Points and Sequence for D2 RMC Off-Road Legacy Engine
Figure F-4. Test Points and Sequences for SET Ramped Modal On-Road NTDE

F-4
Figure F-5. Test Points and Sequences for C1 RMC for Off-Road NTDE
Figure F-6. Graphical Presentation of the C1 RMC for Off-Road NTDE

G-1
Appendix G: Detailed Emissions Test Results
Appendix G-1: Detailed Off-Road Legacy Engine Emissions Test Results (D2 Cycle)
File ID Power (bhp-hr) CO2 (g/bhp-hr) CO (g/bhp-hr) NOx (g/bhp-hr) THC (g/bhp-hr) PM (mg/bhp-hr) F.C. (gal/bhp-hr)
20200115_0654 17.9 608.2 2.32 1.97 0.86 58.64 0.06220200115_0749 17.1 634.4 1.85 2.06 1.01 59.46 0.06420200115_0833 17.5 621.7 2.31 2.01 0.94 57.91 0.06320200116_1039 17.2 637.6 2.83 2.09 0.98 63.80 0.06520200116_1127 17.8 621.2 2.77 1.95 1.02 58.00 0.06320200116_1218 17.0 655.2 2.97 2.01 1.03 63.61 0.06620200117_1505 17.3 646.8 2.49 2.00 0.80 45.03 0.06520200117_1556 17.3 654.3 2.72 1.98 0.83 46.90 0.06620200117_1731 17.8 636.9 2.55 1.93 0.81 44.23 0.06520200124_1031 16.5 721.9 2.93 2.19 1.01 47.00 0.07320200124_1120 16.9 700.2 2.80 2.14 0.93 45.99 0.07120200124_1208 17.8 666.5 2.81 2.02 1.01 46.04 0.06820200127_0555 18.2 632.6 2.66 1.94 0.94 43.79 0.06420200127_0641 17.0 684.1 2.89 2.03 0.97 48.54 0.06920200127_1014 18.3 638.4 2.68 1.93 0.98 44.32 0.06520200127_1735 17.4 664.6 3.05 2.02 1.21 54.73 0.06720200127_1824 18.1 642.4 2.92 1.94 1.16 52.58 0.06520200127_1911 18.3 637.4 2.83 1.92 1.10 50.84 0.065
20200115_1100 16.9 620.9 2.19 1.97 0.66 38.69 0.06820200115_1152 16.4 636.2 2.20 2.01 0.67 39.50 0.07020200115_1241 17.7 591.3 1.91 1.87 0.58 34.57 0.06520200116_1619 17.9 590.6 2.24 1.87 0.57 35.50 0.06520200116_1712 17.9 590.5 2.04 1.87 0.41 32.28 0.06520200116_1801 17.8 593.4 2.17 1.86 0.50 33.93 0.06520200124_0617 17.9 638.6 2.76 1.87 0.86 44.83 0.07020200124_0704 17.7 651.2 2.60 1.89 0.66 35.04 0.07120200124_0800 17.1 671.5 2.78 1.98 0.83 47.19 0.074
20200115_1514 16.7 637.8 1.75 2.07 0.43 26.43 0.06920200115_1607 17.1 623.3 1.77 2.02 0.46 28.00 0.06720200115_1653 16.9 627.6 1.77 2.04 0.43 27.32 0.06820200117_0632 17.7 624.4 1.87 1.93 0.31 21.34 0.06720200117_0721 17.5 632.8 1.84 1.97 0.32 21.34 0.06820200117_0808 17.1 649.9 1.90 2.01 0.32 22.65 0.07020200127_1242 17.7 641.4 2.09 1.97 0.41 23.26 0.06920200127_1416 17.5 643.2 2.00 2.00 0.34 22.41 0.06920200127_1502 17.0 665.8 2.46 2.04 0.67 36.24 0.072
20200116_0635 17.3 616.0 1.94 2.21 0.31 26.99 0.06620200116_0723 18.1 591.5 1.68 2.12 0.20 25.10 0.06420200116_0811 17.2 624.9 1.73 2.20 0.21 25.84 0.06720200117_1100 17.5 635.4 1.72 2.02 0.22 17.09 0.06820200117_1151 18.1 614.8 1.71 1.94 0.24 16.76 0.06620200117_1239 17.9 624.3 1.72 1.97 0.24 16.44 0.06720200124_1447 17.2 677.1 2.40 2.15 0.61 30.57 0.07320200124_1536 17.8 653.0 1.79 2.09 0.28 17.51 0.07020200124_1623 17.5 670.2 1.85 2.11 0.28 17.53 0.072
R65/B35
R50/B50
Carb ULSD
R100

G-2
Appendix G-2: Detailed Off-Road Legacy Engine Emissions Test Results (NRTC Cycle)

G-3
Appendix G-3: Detailed On-Road NTDE Emissions Test Results (FTP Cycle)
File ID Power (bhp-hr) CO2 (g/bhp-hr) CO (g/bhp-hr)NOx (g/bhp-hr)THC (g/bhp-hr) PM (mg/bhp-hr)F.C. (gal/bhp-hr)
202010191014 31.0 488.3 0.26 0.27 0.00 0.68 0.049202010191056 30.9 499.4 0.26 0.25 0.00 1.30 0.050202010191141 30.9 507.8 0.27 0.13 0.00 1.01 0.051202010211246 30.5 510.5 0.27 0.10 0.00 0.36 0.051202010211327 30.6 510.0 0.27 0.10 0.00 0.32 0.051202010211410 30.8 506.2 0.27 0.10 0.00 0.67 0.051202010230755 30.8 509.7 0.27 0.13 0.00 0.14 0.051202010230837 30.5 515.5 0.27 0.11 0.00 0.44 0.052202010230920 30.9 498.5 0.25 0.22 0.00 0.08 0.050202010261329 30.5 506.9 0.33 0.11 0.00 0.10 0.051202010261411 30.8 504.8 0.34 0.11 0.00 0.78 0.051202010261453 30.7 506.5 0.33 0.11 0.01 0.31 0.051202010280944 30.5 515.7 0.32 0.11 0.00 0.34 0.052202010281026 30.8 509.8 0.31 0.12 0.00 0.12 0.051202010281108 30.8 509.5 0.32 0.11 0.00 0.13 0.051
202010191442 30.8 494.8 0.28 0.10 0.00 0.30 0.054202010191525 30.7 499.0 0.28 0.11 0.00 0.72 0.054202010191607 31.0 489.0 0.27 0.10 0.00 0.81 0.053202010220801 30.6 486.2 0.25 0.32 0.00 0.50 0.053202010220843 30.4 494.0 0.26 0.15 0.00 0.23 0.054202010220925 30.5 495.5 0.26 0.12 0.00 0.62 0.054202010221007 30.6 493.3 0.26 0.13 0.00 0.13 0.054202010271411 31.1 488.2 0.31 0.12 0.01 0.00 0.053202010271454 30.8 495.7 0.31 0.11 0.01 0.39 0.054202010271535 31.0 490.7 0.31 0.11 0.00 0.00 0.053
202010210803 30.5 504.9 0.27 0.19 0.00 0.44 0.054202010210844 30.6 502.8 0.27 0.16 0.00 1.02 0.054202010210926 30.6 502.5 0.26 0.15 0.00 0.75 0.054202010231230 31.0 501.3 0.26 0.27 0.00 0.21 0.054202010231312 30.9 501.5 0.26 0.16 0.00 0.84 0.054202010231354 30.5 509.6 0.26 0.14 0.00 0.59 0.055202010270915 31.0 498.5 0.33 0.18 0.00 0.12 0.054202010270957 30.5 509.9 0.34 0.16 0.00 0.42 0.055202010271039 30.8 507.2 0.33 0.17 0.00 0.00 0.054
202010221258 30.8 501.0 0.25 0.29 0.00 0.47 0.054202010221340 30.5 509.8 0.26 0.17 0.00 0.00 0.055202010221422 30.5 506.5 0.26 0.16 0.00 0.75 0.054202010221502 30.5 509.2 0.26 0.16 0.00 0.53 0.054202010260920 30.5 505.2 0.33 0.17 0.00 0.07 0.054202010261002 30.7 500.7 0.33 0.16 0.00 0.09 0.054202010261044 30.9 497.5 0.33 0.15 0.00 0.00 0.053202010281342 30.9 500.5 0.31 0.28 0.00 0.20 0.054202010281424 30.4 511.7 0.32 0.18 0.00 0.00 0.055202010281548 30.4 510.2 0.30 0.27 0.00 0.00 0.055202010281506 31.1 500.2 0.31 0.17 0.00 0.00 0.053
R50/B50
CARB ULSD
R100
R65/B35

G-4
Appendix G-4: Detailed On-Road NTDE Emissions Test Results (RMC Cycle)

G-5
Appendix G-5: Detailed Off-Road NTDE Emissions Test Results (NRTC Cycle)

G-6
Appendix G-6: Detailed Off-Road NTDE Emissions Test Results (C1 Cycle)