low interest rates: king midas’ golden touch? kristin forbes external mpc member bank of england...
TRANSCRIPT

Low Interest Rates: King Midas’ Golden Touch?
Kristin Forbes
External MPC Member
Bank of England
Institute of Economic Affairs, London
24 February 2015

King Midas’ Golden Touch
The UK Economy Today
• UK recovery well in progress and self-sustaining– Still substantial challenges & scars from recession– But economy largely normalizing after severe & protracted crisis
• One exception: interest rates– Near-zero rates key part of crisis response & early stages of
recovery– Near-zero rates provide a number of benefits
• But there are also costs and risks
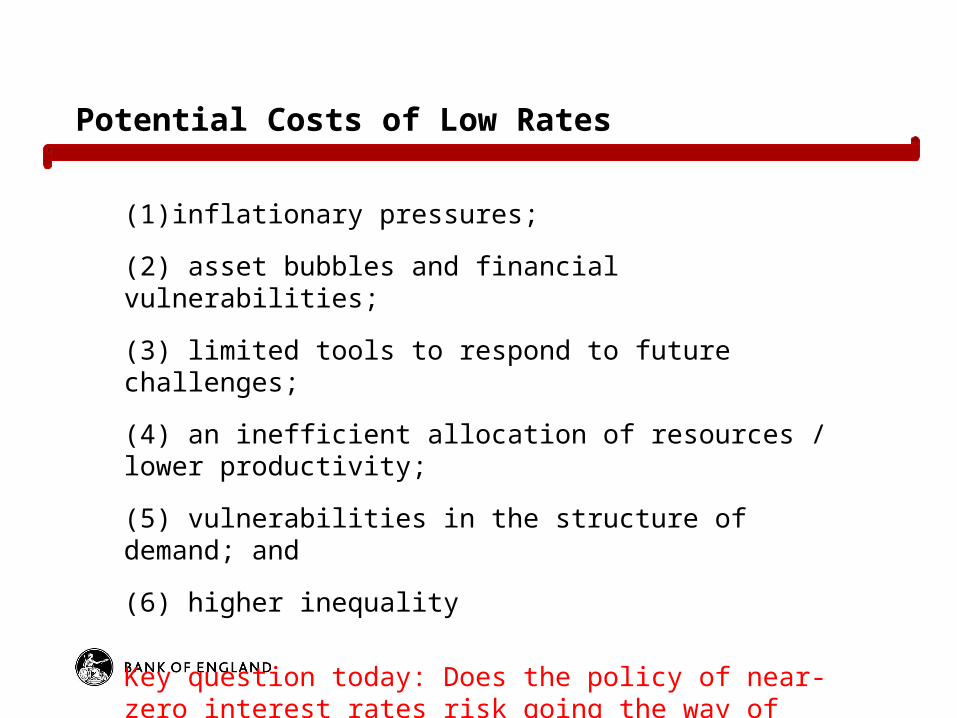
Potential Costs of Low Rates
(1) inflationary pressures;
(2) asset bubbles and financial vulnerabilities;
(3) limited tools to respond to future challenges;
(4) an inefficient allocation of resources / lower productivity;
(5) vulnerabilities in the structure of demand; and
(6) higher inequality
Key question today: Does the policy of near-zero interest rates risk going the way of Midas’ golden touch?

Risk 1: Inflationary Pressures
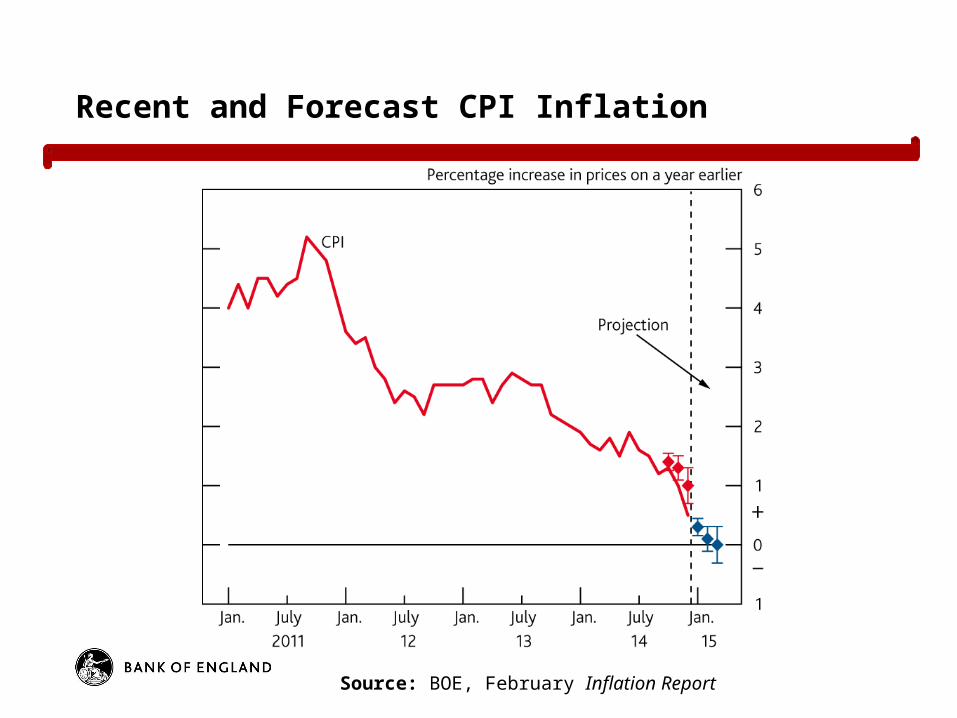
Recent and Forecast CPI Inflation
Source: BOE, February Inflation Report
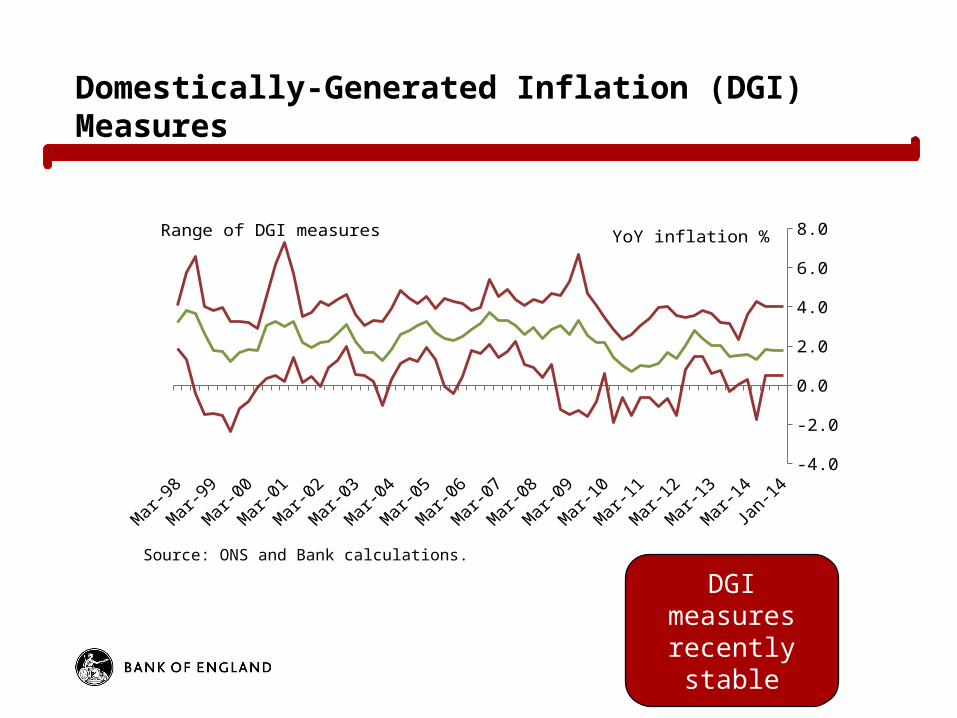
Domestically-Generated Inflation (DGI) Measures
Source: ONS and Bank calculations.
1998 2001 2004 2007 2010 2013-4.0
-2.0
0.0
2.0
4.0
6.0
8.0YoY inflation %Range of DGI measures
DGI measures recently stable

Inflation: Looking Forward
• Low headline inflation and stable DGI unlikely to persist• Output gap closing• Wage inflation picking up• But pressures should build slowly
• Risks that inflation could pick up faster• See Jan. speech, “Risks Around the Forecast• Also risks that inflation picks up more slowly
• Bottom line: current policy does not yet appear to be generating incipient inflationary pressures that could not be addressed in a timely fashion as needed

Risk 2: Asset Bubbles & Financial Instability
Risks to Financial Stability
• Various risks:• “Search for yield” • Bubbles• Increased risk by banks• Increased debt issuance by companies• Long academic literature on risks (see speech text)
• Financial Policy Committee (FPC): 1st line of defence
• Will the tools of the FPC be enough in the future? • Risks magnified over time & by lower rates in other
economies•
• May be role for monetary policy to “get in the cracks” in the future, albeit not today

Risk 3: Limited Monetary Policy Tools in the Future
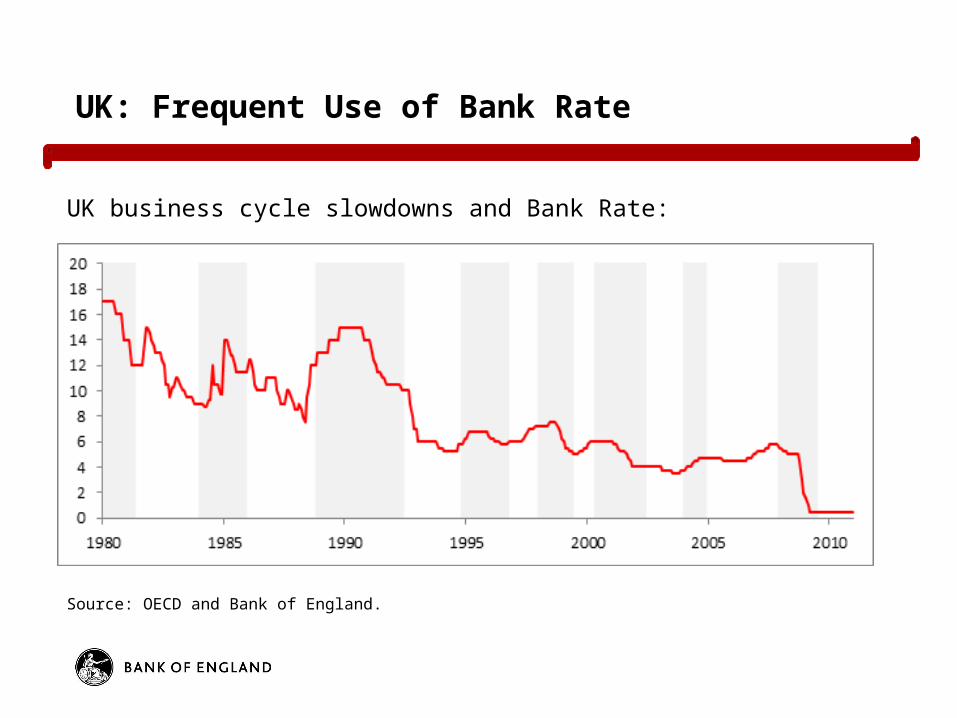
UK: Frequent Use of Bank Rate
Source: OECD and Bank of England.
UK business cycle slowdowns and Bank Rate:

UK: Bank Rate Adjustments During Slowdowns
Source: OECD and Bank of England.
Business cycle
slowdowns:
Dates of
easing cycle:
Months of
easing:
Fall in Bank rate over
easing cycle:
Jan 1980 - April 1981 Jul 1980 - Mar 1981 9 5.00pp
Jan 1984 - Nov 1985 Mar 1985 - May 1986 15 4.00pp
Nov 1988 - May 1992 Oct 1990 - Feb 1994 41 9.75pp
Nov 1994 - Sep 1996 Dec 1995 - Jun 1996 7 1.00pp
Jan 1998 - April 1999 Oct 1998 - Jun 1999 9 2.50pp
May 2000 - May 2002 Feb 2001 - Jul 2003 30 2.50pp
Jan 2004 - Nov 2004 None 0 0.00pp
Dec 2007 - Jun 2009 Dec 2007 - Mar 2009 16 5.25pp
Average: 16 3.75pp
Risk 4: Inefficient Allocation of Resources / Lower Productivity

Zombies
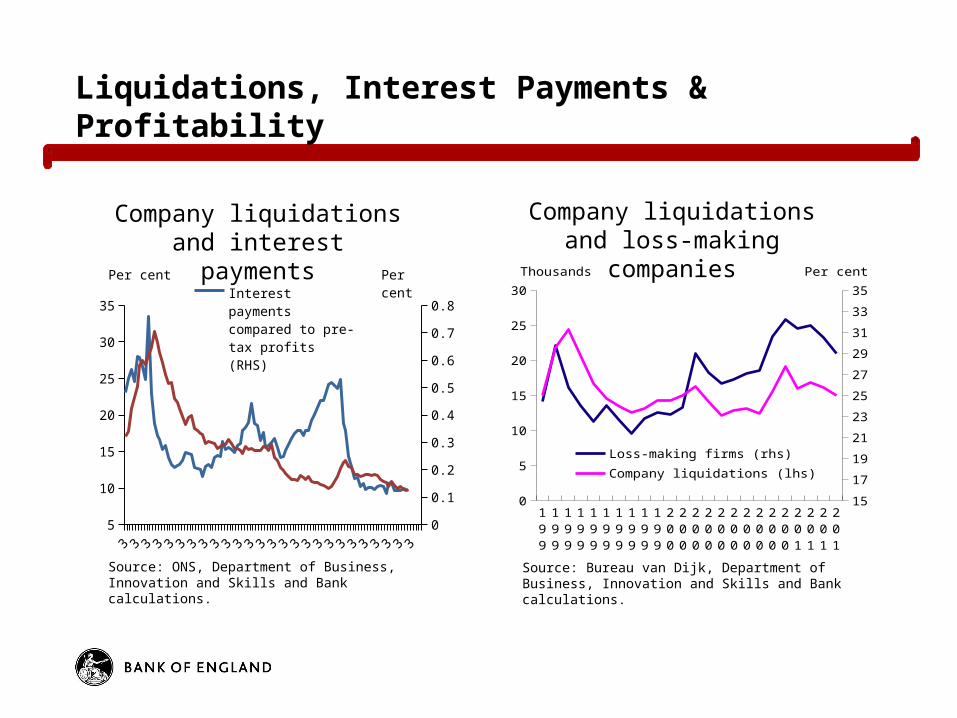
Liquidations, Interest Payments & Profitability
Source: ONS, Department of Business, Innovation and Skills and Bank calculations.
Company liquidations and interest payments
Company liquidations and loss-making companies
Source: Bureau van Dijk, Department of Business, Innovation and Skills and Bank calculations.
1990 1994 1998 2002 2006 2010 20145
10
15
20
25
30
35
0
0.1
0.2
0.3
0.4
0.5
0.6
0.7
0.8
Interest payments compared to pre-tax profits (RHS)
Liquidations as a percentage of active companies (LHS)
Per cent Per cent
1990
1991
1992
1993
1994
1995
1996
1997
1998
1999
2000
2001
2002
2003
2004
2005
2006
2007
2008
2009
2010
2011
2012
2013
15
17
19
21
23
25
27
29
31
33
35
0
5
10
15
20
25
30
Loss-making firms (rhs)
Company liquidations (lhs)
Per centThousands
Risk 5: Increased Vulnerabilities in the Structure of Demand

Consumption Growth and Savings Rates
Source: ONS and Bank calculations.
Consumption annual growth Savings ratio
19
98
Q1
19
99
Q2
20
00
Q3
20
01
Q4
20
03
Q1
20
04
Q2
20
05
Q3
20
06
Q4
20
08
Q1
20
09
Q2
20
10
Q3
20
11
Q4
20
13
Q1
20
14
Q2
-6-4-202468
Percentage change on a year earlier
19
98
Q1
19
99
Q2
20
00
Q3
20
01
Q4
20
03
Q1
20
04
Q2
20
05
Q3
20
06
Q4
20
08
Q1
20
09
Q2
20
10
Q3
20
11
Q4
20
13
Q1
20
14
Q2
0
2
4
6
8
10
12
14
Per cent

Household Balance Sheets
Household debt to income and deposits to income ratios
Distribution of mortgage debt to income ratios
1987 1992 1997 2002 2007 201250
60
70
80
90
100
110
120
130
140
150
Per cent
Debt to income(b)
Deposits to income(c)
Source: ONS and Bank calculations.

UK Current Account and Trade Balance
Source: ONS and Bank calculations.
1998 2000 2002 2004 2006 2008 2010 2012 2014-30000
-25000
-20000
-15000
-10000
-5000
0
5000Current account balance Goods and services
£ billion
Risk 6: Inequality
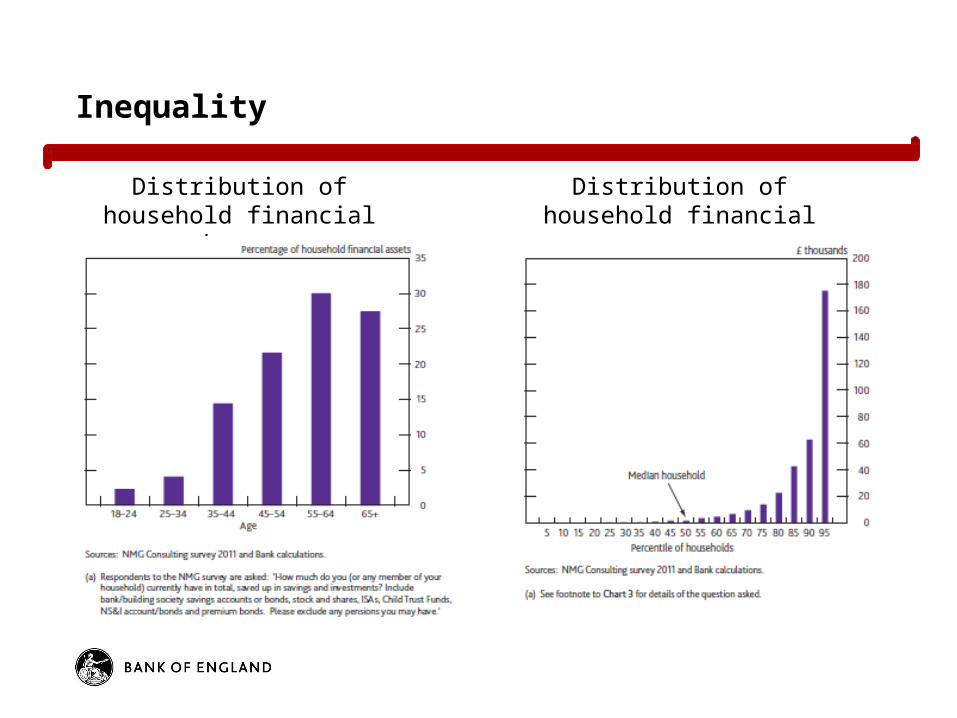
Inequality
Distribution of household financial assets by age group
Distribution of household financial assets
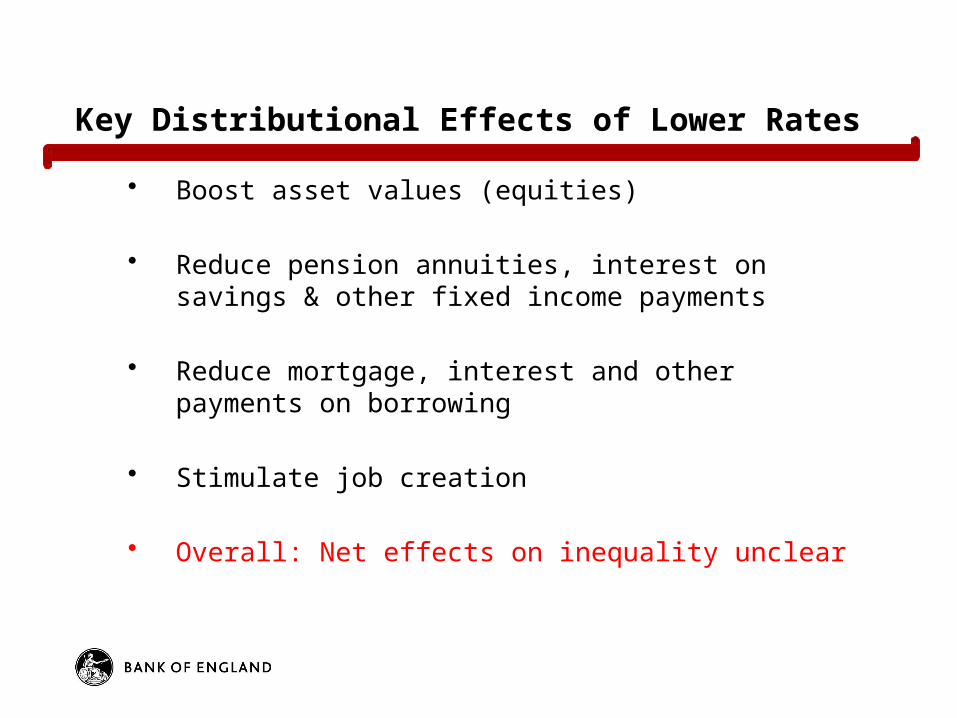
Key Distributional Effects of Lower Rates
• Boost asset values (equities)
• Reduce pension annuities, interest on savings & other fixed income payments
• Reduce mortgage, interest and other payments on borrowing
• Stimulate job creation
• Overall: Net effects on inequality unclear
Conclusions
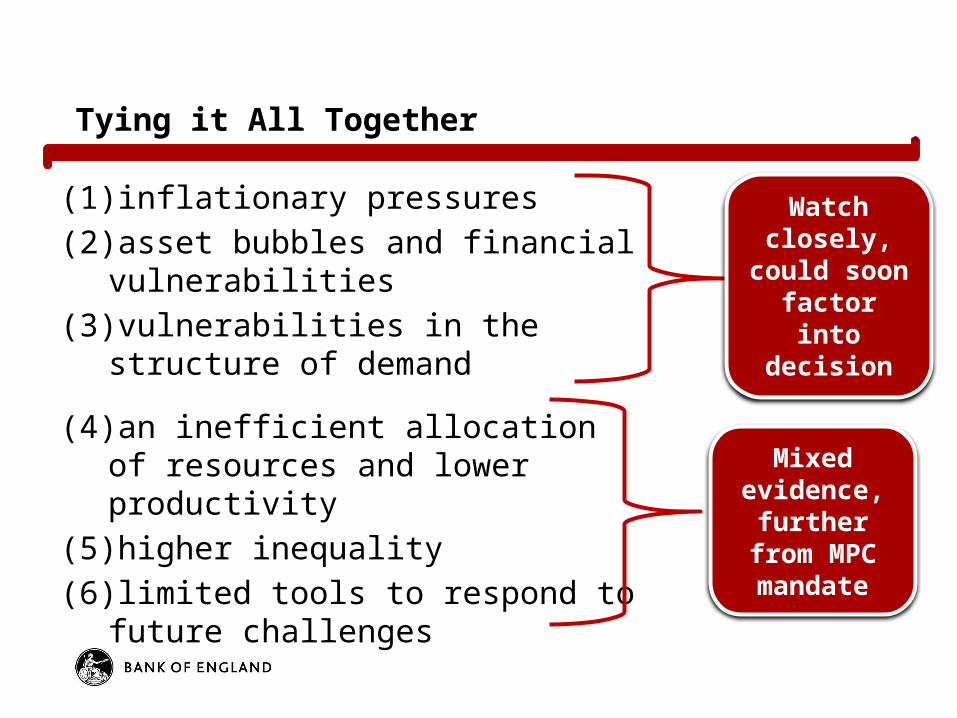
Tying it All Together
(1) inflationary pressures
(2) asset bubbles and financial vulnerabilities
(3) vulnerabilities in the structure of demand
(4) an inefficient allocation of resources and lower productivity
(5) higher inequality
(6) limited tools to respond to future challenges
Mixed evidence,
further from MPC
mandate
Watch closely,
could soon factor into decision
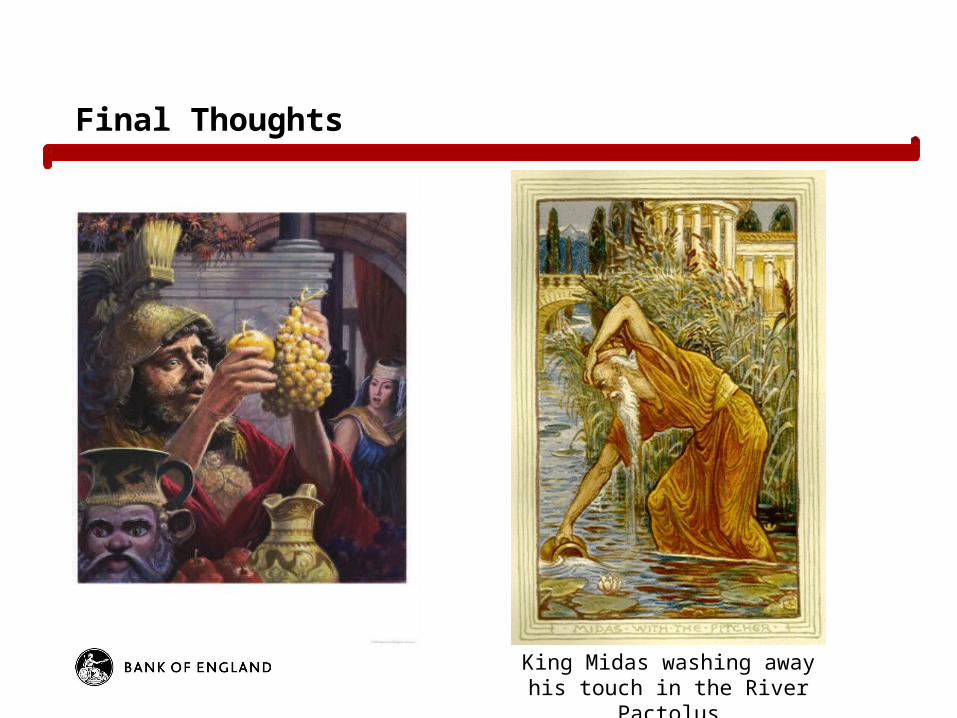
Final Thoughts
King Midas washing away his touch in the River Pactolus