low-level detection of a bacillus anthracis simulant using...
TRANSCRIPT
SANDIA REPORT
SAND2003-0695 Unlimited Release Printed March 2003 Low-Level Detection of a Bacillus Anthracis Simulant Using Love-Wave Biosensors on 36° YX LiTaOз
Darren W. Branch and Susan Brozik
Prepared by Sandia National Laboratories Albuquerque, New Mexico 87185 and Livermore, California 94550 Sandia is a multiprogram laboratory operated by Sandia Corporation, a Lockheed Martin Company, for the United States Department of Energy’s National Nuclear Security Administration under Contract DE-AC04-94AL85000. Approved for public release; further dissemination unlimited.
Issued by Sandia National Laboratories, operated for the United States Department of Energy by Sandia Corporation.
NOTICE: This report was prepared as an account of work sponsored by an agency of the United States Government. Neither the United States Government, nor any agency thereof, nor any of their employees, nor any of their contractors, subcontractors, or their employees, make any warranty, express or implied, or assume any legal liability or responsibility for the accuracy, completeness, or usefulness of any information, apparatus, product, or process disclosed, or represent that its use would not infringe privately owned rights. Reference herein to any specific commercial product, process, or service by trade name, trademark, manufacturer, or otherwise, does not necessarily constitute or imply its endorsement, recommendation, or favoring by the United States Government, any agency thereof, or any of their contractors or subcontractors. The views and opinions expressed herein do not necessarily state or reflect those of the United States Government, any agency thereof, or any of their contractors. Printed in the United States of America. This report has been reproduced directly from the best available copy. Available to DOE and DOE contractors from
U.S. Department of Energy Office of Scientific and Technical Information P.O. Box 62 Oak Ridge, TN 37831 Telephone: (865)576-8401 Facsimile: (865)576-5728 E-Mail: [email protected] Online ordering: http://www.doe.gov/bridge
Available to the public from
U.S. Department of Commerce National Technical Information Service 5285 Port Royal Rd Springfield, VA 22161 Telephone: (800)553-6847 Facsimile: (703)605-6900 E-Mail: [email protected] Online order: http://www.ntis.gov/help/ordermethods.asp?loc=7-4-0#online
2
3
SAND2003-0695 Unlimited Release
Printed March 2003
Low-Level Detection of a Bacillus Anthracis Simulant using Love-
Wave Biosensors on 36° YX LiTaO3
Darren W. Branch and Susan M. Brozik
Microsensor Science and Technology Department Sandia National Laboratories
PO Box 5800, MS-0892 Albuquerque NM 87185-0892
ABSTRACT
Crucial to low-level detection of biowarfare agents in aqueous environments is the mass
sensitivity optimization of Love-wave acoustic sensors. The present work is an experimental
study of 36°YX cut LiTaO3 based Love-wave devices for detection of pathogenic spores in
aqueous conditions. Given that the detection limit (DL) of Love-wave based sensors is a strong
function of the overlying waveguide, two waveguide materials have been investigated, which are
polyimide and polystyrene. To determine the mass sensitivity of Love-wave sensor, bovine
serum albumin (BSA) protein was injected into the Love-wave test cell while recording
magnitude and phase shift across each sensor. Polyimide had the lowest mass detection limit
with an estimated value of 1-2 ng/cm2, as compared to polystyrene where DL = 2.0 ng/cm2.
Suitable chemistries were used to orient antibodies on the Love-wave sensor using adsorbed
protein G. The thickness of each biofilm was measured using ellipsometry from which the
surface concentrations were calculated. The monoclonal antibody BD8 with a high degree of
selectivity for anthrax spores was used to capture the non-pathogenic simulant B. thuringiensis
B8 spores. Bacillus Subtilis spores were used as a negative control to determine whether
significant non-specific binding would occur. Spore aliquots were prepared using an optical
counting method, which permitted removal of background particles for consistent sample

4
preparation. This work demonstrates that Love-wave devices can be used to detect B. anthracis
simulant below reported infectious levels.
5
1. INTRODUCTION
Surface acoustic wave (SAW) sensors have been routinely applied in the fields of
chemical and biological sensing. In these devices an acoustic wave is launched from an
interdigital transducer (IDT) on the piezoelectric substrate either as a surface acoustic wave
(SAW) or a bulk acoustic wave (BAW). The device may operate as a resonator or delay line,
responding to any shift in mechanical and electrical properties of the contacting media. When
the device is configured as a delay line, the detection is through changes in velocity. Given that
the acoustic energy is confined near a thin surface region of the substrate, SAWs are highly
sensitive to surface perturbation of the propagating medium. The boundary conditions at the
solid or liquid interface alter the wave amplitude and velocity, allowing Love-wave device to
operate as mass or viscosity sensor. For this reason, SAWs are suitable for detecting changes in
surface mass and viscosity.
For sensing in liquid environments, however, there is a strong radiation loss for
longitudinal bulk modes such as Rayleigh surface waves and most Lamb-wave modes [1].
Surface waves with displacements normal to the surface generate compressional waves, which
dissipate wave energy in the liquid. For this reason, acoustic waves that have the particle
displacement parallel to the device surface and normal to the wave propagation direction are
essential. These waves, referred to as shear-horizontal (SH) waves, will propagate without
coupling acoustic energy into the liquid. SH type acoustic waves include thickness shear modes
(TSM), acoustic plate modes (APM), surface skimming bulk waves (STW), Love-waves, leaky
surface acoustic waves (LSAW), and Bleustein-Gulyaev (BG) waves [2]. In particular, Love-
waves are SH waves propagating in a thin guiding layer on SH-SAW devices. Of significance, is
that these waves are dispersive (i.e. frequency dependent) and exist provided that the shear
velocity in the thin guiding layer is less than the shear velocity in the substrate. Love-wave
devices have been used for both mass [3-5] and viscosity detection [1, 6]. Although SH waves
show no interaction with ideal liquids, there is interaction with viscous liquids. If we assume a
nonslip boundary condition at the sensing surface, a thin layer of liquid becomes entrained with a
6
shear movement at the surface for viscous liquids. This viscous loading affects the Love-wave in
two ways. First, the entrainment results in mass loading of the waveguiding layer, causing a
change in the wavenumber. Second, the wave becomes damped due to the viscous losses in the
liquid. This effect can be observed at high frequencies, where liquid shows elastic behavior due
to molecule relaxation and is represented by an imaginary term in viscosity.
Aqueous effects can also perturb the Love-wave sensor through permittivity changes.
The permittivity and dielectric losses influence the propagating Love mode and characteristics of
the IDTs. The former effect is small since the electric fields accompanied by the acoustic wave
are concentrated in the substrate and shielded by the non-piezoelectric waveguiding layer. The
latter effect indicates that liquids with high permittivity lead to changes in IDT input admittance
even at low viscosities. This can be minimized through application of a thin dielectric layer,
which serves to shield the sensor from electrical perturbation. Given that Love-waves are SH
waves confined in a thin guiding layer, provided that the shear velocity in the deposited layer is
less than the shear velocity in the substrate, proper selection of the waveguide material is crucial.
The waveguide is the most significant structure for proper Love mode operation as a mass
sensor. When properly optimized, the acoustic energy is maximal in the waveguide, with
minimal loss to the substrate. To eliminate aqueous effects, the waveguiding layer can be
metallically shielded or a wet-cell can be used to prevent electrical loading of the IDTs [7]. We
have chosen to implement a wet-cell in which liquid flows between the IDTs, thereby
minimizing electrical perturbation from liquid permittivity.
To date, Love-wave sensors have been applied where the antigens have low molecular
weight such that their diffusion time is on the order of a few seconds. For whole-cell detection
the particle sizes can range from fractions to several microns in diameter. In this regime, the
diffusion time to capture larger particles (0.5 – 2 µm) is substantially longer, potentially
requiring tens of minutes to capture using a similar flow cell for low molecular weight capture.
Moreover, larger particles can settle due to gravimetric settling, an effect that may result in non-
specific binding to the Love-wave sensor. Despite these difficulties, whole-cell detection has
7
several distinct advantages: 1) there is minimal need for additional sample purification; 2) the
specific antigen site does not have to be known as long as antibodies are available; 3) less time is
required to process and purify samples before detection; and 4) overall the system would be
more portable for field use.
In this study, we address the sensitivity and optimization of a Love-wave sensor for the
detection of spores in liquid, with a background of protein and non-specific spores to determine
specificity of the sensor. Our strategy consisted of screening polyimide and polystyrene as
possible waveguides on 36º YX LiTaO3. An ideal waveguiding layer would have the following
properties: 1) low shear velocity compared to the substrate; 2) low density; 3) low acoustic loss
at the respective operating frequency [8]; 4) chemical stability in aqueous environments; and
finally 5) permit bioconjugation of antibodies or receptors. First, we measured insertion loss (IL)
before and after application of the waveguiding polymer to assess the acoustic trapping
efficiency of the polymers. Second, the polymers with a thickness that showed a decrease in IL
were tested using protein to determine the mass detection limit. Finally, the devices were used to
detect spores in a flow stream. The final aspect of the design was to minimize the flow volume,
which greatly reduces the diffusion times for large particles.
2. MATERIALS AND METHODS
It is well known that the leaky surface acoustic wave (LSAW) on YX LiTaO3 reduces to
a shear horizontal (SH) wave at a rotation angle of about 36º [2] as shown in figure 1. The 36º
YX LiTaO3 have been used extensively for their low insertion loss, very large electromechanical
coupling factor K2, and low propagation loss. Using these SH wave devices, Love modes will
propagate within a thin guiding layer provided that the shear velocity in the deposited layer is
less than the shear velocity in the substrate.
2.1 Fabrication of SH-SAW devices on 36° YX LiTaO3 Wafers
Single-side polished 36° YX LiTaO3 (Sawyer Research Products, Inc., Eastlake, OH)
wafers were initially cleaned by rinsing with acetone, methanol, isopropanol, and 18 MΩ cm
8
water, respectively then dried with N2. Prior to the photolithographic process, the wafers were
baked at 110º for 90 seconds. A lift-off procedure was used to define the interdigital transducers
(IDTs) for each delay line. A positive photoresist AZ 9245 (Hoechst Celanese, Corp.,
Branchburg, NJ) was applied to the LiTaO3 wafers using a PWM32 photoresist spinner
(Headway Research, Inc., Garland, TX) at 4000 rpm for 30 seconds. The wafers were then
baked at 110°C for 120 seconds and then rinsed in 18 MΩ cm water to minimize electrostatic
charge on the wafer from the photoresist baking process. Next, the wafers were exposed for 17
seconds to a UV lamp (intensity of 11 µW/cm2 at 320 nm) from a Karl Suss MA6 mask aligner.
All photoresist-coated wafers were developed for 3 minutes in AZ 300 MIF developer (Hoechst
Celanese, Corp., Branchburg, NJ). Residual photoresist was removed from the newly exposed
LiTaO3 regions by placing the wafers in a PDS/PDE 301 planar plasma etcher (LFE Corp.,
Clinton, MA), which had an O2 pressure of 500 mTorr and RF power of 5 watts for 5 minutes.
To promote adhesion, a 100 Å titanium (Ti) binding layer was evaporated on the LiTaO3 wafers
using an e-beam evaporator (CVC Products, Inc.). An 800 Å gold layer was then deposited on
the Ti film by resistive evaporation. To perform the lift-off procedure, the wafer was soaked and
sprayed with acetone until the patterned developed. After lift-off, the wafer was cleaned with
acetone, methanol, isopropanol, and 18 MΩ cm water, and then dried with N2. Residual
photoresist was removed using a PDS/PDE 301 planar plasma etcher (LFE Corp., Clinton, MA),
which had an O2 pressure of 500 mTorr and RF power of 5 watts for 5 minutes.
2.1.1 LiTaO3 Wafer Dicing
To protect the IDT patterns during dicing, AZ4110 photoresist was applied to the wafer
and baked at 90ºC for 90 seconds. Prior to dicing, the fine-ground side of the wafer was
mounted on blue medium tack (Semiconductor Equipment Corp., Mesa, AZ). The wafers were
then diced with a 1.8 mm width wheel, using a feed rate of 0.2mm s-1, and a spindle speed of
12,000 rpm.
2.1.2 SH-SAW IDT and Lithographic Geometry
9
A split double interdigital electrode configuration (figure 1) was patterned onto the
LiTaO3 wafers. This pattern was duplicated to create both sensor and reference delay lines. The
spacing between the delay lines was 130λ, which minimized acoustic cross talk. The IDTs
consisted of 56 finger pairs with an aperture of 38λ and a metallization ratio of η = 0.5. The IDT
center-to-center separation was 220λ. These devices supported SH waves with center
frequencies at 103 MHz and an insertion loss of -8 dB.
2.2 Contact Angle Measurements
To assess the substrate and film properties, the static water contact angle was measured
as the angle from the tangent to the horizontal of 5 µl sessile drops of 18 MΩ cm water on the
device surface, using a locally constructed goniometer.
2.3 Waveguide Application
The diced SH-SAW devices were initially cleaned by rinsing with acetone, methanol,
isopropanol, and 18 MΩ cm water, respectively then dried with N2. Prior to waveguide
deposition, the devices were cleaned in a T10X10/OES UV/Ozone cleaner (UVOCS Inc.,
Montgomeryville, PA) for 15 minutes. The UV/Ozone process removed residual organic
contamination, which was confirmed by water contact angle measurements. Polyimide 2613
(HD Microsystems Ltd., Santa Clara, CA) and polystyrene (Scientific Polymer Products, Inc.,
Ontario, NY) dissolved in 2-ethoxy ethyl acetate (Aldrich Chemical Co., St. Louis, MO) were
immediately spun onto LiTaO3 substrates to yield a thickness range of 0.2 to 2.5 µm. The
polyimide films were cured on a #03404-38 hotplate (Cole-Parmer Instrument Co., Vernon Hills,
IL) at 225ºC for 4 hours, whereas polystyrene coated substrates were baked at 120ºC for 1 hour.
2.3.1 Waveguide Evaluation
To evaluate the mass sensitivity of the Love-wave devices, a series of BSA injections
was performed on polyimide and polystyrene coated devices. This permitted rapid analysis and
screening of waveguide materials. The approach was to inject an amount of BSA that would not
saturate the waveguide surface and therefore permit determination of mass loading sensitivity.
For BSA, the molecular weight (MW) and density are 66,000 g mol-1 and 1.37 g cm-3,
10
respectively. Assuming a spherical shape, we calculate a radius of 26.7 Å and a cross-sectional
area of one BSA protein as 2.2E-13 cm2. Inverting this number we have 4.45E12 BSA protein
per cm2. If we choose the BSA injection amount to be 50 ng with a total capture area of 0.431
cm2, then we have at most 24% coverage. Therefore, injecting 50 ng of BSA will not saturate
the waveguide surface and give a reasonably accurate measure of sensitivity due to mass loading.
2.3.2 Waveguide Measurements
Waveguide thickness was evaluated using a Dektak 3030 surface profilometer (Veeco
Instruments, Inc., Woodbury, NY). In addition to thickness measurements, the 36° YX LiTaO3
waveguide coated substrates were evaluated using an 8752C network analyzer (Hewlett-Packard
Co., Rockvelle, MD). The self-capacitance of the IDTs was measured using an SI1260 Solatron
gain-phase analyzer and 1296 dielectric interface (Solartron Inc., Farnborough, Hampshire, UK).
2.4 Waveguide Preparation
The polymer waveguides were dried with N2 in preparation for antibody attachment.
Prior to antibody attachment, 0.5 mg/ml of protein G (Sigma Chemical Co., St. Louis, MO) in 20
mM potassium phosphate buffer (PBS) pH 7.4 was allowed to adsorb for 1 hr on the waveguides.
After adsorption, the waveguides were thoroughly rinsed in 20 mM PBS pH 7.4 to remove
unbound protein G. Antibodies that were raised against live Bacillus anthracis (B. anthracis)
were provided by the University of Alabama at Birmingham, AL. The antibody BD8 was
chosen for optimal avidity and specificity toward B8 B. Thuringiensis spores as provided. To
activate the sensor side of the Love-wave device, 1 mg/ml BD8 antibodies in 20 mM PBS buffer
pH 7.4 were adsorbed for 2 hours. Simultaneously, 5 mg/ml of bovine serum albumin (BSA) in
20 mM PBS buffer pH 7.4 was adsorbed to the reference side for 2 hours. After adsorption,
devices were rinsed thoroughly in 18 MΩ cm water to remove unbound BSA and antibody.
2.5 B8 Bacillus Thuringiensis Preparation
To determine the specificity and detection level of the Love-wave device to an anthracis
simulant, B8 Bacillus Thuringiensis (B8) spores were prepared at concentration of 100 to
100,000 spores/ml. B8 spores were provided (University of Alabama at Birmingham,
11
Birmingham, AL) as a stock solution at ∼109 spores/ml in 18 MΩ cm water then serially diluted.
As a negative control, Bacillus Subtilis (B. Subtilis) spores were obtained at a stock concentration
of ∼1010 spores/ml in 18 MΩ cm water (University of Alabama at Birmingham, Birmingham,
AL). To minimize germination and bacterial growth the spores were stored at 4°C and
centrifuged weekly to replace the 18 MΩ cm water. Spore aliquots were prepared in 18 MΩ cm
water and measured using an LS-200 optical particle counter with a SO5 Liquilaz 0.5 to 20 µm
detector (Particle Measuring Systems, Inc., Boulder, CO). The optical particle counter was used
to measure the total concentration of the 1 ml serial diluted spore aliquots. Blank spore aliquots
were also prepared as 1 ml of 18 MΩ cm water. The blank aliquots were also counted to permit
subtraction of background particles in the spore aliquots.
2.6 Experimental Setup
Love-wave devices were configured to operate in a delay line configuration, where the
phase shift of each delay line was recorded. The temperature of the Love-wave device was also
recorded to determine the effect of the injected aliquots. The operating frequency was adjusted
to minimize insertion loss (IL), and phase shift was recorded at this initial frequency.
2.6.1 Love-wave Fixture and Flow-Injection System
Love-wave devices were mounted within a three-part brass fixture. The bottom brass
piece supported the Love-wave device in a recessed cavity, and served to control the temperature
using a Neslab RTE-111 water bath (Neslab Instruments Inc., Newington, NH). The operating
temperature was set to 23°C. The temperature of the device was monitored using a
S665PDY40A RTD (Minco, Minneapolis, MN), having a resolution of ±0.01°C. The middle
brass piece was fabricated with ten pogo pins, which would contact the Love-wave device
electrical ports. Four of the ten pins were grounded. Two additional grounded pogo pins on
opposite sides connected the two large electrodes of the Love-wave device. The upper lexan
piece contained a recessed region for a viton gasket (Sealjet Inc., Elgin, SC) and had two 1/16”
male flangeless fluidic connectors to permit flow across the Love-wave device. The lid height
was 45 µm with an area of 1.44 cm2 gave a volume of about 6 µl after compression of the viton
12
gasket. To permit flow across the Love-wave devices and allow for injection of spore aliquots
and blanks, we used the FIAlab 3500 flow-injection system (FIAlab Instruments, Seattle, WA).
A constant flow of 2.5 µl sec-1 was established using the FIAlab peristaltic pump, where a
syringe would apply the injection after signal baseline was reached.
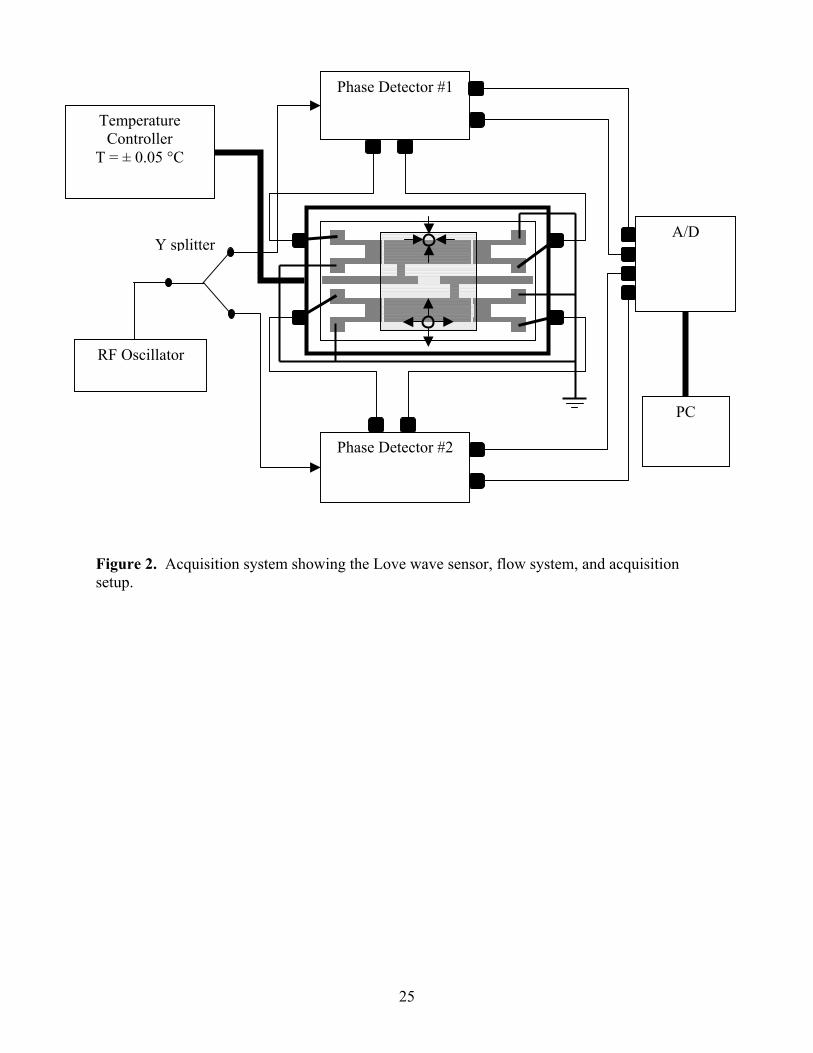
2.6.2 Acquisition Setup
Measurements were obtained using a pair of IQ demodulators, which measured the
amplitude and phase shift difference between the reference oscillator and the sensor output. An
8656B RF signal generator (0.1 – 990MHz) was set at a frequency between 102-103 MHz and an
amplitude of 0 dBm. A 50Ω Y-power splitter was used to provide two inputs to the phase
detectors. The outputs of the phase detectors were digitized using a 12bit Agilent 34901A
multiplexer acquisition board (Agilent Technologies Inc., Palo Alto, CA) controlled by a PC. A
VEE program was written to actively process the data, which displayed temperature of the phase
detector board, phase shifts of delay lines, and the difference signal of the sensor and reference
as a function of time. The complete acquisition setup is shown in figure 2.
2.7 Love-wave Sensitivity and Mass Detection Limit
The mass sensitivity of Love-wave sensors is intrinsic to the device for a given
waveguide. Theoretically speaking, the sensitivity for a given Love-wave device can be
computed independent from the noise level of the acquisition equipment. In fact, perturbation
methods have been used to compute the sensitivity of planar multiplayer acoustic sensors [9]. In
this way, we must be careful to distinguish between the detection limit (Dl) and mass sensitivity
(Sm) and the sensor. It is common to compute the sensitivity of the Love-wave sensor for
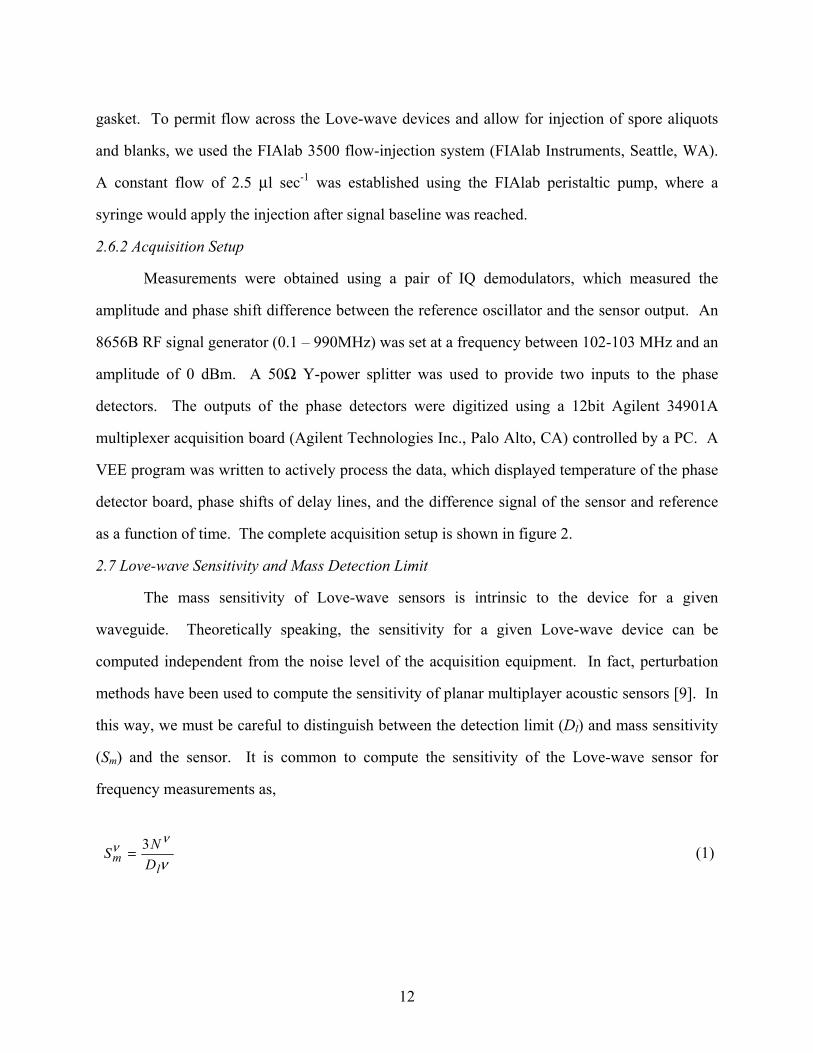
frequency measurements as,
(1)
3m
l
NSD
νν
ν=

13
where, Nν is the noise level, Dl is the detection limit, and ν is the operating frequency. The
factor of three is the level of the signal above the noise. However, to compute the sensitivity of
the Love-wave sensor for phase measurements, we used the following relationship,
(2)
where, ν is the operating frequency and φ is the phase at the operating frequency. In this way,
we can define the mass sensitivity for phase measurements as,
(3)
where, Nφ is the noise level, Dl is the detection limit, and φ is phase.
2.8 Statistics
For water contact angle measurements, we report the average and standard deviations
from six independent measurements taken at different locations on the film surface immediately
after formation of the sessile drops. Film thicknesses from ellipsometry were computed from the
average of six independent measurements taken at different locations on the film surface. 3. RESULTS
3.1 Waveguide Evaluation
The quality of the waveguide surfaces was initially evaluated using a surface
profilometer. Surface scans that were made indicated that the waveguides were uniform over
the delay line regions. Water contact angles revealed that the polyimide and polystyrene
waveguide surfaces were extremely hydrophobic, having a static water contact angle of 83.8 ±
4.7° (n = 8). This indicated that without further surface modification these polymer surfaces
would have a strong propensity to bind protein.
3m
l
NSD
φφ
φ=
ν φν φ∆ ∆≈
14
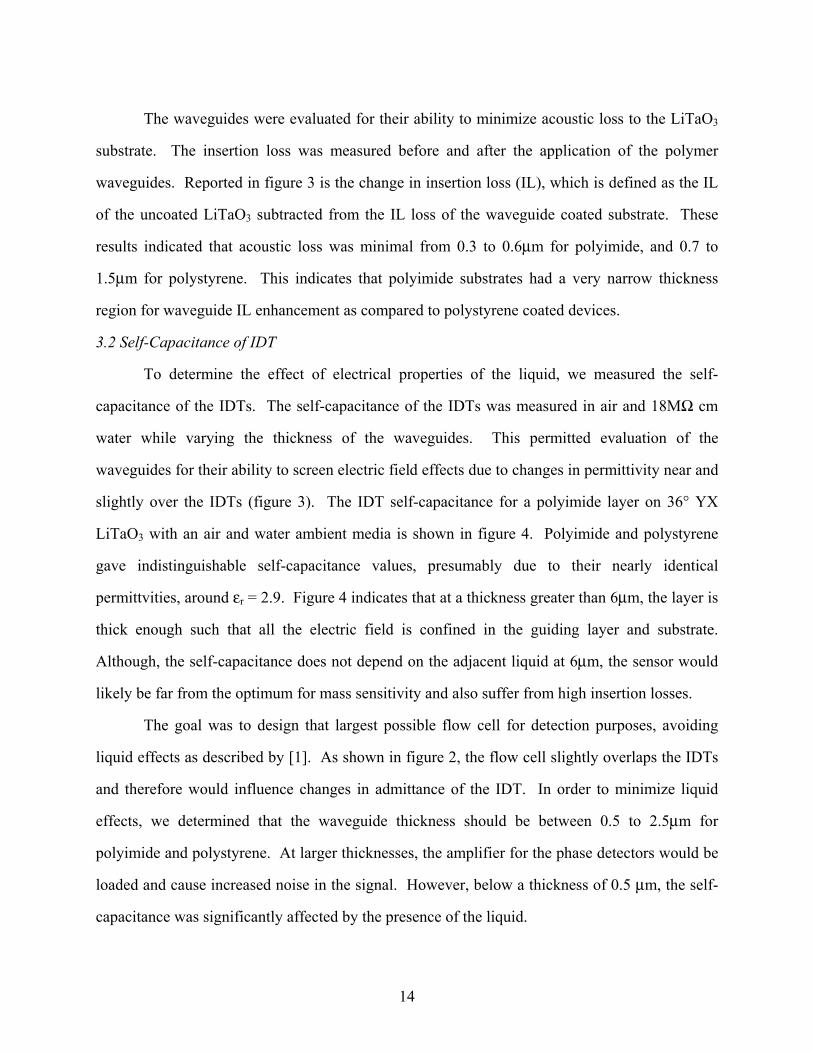
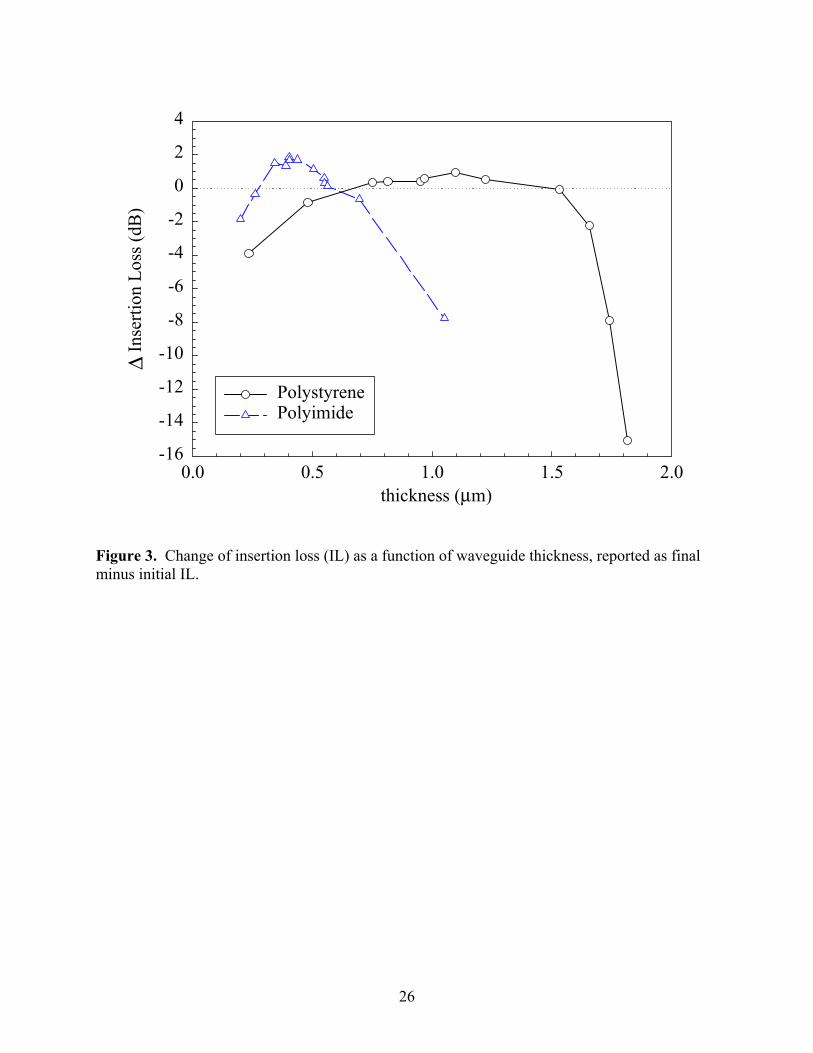
The waveguides were evaluated for their ability to minimize acoustic loss to the LiTaO3
substrate. The insertion loss was measured before and after the application of the polymer
waveguides. Reported in figure 3 is the change in insertion loss (IL), which is defined as the IL
of the uncoated LiTaO3 subtracted from the IL loss of the waveguide coated substrate. These
results indicated that acoustic loss was minimal from 0.3 to 0.6µm for polyimide, and 0.7 to
1.5µm for polystyrene. This indicates that polyimide substrates had a very narrow thickness
region for waveguide IL enhancement as compared to polystyrene coated devices.
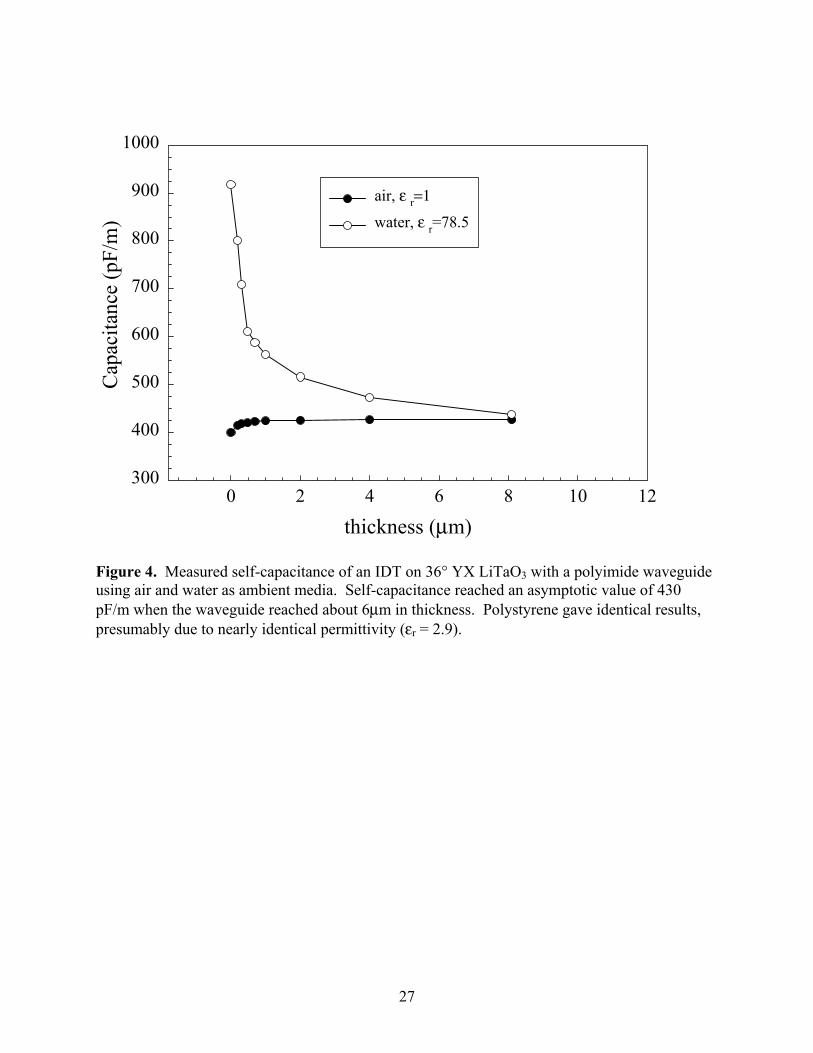
3.2 Self-Capacitance of IDT
To determine the effect of electrical properties of the liquid, we measured the self-
capacitance of the IDTs. The self-capacitance of the IDTs was measured in air and 18MΩ cm
water while varying the thickness of the waveguides. This permitted evaluation of the
waveguides for their ability to screen electric field effects due to changes in permittivity near and
slightly over the IDTs (figure 3). The IDT self-capacitance for a polyimide layer on 36° YX
LiTaO3 with an air and water ambient media is shown in figure 4. Polyimide and polystyrene
gave indistinguishable self-capacitance values, presumably due to their nearly identical
permittvities, around εr = 2.9. Figure 4 indicates that at a thickness greater than 6µm, the layer is
thick enough such that all the electric field is confined in the guiding layer and substrate.
Although, the self-capacitance does not depend on the adjacent liquid at 6µm, the sensor would
likely be far from the optimum for mass sensitivity and also suffer from high insertion losses.
The goal was to design that largest possible flow cell for detection purposes, avoiding
liquid effects as described by [1]. As shown in figure 2, the flow cell slightly overlaps the IDTs
and therefore would influence changes in admittance of the IDT. In order to minimize liquid
effects, we determined that the waveguide thickness should be between 0.5 to 2.5µm for
polyimide and polystyrene. At larger thicknesses, the amplifier for the phase detectors would be
loaded and cause increased noise in the signal. However, below a thickness of 0.5 µm, the self-
capacitance was significantly affected by the presence of the liquid.
15
3.3 Evaluation of Bioactivated Substrates by Ellipsometry
3.3.1 Substrate and Oxide
Prior to measuring the protein G film thickness using ellipsometry, the complex
refractive indices of the bulk silicon as well as the thickness and refractive index of the oxidized
silica layer must be determined. This was done by measuring the ellipsometric angles ψ and ∆ in
air and water using an L116S stokes ellipsometer (Gaertner Scientific Corp., Skokie, IL). Using
the two sets of ψ and ∆, the bulk silicon index (Nsi), the refractive index of SiO2 (nox), and the
SiO2 thickness was determined (dox) using a three-layer model. The values calculated for Nsi, and
nox were 3.8720 - 0.0202i and 1.459 at λ = 6328 Å. The oxide thickness do ranged from 840 to
860 Å, depending on the location cut from the silicon wafer.
3.3.2 Evaluation of Protein G Films by Ellipsometry
With the substrate and SiO2 layer characterized, the thickness of the polymer films were
measured using the L116S ellipsometer. To produce films with the required uniformity for
reliable extraction of the polymer thickness, polyimide and polystyrene were applied at spin
speeds of 6100 rpm to yield a thickness of 3456 Å and 1572 Å, respectively. Moreover, the
thickness of each film was confirmed using a Dektak 3030 surface profilometer and found to be
in good agreement. To reduce errors from thickness variation across the substrate, the polymer
film on the Si/SiO2 substrates was monitored as the protein G was allowed to adsorb in aqueous
conditions. For very thin films, often both the index of refraction and the thickness cannot be
fitted simultaneously and one of the parameters must be fixed. In the case of protein, the real
part of the index of refraction is typically in the range of 1.3 ≤ n ≤ 1.7 and the imaginary part (k)
is close to zero. By using spectroscopic ellipsometry and effective medium theory [10] it was
found that n = 1.542 at λ = 6328 Å. After 1 hour of adsorption followed by rinsing, the thickness
of the protein G (MW = 22,600) film was found to be 42.3 ± 6.2 Å (n = 6).
3.3.3 Evaluation of Antibody Films by Ellipsometry
To calculate the thickness of the BD8 antibody films using ellipsometry, a five-layer
model was required. This consisted of silicon, SiO2, polymer, protein G, BD8 antibody, and
16
finally, the air. In a similar manner to the protein G film measurements, BD8 antibody was
applied immediately then finally rinsed with buffer. The adsorption process was monitored in
aqueous conditions without removing the substrate to reduce errors from thickness variation
across the substrate. The antibody film thickness was found to be 54.7 ± 6.36 Å (n = 6), n =
1.542. The antibody thickness corresponded to a surface concentration of 0.709 ± 0.082 µg/cm2.
To determine whether this amount was sufficient to bind spores, we computed the grafting
density as 0.028 antibodies/nm2 or about 6 nm between adjacent antibodies.
3.4 Mass Sensitivity Evaluation of Waveguides
3.4.1 Polyimide Waveguides
To assess the impact of the waveguide thickness on the phase shift from mass loading, we
injected a known amount of BSA into a fixed volume of buffer over the sensor delay line. This
approach was used to verify waveguide quality and reproducibility. After deposition of the
polymer waveguides, the devices were immediately used to determine the phase shift due to
mass loading. Water contact angle measurements confirmed that the polyimide waveguides
were very hydrophobic (φPI = 78.8 ± 4.7°) and would therefore result in rapid protein adsorption.
The waveguide coated SH-SAWs were placed in the assembled brass fixture and equilibrated
with 0.5 ml of 20 mM PBS pH 7.4 buffer on the sensor and reference delay lines for about 100
seconds. After equilibration in the absence of flow, 1 µl of 50 µg/ml BSA in 20 mM PBS pH 7.4
buffer was added to the 0.5 ml of PBS pH 7.4 buffer. This was equivalent to injecting 50 ng of
BSA into the sensor side of the delay line. For these measurements, the reference was physically
separate from the sensor delay line to eliminate non-specific binding in order to best determine
the mass loading response. At this low protein concentration, viscosity changes were negligible
and the phase shift could be considered primarily from mass loading. This was repeated for five
different polyimide waveguide thicknesses and the results are shown in figure 5. At a polyimide
thickness of 4780 Å, we observed the largest shift in phase from the BSA injection. Waveguide
thicknesses that were either thinner or thicker had less phase shift, a strong indication that the
17
waveguide thickness of 4780 Å was nearly optimal. At a thickness of 6949 Å, we found a rapid
decrease in phase shift and also observed increased noise (figure 5) in the signal.
3.4.2 Polystyrene Waveguides
For the polystyrene waveguides, BSA was injected to assess the phase shift due to mass
loading. Water contact angle measurements confirmed that the polystyrene waveguides were
also very hydrophobic (φPS = 83.8 ± 4.7°) and considered ideal for rapid protein adsorption.
After equilibration with 20 mM PBS pH 7.4 buffer, 50 ng of BSA was added to the sensor delay
line. The phase shift was recorded versus time and is shown in figure 6. In this case, the
maximal phase shift occurred when the polystyrene was 12,210 Å thick. However, the phase
shift for polystyrene was about 1.5° less than for the polyimide at 4780 Å in thickness.
3.4.3 Estimating Sensitivity from BSA Adsorption Assay
Given that the noise level (Nφ) for the phase detectors was 0.005°, and assuming that the
signal could be resolved at three times this noise level, gave 0.015° of signal to noise resolution
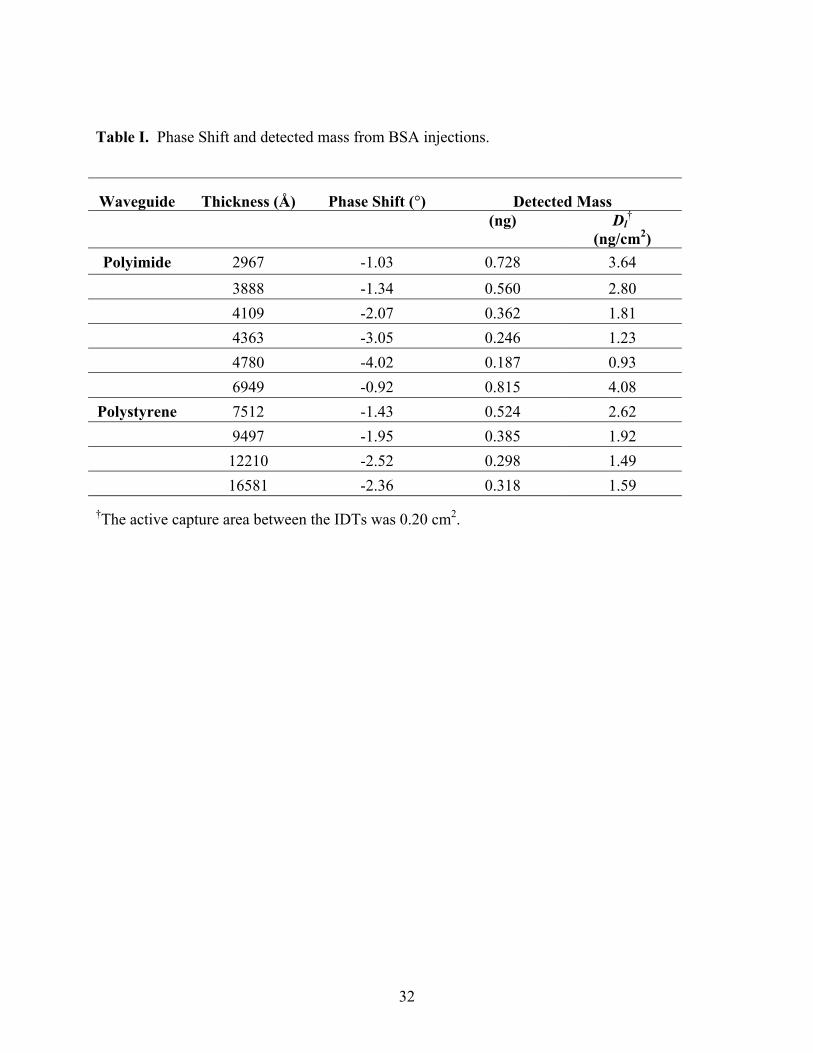
in phase. In figure 5 and 6, each injection corresponded to 50 ng of BSA that could adsorb to the
surface of waveguide. From these injections, the total phase shift was used to compute the
detection limit (g cm-2), which is summarized in table 1. For the optimal polyimide waveguide
thickness of 4780 Å, we computed mSν = 31.2 g cm-2 and mSφ = 45,000 g cm-2.
3.5 B8 B. Thuringiensis Spore Detection
3.5.1 Polyimide Love-wave Devices
Polyimide coated SH-SAW devices were prepared with BD8 anti-B8 spore antibody as
described. The target thickness for the waveguide was 4700 to 5500 Å for polyimide based on
the BSA adsorption results. The devices were dried with N2 and placed in the fixture, where the
pogo pins of the fixture made contact with the Love-wave device. After mounting the lexan lid,
flow was established at a rate of 2.5 µl sec-1. Given that the injection volume was 1 ml, the total
injection time was 6.7 minutes for each sample. The phase shifts of the sensor and reference
were monitored and used to actively compute the signal difference, computed as sensor minus
reference with a VEE program. Temperature of the Love-wave device was also monitored
18
during the injections and found to be 23 ± 0.05°C. Signal baseline was typically established after
5 minutes of flow at which time a 1 ml blank of 18 MΩ cm water was injected. The blanks did
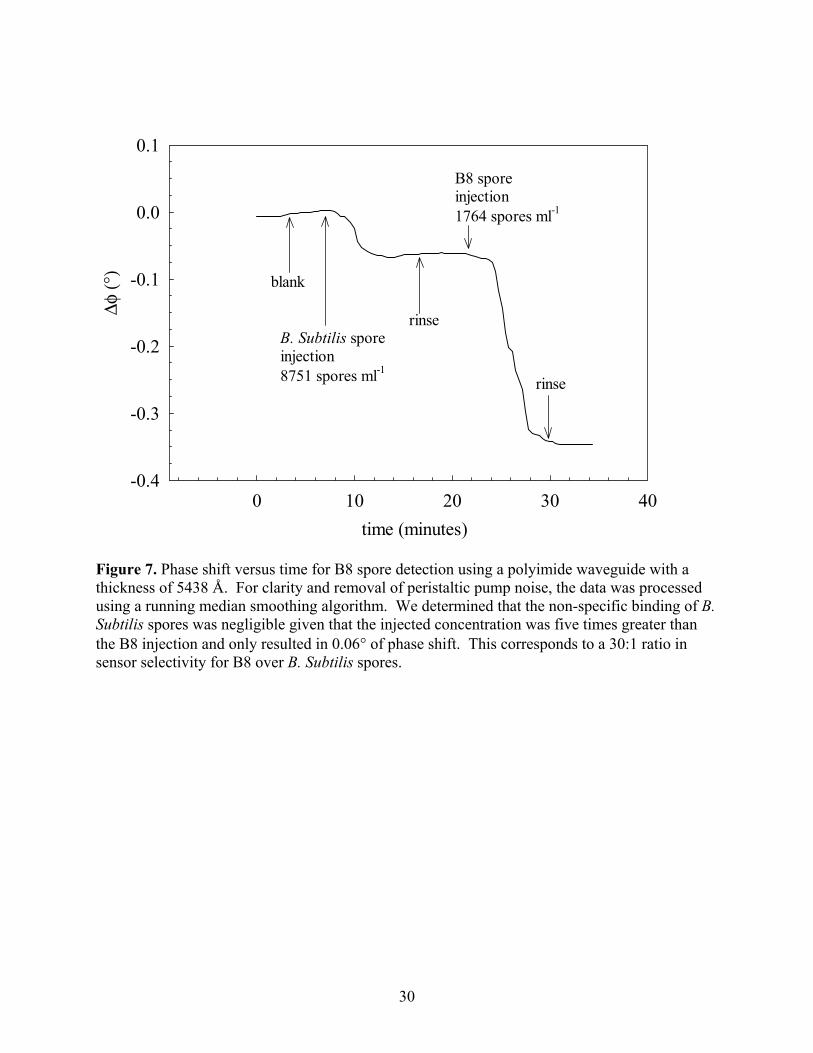
not result in a significant change in phase shift as shown in figure 7. After injection of the blank,
a negative control consisting of 1 ml of 8751 B. Subtilis spores ml-1 was injected while the phase
shift across the delay lines was monitored. The B. Subtilis concentration was increased by five
times greater than the B8 spore concentration since an equivalent injection of 1764 spores ml-1
did not result in a detectable phase shift (data not shown). After this injection, we observed a
small shift in phase (∆φ = 0.06°), which was likely from non-specific binding to the BD8
antibody. This phase shift was considered negligible, given that scaling the phase shift as
0.06°/5 would yield about 0.01° of equivalent shift for 1764 spores ml-1. We also did not
observe a phase shift on the reference. After the volume of B. Subtilis spores was almost
completely done flowing across the Love-wave device (∼7 minutes), a rinse consisting of 1 ml of
18 MΩ cm water was injected to determine if the B. Subtilis spores would desorb off the sensor.
Based on our results from figure 7, spore desorption was not observed. After 20 minutes, 1ml of
1764 B8 spores ml-1 was injected which resulted in a phase shift of 0.29°. After the aliquot of
spores had flowed across the Love-wave device, 1 ml of 18 MΩ cm water was injected to
determine if there was any loss of binding to the sensor. Figure 7 demonstrates that B8 spores
were not observed desorbing from the surface of the sensor in a detectable amount after the rinse.
Moreover, the phase shift from the B8 spore injection was 30 times greater for an equivalent
injection of the B. Subtilis spores.
3.5.2 Polystyrene Love-wave Devices
Polystyrene coated SH-SAW devices were prepared with BD8 anti-B8 spore antibody
and mounted in the flow fixture. The goal was to determine the phase shift of the polystyrene
waveguide coated Love-wave devices from a sample containing B8 spores. In this experiment,
B. Subtilis spores were not injected after the blank since their background influence was found to
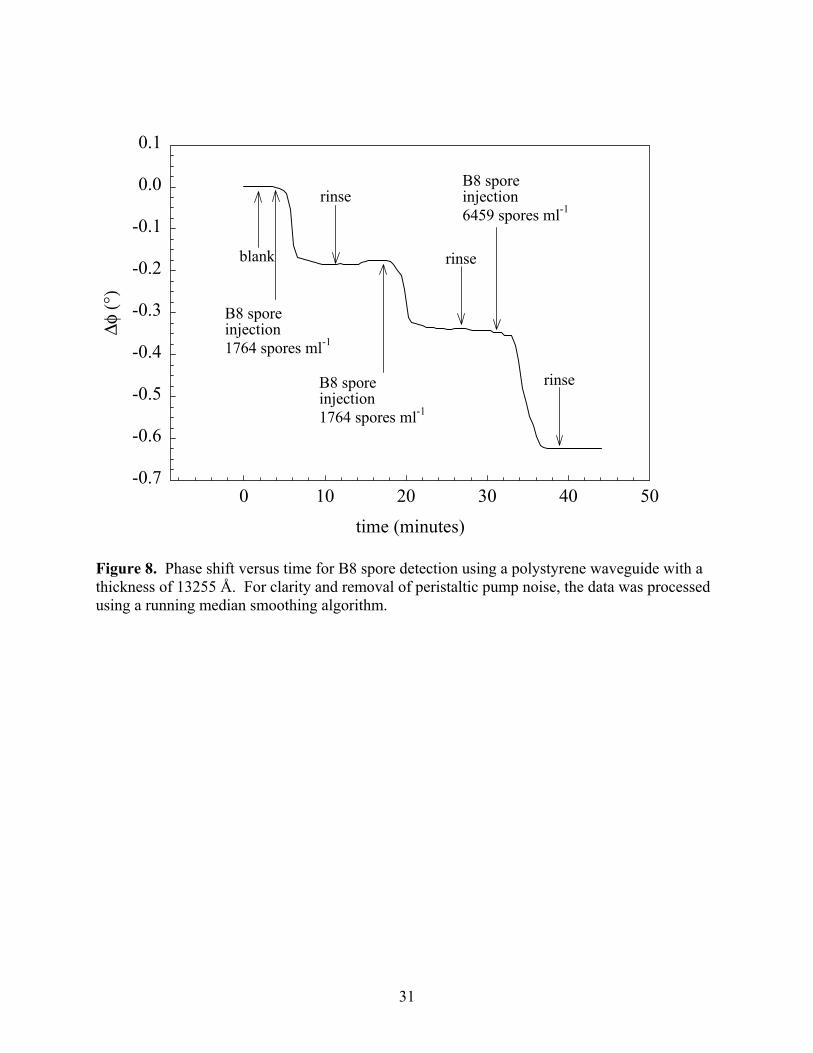
be negligible. After equilibration (~3 minutes), a blank of 18 MΩ cm water was injected. After
a total of six minutes, a 1 ml aliquot of 1764 B8 spores ml-1 was injected which resulted in a
19
phase shift of 0.19° (Figure 8). A subsequent injection of a 1 ml aliquot of 1764 B8 spores ml-1
was done after the phase shift reached a new equilibrium from the first injection. This resulted in
an additional phase shift of 0.16°. Intermediate injections of 18 MΩ cm water as a rinse did not
result in a significant change in phase shift (Figure 8). A third aliquot of B8 spores was injected
to determine the linearity of the phase response to subsequent injections. The injection of 6459
B8 spores ml-1 resulted in 0.28° shift in phase, a shift that did not scale with the previous two
injections. We determined that polystyrene did not result in as large a phase shift for identical
injections of B8 spores, and therefore was not as sensitive as polyimide waveguide SH-SAW
devices.
4. DISCUSSION AND SUMMARY
This study demonstrates the successful application of polymer waveguides on SH-SAW
sensors for stable and highly sensitive detection of an anthrax simulant B8 B. Thuringiensis
spores in aqueous conditions. The application of the waveguides using a spin coat process was
straightforward as compared to vapor deposition techniques. Moreover, the cross-linked nature
of polyimide produces a highly stable film, suitable for chemical resistance in aqueous
conditions. The polystyrene waveguides though not cross-linked were also found to be highly
stable in aqueous conditions. Though it is expected that prolonged exposure to an aqueous
environment will result in polymer swelling and ultimately waveguide failure. For this reason, it
is crucial to select waveguide that are resistant to aqueous environment on a time scale required
for spore detection.
Measurement of the insertion loss before and after application of the polymer waveguides
verified that the Love-wave sensors were trapping acoustic energy within the thin waveguide
layer. Comparing this with other studies we find a similar trend for quartz Love-wave devices
using SiO2 PECVD films as waveguides [4, 11]. However, in those studies, SiO2 was difficult to
apply at a thickness required for optimal sensitivity due to mechanical stability. By comparison,
polyimide was found to be highly stable and easy to apply using spinning process. Although
polyimide was found to be an excellent waveguide, we found it must be applied at a very narrow
20
range of thicknesses (0.45 to 0.55µm). This was attributed to the increased acoustic loss that
occurred around 0.6µm (Figure 3). Nevertheless, through careful application, polyimide can be
applied to whole wafers, which would improve the efficacy of the waveguiding films and obviate
the need to coat single sensors.
In similar fashion, polystyrene was found to be a suitable waveguide material. One
major advantage is that it did not suffer from as high acoustic loss as polyimide, where ∆IL did
not become negative until about 1.5 µm. From a processing view, application by a spinning
procedure would not have to be as precise as for polyimide given the large range for which ∆IL >
0. However, in figure 6 we found that polystyrene was not as sensitive to mass loading as the
polyimide waveguides, despite that it had lower acoustic loss as evidenced from figure 3. This is
largely due to the fact that the shear velocity for polyimide was significantly lower than
polystyrene. Typical shear velocities in polyimide are around 1000 to 1100 m s-1, where
polystyrene was about 1380 m s-1 (Scientific Polymer Products, Inc., Ontario, NY). Theoretical
analysis has indicated that a lower shear velocity significantly improves the sensitivity of the
sensor [8].
In conclusion we found that polyimide and polystyrene were both effective waveguides
materials for creating Love-wave sensors on 36° YX LiTaO3. An essential requirement to
enhance mass sensitivity is to use waveguide materials with low acoustic loss and which are also
resistant to aqueous conditions and permit bioconjugation of antibody or receptor layers. Early
studies on Love-wave mass sensitivity enhancement have relied on the application of waveguide
films (i.e. SiO2, polymethylmethacrylate (PMMA)) [3, 12] that are not as chemically stable or
are difficult to apply. For these reasons, the use of polymer waveguides that are chemically
resistant and exhibit minimal swelling may prove to simplify the fabrication of Love-wave
sensors for detection of biological toxins. Moreover, the LiTaO3 Love-wave sensor using both
polyimide and polystyrene waveguides were found to detect the anthrax simulant B.
Thuringiensis below infectious levels for B. anthracis. This strongly suggests that acoustic

21
Love-wave sensors will have widespread application for whole-cell detection of biological
pathogens.
ACKNOWLEDGEMENTS
We wish to thank John Kearney at the University of Alabama at Birmingham,
Birmingham, AL for graciously providing the B. anthracis simulants and antibodies. Without
his contribution and technical advice this work would not have been possible.
This project has been supported by the United States Department of Energy under
Contract DE-AC04-94AL85000. Sandia is a multiprogram laboratory operated by Sandia
Corporation, a Lockheed Martin Company, for the United States Department of Energy.

22
REFERENCES
[1] B. Jakoby and M. J. Vellekoop, "Viscosity sensing using a love-wave device," Sensors
Actuators, vol. A 68, pp. 275-281, 1998.
[2] K. Nakamura, M. Kazumi, and H. Shimizu, "SH-Type and Rayleigh-type surface waves
on rotated Y-cut LiTaO3," presented at 1977 Ultrasonics Symposium Proceedings,
Phoenix, AZ, 1978.
[3] E. Gizeli, A. C. Stevenson, N. J. Goddard, and C. R. Lowe, "A novel Love-plate acoustic
sensor utilizing polymer overlayers," IEEE Trans. Ultrason. Ferroelect. Freq. Contr.,
vol. 39, pp. 657-659, 1992.
[4] G. Kovacs, G. W. Lubking, M. J. Vellekoop, and A. Venema, "Love-waves for
(bio)chemical sensing in liquids," Ultrason. Symp., pp. 281-285, 1992.
[5] J. Du, G. L. Harding, J. A. Ogilvy, P. R. Dencher, and M. Lake, "A study of love-wave
acoustic sensors," Sensors Actuators, vol. A 56, pp. 211-219, 1996.
[6] J. Kondoh and S. Shiokawa, "A liquid sensor based on a shear horizontal SAW device,"
Electr. Comm. Japan, vol. 76, pp. 224-234, 1993.
[7] B. Jakoby and M. J. Vellekoop, "Analysis and optimization of love-wave liquid sensors,"
IEEE Trans. Ultrason. Ferroelect. Freq. Contr., vol. 45, pp. 1293-1302, 1998.
[8] Z. Wang and J. D. N. Cheeke, "Sensitivity analysis for love mode acoustic gravimetric
sensors," Appl. Phys. Lett., vol. 64, pp. 2940-2942, 1994.
[9] Z. Wang, D. N. Cheeke, and C. K. Jen, "Perturbation method for analyzing mass
sensitivity of planar multilayer acoustic sensors," IEEE Trans. Ultrason. Ferroelect.
Freq. Contr., vol. 43, pp. 844-851, 1996.
[10] H. Arwin, "Optical properties of thin layers of bovine serum albumin, γ-globulin and
hemoglobin," Appl. Spectrosc., vol. 40, pp. 313-318, 1986.
[11] E. Gizeli, "Design Considerations for the acoustic waveguide biosensor," Smart Mater.
Struct., pp. 700-706, 1997.
23
[12] F. Herrmann, M. Weihnacht, and S. Büttgenbach, "Properties of shear-horizontal surface
acoustic waves in different layered quartz-SiO2 structures," Ultrason., vol. 37, pp. 335-
341, 1999.
24
LIST OF FIGURES
Figure 1. Layout of the SH-SAW on 36°YX LiTaO3
25
Figure 2. Acquisition system showing the Love wave sensor, flow system, and acquisition setup.
RF Oscillator
Phase Detector #1
Phase Detector #2
A/D
PC
Temperature Controller
T = ± 0.05 °C
Y splitter
26
thickness (µm)0.0 0.5 1.0 1.5 2.0
∆ In
serti
on L
oss (
dB)
-16
-14
-12
-10
-8
-6
-4
-2
0
2
4
PolystyrenePolyimide
Figure 3. Change of insertion loss (IL) as a function of waveguide thickness, reported as final minus initial IL.
27
thickness (µm)0 2 4 6 8 10 12
Cap
acita
nce
(pF/
m)
300
400
500
600
700
800
900
1000
air, ε r=1
water, ε r=78.5
Figure 4. Measured self-capacitance of an IDT on 36° YX LiTaO3 with a polyimide waveguide using air and water as ambient media. Self-capacitance reached an asymptotic value of 430 pF/m when the waveguide reached about 6µm in thickness. Polystyrene gave identical results, presumably due to nearly identical permittivity (εr = 2.9).

28
time (seconds)
0 100 200 300 400 500
∆φ (°
)
-5
-4
-3
-2
-1
0
1
3888Å4109Å4363 Å4780 Å6949 Å
Figure 5. Phase shift from BSA injections using polyimide waveguides. Each trace is a Love wave sensor with a different waveguide thickness. The largest phase change was observed for a polyimide waveguide thickness of 4780 Å.
29
time (seconds)
0 50 100 150 200 250 300
∆φ (°
)
-3
-2
-1
0
1
7512 Å9497 Å12210 Å16581 Å
Figure 6. Phase shift from BSA injections using polystyrene waveguides. Compared with figure 5, the largest observed phase change (12210 Å) was about 1.5° less than the maximal polyimide phase shift.
30
time (minutes)0 10 20 30 40
∆φ (°
)
-0.4
-0.3
-0.2
-0.1
0.0
0.1
blank
rinse
rinse
B. Subtilis sporeinjection8751 spores ml-1
B8 sporeinjection1764 spores ml-1
Figure 7. Phase shift versus time for B8 spore detection using a polyimide waveguide with a thickness of 5438 Å. For clarity and removal of peristaltic pump noise, the data was processed using a running median smoothing algorithm. We determined that the non-specific binding of B. Subtilis spores was negligible given that the injected concentration was five times greater than the B8 injection and only resulted in 0.06° of phase shift. This corresponds to a 30:1 ratio in sensor selectivity for B8 over B. Subtilis spores.
31
time (minutes)
0 10 20 30 40 50
∆φ (°
)
-0.7
-0.6
-0.5
-0.4
-0.3
-0.2
-0.1
0.0
0.1
blank
rinse
B8 sporeinjection1764 spores ml-1
B8 sporeinjection1764 spores ml-1
rinse
B8 sporeinjection6459 spores ml-1
rinse
Figure 8. Phase shift versus time for B8 spore detection using a polystyrene waveguide with a thickness of 13255 Å. For clarity and removal of peristaltic pump noise, the data was processed using a running median smoothing algorithm.
32
Table I. Phase Shift and detected mass from BSA injections.
Waveguide Thickness (Å) Phase Shift (°) Detected Mass (ng) Dl†
(ng/cm2)
Polyimide 2967 -1.03 0.728 3.64 3888 -1.34 0.560 2.80 4109 -2.07 0.362 1.81 4363 -3.05 0.246 1.23 4780 -4.02 0.187 0.93 6949 -0.92 0.815 4.08
Polystyrene 7512 -1.43 0.524 2.62 9497 -1.95 0.385 1.92 12210 -2.52 0.298 1.49 16581 -2.36 0.318 1.59
†The active capture area between the IDTs was 0.20 cm2.
33
Distribution: 1 MS0188 LDRD Office Bldg. 802/1153F 1 MS 9018 Central Technical Files, 8945-1 2 0899 Technical Library, 9616 1 0612 Review & Approval Desk, 9612 For DOE/OSTI 4 0892 Darren Branch, 1744 4 0892 Susan Brozik, 1744 2 0892 Richard Cernosek, 1764 2 1425 Steve Martin, 1707 2 0892 Curt Mowry, 1764