low load operational flexibility for siemens g-class gas ... · low load operational flexibility...
TRANSCRIPT

www.siemens.com
Low Load Operational Flexibility for Siemens G-class Gas Turbines Power-Gen International 2008—Orlando, Florida

Power-Gen International | Orlando, Florida | December 2008 2
© Siemens Power Generation, Inc. 2008. All rights reserved.
Low Load Operational Flexibility for Siemens G Class Gas Turbines Pratyush Nag*, David Little, Damien Teehan, Kris Wetzl, David Elwood
Siemens Power Generation Inc, 4400 Alafaya Trail, Orlando, FL 32826
Abstract The US gas turbine (GT) power generation market has seen significant volatility in recent years. The trend is likely to continue given the changing environmental condi-tions: climatic changes, natural gas prices, nuclear and coal power generation. This volatility has required many gas turbine operators, who normally operated on a con-tinuous basis (base load) to operate in an intermittent dispatch mode which has caused some operators to frequently shut down their units. This frequent cycling of units increases start-up and maintenance costs. It would be beneficial to these plants to operate at lower loads when power demand is low and ramp up to higher loads as demand increases. A key issue in operating at lower loads is an increase in Carbon Monoxide (CO) emissions. When the engines are base loaded, the combustion system operates at high firing temperatures and most of the CO is oxidized to Carbon Dioxide (CO2). But at part loads, when the firing temperature is lower, the CO to CO2 oxidation reaction is quenched by the cool regions near the walls of the combustion liner. This results in increased CO emissions at low loads. In order to provide greater operational flexibil-ity to the G-class gas turbine operators, Siemens has developed an upgrade for the engine system designed to allow the gas turbine to operate at some lower loads while maintaining emissions within set limits. This developmental effort culminated in the recent installation and successful testing of the upgrade product at one of the Siemens G-class operating plant sites. The plant was previously operating between 70% and 100% of GT base load while main-taining their emissions limits. Now, with this upgrade product installed, they have op-erated as low as 32% of base load while still maintaining emissions within set limits. The plant has continued to operate in this mode as it undergoes further product vali-dation. Some of the key items being evaluated as part of the validation are hot gas path and Heat Recovery Steam Generator (HRSG) components. Initial evaluation has been positive and further inspections and data analysis will continue through the validation phase. Upon successful completion of the validation phase, the product is expected to be rolled out to the other G-class engine sites.
* Corresponding Author

Power-Gen International | Orlando, Florida | December 2008 3
© Siemens Power Generation, Inc. 2008. All rights reserved.
Contents
Introduction .................................................................4
Market drivers for low load operational flexibility.....6
Design & Implementation............................................8
Results .......................................................................10
Validation Operation .................................................14
Conclusions...............................................................15
References.................................................................16
Permission for Use .................................................16
Abbreviations .......................................................17

Power-Gen International | Orlando, Florida | December 2008 4
© Siemens Power Generation, Inc. 2008. All rights reserved.
The W501G gas turbine design concept was driven by the changing power market. Between 1993 and 1995, the power market was moving towards deregulation and replacing aging base load plants, such as coal-based power plants. The market was demanding clean and highly efficient combined cycle plants. Fears of deregulation in the North American electricity market caused prospective plant buyers to turn to cleaner plants with shorter installation and commissioning times compared to tradi-tional coal plants which had a six year lead time to permit and build. The belief at that time was that the new high-efficiency, low emissions, clean fuel plants would be the economic and environmental choice and displace coal plants. Because the W501G had a high efficiency (58% in CC application compared to the typical 54-55% efficiency CC power plant), it was intended to be operated primarily at base load. In the late 1990's there was an increased demand for electric power and a relatively low price for natural gas, about $2.50/MMBtu, causing an increased demand for gas turbines for simple and combined cycle operation. By 2002, the demand for power was subsiding and some areas were over capacity. Natural gas had increased to above $6/MMBtu and the price for electricity had decreased causing the gas turbine combined cycle plants to be operated at only 30% average capacity (higher utiliza-tion for advanced frames including the W501G fleet). The increased natural gas price has caused combined cycle plants to move lower in the dispatch order forcing them to operate in cycling duty mode. In this environment, the amount of time a mer-chant plant can operate profitably may be significantly reduced. [1,2] In response to the change in market demand for more cyclic operation design changes and improvements are continually being incorporated into the W501G en-gine. Customer feedback through user groups, direct feedback, and the analysis of data collected via Power Diagnostics® allows Siemens to focus on development pro-grams that are directly aligned with customer requirements. [1] The W501G adaptability to cyclic/flexible operation was further improved by en-hancements incorporated over the last several years which include the following: • Combustor basket design improvements to reduce emissions, improve reliability
and increase the time between inspection intervals • Steam cooled transition improvements to reduce metal temperatures and extend
inspection intervals based on both hours and starts • Improved compressor and turbine sealing for increased performance and re-
duced emissions • Optimized cooling on the first four rows of turbine airfoils • Optimized rotor cooling air temperature to enhance operational flexibility • Enhanced turbine disk material, which is utilized in the existing Siemens V-fleet • Redesigned exhaust system to improve performance and service life
Introduction

Power-Gen International | Orlando, Florida | December 2008 5
© Siemens Power Generation, Inc. 2008. All rights reserved.
• Improved starting reliability and reduced capital costs from changing the starting motor to a Static Frequency Converter (SFC)
• Optimized and simplified gas turbine and plant controls to improve the engines operational flexibility and starting reliability. [1]
Figure 1: Siemens W501G Gas Turbine
Power-Gen International | Orlando, Florida | December 2008 6
© Siemens Power Generation, Inc. 2008. All rights reserved.
Since the beginning of the power market’s liberalization in the mid 1990’s, the power plant business has been changing. Today, power plant operators find themselves in a more challenging market environment with the presence of strong competition, higher fluctuation of fuel prices, and many without long term power purchase agree-ments. Despite these new challenges, the market liberalization also presents new business opportunities such as the utilization of market price fluctuations for opera-tion and maintenance optimization, participation in ancillary service markets, and short term trading. All of these opportunities can contribute to significantly improved operating margins. By knowing how to approach these opportunities, an operator can in some cases achieve higher profits when compared to a long term power purchase agreement. [3] The changed market conditions have an influence on the operating profile of virtually every power plant. Combined cycle power plants often do not strictly operate in a base load regime running 8,000 hours per year. Many units are operating in a daily start-stop regime with some units starting up to twice a day. In this market environ-ment, an economic model that incorporates only a certain amount of base load hours with fixed power revenues will not describe the full picture. Additional earnings from the above mentioned market opportunities would not be considered. To be more ac-curate, an extended approach for evaluating a cycling plant with high flexibility is necessary. Key parameters for operational flexibility are, for example, start-up time, standby operation and shut-down time. [3] From the mid-1990’s to 2000 there was a steady reduction in the US electric power reserve margins. It was believed that deregulation and cleaner, more efficient com-bined cycle plants would replace aging base load generation stations, such as nu-clear and coal-based plants. Increasing demand for electricity and high electricity prices caused a surge in new orders for both simple cycle and combined cycle plants. The result was an increase in total generated electricity capacity and reserve margins in all U.S. regions, as well as a decrease in CC capacity factor (defined as the ratio of actual generation to the total possible generation over a time period). The capacity factor reduction forced operators to operate in peaking and intermediate modes rather than in the planned base load, thus increasing demand for cyclic op-eration capability. [4] Demand growth, economic dispatchability and operational flexibility are key factors that determine the electricity-generating plant’s ability to improve its dispatch rate (i.e. the order in which it is dispatched as demand for electric power increases during the day). Due to current overcapacity and the increase in reserve margins, the units that excel in economic dispatchability and operational flexibility will dispatch before other competing units. The dispatch order is determined by the unit’s variable pro-duction cost (VPC). Fuel cost and variable Operation and Maintenance (O&M) cost
Market drivers for low load operational flexibility
Power-Gen International | Orlando, Florida | December 2008 7
© Siemens Power Generation, Inc. 2008. All rights reserved.
are used to calculate VPC. Small changes in VPC can significantly affect the unit’s dispatch ranking. Fuel cost is directly impacted by the gas turbine’s efficiency, thus increased efficiency improves not only the revenue per megawatt hour but also the unit’s total dispatch hours. Reduced O&M costs will also lower VPC, improve dis-patchability and increase net cash flow. Units that are operationally flexible and can load follow, cycle on and off more economically which will allow improved dis-patchability and a competitive advantage in the current market. Design improve-ments have been made in the Siemens fleet of SGT6-5000F (formerly called W501F), intended to help enhance the units’ dispatchability, increase efficiency and lower life cycle costs (hence reduced VPC), and improve operational flexibility. [4]

Power-Gen International | Orlando, Florida | December 2008 8
© Siemens Power Generation, Inc. 2008. All rights reserved.
A key issue in operating at lower loads is an increase in carbon monoxide (CO) emissions. When the engines are base loaded, the combustion system operates at a higher firing temperatures and most of the CO is oxidized to carbon dioxide (CO2). However, at part loads, when the firing temperature is lower and the CO to CO2 oxi-dation reaction is quenched by the cool regions near the walls of the combustion liner. This can result in increased CO emissions at low loads which can in some cases exceed the environmental operating permits of the commercial gas turbines. To overcome this, Siemens has developed a modification to the engine designed to allow the gas turbine to continue to operate at some lower loads while maintaining emissions within set limits. The low load turndown design is three-fold: • Closed loop Inlet Guide Vane (IGV) control allowing for more closed IGV settings
at a given engine load • Compressed air is bypassed around the combustor into the turbine to increase
the fuel-to-air ratio inside the combustor • The rotor air cooler temperature is lowered to maximize flow bypassing the com-
bustor. The combination of the above is designed to result in higher firing temperatures at lower loads - thus resulting in improved CO to CO2 conversion. This Low Load Carbon Monoxide (LLCO) design was installed in one of the operat-ing engines of the Siemens G-class gas turbine fleet in October 2007. However, be-fore the implementation of the LLCO upgrade, a baseline inspection was conducted on the critical components of the gas turbine and the findings were recorded in order to compare with inspections after LLCO operation. The installation included modification to the piping and installation of additional valves (Figure 2). Changes were made to the control logic to accommodate the changes to the operation of the gas turbine. Several sections of the gas turbine were instrumented to record the impact of this new LLCO product. The same test was conducted on the unit before and after LLCO was implemented in order to ob-tain a direct comparison of the engine response between the baseline and LLCO operation. A combined cycle emissions and performance test was also conducted in order to measure the differences in emissions and performance between the base-line and LLCO operation.
Design & Implementation

Power-Gen International | Orlando, Florida | December 2008 9
© Siemens Power Generation, Inc. 2008. All rights reserved.
Figure 2: LLCO upgrade implemented on site
After the initial testing in October 2007 (Figure 3), another inspection was conducted in December 2007 to confirm that there was no detrimental impact to the compo-nents due to the test. The test data was analyzed and a potential to improve the ca-pability of the system was identified. In order to validate this, a second test was con-ducted in December 2007 to confirm that the model predictions were accurate and further turndown was possible.
Figure 3: Target Implementation and Validation Schedule
1 2 3 4 5 6 7 8 9 10 11 12 1 2 3 4 5 6 7 8 9 10 11 122007 2008
G LLCO Validation
1. Implementation2. Baseline inspection
3. LLCO Test
1. 1st Inspection (~350 EBH)2. LLCO Phase 2 Test (for lower
turndown)
LLCO Commercial Operation Starts
1. Expected next outage2. Expected final inspection
Completed
Planned
2nd inspection (2500 EBH)
Data Review
Data ReviewFleet Release

Power-Gen International | Orlando, Florida | December 2008 10
© Siemens Power Generation, Inc. 2008. All rights reserved.
In close cooperation with the customer, Siemens was able to test this design while the engine was in commercial operation. The focus of the test was to turndown the engine to the lowest load possible while maintaining CO emissions at or below 10 parts per million (ppm) (corrected to 15% O2). All the instrumentation was continu-ously monitored for deviation from pre-set limits. Emissions were being measured using an external probe inserted into the exhaust section and the data was analyzed using Environmental Protection Agency approved testing methods. The standard Continuous Emissions Monitoring System (CEMS) data was also recorded and com-pared to the previously collected data. Performance testing was performed per ASME test standards. Figure 4 represents a calculated turndown capability of the tested engine. Using the data obtained from the tests conducted in October 2007, the gas turbine and steam turbine thermal cycle models were refined and the closed loop control logic was ad-justed. With these adjustments, the turndown capability was calculated for two cases: 10 ppm CO (corrected to 15% O2) out of the gas turbine (represented by the blue curve) and 10 ppm CO (corrected to 15% O2) out of the exhaust stack (repre-sented by the green curve). It should be noted that this unit is equipped with a CO conversion catalyst which helped reduce the CO emissions. The brown diamonds in this figure represent actually measured data points with the initial control settings. The red diamonds indicate the turndown capabilities as measured during the tests performed in December 2007 after the refined control settings were incorporated. It can be seen that a minimum turndown of approximately 40% GT load can be ob-tained while maintaining 10 ppm CO out of the engine and the turndown is up to 28% GT load with 10 ppm CO out of the exhaust stack using the CO catalyst. There are potential methods of improving the turndown capability at lower temperatures such as - combining LLCO with an inlet heating upgrade.
Results

Power-Gen International | Orlando, Florida | December 2008 11
© Siemens Power Generation, Inc. 2008. All rights reserved.
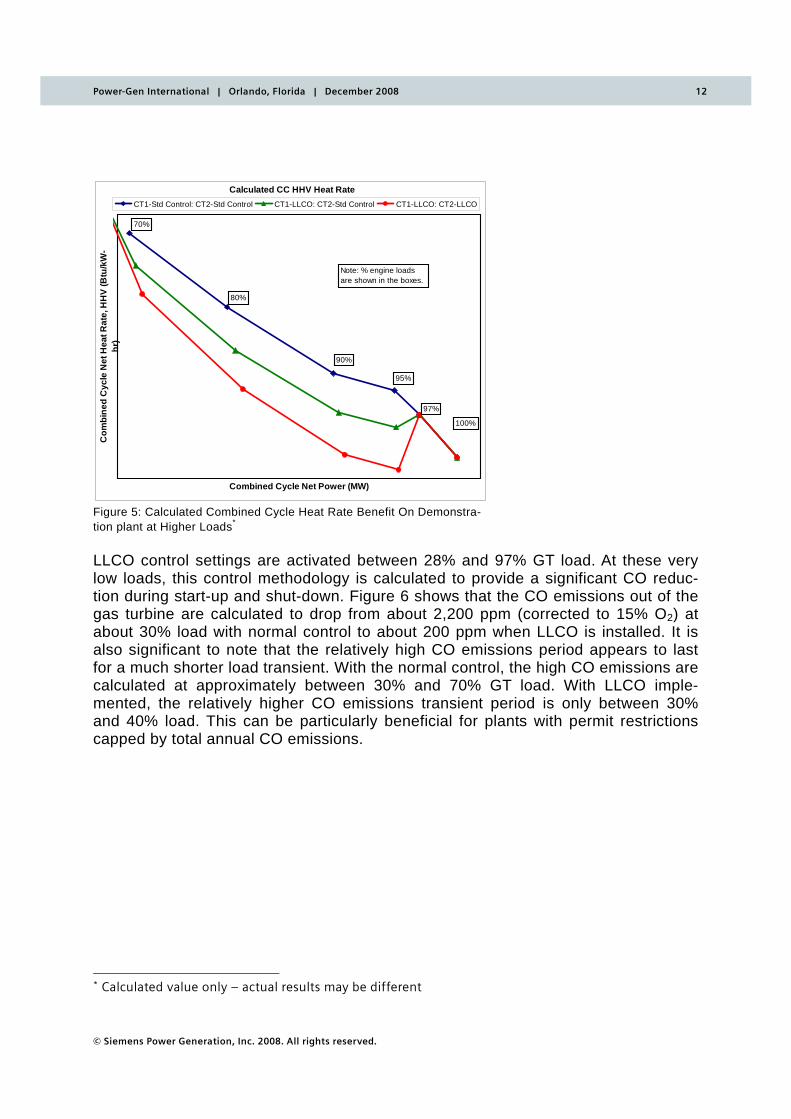
Figure 4: Calculated Turndown Capability to 10 ppm CO emissions* The demonstration plant was a 2x1 combined cycle configuration with the LLCO product installed only on GT-1. Figure 5 shows that above 70% GT load, the LLCO control settings yielded an improvement in combined cycle heat rate. The blue curve indicates the baseline case when neither unit was equipped with the LLCO upgrade. The green curve shows the 2x1 plant heat rate vs. power with only one GT activated on LLCO. The red curve is a calculation of a potential heat rate benefit when both gas turbines are equipped with the LLCO upgrade.
* Calculated value only – actual results may be different
501G: Predicted Engine Turndown Capability
28
30
32
34
36
38
40
42
44
46
48
50
52
54
-10 0 10 20 30 40 50 60 70 80 90 100 110
Compressor Inlet Temperature (F)
Perc
enta
ge o
f Eng
ine
Load
(%)
10 CO from Engine 10 CO from HRSG Measured Oct 11/07 Measured Dec 7/07
Power-Gen International | Orlando, Florida | December 2008 12
© Siemens Power Generation, Inc. 2008. All rights reserved.
Figure 5: Calculated Combined Cycle Heat Rate Benefit On Demonstra-tion plant at Higher Loads* LLCO control settings are activated between 28% and 97% GT load. At these very low loads, this control methodology is calculated to provide a significant CO reduc-tion during start-up and shut-down. Figure 6 shows that the CO emissions out of the gas turbine are calculated to drop from about 2,200 ppm (corrected to 15% O2) at about 30% load with normal control to about 200 ppm when LLCO is installed. It is also significant to note that the relatively high CO emissions period appears to last for a much shorter load transient. With the normal control, the high CO emissions are calculated at approximately between 30% and 70% GT load. With LLCO imple-mented, the relatively higher CO emissions transient period is only between 30% and 40% load. This can be particularly beneficial for plants with permit restrictions capped by total annual CO emissions.
* Calculated value only – actual results may be different
Calculated CC HHV Heat Rate
Combined Cycle Net Power (MW)
Com
bine
d C
ycle
Net
Hea
t Rat
e, H
HV
(Btu
/kW
-hr
)
CT1-Std Control: CT2-Std Control CT1-LLCO: CT2-Std Control CT1-LLCO: CT2-LLCO
Note: % engine loadsare shown in the boxes.
100%
70%
80%
95%
97%
90%

Power-Gen International | Orlando, Florida | December 2008 13
© Siemens Power Generation, Inc. 2008. All rights reserved.
Figure 6: Potential Reduction in Start-up CO Emissions On Demonstration plant * Safe and reliable operation of the steam turbine was also demonstrated during this combined cycle test. The primary goal was to maintain enough heat input to the HRSG to generate enough steam to keep the steam turbine operational which was successfully demonstrated. In the case of the G-class gas turbines, the transition section of the combustion system is cooled with steam. It was also demonstrated that transition steam temperatures were within design operating limits. Impact to the HRSG due to LLCO operation was also not quantified before the test. No apparent failure modes were observed during the test. Furthermore, appropriate steam cycle data from the LLCO tests were evaluated by the HRSG vendor using their analytical models. The results of the evaluation were that all “as tested” condi-tions were within the design criteria and no detrimental impact was reported by them in their analysis. In fact, the vendor reported that it was its view that the LLCO opera-tion was actually better in comparison to daily cycling due to the reduced thermal cycling fatigue.
* Calculated value only – actual results may be different
501G: CO vs %Load
0200400
600800
1000120014001600
180020002200
30 40 50 60 70 80 90 100
%Load
CO
(ppm
vd @
15%
O2)
59F LLCO 59F Base IGV

Power-Gen International | Orlando, Florida | December 2008 14
© Siemens Power Generation, Inc. 2008. All rights reserved.
After the successful tests, the data was reviewed and the unit started its validation operation on January 11, 2008. After a few initial adjustments to the control logic to meet the dispatch requirements, the unit has operated down to ~50% load as needed. Since the LLCO upgrade was installed it has been extensively used as is demonstrated in Figure 7. Approximately 35% of the total operating hours have been spent on lower loads (20%-70% GT load). Before the LLCO upgrade, this unit was reported to have shut down nightly and now it is reportedly simply turned down to minimum load and left there while the demand is low. When demand for electricity is higher, the GT is brought to higher loads as needed in a relatively short period of time.
LLCO operation
0
400
800
1200
1600
2000
2400
2800
3200
3600
4000
4400
4800
Feb 17 2008 April 4 2008 April 30 2008 May 31 2008 Jun 30 2008
EBH
Low Load (20%-70%) hrsEBH
Figure 7: Operational data on demonstration plant A second inspection was performed in May 2008 to monitor the critical components. Typical findings were observed by Siemens – there was no evidence of any detri-mental impact of LLCO operation observed. Validation is ongoing (expected to be completed in October/November, 2008) and further inspections will follow until com-pletion of the validation period.
Validation Operation

Power-Gen International | Orlando, Florida | December 2008 15
© Siemens Power Generation, Inc. 2008. All rights reserved.
Low load turndown flexibility is extremely desirable to gas turbine operators espe-cially in light of the changes in the power generation market. There can be several benefits with this kind of flexibility including improved load following capability, re-duced start-up time, less start-up CO emissions – to name a few. The low load turn-down upgrade was successfully installed in a commercially operating Siemens W501G engine. Tests were performed to demonstrate the operational capability of the upgrade. After successful testing, the data was evaluated and the engine was released for validation operation with this upgrade. The engine continues to operate in this mode during this validation period which is expected to be completed by this calendar year. After this validation, the data will be reviewed and if considered suc-cessful, the product will be released for fleet-wide operation.
Conclusions

Power-Gen International | Orlando, Florida | December 2008 16
© Siemens Power Generation, Inc. 2008. All rights reserved.
References [1] Bancalari, E., Chan, P., “Adaptation of the SGT6-6000G to a Dynamic Power Generation Market”, POWER-GEN International 2005 – Las Vegas, Nevada. [2] Engelbert, C., Fadok, J., Fuller, R., Lueneburg, B., “Introducing the 1S.W501G Single-Shaft Combined Cycle Reference Power Plant”; Proceedings of ASME Power 2004, Baltimore, Maryland.. [3] Emberger, H., Hofmann, D., Kolk, C., “Economic Evaluation of Cycling Plants – An Approach to Show the Value of Operational Flexibility”, Power-Gen Europe 2006, Cologne [4] Xia, J., Kovac, J., McQuiggan, J., Wolfe, B., “SGT6-5000F (W501F) Engine En-hancements to Improve Operational Flexibility”, POWER-GEN International 2005 – Las Vegas, Nevada.
Permission for Use
The content of this paper is copyrighted by Siemens Power Generation, Inc. and is licensed only to PennWell for publication and distribution. Any inquiries regarding permission to use the content of this paper, in whole or in part, for any purpose must be addressed to Siemens Power Generation, Inc. directly.

Power-Gen International | Orlando, Florida | December 2008 17
© Siemens Power Generation, Inc. 2008. All rights reserved.
Abbreviations
CC Combined Cycle
CEMS Continuous Emissions Monitoring System
CO Carbon Monoxide
CO2 Carbon Dioxide
GT Gas Turbine
HRSG Heat Recovery Steam Generator
IGV Inlet Guide Vane
LLCO Low Load Carbon Monoxide
MMBtu Million British Thermal Unit
O2 Oxygen
O&M Operation and Maintenance
PPM Parts Per Million
SFC Static Frequency Converter
VPC Variable Production Cost