low-mass planar photonic imaging sensor - nasa · pdf filelow-mass planar photonic imaging...
TRANSCRIPT
Low-Mass Planar Photonic Imaging Sensor
S. J. Ben Yoo, Ryan P. Scott Dept. of Electrical and Computer Engineering, University of
California, Davis, CA, 95616 USA
Alan Duncan
Lockheed Martin Advanced Technology Center, Palo Alto, CA, 94304 USA
2014 NIAC Symposium

Key to Affordability – Low SWaP
Orders of Magnitude SWaP Reduction Achievable
Conventional Telescope and focal plane
SPIDER: Radial Blade Design Option B: outer ring
SPIDER: Radial Blade Design Option A: full sensor
SPIDER: Single Chip Design
2/4/2014 2014 NIAC Symposium 2
3 2014 NIAC Symposium 2/4/2014
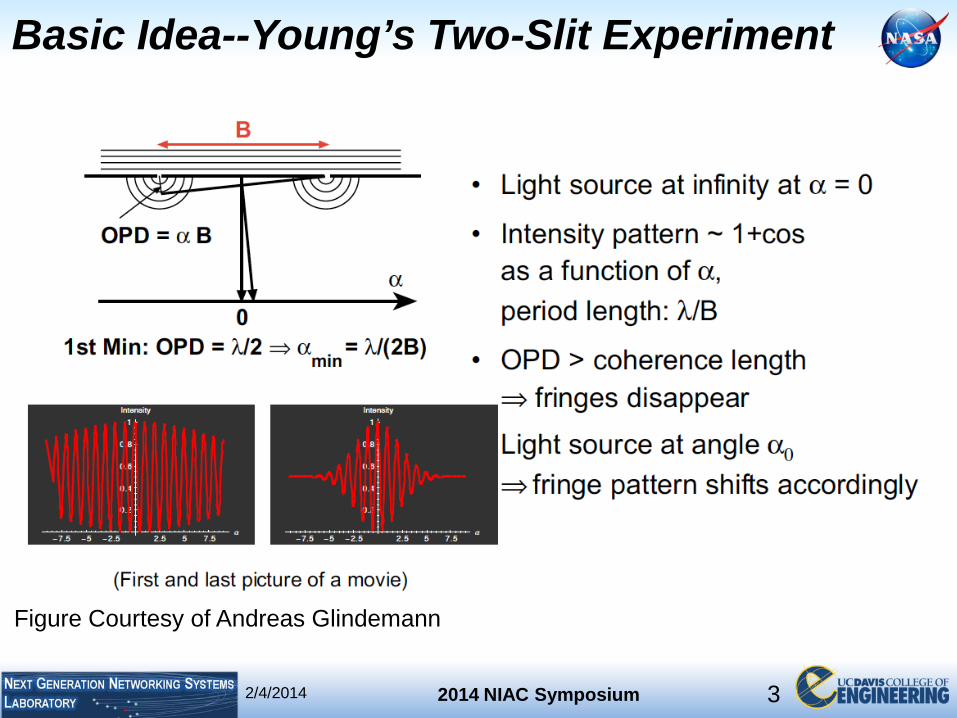
Figure Courtesy of Andreas Glindemann
Basic Idea--Young’s Two-Slit Experiment

2014 NIAC Symposium 2/4/2014
Basic Idea--Michelson Stellar Interferometer
4
Figure Courtesy of Andreas Glindemann

2014 NIAC Symposium 2/4/2014
Advantages of Interferometric Imaging
Figure Courtesy of Andreas Glindemann
5

2014 NIAC Symposium 2/4/2014
Radio VLA
6
2014 NIAC Symposium 2/4/2014
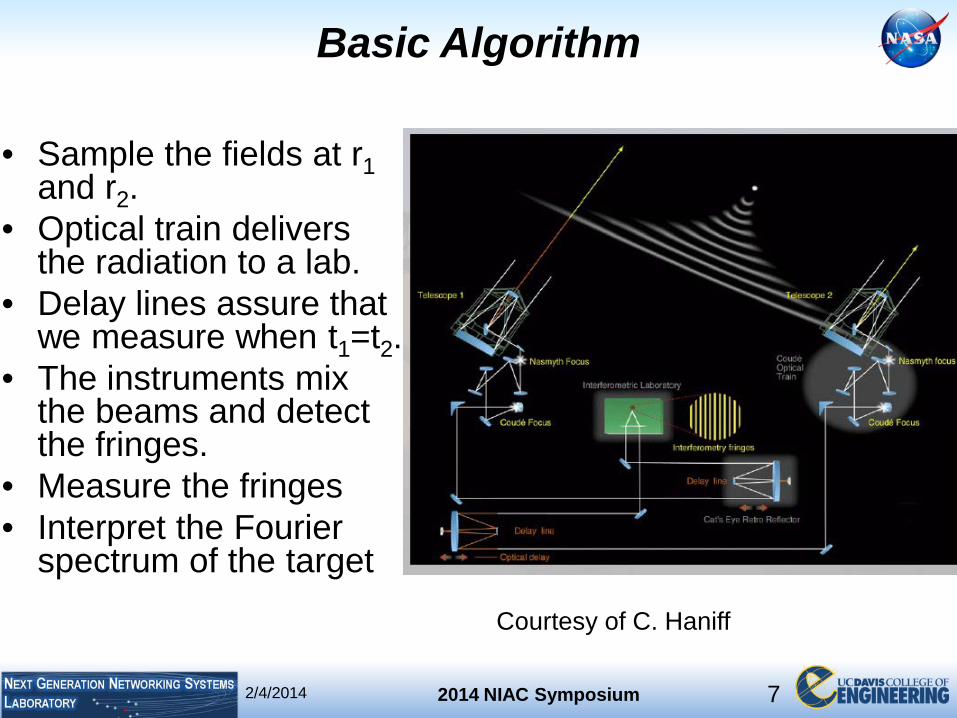
Basic Algorithm
• Sample the fields at r1 and r2. Optical train delivers the radiation to a lab. Delay lines assure that we measure when t1=t2. The instruments mix the beams and detect the fringes. Measure the fringes Interpret the Fourier spectrum of the target
•
•
•
••
Courtesy of C. Haniff
7

2014 NIAC Symposium 2/4/2014
The Output of a Two-element Interferometer
( ) ( ) ( ) ( )1 1 2 2exp . exp and exp expA ik s B d i t A ik d i tω Ψ = + Ψ = ω
( )( ) ( )1 2 1 2exp . exp expA ik s B d ik d i tω Ψ = Ψ +Ψ = + +
*
[ ]( ) [ ]( )*1 2 1exp . exp exp . expik s B d ik d ik s B d ik d ΨΨ ∝ + + × − + + −
( )1 12 2cos .k s B d d ∝ + + −
( ) ( ) 2
( )2 2cos kD∝ +
• A combination of E fields from the two collectors can be described as:
• Summing these at the detector yields:
•
• Thus, the time averaged intensity, , is gΨΨ iven by:
•
Here, D is a function of the path lengths, d1 and d2, the pointing direction (i.e., where the source is), and the baseline.
Measure the fringe visibility at D = 0 and the fringe phase (with respect to a ref):
max min
max min
I IVI I
−=
+
The fringe amplitude and phase measure the amplitude and phase of the Fourier transform of the source at one spatial frequency.
Adapted from C. Haniff – The theory of interferometry
8

2014 NIAC Symposium 2/4/2014
SPIDER Provides Low Cost Option to Enhance Resolution of a Conventional Telescope
• Objectives Enhanced quality imagery using
sparse high resolution image sampling and hyperspectral data Increase effective aperture diameter by 2X - 3X (9X mass reduction)
• Concept Description Moderate aperture diameter
conventional imaging telescope with staring focal plane White light waveguide coupled interferometers with integrated combiner / phase shifters / detectors
• Performance Characteristics Moderate resolution full field of view
panchromatic image Selectable subfield regions enhanced with high resolution and hyper-spectral content
9
2014 NIAC Symposium 2/4/2014
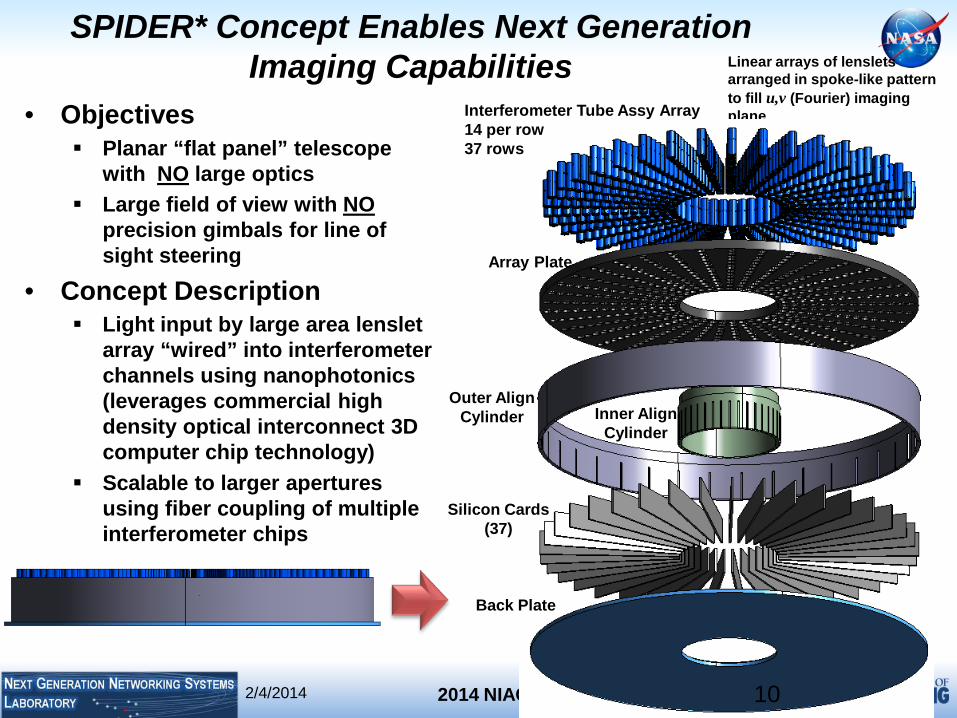
SPIDER* Concept Enables Next Generation Imaging Capabilities
Objectives Planar “flat panel” telescope with NO large optics Large field of view with NO precision gimbals for line of sight steering
Concept Description Light input by large area lenslet array “wired” into interferometer channels using nanophotonics (leverages commercial high density optical interconnect 3D computer chip technology) Scalable to larger apertures using fiber coupling of multiple interferometer chips
Linear arrays of lenslets arranged in spoke-like pattern to fill u,v (Fourier) imaging plane •
•
Interferometer Tube Assy Array 14 per row 37 rows
Array Plate
Outer Align Cylinder Inner Align
Cylinder
Silicon Cards (37)
Back Plate
10
2014 NIAC Symposium 2/4/2014
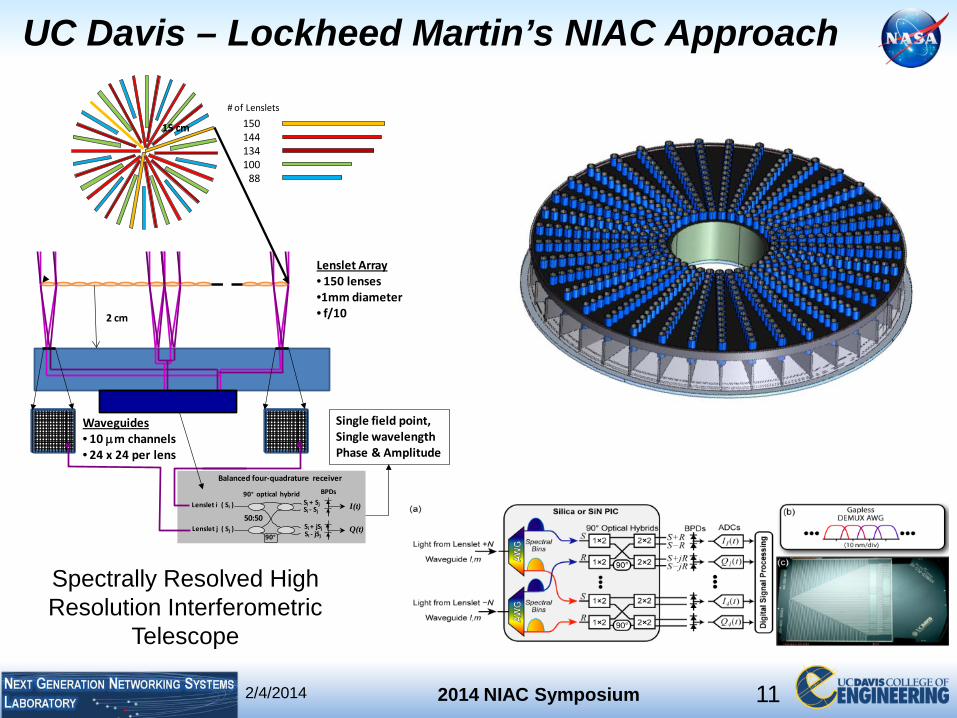
UC Davis – Lockheed Martin’s NIAC Approach
•••
••
2 cm
# of Lenslets
15 cm
Balanced four-quadrature receiver
Lenslet j
Lenslet i ( Si )
( Sj )90°
90° optical hybrid BPDsSi + SjSi - Sj
Si - jSj
Si + jSj
I(t)
Q(t)50:50
150144134100
88
Lenslet Array150 lenses1mm diameterf/10
Waveguides10 µm channels24 x 24 per lens
Single field point, Single wavelengthPhase & Amplitude
Spectrally Resolved High Resolution Interferometric
Telescope
11
2014 NIAC Symposium 2/4/2014
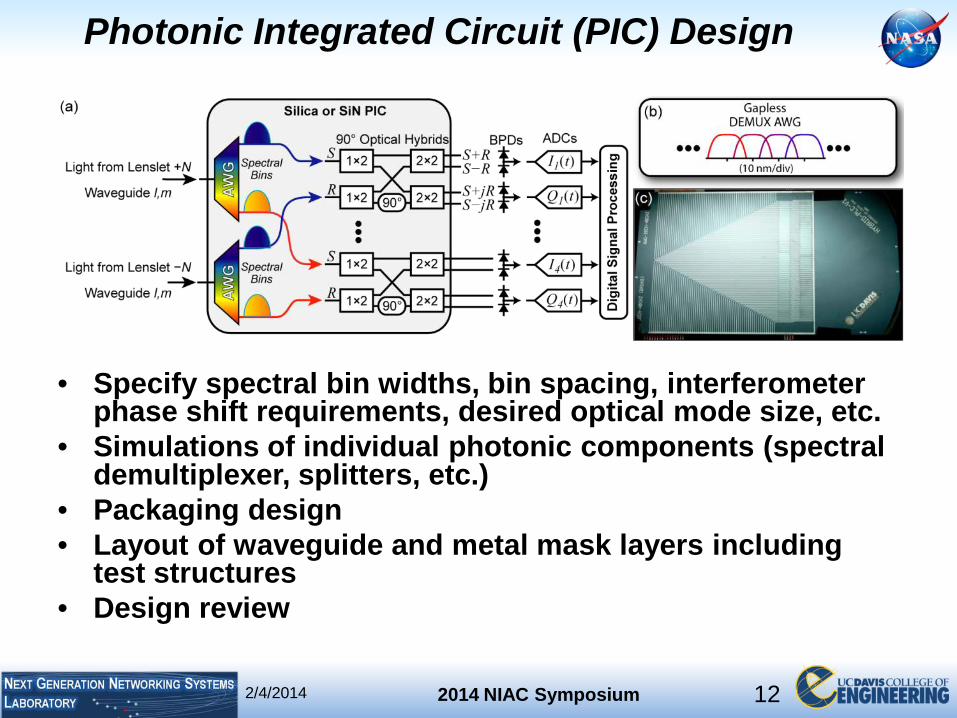
Photonic Integrated Circuit (PIC) Design
•
•
••
•
Specify spectral bin widths, bin spacing, interferometer phase shift requirements, desired optical mode size, etc. Simulations of individual photonic components (spectral demultiplexer, splitters, etc.) Packaging design Layout of waveguide and metal mask layers including test structures Design review
12

2014 NIAC Symposium 2/4/2014
10-Spatial-Channel × 3 Spectral Band PIC 2×2 Demux Phase Shifter
From Lenslet +2
From Lenslet -2
60 Outputs
Line
ar D
etec
tor A
rray
5 Waveguide Inputs for
Each Lenslet
Matched Pathlengths
-2
-1
+1
+2
5 m
m
20 m
m
To Demux
13
2/4/2014 2014 NIAC Symposium
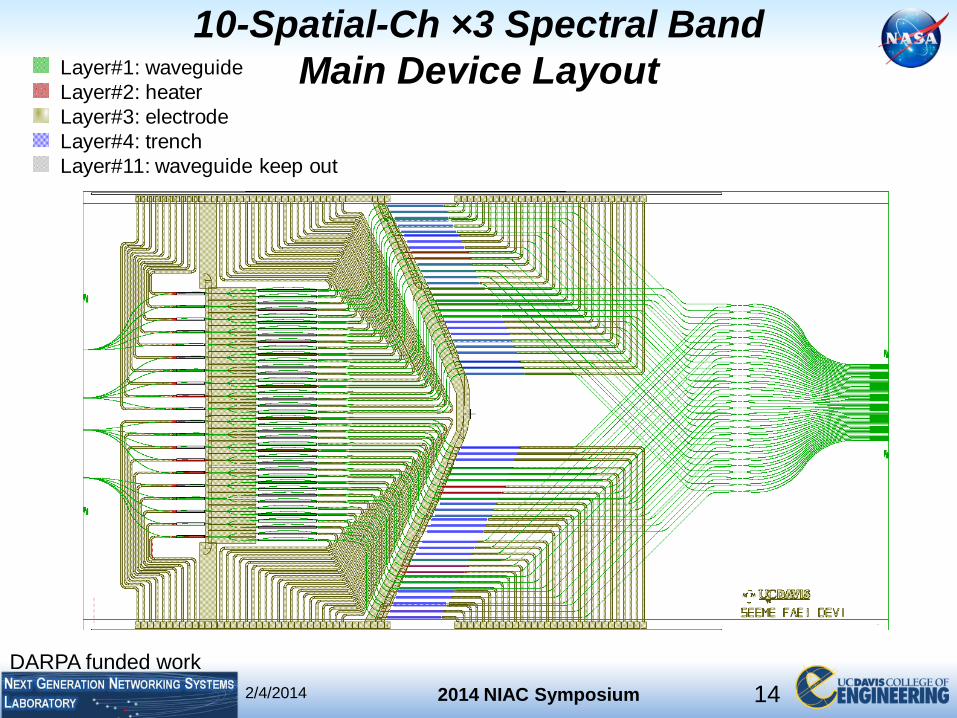
10-Spatial-Ch ×3 Spectral Band Main Device Layout Layer#1: waveguide
Layer#2: heaterLayer#3: electrodeLayer#4: trenchLayer#11: waveguide keep out
DARPA funded work 14

2014 NIAC Symposium 2/4/2014
Packaged PIC Linear Detector Array
PIC
Lenslets
DARPA funded work
15
2014 NIAC Symposium 2/4/2014
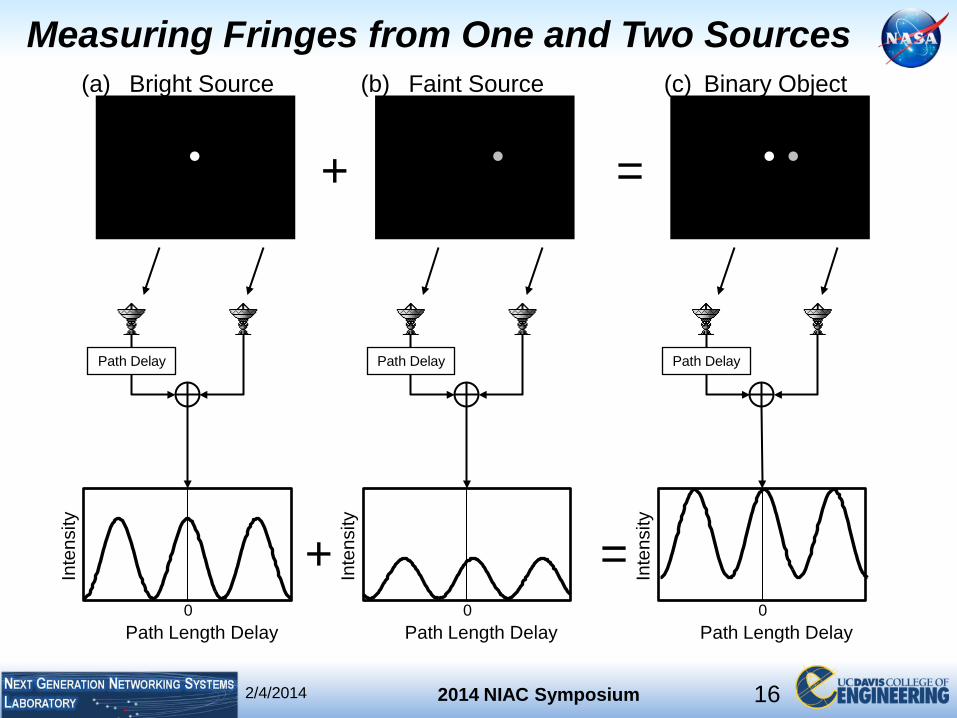
Measuring Fringes from One and Two Sources (a) Bright Source
Path Delay
Path Length Delay
Inte
nsity
0
(b) Faint Source
Path Delay
Path Length Delay
Inte
nsity
0
+
(c) Binary Object
Path Delay
Path Length Delay In
tens
ity
0
+
=
=
16
2014 NIAC Symposium 2/4/2014
DARPA funded work
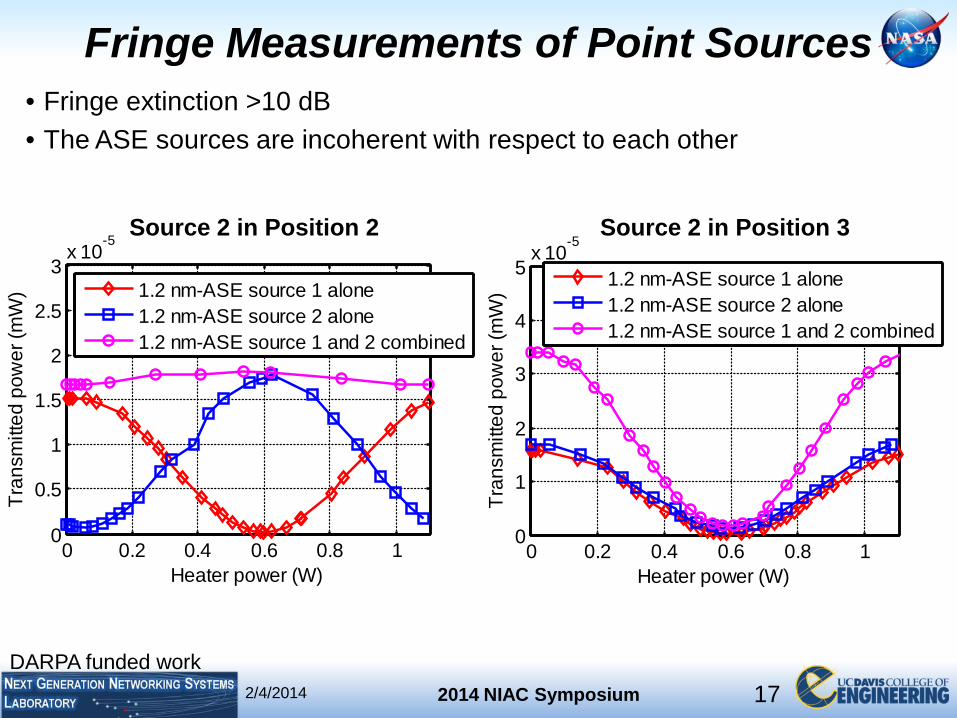
Fringe Measurements of Point Sources Fringe extinction >10 dB The ASE sources are incoherent with respect to each other
Source 2 in Position 2
0 0.2 0.4 0.6 0.8 10
0.5
1
1.5
2
2.5
3x 10
-5
Heater power (W)
Tran
smitt
ed p
ower
(mW
)
1.2 nm-ASE source 1 alone1.2 nm-ASE source 2 alone1.2 nm-ASE source 1 and 2 combined
Source 2 in Position 3
0 0.2 0.4 0.6 0.8 10
1
2
3
4
5x 10
-5
Heater power (W)
Tran
smitt
ed p
ower
(mW
)
1.2 nm-ASE source 1 alone1.2 nm-ASE source 2 alone1.2 nm-ASE source 1 and 2 combined
••
17
2014 NIAC Symposium 2/4/2014
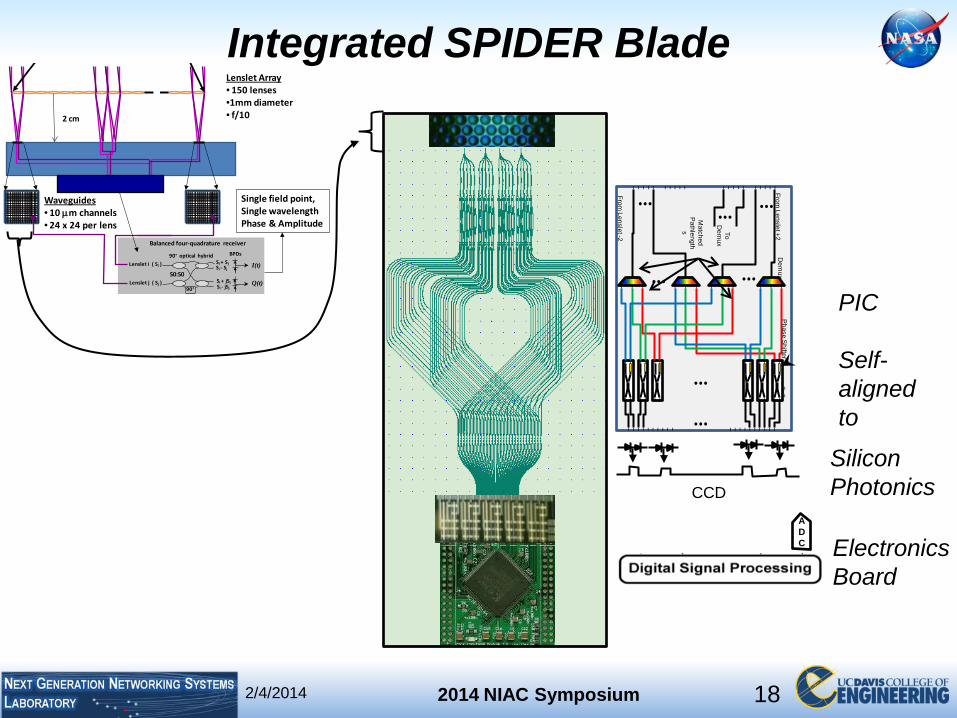
Integrated SPIDER Blade Lenslet Array• 150 lenses•1mm diameter• f/10
Waveguides• 10 µm channels• 24 x 24 per lens
2 cm
Single field point, Single wavelengthPhase & Amplitude
Balanced four-quadrature receiver
Lenslet j
Lenslet i ( Si )
( Sj )90°
90° optical hybrid BPDsSi + SjSi - Sj
Si - jSj
Si + jSj
I(t)
Q(t)50:50
2×2 D
emux
Phase S
hifter From
Lenslet +2
From Lenslet -2
Matched
Pathlength
s To D
emux
AD C
CCD
PIC
Self- aligned to
Silicon Photonics
Electronics Board
18
2014 NIAC Symposium 2/4/2014
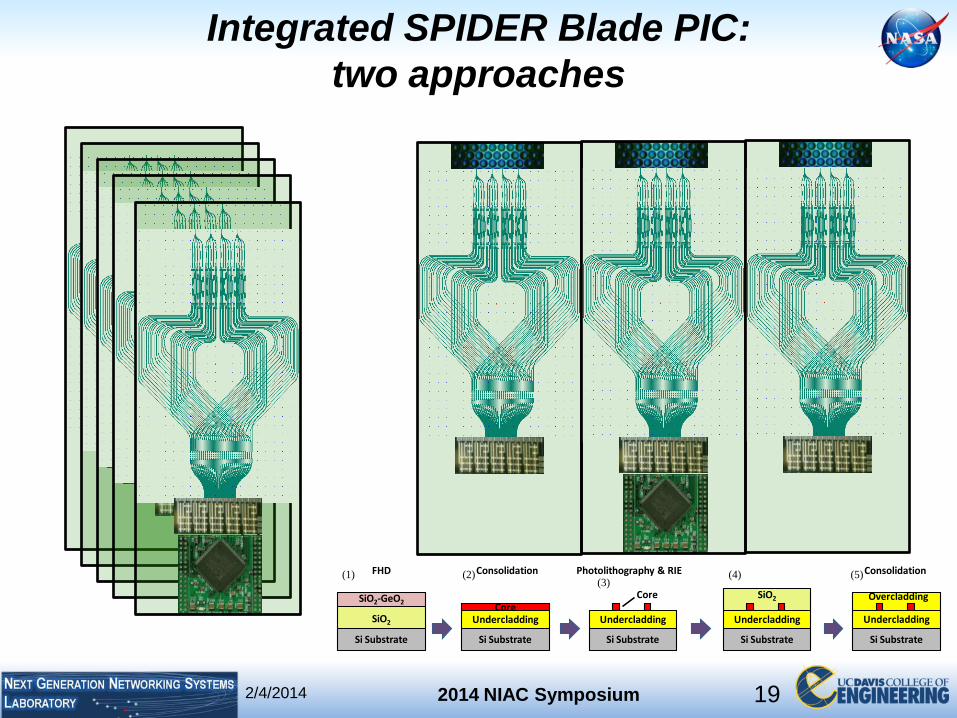
Integrated SPIDER Blade PIC: two approaches
Si Substrate
FHD
SiO2-GeO2
SiO2
CoreUndercladding
Si Substrate
Consolidation
Undercladding
Si Substrate
Photolithography & RIE
Core
Undercladding
Si Substrate
SiO2
Consolidation
Undercladding
Si Substrate
Overcladding
(1) (2)(3)
(4) (5)
19
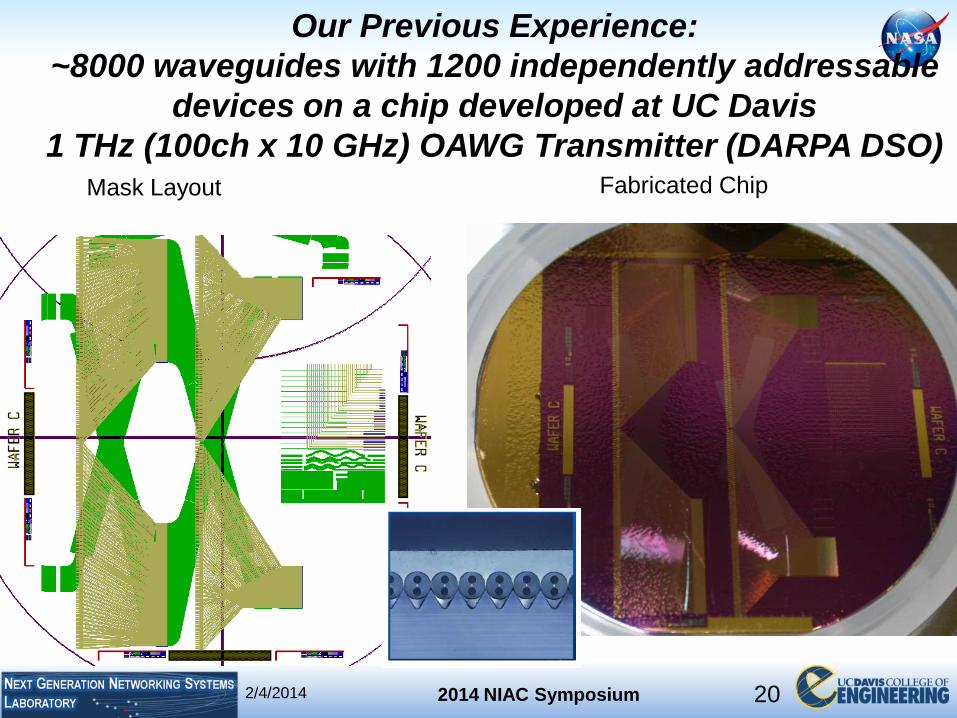
Our Previous Experience:
2014 NIAC Symposium 2/4/2014
~8000 waveguides with 1200 independently addressable devices on a chip developed at UC Davis
1 THz (100ch x 10 GHz) OAWG Transmitter (DARPA DSO) Mask Layout Fabricated Chip
20
2014 NIAC Symposium 2/4/2014
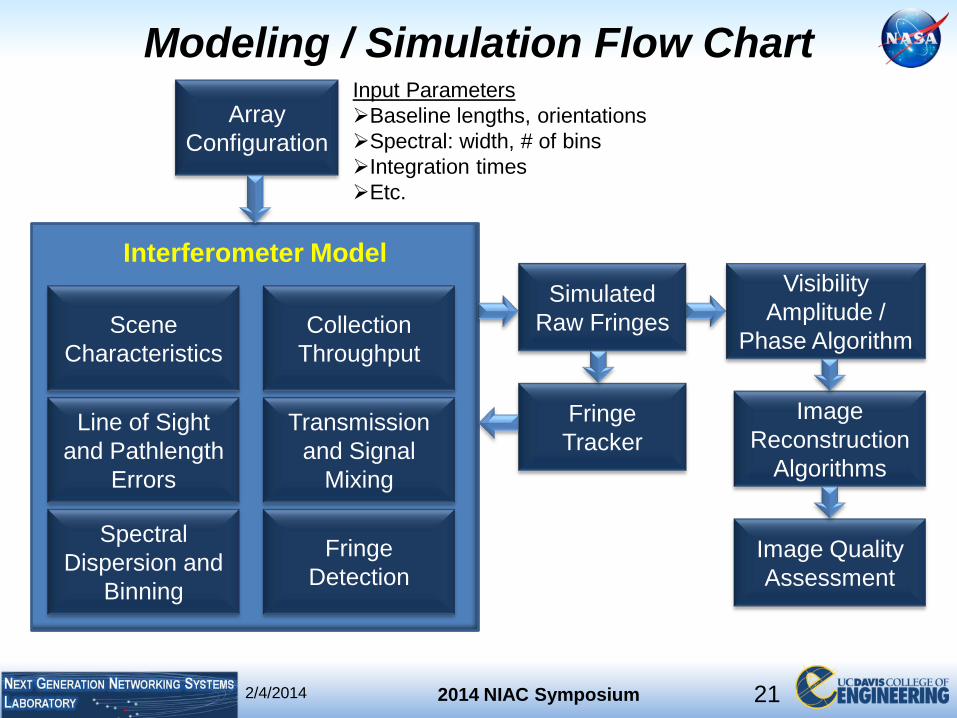
Modeling / Simulation Flow Chart Array
Configuration
Input Parameters Baseline lengths, orientations
Spectral: width, # of bins Integration times Etc.
Interferometer Model
Scene Characteristics
Line of Sight and Pathlength
Errors
Spectral Dispersion and
Binning
Collection Throughput
Transmission and Signal
Mixing
Fringe Detection
Simulated Raw Fringes
Fringe Tracker
Visibility Amplitude /
Phase Algorithm
Image Reconstruction
Algorithms
Image Quality Assessment
21

2014 NIAC Symposium 2/4/2014
Interferometer Model (detail) Jitter
Static Dynamic
System Alignment
OPD Between Lenses
Baselines
Channels
Spectral Complex Visibility ModelScene Model
We start here with a model for the target
Spectral Irradiance at
Lenses
Coupling Efficiency
ObscurationOptical Transmission
Throughput Losses
Integration Time
Calculate signal level at focal plane
Signal at FP
Simulate a noise free fringe pattern with OPD errors
Raw Fringe Pattern
Simulated Fringe Data
Final simulated fringes with noise and sensor effects
EMCCD Model
Raw or Photon Counting Pixel Size
Gain Read Noise
Dark Current Noise Factor
QE QSE
Send fringes to other simulations
M Frames (for active
track)
N Frames (for digital track or image
reconstruction)
22
2014 NIAC Symposium 2/4/2014
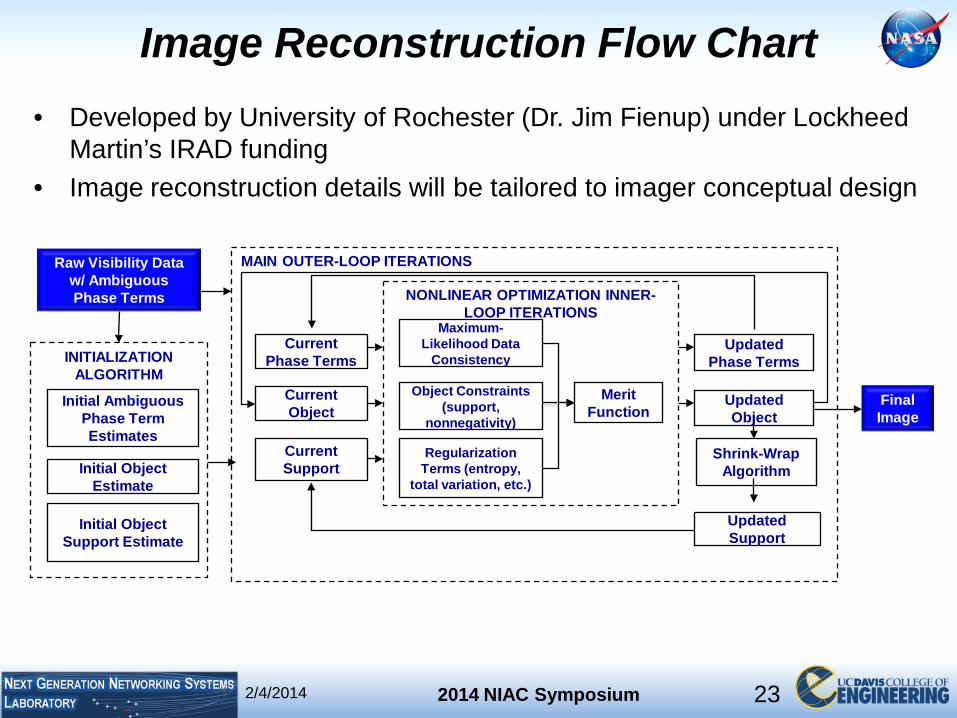
Image Reconstruction Flow Chart • Developed by University of Rochester (Dr. Jim Fienup) under Lockheed
Martin’s IRAD funding Image reconstruction details will be tailored to imager conceptual design •
Raw Visibility Data w/ Ambiguous Phase Terms
INITIALIZATION ALGORITHM
Initial Ambiguous Phase Term Estimates
Initial Object Estimate
Initial Object Support Estimate
MAIN OUTER-LOOP ITERATIONS
Current Phase Terms
Updated Phase Terms
Current Object
Current Support
Updated Support
NONLINEAR OPTIMIZATION INNER-LOOP ITERATIONS
Maximum-Likelihood Data
Consistency
Object Constraints (support,
nonnegativity)
Regularization Terms (entropy,
total variation, etc.)
Merit Function
Updated Object
Shrink-Wrap Algorithm
Final Image
23
2/4/2014
2014 NIAC Symposium
Time (ms)
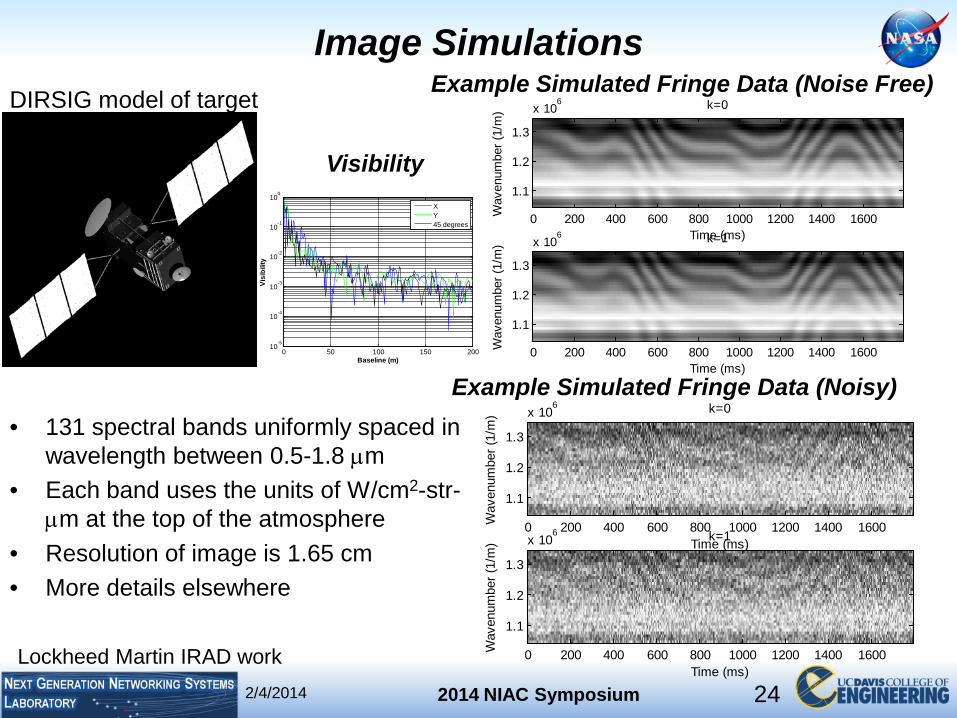
Image Simulations
•
•
••
) k=0x 106
DIRSIG model of target
Visibility
0 50 100 150 20010
-5
10-4
10-3
10-2
10-1
100
Baseline (m)
Visi
bilit
y
XY45 degrees
131 spectral bands uniformly spaced in wavelength between 0.5-1.8 µm Each band uses the units of W/cm2-str-µm at the top of the atmosphere Resolution of image is 1.65 cm More details elsewhere
Example Simulated Fringe Data (Noise Free)
Time (ms)
Wav
enum
ber (
1/m
) k=0
0 200 400 600 800 1000 1200 1400 1600
1.1
1.2
1.3
x 106
Time (ms)
Wav
enum
ber (
1/m
) k=1
0 200 400 600 800 1000 1200 1400 1600
1.1
1.2
1.3
x 106
Example Simulated Fringe Data (Noisy)
Time (ms)
Wav
enum
ber (
1/m
0 200 400 600 800 1000 1200 1400 1600
1.1
1.2
1.3
Wav
enum
ber (
1/m
) k=1
0 200 400 600 800 1000 1200 1400 1600
1.1
1.2
1.3
x 106
Lockheed Martin IRAD work
24
2014 NIAC Symposium 2/4/2014
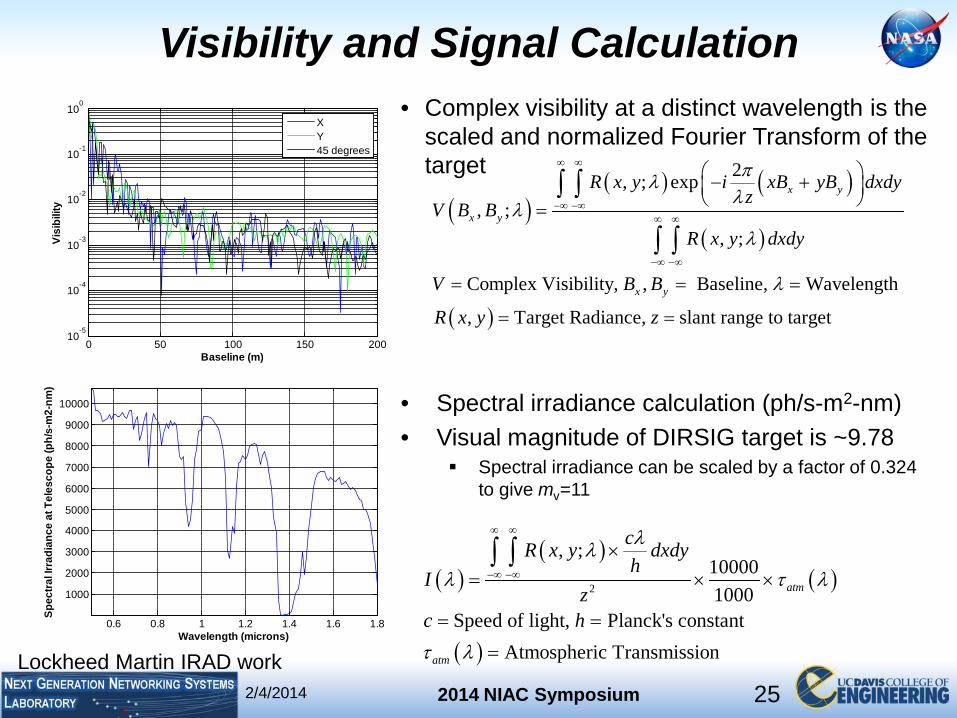
Visibility and Signal Calculation •
0 50 100 150 20010
-5
10-4
10-3
10-2
10-1
100
Baseline (m)
Visi
bilit
y
XY45 degrees
Complex visibility at a distinct wavelength is the scaled and normalized Fourier Transform of the target
( )( ) ( )
( )
2, ; exp, ;
, ;
x y
x y
R x y i xB yB dxdyz
V B BR x y dxdy
πλλ
λλ
∞ ∞
−∞ −∞∞ ∞
− +=
∫ ∫
∫ ∫
V = Complex Visibility, B Bx y, = Baseline, λ = Wavelength
R (x y, ) = Target Radiance, z = slant range to target
−∞ −∞
0.6 0.8 1 1.2 1.4 1.6 1.8
1000
2000
3000
4000
5000
6000
7000
8000
9000
10000
Spec
tral I
rrad
ianc
e at
Tel
esco
pe (p
h/s-
m2-
nm)
Wavelength (microns)
••
Spectral irradiance calculation (ph/s-m2-nm) Visual magnitude of DIRSIG target is ~9.78 Spectral irradiance can be scaled by a factor of 0.324
to give mv=11
( )( )
( )
( )
2
, ;100001000
Speed of light, Planck's constantAtmospheric Transmission
atm
atm
cR x y dxdyh
Iz
c h
λλλ τ λ
τ λ
∞ ∞
−∞ −∞
×= × ×
= =
=
∫ ∫
Lockheed Martin IRAD work 25

2014 NIAC Symposium 2/4/2014
Scene Data used for Imager Simulations Judiciary Square, Washington, D.C.
USGS High Resolution Orthoimagery (16cm GSD) Collection Date: April 2-3, 2010 Reference: This data is public domain and available from the United States Geological Survey through http://nationalmap.gov.
Lockheed Martin IRAD work 26
2014 NIAC Symposium 2/4/2014
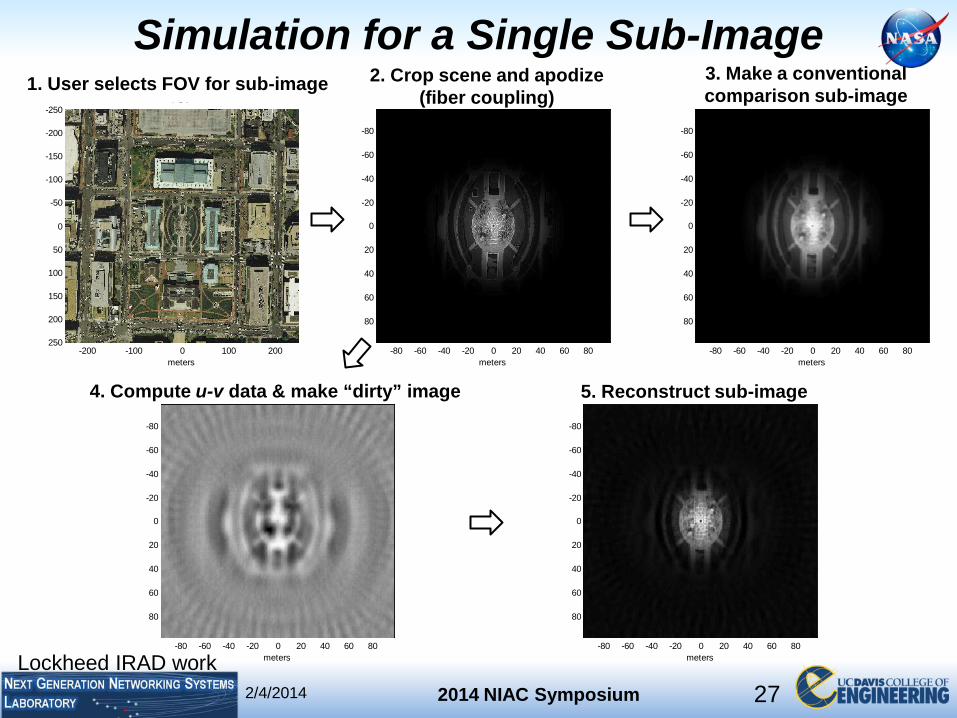
Simulation for a Single Sub-Image
meters-80 -60 -40 -20 0 20 40 60 80
-80
-6
-4
-2
2
0
0
0
0
0
40
60
80
meters
FOV
-200 -100 0 100 200
-250
-200
-150
-100
-50
0
50
100
150
200
250
meters-80 -60 -40 -20 0 20 40 60 80
-80
-60
-40
-20
0
20
40
60
80
meters-80 -60 -40 -20 0 20 40 60 80
-80
-60
-40
-20
0
20
40
60
80
meters-80 -60 -40 -20 0 20 40 60 80
-80
-60
-40
-20
0
20
40
60
80
1. User selects FOV for sub-image 2. Crop scene and apodize (fiber coupling)
3. Make a conventional comparison sub-image
4. Compute u-v data & make “dirty” image 5. Reconstruct sub-image
Lockheed IRAD work 27
2014 NIAC Symposium 2/4/2014
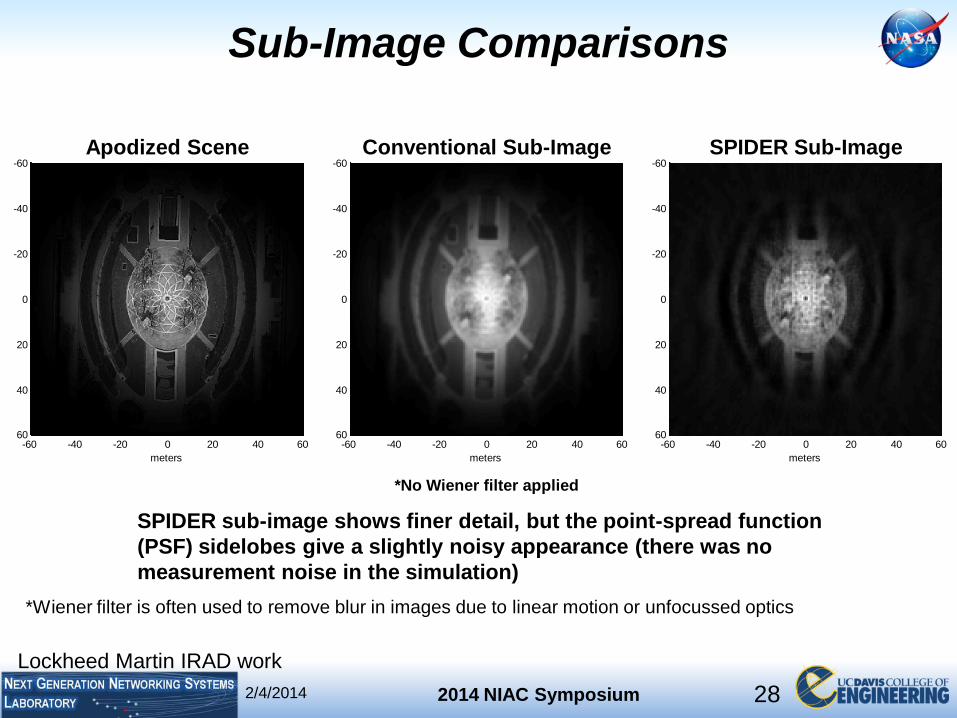
Sub-Image Comparisons
meters
Image Reconstruction
-60 -40 -20 0 20 40 60
-60
-40
-20
0
20
40
60
meters
Apodized Object Data
-60 -40 -20 0 20 40 60
-60
-40
-20
0
20
40
60
meters
Ideal Image
-60 -40 -20 0 20 40 60
-60
-40
-20
0
20
40
60
Apodized Scene Conventional Sub-Image SPIDER Sub-Image
*No Wiener filter applied
SPIDER sub-image shows finer detail, but the point-spread function (PSF) sidelobes give a slightly noisy appearance (there was no measurement noise in the simulation)
*Wiener filter is often used to remove blur in images due to linear motion or unfocussed optics
Lockheed Martin IRAD work 28
2014 NIAC Symposium 2/4/2014
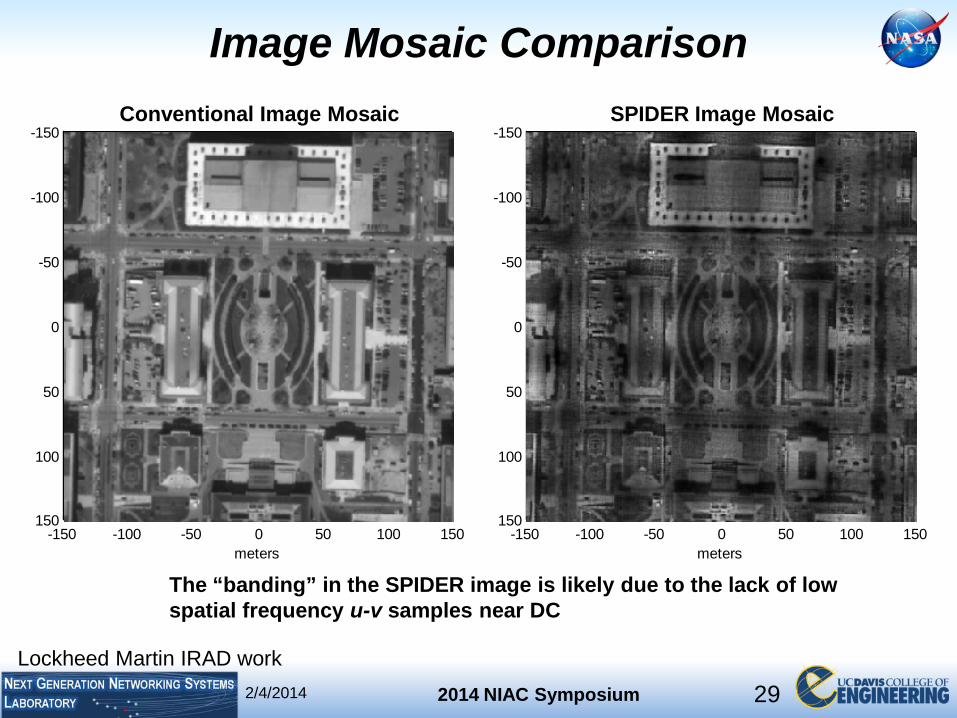
Image Mosaic Comparison
meters
Image Mosaic
-150 -100 -50 0 50 100 150
-150
-100
-50
0
50
100
150
meters
Ideal Image Mosaic
-150 -100 -50 0 50 100 150
-150
-100
-50
0
50
100
150
Conventional Image Mosaic SPIDER Image Mosaic
The “banding” in the SPIDER image is likely due to the lack of low spatial frequency u-v samples near DC
Lockheed Martin IRAD work
29
2014 NIAC Symposium 2/4/2014
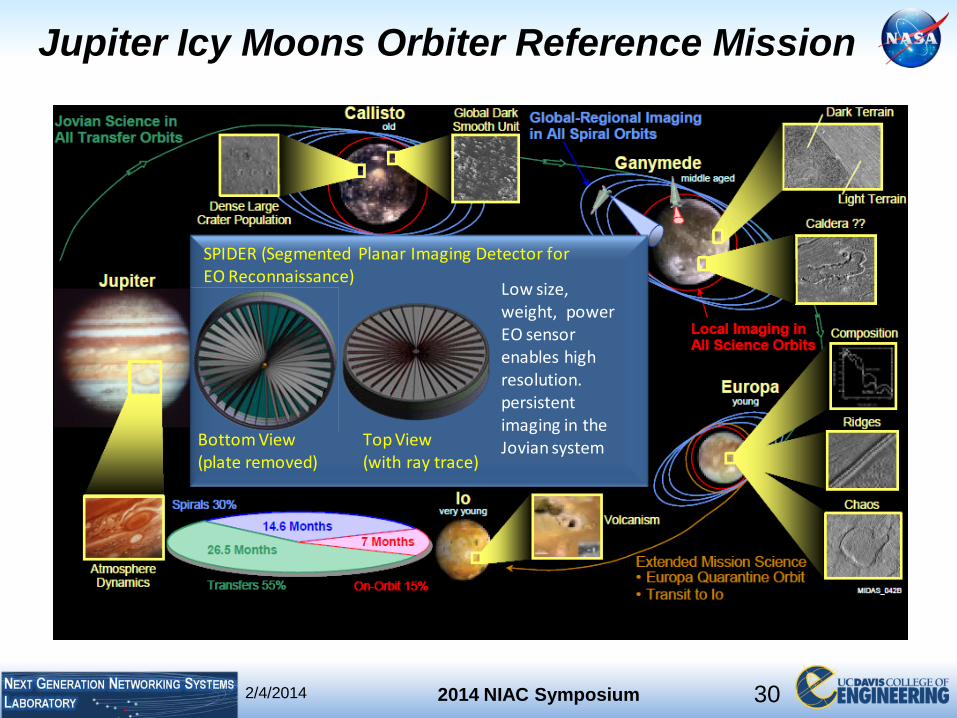
Jupiter Icy Moons Orbiter Reference Mission
SPIDER (Segmented Planar Imaging Detector for EO Reconnaissance)
Bottom View (plate removed)
Top View (with ray trace)
Low size, weight, power EO sensor enables high resolution. persistent imaging in the Jovian system
30
2014 NIAC Symposium 2/4/2014
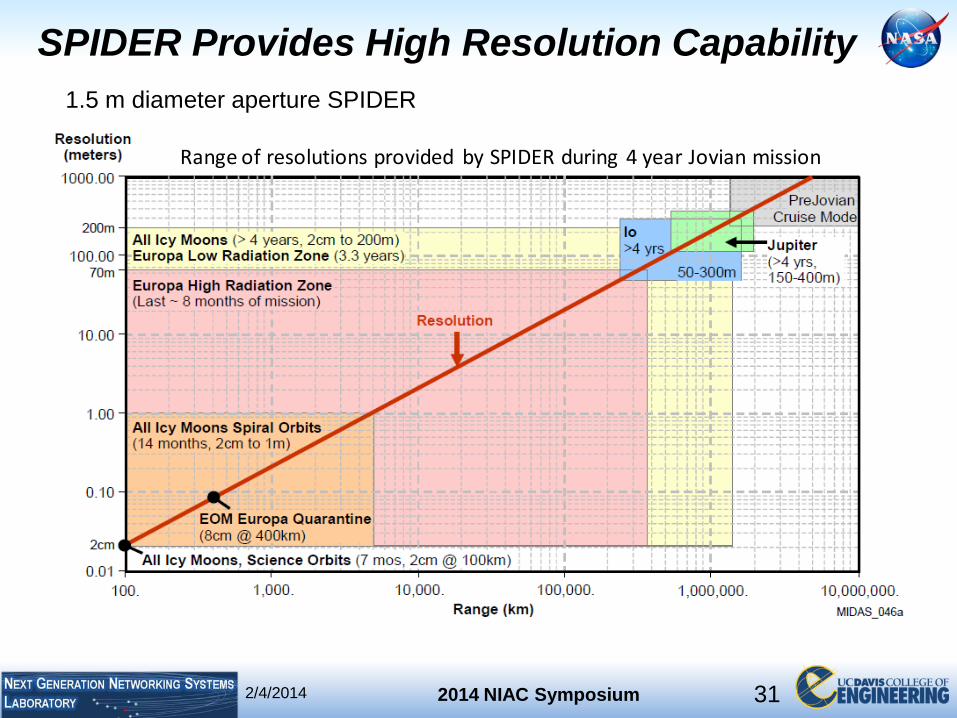
SPIDER Provides High Resolution Capability 1.5 m diameter aperture SPIDER
Range of resolutions provided by SPIDER during 4 year Jovian mission
31
2014 NIAC Symposium 2/4/2014
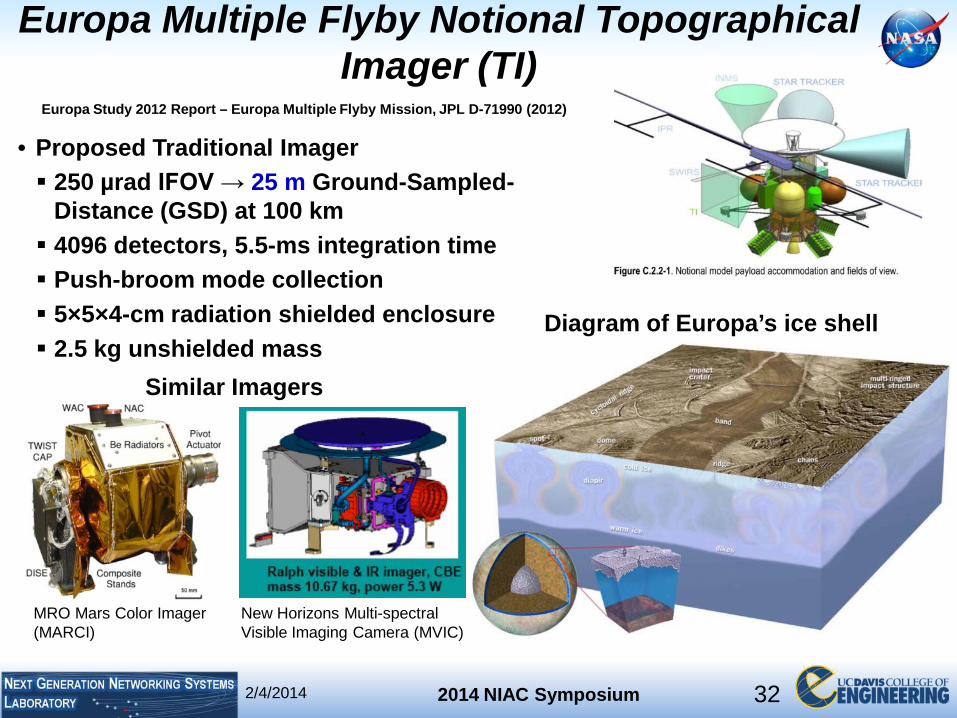
Europa Multiple Flyby Notional Topographical Imager (TI)
Europa Study 2012 Report – Europa Multiple Flyby Mission, JPL D-71990 (2012)
• Proposed Traditional Imager 250 µrad IFOV → 25 m Ground-Sampled-
Distance (GSD) at 100 km 4096 detectors, 5.5-ms integration time Push-broom mode collection 5×5×4-cm radiation shielded enclosure 2.5 kg unshielded mass
Similar Imagers
MRO Mars Color Imager (MARCI)
New Horizons Multi-spectral Visible Imaging Camera (MVIC)
Diagram of Europa’s ice shell
32

2014 NIAC Symposium 2/4/2014
SPIDER-based Topographical Imager (TI) •
SPIDER Topographical Imager 4 cm diameter aperture (same enclosure) 15 µrad IFOV → 1.5 m Ground-Sampled-Distance (GSD) at 100 km 10 Mpixel area, 150-ms integration time
For the same mass, SPIDER could collect 10× the area on ground with 17× the resolution
33
NASA Photojournal PIA00589
NASA Photojournal PIA03002
NASA Photojournal PIA01182
Europa’s Ridges

2014 NIAC Symposium 2/4/2014
Ultrahigh Resolution Integrated Spectrometers “Improved spectral observations at significantly higher spectral and spatial resolution than is presently available, together with detailed laboratory analyses under the appropriate temperature and radiation environment, are needed to fully understand Europa’s surface chemistry.”
Europa Study 2012 Report – Europa Multiple Flyby Mission, JPL D-71990 (2012)
"Fourier-transform, integrated-optic spatial heterodyne spectrometer on a silica-based planar waveguide with 1 GHz resolution" by Nicolas K. Fontaine, Katsunari Okamoto, Tiehui Su, and S. J. B. Yoo, in Optics Letters, Vol. 36, No. 16, pp. 3124-3126, August, 2011.
5 GHz Channel Spacing InP-Based 32-Channel Arrayed-Waveguide Grating" by W. Jiang, K. Okamoto, F. M. Soares, S. Lourdudoss, and S. J. B. Yoo, in OFC, Paper OWO2, 2009.
34
2014 NIAC Symposium 2/4/2014
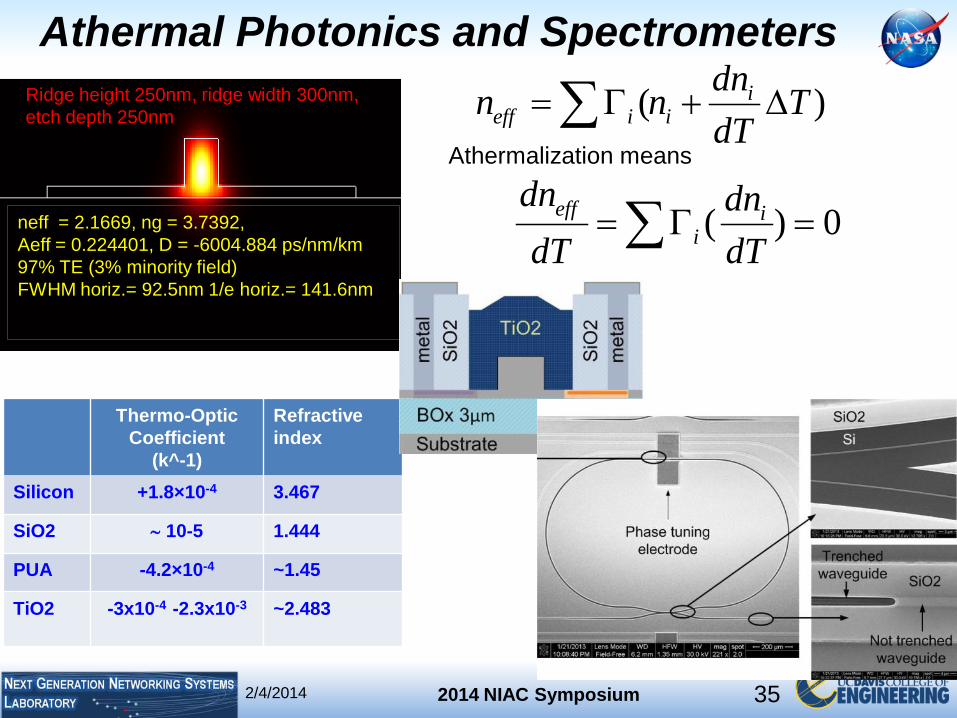
Athermal Photonics and Spectrometers
Ridge height 250nm, ridge width 300nm, etch depth 250nm
neff = 2.1669, ng = 3.7392, Aeff = 0.224401, D = -6004.884 ps/nm/km 97% TE (3% minority field) FWHM horiz.= 92.5nm 1/e horiz.= 141.6nm
( ieff i i
dnn ndT
= Γ + ∆∑
( ) 0eff ii
dn dndT dT
= Γ∑Athermalization means
)T
=
Thermo-Optic Coefficient
(k^-1)
Refractive index
Silicon +1.8×10⁻⁴ 3.467
SiO2 ∼ 10-5 1.444
PUA -4.2×10⁻⁴ ~1.45
TiO2 -3x10⁻⁴ -2.3x10⁻³ ~2.483
35

2014 NIAC Symposium 2/4/2014
Athermal Photonics and Spectrometers e.g. Silicon Photonic Resonator with TiO2 overcladding
Ring resonator with 250nm wide waveguide
Blue shift -11.3 pm/°C (+1.41 GHz/°C)
Blue shift -1.60 pm/°C (+0.20 GHz/°C)
36

2014 NIAC Symposium 2/4/2014
Identifying Compounds on Europa “Notional reflectance spectra for ice-rich regions (blue curves) and ice-poor regions (red curves) on Europa … in the 1–5 µm spectral range.”
Europa Study 2012 Report – Europa Multiple Flyby Mission, JPL D-71990 (2012)
37
2014 NIAC Symposium 2/4/2014
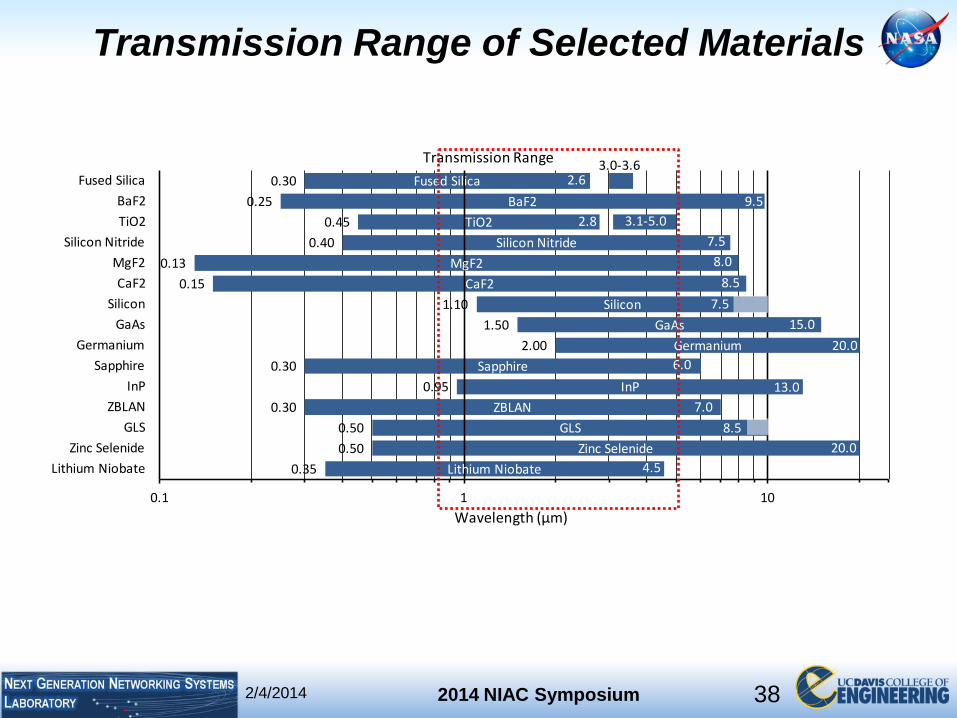
Transmission Range of Selected Materials
0.300.25
0.450.40
0.130.15
1.101.50
2.000.30
0.950.30
0.500.50
0.35
Fused SilicaBaF2
TiO2Silicon Nitride
MgF2CaF2
SiliconGaAs
GermaniumSapphire
InPZBLAN
GLSZinc Selenide
Lithium Niobate
0.1 1 10
Fused SilicaBaF2TiO2
Silicon NitrideMgF2CaF2
SiliconGaAs
GermaniumSapphire
InPZBLAN
GLSZinc Selenide
Lithium Niobate
Wavelength (µm)
Transmission Range 3.0-3.62.6
7.58.0
8.5
15.020.0
20.0
6.013.0
3.1-5.02.89.5
8.57.0
7.5
4.5
38
Thank you for support
NASA Photojournal PIA03002

2/ 2014 NIAC Symposium 4/2014
ID Task Objective Benefit 1 Develop radiometry
model of Europa Provide input data to address required integration times for a realistic mission scenario (Europa Clipper).
Anchor results to a specific mission of interest (relevant to a broad class of “icy moons” type missions).
2 Develop SPIDER design Tailor our design for the Europa Clipper reference mission to show potential and identify key technologies.
Showcase low cost and SWaP.
3 Evaluate various PIC material platforms and architectures
Provide data on waveguide coupling efficiencies and device losses to improve SPIDER model
Quantifies performance limitations due to current technology constraints.
4 Develop image reconstruction algorithm
Adapt existing algorithms to optimize performance for Europa reference mission.
Increases fidelity of critical algorithm required to generate science products.
5 Develop SPIDER model (predict raw signal characteristics including SNR)
Provide realistic data to enable high fidelity predictions of sensor performance.
Addresses performance limitations due to fundamental physics constraints.
6 Perform image simulations and evaluate predicted performance
Provide quantitative performance predictions to assess feasibility of meeting science goals.
Forms the basis for scaling design and performance to a broad class of imaging missions.
7 Develop a technology roadmap
Identify technology needs and provide a roadmap to guide further investigation and to show where there is significant leverage of existing technology.
Minimize development cost by leveraging Lockheed Martin IRAD, commercial industry and DARPA investments.
40