lowell substation noise assessmentexisting transformer with a 30/40/50 mva autotransformer with...
TRANSCRIPT
GREEN MOUNTAIN POWER
LOWELL SUBSTATION NOISE ASSESSMENT
Report │ July 22, 2019
55 Railroad Row White River Junction, VT 05001
802.295.4999 www.rsginc.com
PREPARED FOR: GREEN MOUNTAIN POWER
SUBMITTED BY:
RSG


Green Mountain Power
LOWELL SUBSTATION NOISE ASSESSMENT
i
CONTENTS 1.0 EXECUTIVE SUMMARY .................................................................... 1
2.0 INTRODUCTION ................................................................................ 3
3.0 PROJECT DESCRIPTION ................................................................. 4
4.0 SOUND LEVEL MEASUREMENTS ................................................... 7
4.1 VEC SUBSTATION FENCE-LINE SURVEY ............................................7
4.2 GMP SUBSTATION FENCE-LINE SURVEY ...........................................8
4.3 VEC SUBSTATION TRANSFORMER SURVEY .................................... 10
4.4 GMP SUBSTATION TRANSFORMER SURVEY ................................... 10
4.5 LONG-TERM MONITORING ................................................................. 11
LONG-TERM MONITORING LOCATIONS........................................... 11
RESULTS AT MONITOR A – SUBSTATION SOUTH FENCE LINE ...................................................................................................... 14
RESULTS AT MONITOR B – PROPERTY LINE .................................. 16
5.0 SOUND PROPAGATION MODELING ............................................. 20
5.1 MODELING METHODOLOGY AND INPUT PARAMETERS ................. 20
5.2 TRANSFORMER SOURCE SOUND POWER LEVELS ........................ 20
5.3 MODELING RESULTS .......................................................................... 21
6.0 CONCLUSIONS ............................................................................... 27
APPENDIX A. SOUND MODEL PARAMETERS ................................... 28
APPENDIX B. RECEIVER TABLE......................................................... 29
APPENDIX C. A PRIMER ON SOUND AND SOUND LEVELS ............ 31
ii
LIST OF FIGURES
FIGURE 1: SITE PLAN OF PROPOSED SUBSTATION ................................................... 5 FIGURE 2: OVERVIEW OF LOWELL SUBSTATIONS AND SURROUNDING
AREA ......................................................................................................................... 6 FIGURE 3: SOUND LEVELS MEASURED AROUND THE FENCE OF THE
CURRENT VEC SUBSTATION (BLUE=ONAN, RED=ONAF) ................................... 8 FIGURE 4: SOUND LEVELS, IN DBA, MEASURED AROUND THE FENCES
OF THE ORIGINAL GMP (FORMERLY CVPS) AND VEC SUBSTATIONS IN 2010 (ONAN ONLY) .............................................................................................. 9
FIGURE 5: LONG-TERM MONITORING LOCATIONS .................................................... 12 FIGURE 6: SOUND MONITOR ALONG THE GMP SUBSTATION SOUTH
FENCE LINE ............................................................................................................ 13 FIGURE 7: MONITOR B, ON THE PROPERTY LINE BETWEEN THE
NEAREST RESIDENCE AND THE HAYFIELD ....................................................... 13 FIGURE 8: GMP SUBSTATION SOUND LEVELS AND WIND SPEED DURING
LONG-TERM MONITORING .................................................................................... 14 FIGURE 9: FREQUENCY SPECTRUM, GMP SUBSTATION FENCE, DURING
THE QUIETEST 10-MINUTE BACKGROUND PERIOD .......................................... 15 FIGURE 10: 1/3 OCTAVE BAND PROMINENCE AT THE GMP SUBSTATION
FENCE DURING THE QUIETEST 10-MINUTE BACKGROUND PERIOD ............... 16 FIGURE 11: PROPERTY LINE SOUND LEVELS AND WIND SPEEDS DURING
LONG-TERM MONITORING .................................................................................... 17 FIGURE 12: FREQUENCY SPECTRUM, PROPERTY LINE, DURING THE
QUIETEST 10-MINUTE BACKGROUND PERIOD................................................... 18 FIGURE 13: 1/3 OCTAVE BAND PROMINENCE AT THE PROPERTY LINE
DURING THE QUIETEST 10-MINUTE BACKGROUND PERIOD ............................ 19 FIGURE 14: ISO-CONTOURS OF EQUAL SOUND PRESSURE LEVEL,
EXISTING GMP AND VEC TRANSFORMERS, ONAN ............................................ 23 FIGURE 15: ISO-CONTOURS OF EQUAL SOUND PRESSURE LEVEL,
EXISTING GMP AND VEC TRANSFORMERS, ONAF ............................................ 24 FIGURE 16: ISO-CONTOURS OF EQUAL SOUND PRESSURE LEVEL,
PROPOSED GMP TRANSFORMER AND EXISTING VEC TRANSFORMER, ONAN ......................................................................................... 25
FIGURE 17: ISO-CONTOURS OF EQUAL SOUND PRESSURE LEVEL, PROPOSED GMP TRANSFORMER, ONAF, AND EXISTING VEC TRANSFORMER, ONAF.......................................................................................... 26
FIGURE 18: LOCATION ID'S OF RESIDENCES AND SENSITIVE LOCATIONS ........... 30 FIGURE 19: A SCALE OF SOUND PRESSURE LEVELS FOR TYPICAL
NOISE SOURCES. .................................................................................................. 34 FIGURE 20: EXAMPLE OF DESCRIPTIVE TERMS OF SOUND
MEASUREMENT OVER TIME ................................................................................. 35
LIST OF TABLES
TABLE 1: SOUND POWER LEVEL SPECTRA MEASURED FOR EXISTING VEC TRANSFORMER ............................................................................................. 10
TABLE 2: SOUND POWER LEVEL SPECTRA MEASURED FOR EXISTING GMP TRANSFORMER ............................................................................................ 10
TABLE 3: MONITOR A, SUBSTATION – STATISTICAL SOUND LEVELS, A-WEIGHTED .............................................................................................................. 15
TABLE 4: MONITOR B, PROPERTY LINE - STATISTICAL SOUND LEVELS, A-WEIGHTED .......................................................................................................... 17
TABLE 5: RELATIVE SOUND PRESSURE LEVEL SPECTRA AND “NEMA-10” GOAL ................................................................................................................ 22
TABLE 6: SOUND POWER LEVELS FOR PROPOSED GMP TRANSFORMER ............ 22 TABLE 7: ACOUSTICAL PROPAGATION MODEL INPUT PARAMETERS ................... 28 TABLE 8: OVERALL SOUND LEVELS PREDICTED AT EACH SENSITIVE
LOCATION IN THE MODEL; ALL SOUND LEVELS ARE A-WEIGHTED DECIBELS (DBA) .................................................................................................... 29

Lowell Substation Noise Assessment
1
1.0 EXECUTIVE SUMMARY
This report is a preconstruction noise impact assessment in preparation for reconstruction of
Green Mountain Power’s substation in Lowell, Vermont.
The proposed construction will include increasing the area of the substation and replacing the
existing transformer with a 30/40/50 MVA autotransformer with auxiliary cooling. The proposed
transformer will be located about 14 m (45 ft) to the north of the existing transformer location, 87
m (285 ft) from the nearest residence at 2306 VT Route 100, and 156 m (540 ft) across the
street from the Lowell Village School.
RSG conducted short-term sound level measurements around the current VEC substation
fence-line, and a separate measurement had been made around the original GMP and VEC
substations in 2010. These results can be used to compare with the final installation of the
proposed GMP substation, if needed.
RSG conducted long-term sound level monitoring from October 27 through November 5, 2015
to establish baseline ambient sound levels. Two locations were monitored: along the south
fence line of the substation and at the property line of the nearest single-family residence. The
nighttime L90 at the substation south fence was 45 dBA. The lowest nighttime sound there is
dominated by the existing GMP transformer hum in the 125 Hz and 250 Hz 1/3 octave bands.
The nighttime L90 at the substation property line with the closest residence was 35 dBA. This
sound was not tonal under the ANSI S12.9 Part 3 standard, as it included background sounds
from other sources as well as the substation.
RSG modeled substation sound in the area surrounding the proposed substation expansion.
Sound power levels of the existing GMP and VEC transformers were measured, with each
transformer operating in both ONAN (fans off) and ONAF (fans on) cooling modes. These
results were used as source sound levels in the sound propagation model of the existing sites.
Sound power levels for the proposed transformer were based on GMP’s specification that the
proposed autotransformer emit sound 10 dB below the NEMA TR-1. This is approximately 3.8
dB and 0.4 dB lower than the existing GMP transformer under ONAN and ONAF cooling,
respectively. The model estimated resulting sound levels at 11 residences, one school, and
Town Hall in the vicinity of the substation.
In combination with the existing VEC transformer, the proposed results in an average decrease
of sound levels at the surrounding sensitive locations of approximately 3 dB and 4 dB for ONAN
and ONAF cooling modes, respectively. The highest sound level due to the proposed
transformer (in combination with the VEC transformer) at any residence was estimated to be 37
dBA at 2306 VT Rt. 100. The sound level at the Lowell Village School was estimated to be 27

Green Mountain Power
2
dBA. These cases only occur if both the VEC transformer and proposed GMP transformer
operate in ONAF cooling (with fans running).
The existing transformer is not tonal at the nearby property line as monitored, next to 2419 VT
Rt. 100. Since the proposed transformer will be 3 dB quieter than the existing unit, the proposed
substation is not anticipated to be tonal at any sensitive receiver.
Given the overall decrease in sound estimated from the proposed substation, there will be no
adverse impact on the surrounding neighborhood due to noise from the proposed substation.

Lowell Substation Noise Assessment
3
2.0 INTRODUCTION
Green Mountain Power (GMP) is proposing reconstruction of its substation located at 2337 VT
Route 100 in Lowell, Vermont. The footprint will increase and the transformer will be replaced
and moved about 14 m (45 ft) to the north. The new equipment is expected to reduce the sound
emitted by the substation during operations compared with the current substation.
In preparation for a Public Utility Commission (PUC) filing per Vermont Section 248, GMP
requested that RSG perform a noise impact assessment of the existing substation and the
proposed changes. Included in this report are:
• A description of the proposed substation;
• Sound level monitoring methodology;
• Sound level monitoring results;
• Sound propagation modeling methodology;
• Sound propagation modeling results.
Appendix A summarizes the model input parameters, and Appendix B lists the sound levels
estimated at the closest sensitive locations. A primer on sound is that explains the acoustical
terminology used in this report is included as Appendix C.

Green Mountain Power
4
3.0 PROJECT DESCRIPTION
The GMP Lowell substation is located in Lowell, Vermont east of VT Route 100, about 475 m
(1,560 ft) north of the intersection with VT Route 58. It is in proximity to another substation
operated by Vermont Electric Cooperative (VEC).
The substation currently operates a transformer with the following ratings:
• Power: 15/20/22.4 MVA at 55°C/55°C/65°C temperature rise;
• Voltage: 43.8 kV - 34.5 kV
• BIL: 250 kV (high side), 200 kV (low side).
Proposed changes to the substation include:
• Expansion of the substation footprint;
• Removal of the existing transformer
• Installation of a new transformer and auxiliary equipment.
The new transformer will have the following ratings:
• Power: 30/40/50 MVA at 55°C temperature rise and 33.6/44.8/56 MVA at 65°C
temperature rise;
• Voltage: 46 kV - 34.5 kV;
• BIL: 250 kV (high side), 200 kV (low side).
Figure 1 shows a simplified schematic of the proposed layout. The existing VEC Lowell
substation is shown to the north, and the proposed GMP substation is shown to the south. The
existing GMP substation is shown by the polygon-shaped fence on the southern portion of the
proposed substation. Aerial imagery of the area around the existing site is shown in Figure 2.
The proposed transformer will be located 87 m (285 ft) from the nearest residence at 2306 VT
Rt. 100, and 156 m (540 ft) from the Lowell Village School.
The area surrounding the substation is mixed-use, with residences, small commercial
establishments, the Lowell Village School, active agricultural fields, and forested areas. Sound
in the area is dominated by vehicular traffic on VT Rt. 100 and occasional agricultural machinery
operations. With the exception of these sound sources, the area is mixed residential/rural.

Lowell Substation Noise Assessment
5
FIGURE 1: SITE PLAN OF PROPOSED SUBSTATION1
1 Schematic abstracted from Site Plan prepared by GMP, July 2019.

Green Mountain Power
6
FIGURE 2: OVERVIEW OF LOWELL SUBSTATIONS AND SURROUNDING AREA
Lowell Substation Noise Assessment
7
4.0 SOUND LEVEL MEASUREMENTS
To characterize the existing soundscape at the GMP Lowell Substation, four sets of sound level
measurements were conducted:
• A sound survey around the fence-line of the existing VEC substation is described in
Section 4.1;
• A sound survey of the existing VEC transformer is described in Section 4.2;
• A sound survey of the existing GMP transformer is described in Section 4.3;
• Long-term sound level measurements were made at two locations near the existing
substation for one week. These are described in Sections 4.4. Long-term sound
measurements are intended to establish a baseline for the existing ambient sound levels
in the community.
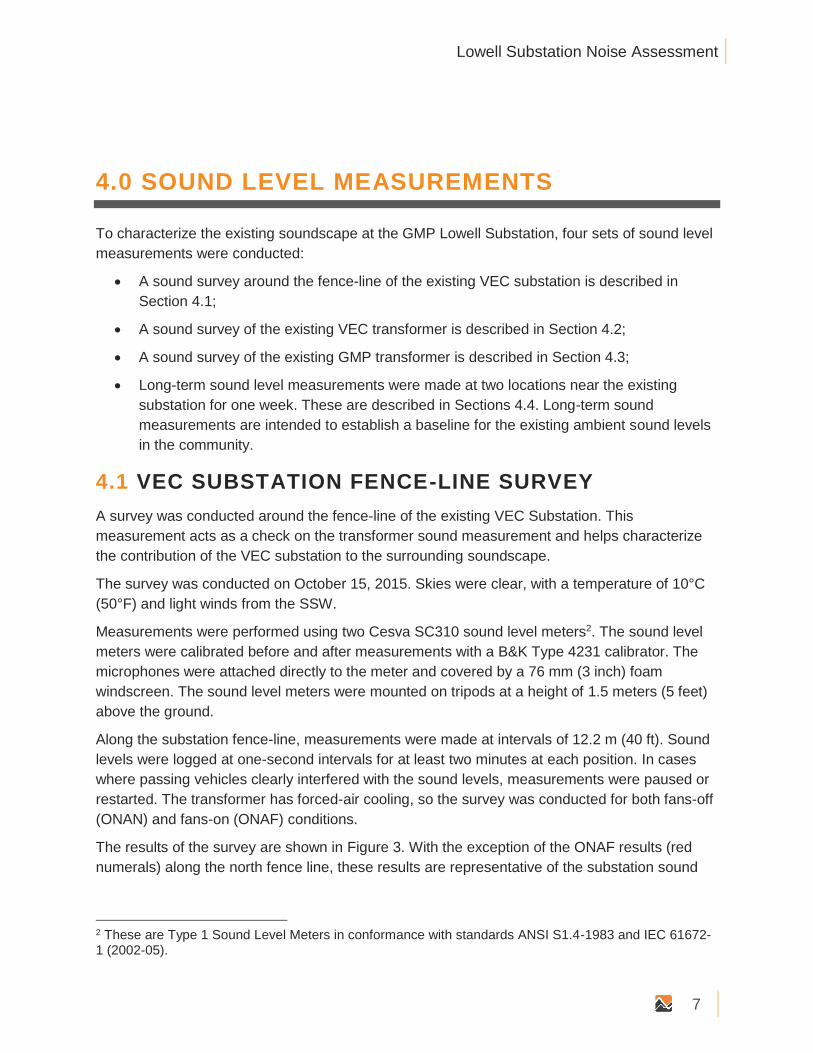
4.1 VEC SUBSTATION FENCE-LINE SURVEY
A survey was conducted around the fence-line of the existing VEC Substation. This
measurement acts as a check on the transformer sound measurement and helps characterize
the contribution of the VEC substation to the surrounding soundscape.
The survey was conducted on October 15, 2015. Skies were clear, with a temperature of 10°C
(50°F) and light winds from the SSW.
Measurements were performed using two Cesva SC310 sound level meters2. The sound level
meters were calibrated before and after measurements with a B&K Type 4231 calibrator. The
microphones were attached directly to the meter and covered by a 76 mm (3 inch) foam
windscreen. The sound level meters were mounted on tripods at a height of 1.5 meters (5 feet)
above the ground.
Along the substation fence-line, measurements were made at intervals of 12.2 m (40 ft). Sound
levels were logged at one-second intervals for at least two minutes at each position. In cases
where passing vehicles clearly interfered with the sound levels, measurements were paused or
restarted. The transformer has forced-air cooling, so the survey was conducted for both fans-off
(ONAN) and fans-on (ONAF) conditions.
The results of the survey are shown in Figure 3. With the exception of the ONAF results (red
numerals) along the north fence line, these results are representative of the substation sound
2 These are Type 1 Sound Level Meters in conformance with standards ANSI S1.4-1983 and IEC 61672-1 (2002-05).
Green Mountain Power
8
levels. The ONAF measurements to the north were contaminated with traffic noise from VT
Route 100.
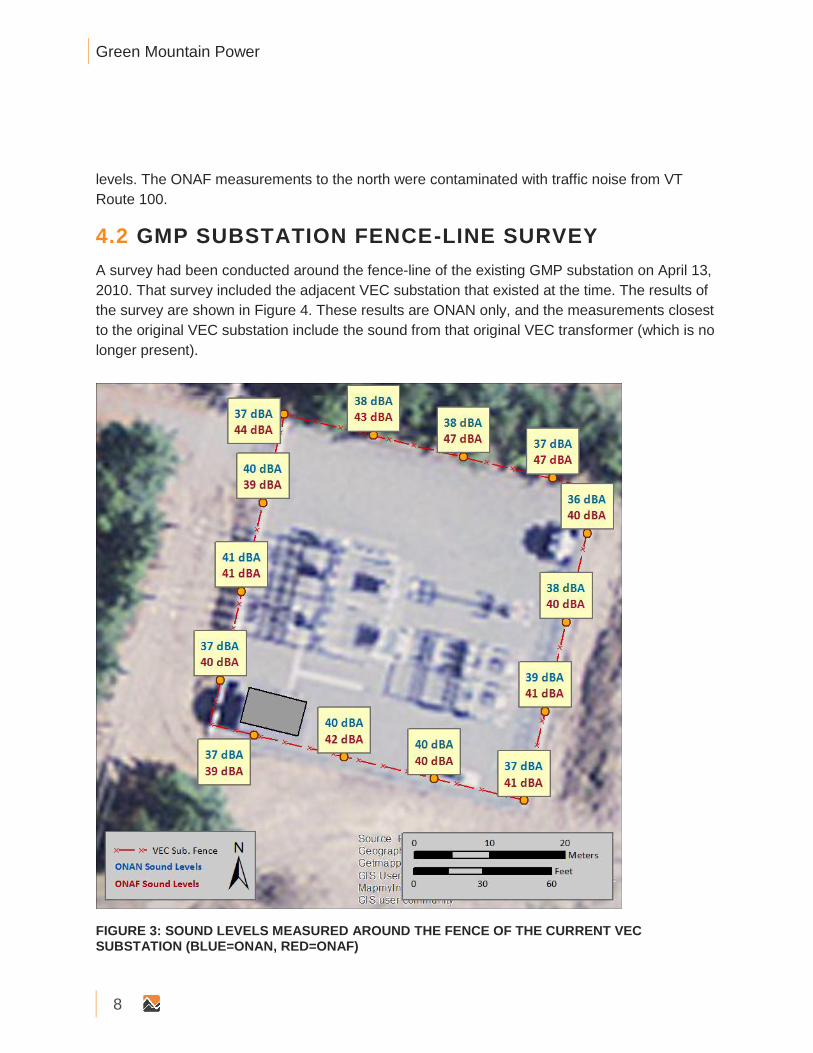
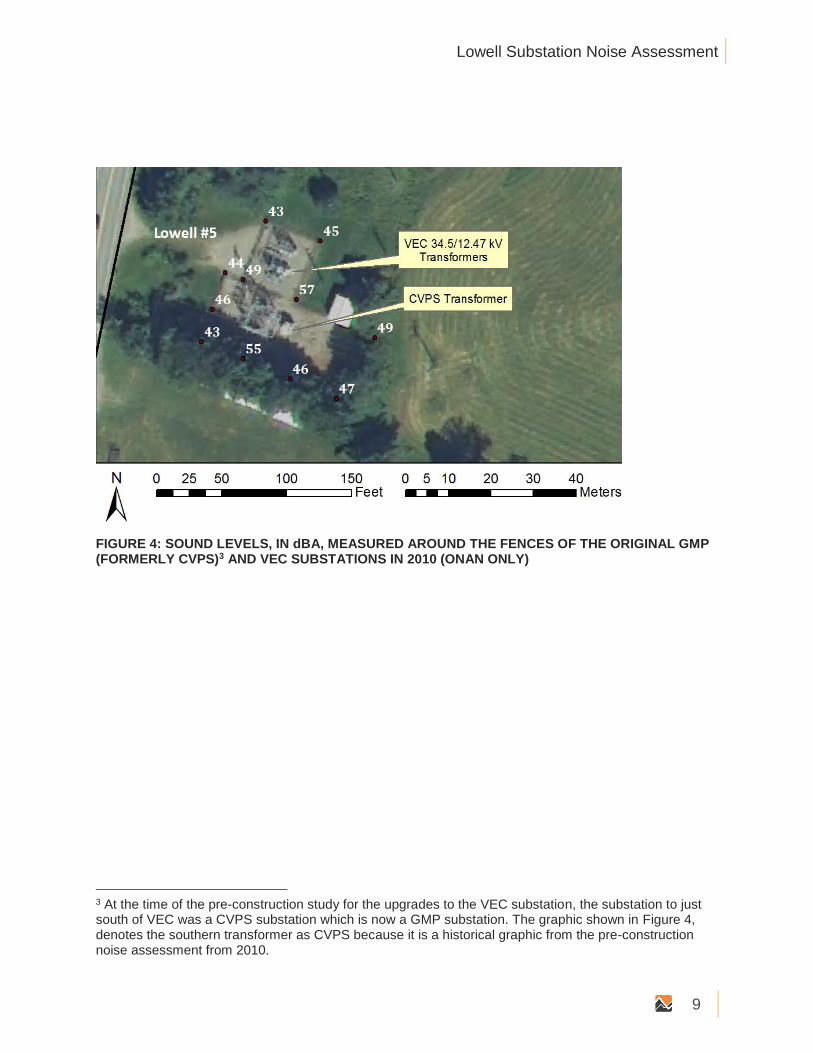
4.2 GMP SUBSTATION FENCE-LINE SURVEY
A survey had been conducted around the fence-line of the existing GMP substation on April 13,
2010. That survey included the adjacent VEC substation that existed at the time. The results of
the survey are shown in Figure 4. These results are ONAN only, and the measurements closest
to the original VEC substation include the sound from that original VEC transformer (which is no
longer present).
FIGURE 3: SOUND LEVELS MEASURED AROUND THE FENCE OF THE CURRENT VEC SUBSTATION (BLUE=ONAN, RED=ONAF)
Lowell Substation Noise Assessment
9
FIGURE 4: SOUND LEVELS, IN dBA, MEASURED AROUND THE FENCES OF THE ORIGINAL GMP (FORMERLY CVPS)3 AND VEC SUBSTATIONS IN 2010 (ONAN ONLY)
3 At the time of the pre-construction study for the upgrades to the VEC substation, the substation to just south of VEC was a CVPS substation which is now a GMP substation. The graphic shown in Figure 4, denotes the southern transformer as CVPS because it is a historical graphic from the pre-construction noise assessment from 2010.
Green Mountain Power
10
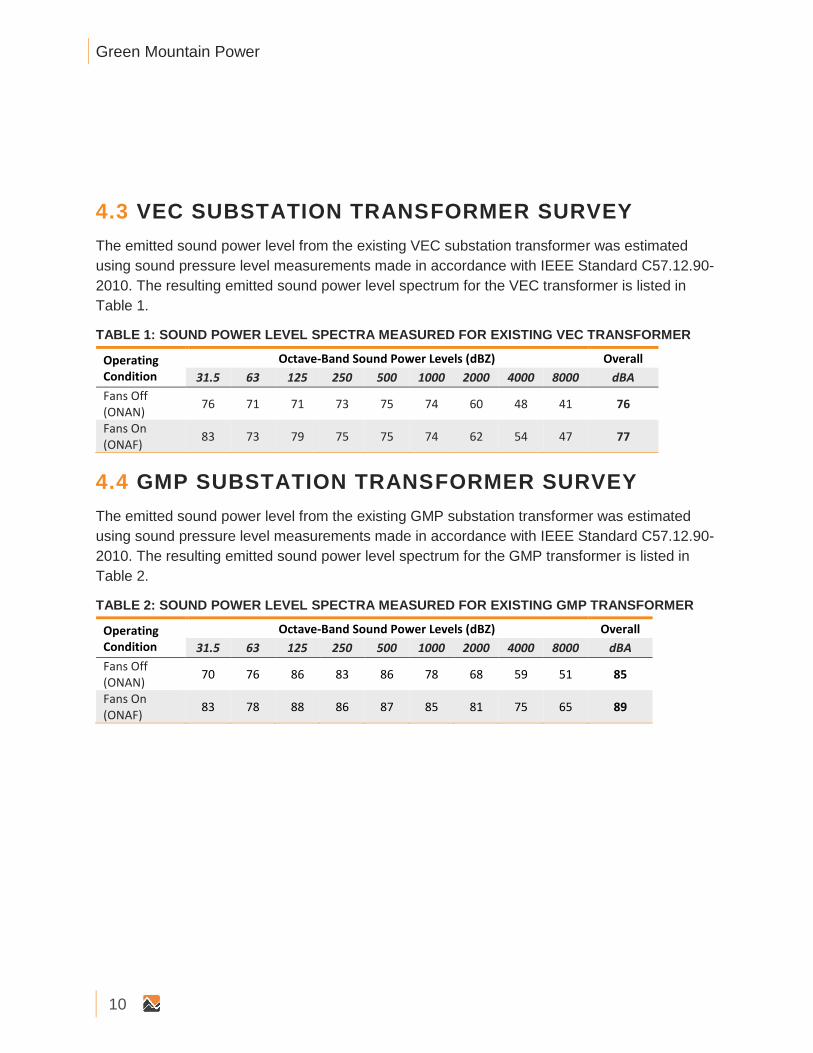
4.3 VEC SUBSTATION TRANSFORMER SURVEY
The emitted sound power level from the existing VEC substation transformer was estimated
using sound pressure level measurements made in accordance with IEEE Standard C57.12.90-
2010. The resulting emitted sound power level spectrum for the VEC transformer is listed in
Table 1.
TABLE 1: SOUND POWER LEVEL SPECTRA MEASURED FOR EXISTING VEC TRANSFORMER
Operating Condition
Octave-Band Sound Power Levels (dBZ) Overall
31.5 63 125 250 500 1000 2000 4000 8000 dBA
Fans Off (ONAN)
76 71 71 73 75 74 60 48 41 76
Fans On (ONAF)
83 73 79 75 75 74 62 54 47 77
4.4 GMP SUBSTATION TRANSFORMER SURVEY
The emitted sound power level from the existing GMP substation transformer was estimated
using sound pressure level measurements made in accordance with IEEE Standard C57.12.90-
2010. The resulting emitted sound power level spectrum for the GMP transformer is listed in
Table 2.
TABLE 2: SOUND POWER LEVEL SPECTRA MEASURED FOR EXISTING GMP TRANSFORMER
Operating Condition
Octave-Band Sound Power Levels (dBZ) Overall
31.5 63 125 250 500 1000 2000 4000 8000 dBA
Fans Off (ONAN)
70 76 86 83 86 78 68 59 51 85
Fans On (ONAF)
83 78 88 86 87 85 81 75 65 89
Lowell Substation Noise Assessment
11
4.5 LONG-TERM MONITORING
Long-term measurements, i.e. lasting more than one day, are used to establish a baseline
sound level around the facility. Long-term measurements were performed at two locations from
October 27 through November 4, 2015. Monitoring locations are shown in Figure 5.
Each location was instrumented with a Cesva SC310 sound level meter.4 The two meters
logged A-weighted and 1/3-octave band sound levels once per second. Each microphone was
mounted remotely to a wooden stake, approximately 1.2 meters (4 feet) above ground, and
equipped with a 180 mm (7 inch) ACO Pacific hydrophobic windscreen. The audio signal
received by each sound level meter was recorded continuously over the monitoring period with
a Roland R-05 digital recorder.
The property line monitor included a HOBO MicroStation anemometer and thermometer, each
mounted on a wooden stake approximately 1.5 meters (5 feet) above ground. Average wind
speeds and maximum gust speeds were recorded at one-minute intervals.
Temperatures over the monitoring period ranged from -5° C (23° F) to 18.6° C (65° F). The
maximum recorded wind gust during monitoring was 11.1 m/s (24.8 mph). There were periods
with precipitation on October 28, 29 and 30 and November 1.5 Post-measurement analyses
excluded sound levels taken during periods of precipitation and during periods when wind gusts
exceeded 5 m/s (11 mph).6 Temperatures were above the minimum equipment limit of -10° C
(14° F) throughout the monitoring period.
Long-Term Monitoring Locations
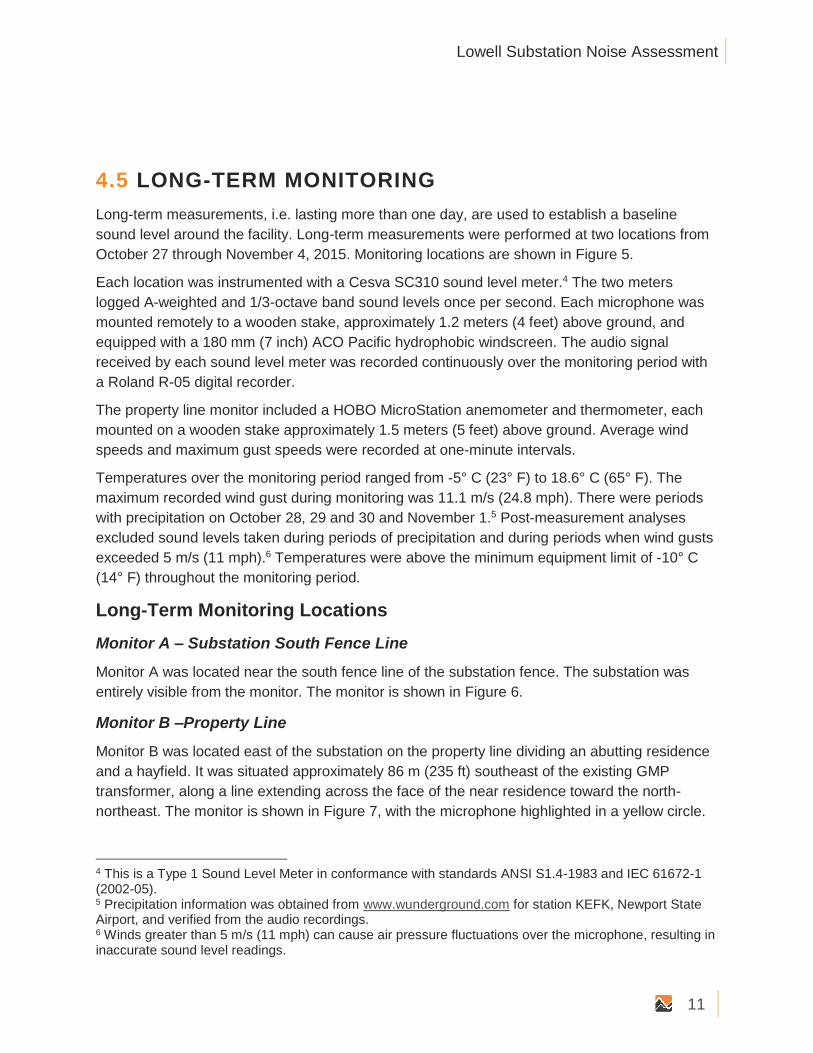
Monitor A – Substation South Fence Line
Monitor A was located near the south fence line of the substation fence. The substation was
entirely visible from the monitor. The monitor is shown in Figure 6.
Monitor B –Property Line
Monitor B was located east of the substation on the property line dividing an abutting residence
and a hayfield. It was situated approximately 86 m (235 ft) southeast of the existing GMP
transformer, along a line extending across the face of the near residence toward the north-
northeast. The monitor is shown in Figure 7, with the microphone highlighted in a yellow circle.
4 This is a Type 1 Sound Level Meter in conformance with standards ANSI S1.4-1983 and IEC 61672-1 (2002-05). 5 Precipitation information was obtained from www.wunderground.com for station KEFK, Newport State Airport, and verified from the audio recordings. 6 Winds greater than 5 m/s (11 mph) can cause air pressure fluctuations over the microphone, resulting in inaccurate sound level readings.

Green Mountain Power
12
FIGURE 5: LONG-TERM MONITORING LOCATIONS

Lowell Substation Noise Assessment
13
FIGURE 6: SOUND MONITOR ALONG THE GMP SUBSTATION SOUTH FENCE LINE
FIGURE 7: MONITOR B, ON THE PROPERTY LINE BETWEEN THE NEAREST RESIDENCE AND THE HAYFIELD

Green Mountain Power
14
Results at Monitor A – Substation South Fence Line
Sound levels and wind speeds at the GMP substation fence are plotted in Figure 8. The sound
levels are equivalent-continuous levels (LEQ) and 10th percentile levels (L90) in 10-minute
intervals. Gaps in the traces occur where data were excluded due to wind gusts and rainfall.
Period-long statistical sound levels (A-weighted) are listed in Table 3. The sound levels do not
vary greatly in close proximity to the substation due to the prominence of the transformer sound
emissions.
The frequency spectrum of sound measured at the GMP substation fence during the quietest
10-minute interval is plotted in Figure 9, where it is compared with the threshold of audibility
(from ISO 389-7). The 120 Hz and 240 Hz transformer tones are evident in the spectrum in the
125 Hz and 250 Hz 1/3-octave bands. The prominence of each band is compared to the tonality
criteria of ANSI 12.9-4 in Figure 10. The sound emitted by the transformer is tonal at this close
proximity.
FIGURE 8: GMP SUBSTATION SOUND LEVELS AND WIND SPEED DURING LONG-TERM MONITORING

Lowell Substation Noise Assessment
15
TABLE 3: MONITOR A, SUBSTATION – STATISTICAL SOUND LEVELS, A-WEIGHTED
Time Period Leq L90 L50 L10
Total Period 49 45 46 52
Day 50 46 47 53
Night 47 45 46 48
FIGURE 9: FREQUENCY SPECTRUM, GMP SUBSTATION FENCE, DURING THE QUIETEST 10-MINUTE BACKGROUND PERIOD
Green Mountain Power
16
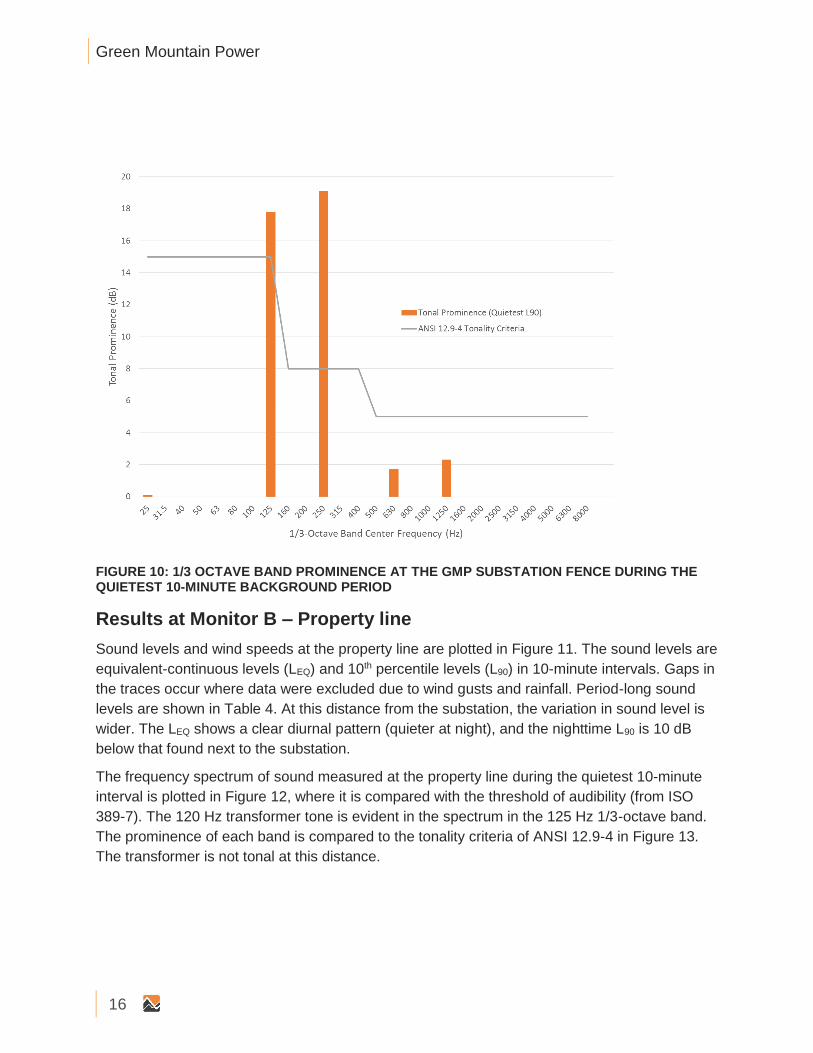
FIGURE 10: 1/3 OCTAVE BAND PROMINENCE AT THE GMP SUBSTATION FENCE DURING THE QUIETEST 10-MINUTE BACKGROUND PERIOD
Results at Monitor B – Property line
Sound levels and wind speeds at the property line are plotted in Figure 11. The sound levels are
equivalent-continuous levels (LEQ) and 10th percentile levels (L90) in 10-minute intervals. Gaps in
the traces occur where data were excluded due to wind gusts and rainfall. Period-long sound
levels are shown in Table 4. At this distance from the substation, the variation in sound level is
wider. The LEQ shows a clear diurnal pattern (quieter at night), and the nighttime L90 is 10 dB
below that found next to the substation.
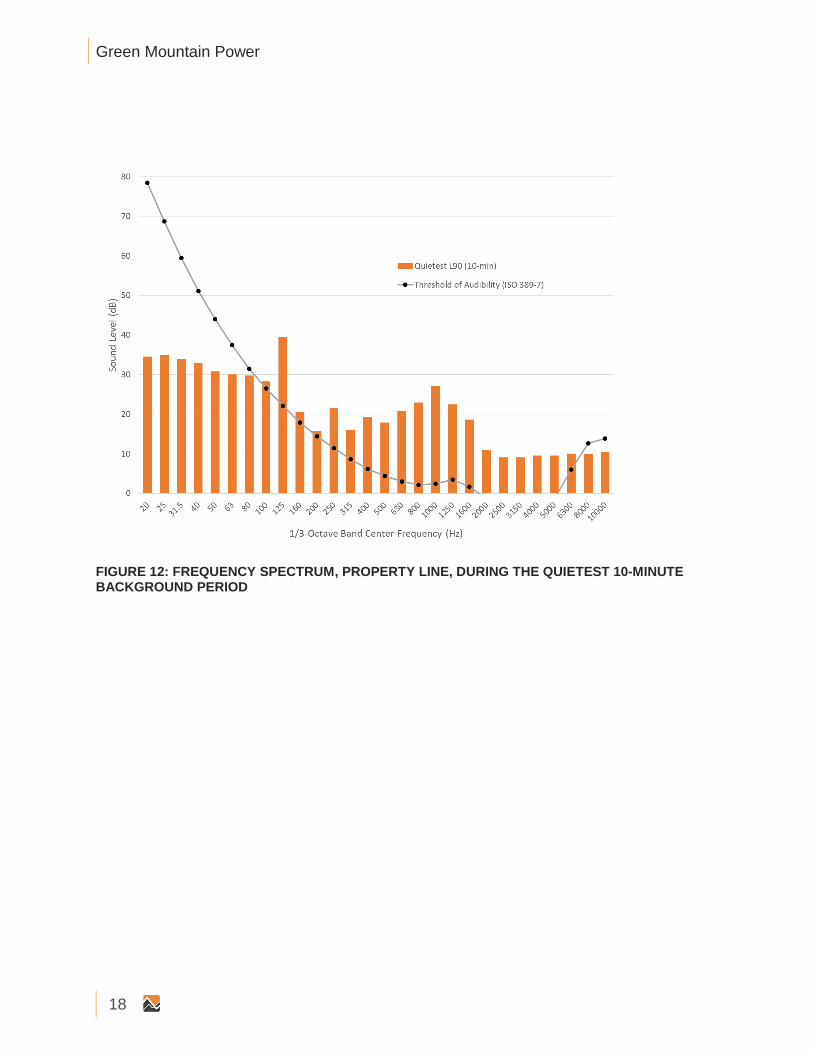
The frequency spectrum of sound measured at the property line during the quietest 10-minute
interval is plotted in Figure 12, where it is compared with the threshold of audibility (from ISO
389-7). The 120 Hz transformer tone is evident in the spectrum in the 125 Hz 1/3-octave band.
The prominence of each band is compared to the tonality criteria of ANSI 12.9-4 in Figure 13.
The transformer is not tonal at this distance.

Lowell Substation Noise Assessment
17
FIGURE 11: PROPERTY LINE SOUND LEVELS AND WIND SPEEDS DURING LONG-TERM MONITORING
TABLE 4: MONITOR B, PROPERTY LINE - STATISTICAL SOUND LEVELS, A-WEIGHTED
Time Period Leq L90 L50 L10
Total Period 45 35 40 49
Day 47 37 43 50
Night 42 35 37 45
Green Mountain Power
18
FIGURE 12: FREQUENCY SPECTRUM, PROPERTY LINE, DURING THE QUIETEST 10-MINUTE BACKGROUND PERIOD

Lowell Substation Noise Assessment
19
FIGURE 13: 1/3 OCTAVE BAND PROMINENCE AT THE PROPERTY LINE DURING THE QUIETEST 10-MINUTE BACKGROUND PERIOD

Green Mountain Power
20
5.0 SOUND PROPAGATION MODELING
5.1 MODELING METHODOLOGY AND INPUT PARAMETERS
Modeling for the project was in accordance with the standard ISO 9613-2, “Acoustics –
Attenuation of sound during propagation outdoors, Part 2: General Method of Calculation.” The
ISO standard states,
This part of ISO 9613 specifies an engineering method for calculating the attenuation of sound during propagation
outdoors in order to predict the levels of environmental noise at a distance from a variety of sources. The method predicts
the equivalent continuous A-weighted sound pressure level … under meteorological conditions favorable to propagation
from sources of known sound emissions. These conditions are for downwind propagation … or, equivalently,
propagation under a well-developed moderate ground-based temperature inversion, such as commonly occurs at night.
The model takes into account source sound power levels, surface reflection and absorption,
atmospheric absorption, geometric divergence, meteorological conditions, walls, barriers,
berms, and terrain. The acoustical modeling software used here was CadnaA, from Datakustik
GmbH. CadnaA is a widely accepted acoustical propagation modeling tool, used by many noise
control professionals in the United States and internationally.
Model configuration parameters are listed in Appendix A.
A 10-meter by 10-meter grid of 1.5 meter high receivers was set up in the model, covering
approximately 4.2 sq. km. (1.6 sq. mi.) around the existing and the proposed substations. A
receiver is a point above the ground at which the computer model calculates a sound level.
In addition to the grid, 13 discrete receivers were included in the model, representing 11
residences , a school, and Town Hall within the calculation area. Sound levels estimated at
these receivers are summarized in Appendix B for each case.
In the sound propagation model, the transformer was represented by a point source with two
operational spectra, one for ONAN and one for ONAF.
5.2 TRANSFORMER SOURCE SOUND POWER LEVELS
Per the industry standard for transformer sound emissions, NEMA TR-1, the allowable sound
pressure levels for a transformer of the size proposed for the GMP Lowell substation are 73
dBA with no fans and 76 dBA with 2nd stage fan cooling. GMP has specified that the
replacement autotransformer meet the NEMA TR-1 levels less 10 dB.
In order to model the transformer as a sound source, a sound power level must be assigned for
each operational condition. Sound power levels for transformers are calculated from the
specified sound pressure level, the height of the transformer, and the path length of a specified

Lowell Substation Noise Assessment
21
perimeter around transformer.7 An imaginary surface S is defined surrounding the transformer.
The vertical area of the surface has length equal to the specified perimeter DP and height H of
the transformer. The area over the top of the transformer is estimated as 25% of the vertical
area. The total surface area is calculated from 𝑆 = 1.25𝐷𝑃𝐻.
Given the specified sound pressure level Lp,Spec in dBA and the transformer operational surface
area S in square meters, emitted sound power level is calculated from the formula:
𝐿𝑊 = 𝐿𝑝, Spec + 10 log10
𝑆
𝑆0
(The reference area S0 is set equal to 1 square meter.)
The performance specifications for the autotransformer planned for the GMP Lowell substation
upgrade have been identified, but a particular manufacturer and model had not been selected at
the time of this analysis. The size of the proposed unit was estimated by GMP to be 2.97 m (117
in) high, 2.49 m (98 in) deep, and 7.47 m (294 in) wide. These dimensions were used to
calculate measurement surface areas per IEEE C57.12.90-2010. The areas become correction
factors between the NEMA TR-1 sound pressure levels and the calculated emitted sound power
levels.
Characteristic transformer spectral sound levels of the exiting GMP Lowell transformer were
used simply to get an appropriate spectral shape: the actual levels were adjusted to achieve the
goal sound pressure levels of 63 dBA (ONAN) and 66 dBA (ONAF), per GMP’s “NEMA minus
10” specification.
The sound pressure level spectra (relative to the 1000 Hz octave band) for ONAN and ONAF
operation are listed in Table 5. The resulting calculated sound power levels for the
autotransformer proposed by GMP are listed in Table 6. These are the spectral sound power
levels used as inputs to the acoustical propagation model, discussed below.
5.3 MODELING RESULTS
Model runs were conducted over four source configurations; the results are shown as contours
of equal sound pressure level overlaid on ortho-imagery of the area surrounding the proposed
substation:
• Existing GMP and VEC transformers, ONAN (fans off), Figure 14;
• Existing GMP and VEC transformer, ONAF (fans on, first stage cooling), Figure 15;
• Proposed GMP transformer and VEC transformer, ONAN (fans off), Figure 16;
7 The path length is a function of the operational condition and the layout of the transformer. It is specified in standard IEEE C57.12.90-2010.
Green Mountain Power
22
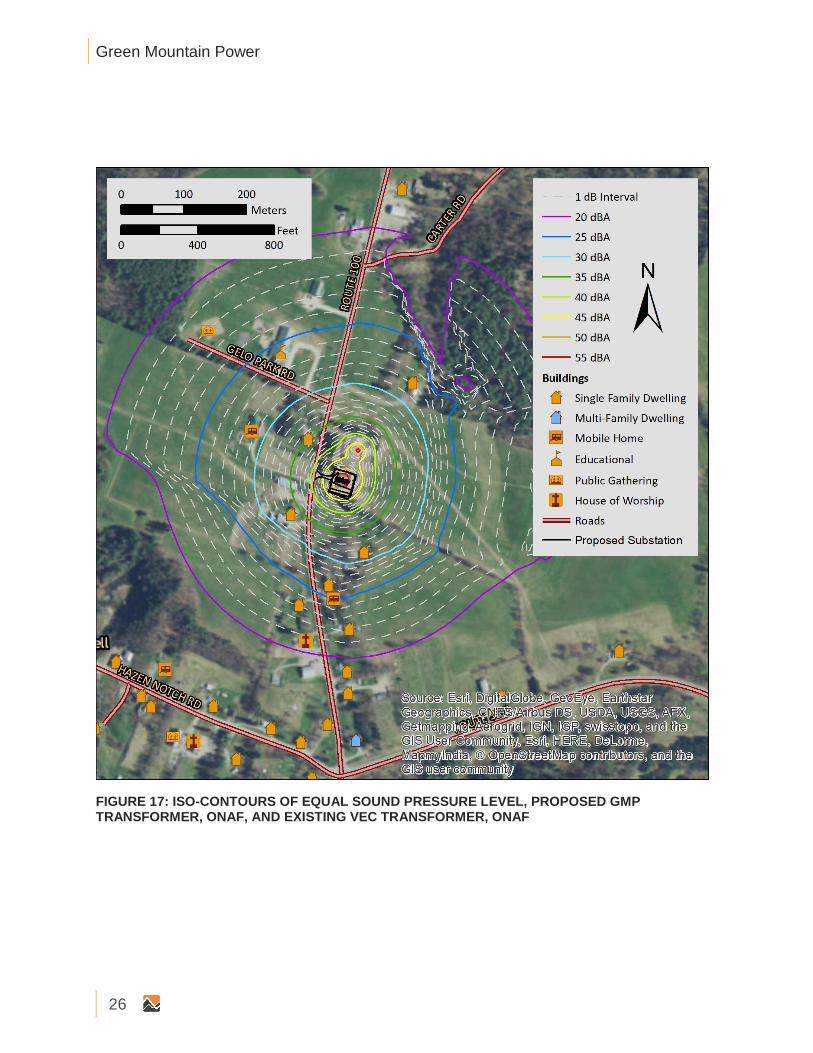
• Proposed GMP transformer, ONAF (fans on, second stage cooling) and VEC
transformer, ONAF (fans on, first stage cooling), Figure 17.
The overall, A-weighted sound levels estimated at each sensitive location are listed in Appendix
B, Table 8.
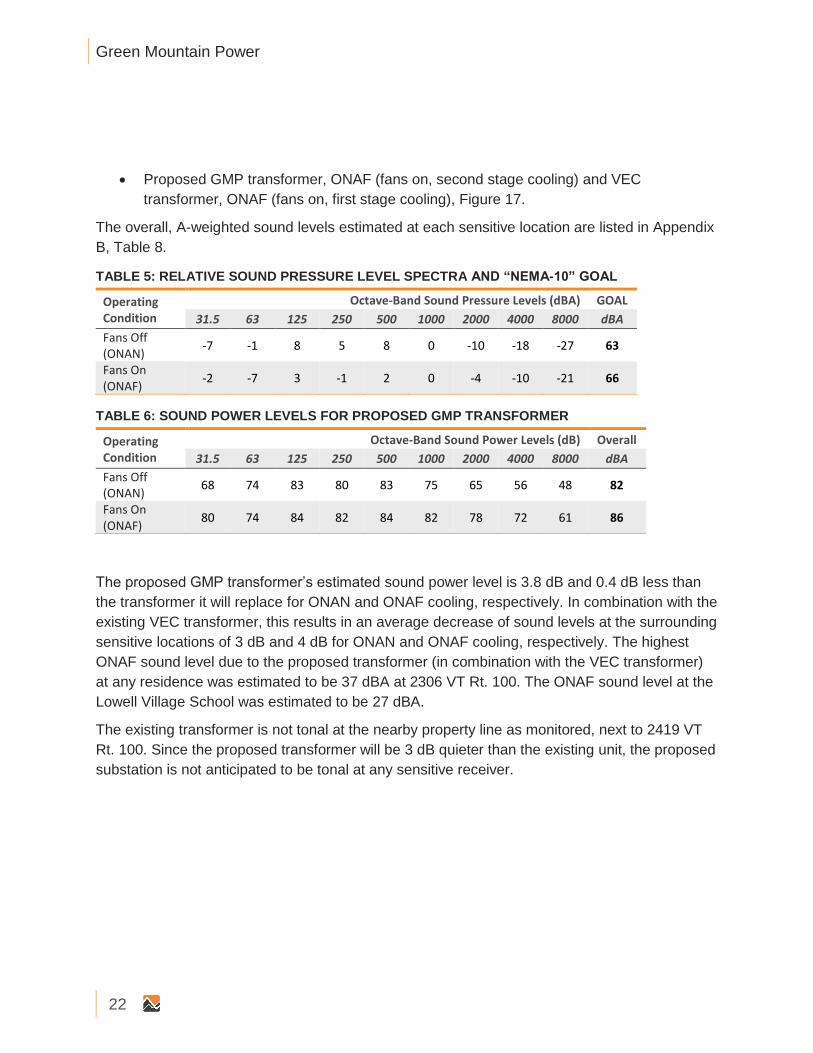
TABLE 5: RELATIVE SOUND PRESSURE LEVEL SPECTRA AND “NEMA-10” GOAL
Operating Condition
Octave-Band Sound Pressure Levels (dBA) GOAL
31.5 63 125 250 500 1000 2000 4000 8000 dBA
Fans Off (ONAN)
-7 -1 8 5 8 0 -10 -18 -27 63
Fans On (ONAF)
-2 -7 3 -1 2 0 -4 -10 -21 66
TABLE 6: SOUND POWER LEVELS FOR PROPOSED GMP TRANSFORMER
Operating Condition
Octave-Band Sound Power Levels (dB) Overall
31.5 63 125 250 500 1000 2000 4000 8000 dBA
Fans Off (ONAN)
68 74 83 80 83 75 65 56 48 82
Fans On (ONAF)
80 74 84 82 84 82 78 72 61 86
The proposed GMP transformer’s estimated sound power level is 3.8 dB and 0.4 dB less than
the transformer it will replace for ONAN and ONAF cooling, respectively. In combination with the
existing VEC transformer, this results in an average decrease of sound levels at the surrounding
sensitive locations of 3 dB and 4 dB for ONAN and ONAF cooling, respectively. The highest
ONAF sound level due to the proposed transformer (in combination with the VEC transformer)
at any residence was estimated to be 37 dBA at 2306 VT Rt. 100. The ONAF sound level at the
Lowell Village School was estimated to be 27 dBA.
The existing transformer is not tonal at the nearby property line as monitored, next to 2419 VT
Rt. 100. Since the proposed transformer will be 3 dB quieter than the existing unit, the proposed
substation is not anticipated to be tonal at any sensitive receiver.

Lowell Substation Noise Assessment
23
FIGURE 14: ISO-CONTOURS OF EQUAL SOUND PRESSURE LEVEL, EXISTING GMP AND VEC TRANSFORMERS, ONAN

Green Mountain Power
24
FIGURE 15: ISO-CONTOURS OF EQUAL SOUND PRESSURE LEVEL, EXISTING GMP AND VEC TRANSFORMERS, ONAF

Lowell Substation Noise Assessment
25
FIGURE 16: ISO-CONTOURS OF EQUAL SOUND PRESSURE LEVEL, PROPOSED GMP TRANSFORMER AND EXISTING VEC TRANSFORMER, ONAN
Green Mountain Power
26
FIGURE 17: ISO-CONTOURS OF EQUAL SOUND PRESSURE LEVEL, PROPOSED GMP TRANSFORMER, ONAF, AND EXISTING VEC TRANSFORMER, ONAF

Lowell Substation Noise Assessment
27
6.0 CONCLUSIONS
Green Mountain Power is proposing to reconstruct their Lowell Substation. This will involve the
replacement of the existing transformer. The replacement will be specified to be 10 dB below
NEMA TR1 sound standards, resulting in it being 3.8 dB and 0.4 dB quieter than the existing
transformer.
The sound modeling for the project forecasts that with both VEC transformer and GMP
transformer operating under ONAF cooling (with fans), the combined substation sound pressure
level will be reduced, on average, 3 dB under ONAN cooling and 4 dB under ONAF cooling at
surrounding sensitive receptors.
Because the overall sound levels are reduced compared to the existing substation, we conclude
that the project will not have an adverse impact on aesthetics with regard to noise.

Green Mountain Power
28
APPENDIX A. SOUND MODEL PARAMETERS
The configuration parameters for all modeling in CadnaA® conducted for this assessment are
listed in Table 7.
TABLE 7: ACOUSTICAL PROPAGATION MODEL INPUT PARAMETERS
Parameter Value Ground Absorption Type ISO 9613-2 Spectral Ground Absorption, Substation 0.6 Ground Absorption, elsewhere 1.0 Atmospheric Absorption Temperature 10 C Atmospheric Absorption Relative Humidity 70% Source search radius 2000 m (1.2 mi) Discrete Receiver Height, Residences 4 m (13 ft) Grid Receiver Spacing 10 m (32.8 ft) Grid Receiver Height 1.5 m (5 ft)

Lowell Substation Noise Assessment
29
APPENDIX B. RECEIVER TABLE
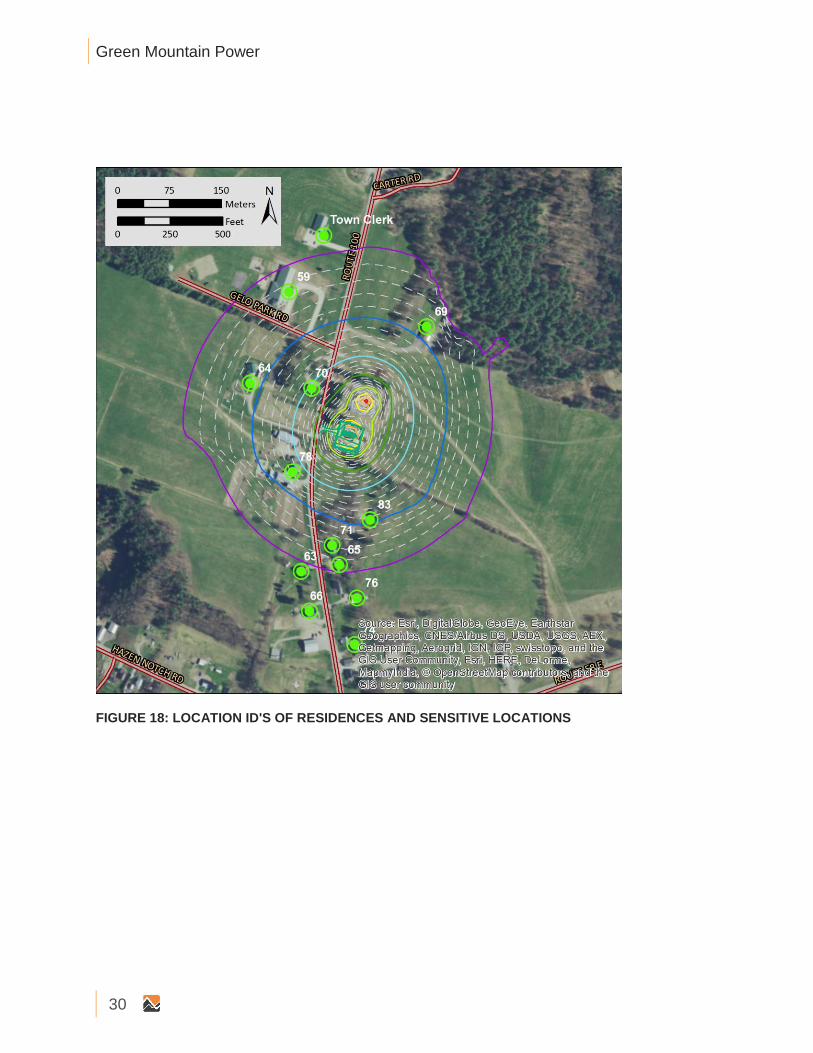
For each sensitive location8 that was modeled as a sound receiver, the sound levels predicted
by the model described in Section 4 are listed in Table 8 for two transformer operational
conditions (ONAN and ONAF) in the cases of the existing transformer and the proposed
transformer, respectively. For reference, the map in Figure 18 shows the numerical ID numbers
that link to the Table entries. The entries in the Table are sorted in order from highest received
sound level (current transformer, ONAF) to lowest. That order corresponds roughly to distance
away from the substation.
TABLE 8: OVERALL SOUND LEVELS PREDICTED AT EACH SENSITIVE LOCATION IN THE MODEL; ALL SOUND LEVELS ARE A-WEIGHTED DECIBELS (dBA)
Address Map ID Existing Proposed
ONAN ONAF ONAN ONAF
School 59 26 30 24.2 27.4
2468 VT Route 100 63 25.2 30.5 21.4 25.7
2352 VT Route 100 64 28.8 33.2 26.7 30.3
2475 VT Route 100 65 27.7 32.2 24.1 28.1
2506 VT Route 100 (Church)
66 21.7 26.7 18.3 22
2255 VT Route 100 69 27.9 31.7 26.4 29.5
2306 VT Route 100 70 34.4 38.6 32.9 36.5
2451 VT Route 100 71 29.3 33.9 26.1 29.8
2569 VT Route 100 74 20.2 25.1 17.1 20.9
2507 VT Route 100 76 24.1 29.3 20.5 24.8
2390 VT Route 100 78 34.3 39 30.9 34.8
2419 VT Route 100 83 31.7 36.3 28.6 32.4
Town Clerk 23.6 27.5 21.7 24.8
8 Sensitive locations include residences (single family, multi-family, and mobile home), educational facilities, and houses of worship.
Green Mountain Power
30
FIGURE 18: LOCATION ID'S OF RESIDENCES AND SENSITIVE LOCATIONS
Lowell Substation Noise Assessment
31
APPENDIX C. A PRIMER ON SOUND AND SOUND
LEVELS
Sound consists of tiny, repeating fluctuations in ambient air pressure. The strength, or
amplitude, of these fluctuations determines the sound pressure level (SPL).
“Noise” can be defined as “a sound of any kind, especially when loud, confused, indistinct, or
disagreeable.” Thus, while sound is defined by objective metrics that can be measured with
appropriate tools, noise is considered subjective.
Expressing Sound in Decibel Levels
The varying air pressure that constitutes sound can be characterized in many different ways.
The human ear is the basis for the metrics that are used in acoustics. Normal human hearing is
sensitive to sound fluctuations over an enormous range of pressures, from about 20
micropascals (the “threshold of audibility”) to about 20 pascals (the “threshold of pain”).9 This
factor of one million in sound pressure difference is challenging to convey in engineering units.
Instead, sound pressure is converted to sound “levels” in units of “decibels” (dB, named after
Alexander Graham Bell). Once a measured sound is converted to dB, it is denoted as a level
with the letter “L”.
The conversion from sound pressure in pascals to sound level in dB is a four-step process.
First, the sound wave’s measured amplitude is squared and the mean is taken. Second, a ratio
is taken between the mean square sound pressure and the square of the threshold of audibility
(20 micropascals). Third, using the logarithm function, the ratio is converted to factors of 10. The
final result is multiplied by 10 to give the decibel level. This four-step process is carried out
electronically by a sound level meter, the most important tool in acoustics. By this decibel scale,
sound levels range from 0 dB at the threshold of audibility to 120 dB at the threshold of pain.
Typical sources of noise, and their sound pressure levels, are listed on the scale in Figure 19.
The Human Response to Sound Levels: Apparent Loudness
For every 20 dB increase in sound level, the sound pressure increases by a factor of 10; the
sound level range from 0 dB to 120 dB covers 6 factors of 10, or one million, in sound pressure.
However, for an increase of 10 dB in sound level as measured by a meter, humans perceive an
approximate doubling of apparent loudness: to the human ear, a sound level of 70 dB sounds
9 The pascal is a measure of pressure in the metric system. In Imperial units, they are themselves very small: one pascal is only 145 millionths of a pound per square inch (psi). The sound pressure at the threshold of audibility is only 3 one-billionths of one psi: at the threshold of pain, it is about 3 one-thousandths of one psi.

Green Mountain Power
32
about “twice as loud” as a sound level of 60 dB. Smaller changes in sound level, less than 3 dB
up or down, are generally not perceptible.
The Frequency Spectrum of Sound
The “frequency” of a sound is the rate at which it fluctuates in time, expressed in Hertz (Hz), or
cycles per second. Very few sounds occur at only one frequency: most sound contains energy
at many different frequencies, and it can be broken down into different frequency divisions, or
bands. These bands are similar to musical pitches, from low tones to high tones. The most
common division is the standard Octave Band. An octave is the range of frequencies whose
upper frequency limit is twice its lower frequency limit, exactly like an octave in music. An
Octave Band is identified by its center frequency: each successive band’s center frequency is
twice as high (one octave) as the previous band.
For example, the 500 Hz Octave Band includes all sound whose frequencies range between
354 Hz (Hertz, or cycles per second) and 707 Hz. The next band is centered at 1,000 Hz with a
range between 707 Hz and 1,414 Hz. The range of human hearing is divided into 10 standard
Octave Bands: 31.5 Hz, 63 Hz, 125 Hz, 250 Hz, 500 Hz, 1,000 Hz, 2,000 Hz, 4,000 Hz, 8,000
Hz, and 16,000 Hz. For analyses that require finer frequency detail, each octave-band can be
subdivided. A commonly-used subdivision creates three smaller bands within each Octave
Band, or so-called 1/3-Octave Bands.
The Human Response to Frequency: Weighting of Sound Levels
The human ear is not equally sensitive to sounds of all frequencies. Sounds at some
frequencies seem louder than others, despite having the same decibel level as measured by a
sound level meter. In particular, human hearing is much more sensitive to medium pitches (from
about 500 Hz to about 4,000 Hz) than to very low or very high pitches. For example, a tone
measuring 80 dB at 500 Hz (a medium pitch) sounds quite a bit louder than a tone measuring
80 dB at 60 Hz (a very low pitch). The frequency response of normal human hearing ranges
from 20 Hz to 20,000 Hz. Below 20 Hz, sound pressure fluctuations are not “heard”, but
sometimes can be “felt”. This is known as “infrasound”. Likewise, above 20,000 Hz, sound can
no longer be heard by humans; this is known as “ultrasound”. As humans age, they tend to lose
the ability to hear higher frequencies first; most adults do not hear very well above about 16,000
Hz. Most natural and man-made sound occurs in the range from about 40 Hz to about 4,000 Hz.
Some insects and birdsongs reach to about 8,000 Hz.
To adjust measured sound pressure levels so that they mimic human hearing response, sound
level meters apply filters, known as “frequency weightings”, to the signals. There are several
defined weighting scales, including “A”, “B”, “C”, “D”, “G”, and “Z”. The most common weighting
scale used in environmental noise analysis and regulation is A-weighting. This weighting
represents the sensitivity of the human ear to sounds of low to moderate level. It attenuates
Lowell Substation Noise Assessment
33
sounds with frequencies below 1000 Hz and above 4000 Hz; it amplifies very slightly sounds
between 1000 Hz and 4000 Hz, where the human ear is particularly sensitive. The C-weighting
scale is sometimes used to describe louder sounds. The B- and D- scales are seldom used. All
of these frequency weighting scales are normalized to the average human hearing response at
1000 Hz: at this frequency, the filters neither attenuate nor amplify. When a reported sound level
has been filtered using a frequency weighting, the letter is appended to “dB”. For example,
sound with A-weighting is usually denoted “dBA”. When no filtering is applied, the level is
denoted “dB” or “dBZ”. The letter is also appended as a subscript to the level indicator “L”, for
example “LA” for A-weighted levels.
The Time Response of Sound Level Meters
Because sound levels can vary greatly from one moment to the next, the time over which sound
is measured can influence the value of the levels reported. Often, sound is measured in real
time, as it fluctuates. In this case, acousticians apply a so-called “time response” to the sound
level meter, and this time response is often part of regulations for measuring noise. If the sound
level is varying slowly, over a few seconds, “Slow” time response is applied, with a time
constant of one second. If the sound level is varying quickly (for example, if brief events are
mixed into the overall sound), “Fast” time response can be applied, with a time constant of one-
eighth of a second.10 The time response setting for a sound level measurement is indicated
with the subscript “S” for Slow and “F” for Fast: LS or LF. A sound level meter set to Fast time
response will indicate higher sound levels than one set to Slow time response when brief events
are mixed into the overall sound, because it can respond more quickly.
Accounting for changes in sound over time
A sound level meter’s time response settings are useful for continuous monitoring. However,
they are less useful in summarizing sound levels over longer periods. To do so, acousticians
apply simple statistics to the measured sound levels, resulting in a set of defined types of sound
level related to averages over time. An example is shown in Figure 20. The sound level at each
instant of time is the grey trace going from left to right. Over the total time it was measured (100
seconds in the Figure), the sound energy spends certain fractions of time near various levels,
ranging from the minimum (about 28 dB in the Figure) to the maximum (about 65 dB in the
Figure). The simplest descriptor is the average sound level, known as the Equivalent
Continuous Sound level. Statistical levels are used to determine for what percentage of time the
sound is louder than any given level. These levels are described in the following Sections.
10 There is a third time response defined by standards, the “Impulse” response. This response was defined to enable use of older, analog meters when measuring very brief noises; it is no longer in common use.

Green Mountain Power
34
FIGURE 19: A SCALE OF SOUND PRESSURE LEVELS FOR TYPICAL NOISE SOURCES.

Lowell Substation Noise Assessment
35
Equivalent Continous Sound Level - Leq
One straightforward, common way of describing sound levels is in terms of the Continuous
Equivalent Sound Level, or Leq. The LEQ is the average sound pressure level over a defined
period of time, such as one hour or one day. Leq is the most commonly used descriptor in noise
standards and regulations. Leq is representative of the overall sound to which a person is
exposed. Because of the logarithmic calculation of decibels, Leq tends to favor higher sound
levels: loud and infrequent sources have a larger impact on the resulting average sound level
than quieter but more frequent noises. For example, in Figure 20, even though the sound levels
spends most of the time near about 34 dBA, the Leq is 41 dBA, having been “inflated” by the
maximum level of 65 dBA.
FIGURE 20: EXAMPLE OF DESCRIPTIVE TERMS OF SOUND MEASUREMENT OVER TIME
Percentile Sound Levels – LN
Percentile sound levels describe the statistical distribution of sound levels over time. “LN” is the
level above which the sound spends “N” percent of the time. For example, L90 (sometimes
called the “residual base level”) is the sound level exceeded 90% of the time: the sound is
louder than L90 most of the time. L10 is the sound level that is exceeded only 10% of the time.
L50 (the “median level”) is exceeded 50% of the time: half of the time the sound is louder than

Green Mountain Power
36
L50, and half the time it is quieter than L50. Note that L50 (median) and LEQ (mean) are not
always the same, for reasons described in the previous Section.
L90 is often a good representation of the “ambient sound” in an area. This is the sound that
persists for longer periods, and below which the overall sound level seldom falls. It tends to filter
out other short-term environmental sounds that aren’t part of the source being investigated. L10
represents the higher, but less frequent, sound levels. These could include such events as
barking dogs, vehicles driving by and aircraft flying overhead, gusts of wind, and work
operations. L90 represents the background sound that is present when these event noises are
excluded.
Note that if one sound source is very constant and dominates the noise in an area, all of the
descriptive sound levels mentioned here tend toward the same value. It is when the sound is
varying widely from one moment to the next that the statistical descriptors are useful.
Sound Levels from Multiple Sources: Adding Decibels
Because of the way that sound levels in decibels are calculated, the sounds from more than one
source do not add arithmetically. Instead, two sound sources that are the same decibel level
increase the total sound level by 3 dB. For example, suppose the sound from an industrial
blower registers 80 dB at a distance of 2 meters (6.6 feet). If a second industrial blower is
operated next to the first one, the sound level from both machines will be 83 dB, not 160 dB.
Adding two more blowers (a total of four) raises the sound level another 3 dB to 86 dB. Finally,
adding four more blowers (a total of eight) raises the sound level to 89 dB. It would take eight
total blowers, running together, for a person to judge the sound as having “doubled in loudness”.
Recall from the explanation of sound levels that a difference of 10 decibels is a factor of 20 in
sound pressure and a factor of 10 in sound power. (The difference between sound pressure and
sound power is described in the next Section.) If two sources of sound differ individually by 10
decibels, the louder of the two is generating ten times more sound. This means that the loudest
source(s) in any situation always dominates the total sound level. Looking again at the industrial
blower running at 80 decibels, if a small ventilator fan whose level alone is 70 decibels were
operated next to the industrial blower, the total sound level increases by only 0.4 decibels, to
80.4 decibels. The small fan is only 10% as loud as the industrial blower, so the larger blower
completely dominates the total sound level.
The Difference Between Sound Pressure and Sound Power
The human ear and microphones respond to variations in sound pressure. However, in
characterizing the sound emitted by a specific source, it is proper to refer to sound power. While
sound pressure induced by a source can vary with distance and conditions, the power is the
same for the source under all conditions, regardless of the surroundings or the distance to the
nearest listener. In this way, sound power levels are used to characterize noise sources

Lowell Substation Noise Assessment
37
because they act like a “fingerprint” of the source. An analogy can be made to light bulbs. The
bulb emits a constant amount of light under all conditions, but its perceived brightness
diminishes as one moves away from it.
Both sound power and sound pressure levels are described in terms of decibels, but they are
not the same thing. Decibels of sound pressure are related to 20 micropascals, as explained at
the beginning of this primer. Sound power is a measure of the acoustic power emitted or
radiated by a source; its decibels are relative to one picowatt.
Sound Propagation Outdoors
As a listener moves away from a source of sound, the sound level decreases due to
“geometrical divergence”: the sound waves spread outward like ripples in a pond and lose
energy. For a sound source that is compact in size, the received sound level diminishes or
attenuates by 6 dB for every doubling of distance: a sound whose level is measured as 70 dBA
at 100 feet from a source will have a measured level of 64 dBA at 200 feet from the source and
58 dBA at 400 feet. Other factors, such as walls, berms, buildings, terrain, atmospheric
absorption, and intervening vegetation will also further reduce the sound level reaching the
listener.
The type of ground over which sound is propagating can have a strong influence on sound
levels. Harder ground, pavement, and open water are very reflective, while soft ground, snow
cover, or grass is more absorptive. In general, sounds of higher frequency will attenuate more
over a given distance than sounds of lower frequency: the “boom” of thunder can heard much
further away than the initial “crack”.
Atmospheric and meteorological conditions can enhance or attenuate sound from a source in
the direction of the listener. Wind blowing from the source toward the listener tends to enhance
sound levels; wind blowing away from the listener toward the source tends to attenuate sound
levels. Normal temperature profiles (typical of a sunny day, where the air is warmer near the
ground and gets colder with increasing altitude) tend to attenuate sound levels; inverted profiles
(typical of nighttime and some overcast conditions) tend to enhance sound levels.


55 Railroad Row
White River Junction, VT 05001
802.295.4999
www.rsginc.com
White River Junction &
Burlington, VT Arlington, VA Chicago, IL Evansville, IN Portland, OR Salt Lake City, UT San Diego, CA
RSG promotes sustainable business practices that minimize negative impacts on the environment. We
print all proposals and reports on recycled paper that utilizes a minimum of 30% post-consumer waste.
RSG also encourages recycling of printed materials (including this document) whenever practicable.
For more information on RSG’s sustainability practices, please visit www.rsginc.com.