lower body mechanics of golf swing and its …
TRANSCRIPT

LOWER BODY MECHANICS OF GOLF SWING AND ITS ASSOCIATION WITH MAXIMUM
CLUBHEAD SPEED IN SKILLED GOLFERS
A DISSERTATION
SUBMITTED IN PARTIAL FULFILLMENT OF THE REQUIREMENTS
FOR THE DEGREE OF DOCTOR OF PHILOSOPHY
IN THE GRADUATE SCHOOL OF THE
TEXAS WOMAN’S UNIVERSITY
DEPARTMENT OF KINESIOLOGY
COLLEGE OF HEALTH SCIENCE
BY
KI HOON HAN B.S., M.S.
DENTON, TEXAS
MAY 2016

iii
DEDICATION
I dedicate this dissertation to my mother in heaven, my father, and my two elder sisters
for giving me love, blessings, and faith in countless ways.

iv
ACKNOWLEDGEMENTS I would never have been able to finish my dissertation without the guidance of my committee members, help from lab members and friends, and support from my family. I would like to especially express my deepest gratitude to my advisor, Dr. Young-Hoo Kwon, for his excellent guidance, caring, patience, and showing me the model of a true scholar. I would like to thank Dr. Mark Hamner, who helped me apply the mathematical and statistical background to biomechanics. I would also like to thank Dr. Rhett Rigby for guiding and editing my dissertation. I would like to thank faculty members from the physical education department at Silla University, who as good teachers, were always willing to give their best regards. I would like to thank both former and current members of TWU Biomechanics Laboratory for helping me and fellow Korean students in the Kinesiology Department; it would have been a lonely lab without them. My research would not have been possible without their help. I would also like to thank my friends, Taehyuck, Kyungho, Jungho, Seunghwan, Junghoon, Gyebum, Taeyong, Woomoon, and Jinchul in Korea and DongHoon, JiHoon, Sungyup, Seojin, Minji, and Soo ah in Denton. They were always cheering me up and stood by me through the good and bad times. Finally, I would like to thank my father, my mother in heaven, and two elder sisters. They were always giving me love, blessings, and faith in countless ways.

v
ABSTRACT
KI HOON HAN
LOWER BODY MECHANICS OF GOLF SWING AND ITS ASSOCIATION WITH MAXIMUM CLUBHEAD SPEED IN SKILLED GOLFERS
MAY 2016
The purpose of this study was to investigate the associations between peak
clubhead speed and select kinematic and kinetic parameters of the lower extremity
during the swing in skilled golfers. A total of 25 healthy, right-handed, male golfers with
a posted handicap of 3 or better were recruited for this study. Peak orientation angles
(OA) and ranges of the OA of the lower extremity joints (i.e., pelvis, hips, knees, and
ankles) during the downswing, and normalized peak resultant joint moments (RJM) of
the lower extremity joints (i.e., hips, knees, and ankles) were extracted for a correlation
analysis to normalized peak clubhead speed (NPCS). Among OA parameters, only the
pelvis right lateral tilted position (r = .510, .501, and .522 for driver, 5-iron, and pitching
wedge, respectively) and the pelvis right tilting motion (r = .450, .409, and .493 for
driver, 5-iron, and pitching wedge, respectively) were significantly correlated to NPCS
across all the club conditions during the downswing. Therefore, the pelvis motion in the
frontal plane was identified as the good consistent indicator of clubhead speed in skilled
golfers. Among RJM parameters, the right hip extensor (r = .396, .667, and .732 for
driver, 5-iron, and pitching wedge, respectively) and left knee extensor moments (r

vi
= .451, .449, and .457 for driver, 5-iron, and pitching wedge, respectively) in the sagittal
plane exhibited significant correlations to NPCS across all club conditions. The skilled
golfers relied especially more on muscular effort from the right hip and left knee joints
in the sagittal plane. Therefore, the right hip extensor and left knee extensor moments
were considered as the good consistent indicator in generating higher clubhead speed in
skilled golfers.

vii
TABLE OF CONTENTS
Page
DEDICATION ........................................................................................................................ iii
ACKNOWLEDGEMENTS ....................................................................................................... iv
ABSTRACT ............................................................................................................................. v
TABLE OF CONTENTS.......................................................................................................... vii
LIST OF TABLES .................................................................................................................... ix
LIST OF FIGURES ................................................................................................................... x
Chapter
I. INTRODUCTION ............................................................................................................... 1
Purpose of the Study ................................................................................................... 3
Hypotheses .................................................................................................................. 3
Assumptions ............................................................................................................... 4
Delimitations ............................................................................................................... 4
Limitations ................................................................................................................... 5
Definitions of Terms ................................................................................................... 5
II. LITERATURE REVIEW ...................................................................................................... 7
Golf Swing Technique .................................................................................................. 7
Kinematic Sequence and Kinetic Energy Transfer ................................................. 8
X-factor Parameters ............................................................................................... 9
Delayed Release of Wrist ...................................................................................... 11
Weight Shift and Foot-Ground Interaction .......................................................... 12
Physical Condition .................................................................................................... 14
Club Characteristics ................................................................................................... 16
Swing Model .............................................................................................................. 16

viii
Summary ................................................................................................................... 18
III. METHODS .................................................................................................................... 19
Participants ............................................................................................................... 19
Trial Conditions ......................................................................................................... 19
Data Collection ......................................................................................................... 20
Data Reduction and Processing ................................................................................. 21
Data Analysis ............................................................................................................ 22
Statistical Analysis ..................................................................................................... 36
IV. RESULTS ....................................................................................................................... 38
Orientation Angle ...................................................................................................... 38
Resultant Joint Moment ............................................................................................ 41
V. DISCUSSION ................................................................................................................. 43
Orientation Angle ..................................................................................................... 43
Resultant Joint Moment ............................................................................................ 45
Conclusion ................................................................................................................ 53
Recommendation for Future Study ........................................................................... 54
REFERENCES ...................................................................................................................... 56
APPENDIX .......................................................................................................................... 69
A. INFORMED CONSENT FORM ................................................................................. 70

ix
LIST OF TABLE
Table Page
1. Degrees of Freedom (Joint Motions) Assigned to Lower Body Joints ................. 23
2. OA Parameters for Data Analysis during Downswing .......................................... 37
3. RJM Parameters for Data Analysis ....................................................................... 37
4. Peak OA and Correlation Coefficients (r) to NPCS (in degree) ............................. 39
5. Range of OA and Correlation Coefficients (r) to NPCS (in degree) ....................... 40
6. RJM and Correlation Coefficients (r) to NPCS (in Nm/kg) .................................... 42
7. Type of Muscle Contraction at Peak RJM ............................................................ 51
8. Peak RJM Timing (%) ............................................................................................. 52

x
LIST OF FIGURE
Figure Page
1. Trials: club (a), ball plate (b), static posture (c), motion trial (d) .......................... 20
2. Ten events during the backswing and downswing ............................................... 24
3. Free body diagram of left hip joint ....................................................................... 27
4. Exemplar OA and RJM parameters used during the downswing phase ............... 28
5. Ensemble-average patterns of OA in driver condition ........................................ 30
6. Ensemble-average patterns of OA in 5 - iron condition ...................................... 31
7. Ensemble-average patterns of OA in pitching wedge condition .......................... 32
8. Ensemble-average patterns of normalized RJM in driver condition .................... 33
9. Ensemble-average patterns of normalized RJM in 5 - iron condition .................. 34
10. Ensemble-average patterns of normalized RJM in pitching-wedge condition ..... 35
11. Exemplar moment arm from the line of action of the GRF vector to each joint and the magnitude of GRF at the instant of peak right hip RJM in the sagittal plane ..................................................................................................................... 48

xi
12. Exemplar MA and GRF patterns at the instant of peak right hip RJM in the sagittal plane ..................................................................................................................... 49

1
CHAPTER I
INTRODUCTION
The PGA Tour average course length has increased consistently from 2003 to
2009 by over 40 yd (Golfpredictorcom, 2015). Average driving distance has also
increased significantly every year from 1990 to 2005 on the PGA tour (Wiseman,
Habibullah, & Yilmaz, 2007). There are two requisites for success with the full swing in
golf: distance and accuracy (Kwon, Como, Singhal, Lee, & Han, 2012). Longer shot
distance and higher accuracy are associated with better outcomes in terms of total
score and ranking (Hale & Hale, 1990; Wiseman & Chatterjee, 2006). As the level of
competition increases, shot distance becomes more important (Hellstrom, 2009).
Clubhead speed at impact is known as the most important determinant of shot distance
(Hume, Keogh, & Reid, 2005; Penner, 2003; Wallace, Otto, & Nevill, 2007) and emphasis
has been placed on the movement patterns and swing motion characteristics that
contribute to a higher impact clubhead speed. Some of these swing motion
characteristics include the kinematic sequence (Burden, Grimshaw, & Wallace, 1998), X-
factor (Myers et al., 2008), and delayed release (Sprigings & Mackenzie, 2002).
Recently, the interactions among the pelvis, upper body, arms and club (i.e.,
kinematic sequence) or between the pelvis and thorax (i.e., X-factor) have received
significant attention in golf practice and research as key factors that affect peak

2
clubhead speed. According to the principle of kinematic sequence, the downswing
motion is initiated by the rotations of large proximal segments (e.g., pelvis and trunk)
followed by those of smaller distal segments (e.g., arms, hands, and the club) in order to
maximize the speed of the clubhead at the distal end of the body/club system
(McTeigue, Lamb, Mottram, & Pirozzolo, 1994). The X-factor, the torsional separation
between the pelvic and shoulder lines, has been reported to have a strong relationship
with peak clubhead velocity (McLean, 1992; Myers et al., 2008; Zheng, Barrentine,
Fleisig, & Andrews, 2008). In a recent study, however, X-factor parameters were not
directly correlated to the clubhead speed in skilled golfers (Kwon, Han, Como, Lee, &
Singhal, 2013).
The effect of delayed release (Sprigings & Mackenzie, 2002), also known as
delayed uncocking of the wrist, has been analyzed using the double-pendulum model
(e.g., Jorgensen, 1994; Milne & Davis, 1992; Pickering & Vickers, 1999; Sprigings & Neal,
2000). In this model, the golfer’s arms and club were reduced to two rigid levers
connected at the wrists with the arm and wrist motions being the primary contributors
to clubhead speed. The movements of the trunk, arms, and club in the golfer/club
system have therefore been emphasized more than those of the lower body.
Consequently, the lower body motions have not received much research attention.
During a golf swing, the only external forces and moments that can be
voluntarily manipulated by the golfer are the ground reaction forces and moments. The
peak force moments generated through the foot-ground interaction during the early

3
phase of downswing phase are significantly correlated to the peak clubhead speed (Han,
Lee, & Kwon, 2014). The lower body (legs and pelvis) plays a critical role in promoting
the foot-ground interaction: (1) the angular momentum generated through the foot-
ground interaction is transferred to the upper body through the lower body; and (2) the
unbalanced leg actions determine the quality of the foot-ground interaction such as
weight shift and center-of-pressure (COP) excursion (Ball, & Best, 2007; Kawashima,
Meshizuka, & Takeshita, 1998). Through the muscle actions in the lower body, the golfer
controls the level and quality of the foot-ground interaction. Proper lower body
mechanics, therefore, are a pre-requisite for a high clubhead speed at impact. Despite
the importance of the mechanical role of the lower body, the direct biomechanical
relationships between the lower body motions and the peak clubhead speed has not
been established. This study, therefore, can offer valuable insights into the relationships
between the key kinematic and kinetic factors of the lower body motions and peak
clubhead speed.
Purpose of the Study
The purpose of this study was to investigate the associations between peak
clubhead speed and select kinematic and kinetic parameters of the lower extremities
during the swing in skilled golfers.
Hypotheses
1. Peak orientation angles (OA) and ranges of OA of the lower extremities (i.e., hips,
knees, and ankles) and pelvis in three anatomical planes of motion

4
(i.e., sagittal, frontal, and transverse) would be significantly correlated to peak
clubhead speed in skilled golfers.
2. Peak resultant joint moments (RJM) of the lower extremities in three
anatomical planes of motion would be significantly correlated to peak clubhead
speed in skilled golfers.
Assumptions
1. The body was a linked segment system with frictionless pin joints.
2. Each segment was a rigid body.
3. The mass, length, and moment of inertia of each segment about its center of
mass (COM) remained constant throughout the golf swing.
4. The information provided by participants regarding their own skill level was
accurate.
Delimitations
1. Participant handicap was restricted to 3 or less to reduce intra-golfer variability.
2. Participants were recruited from golfers of ages 19-40 to remove excessive age-
related variability.
3. Only male golfers were recruited to remove gender differences in
anthropometric characteristics, such as the amount of muscle.
4. Only lower body parameters were measured so that the kinetic data to the rest
of the kinetic chain cannot be surmised.

5
Limitations
1. Swings were performed in an indoor laboratory.
2. Foam balls were used instead of real balls to minimize the effect at impact to the
clubhead speed.
3. Balls were hit to the wall located 15 m from the ball plate.
4. The differences in the swing patterns and swing styles among the participants
were not considered.
Definitions of Terms
Global reference frame: the laboratory coordinate system in which body marker
coordinates are calculated
Ground reaction force (GRF): the force exerted by the ground acting on the body in
contact with ground
Inverse dynamics: a method to compute resultant joint forces and moments based on
the motion data of the body (kinematics) and the body's inertial properties and ground
reaction force data
Kinematics: an area of mechanics which describe motion, including linear or angular
body positions, velocities, and accelerations
Kinetics: an area of mechanics which explain the causes of motion, including force and
moment
Local reference frame: the reference frame fixed to the moving body
segments Orientation angles: the angles of the segments relative to their respective

6
proximal segments about the axis in sequential order given by type of rotation chosen
Resultant joint force: sum of joint contact force (bone-on-bone force) and all muscle
forces acting at the joint
Resultant joint moment: sum of all moments produced by the muscles acting at the joint
Weight shift: lateral motion of the weight center (center of mass) away from or toward
the target during the swing

7
CHAPTER II
LITERATURE REVIEW
The literature review is divided into four main sections. The first three are
related to the promotion of generating higher clubhead speed. Golf swing technique will
be discussed first, including the concepts of kinematic sequence and kinetic energy
transfer, X-factor, delayed release of wrist, and weight shift and foot-ground interaction.
Physical conditioning will be discussed next, with a focus on strength and flexibility.
Thirdly, the relationship between the condition of the club and clubhead speed will be
presented. Finally, the history of golfer’s body model used in the biomechanical
research will be described.
Golf Swing Technique
Various movement patterns and characteristics of the swing motion result in a
higher clubhead velocity at impact, which is proportional to driving distance (Shamus &
Shamus, 2001) and to the skill level of golfers (Fradkin, Sherman, & Finch, 2004). The
kinematic and kinetic parameters include: kinematic sequence and kinetic energy
transfer; X-factor Parameters; delayed release of wrist, and; weight shift and foot-
ground interaction.

8
Kinematic Sequence and Kinetic Energy Transfer
The term proximal-to-distal sequence (Bunn, 1972; Marshall & Elliott, 2000;
Putnam, 1993; Robertson & Mosher, 1985) has been used in various sports and has
been described using different nomenclature. It has been utilized in baseball (Hay,
1993), soccer (Putnam, 1993; Robertson & Mosher, 1985), and tennis (Marshall & Elliott,
2000), where it has been called “summation of speed principle” by Bunn (1972) or
“kinetic link” principle by Kreighbaum and Barthels (1985). Since this principle,
commonly known as kinematic sequence in golf, was first introduced by Cochran and
Stobbs (1968), a substantial number of research studies have been conducted to find
evidence of this principle (Burden et al., 1998; Callaway et al., 2012; Horan, Evans,
Morris, & Kavanagh, 2010; Joyce, Burnett, & Ball, 2010; Lephart, Smouga, Myers, Sell, &
Tsai, 2007; Neal & Dalgleish, 2008; Tinmark, Hellström, Halvorsen, & Thorstensson,
2010). The principle suggests that the body’s motion should be initiated by the rotation
of the body’s larger proximal segments such as the pelvis and trunk and followed by the
shoulders and then the smaller distal segments such as the arms, wrists, and hands.
Therefore, the proper sequence of body segment motions from the larger proximal
segments to the smaller distal segments can be associated with a higher speed of the
clubhead at the distal end of the linked system when the energy is transferred to the
golf club at impact.
An essential factor to improve clubhead speed in golf is to increase the amount
of kinetic energy transferred from the body segments to the clubhead at impact. It has

9
been reported that the kinematic sequence has an effect on energy transfer and power
during the golf swing (McLaughlin & Best, 1994). Research following an 8-week golf-
specific exercise program to improve physical characteristics, swing mechanics, and golf
performance proposed that greater mechanical efficiency in transferring power to the
club can result from the improvement of the kinematic sequence pattern (Lephart et al.,
2007). In addition to proper kinematic sequencing during the golf swing, it is also
important that the muscles contract with proper timing. For example, the thorax gains
the energy accumulated after the deceleration of the pelvis. The pelvis in elite golfers
decelerates earlier than that in recreational golfer, which leads to a more effective ball
strike (Lynn et al., 2014). However, not all studies support the beneficial effect of the
kinematic sequence in generating clubhead speed. One possible explanation could be
that the direct contact of both hands creates a closed chain and, as a result, the typical
kinematic sequence observed in other sports such as baseball pitching and tennis may
be limited in its application to the golf swing.
X-Factor Parameters
Popular concepts in golf practice/research in recent years are the X-factor at the
top of backswing and the X-factor stretch at the beginning of downswing. The X-factor is
defined as the torsional separation between the shoulder and pelvis lines (Cheetham,
Martin, Mottram, & St. Laurent, 2001; McLean, 1992). Several studies have reported
that significant relationships between the X-factor and clubhead velocity were observed
in a diverse group of golfers (Chu, Sell, & Lephart, 2010; Cole & Grimshaw, 2009; Myers

10
et al., 2008; Zheng et al., 2008) and researchers have suggested that clubhead velocity
could be increased by increasing the X-factor. However, Cheetham, Martin, Mottram,
and St. Laurent (2001) reported that there was no significant difference in the X-factor
between highly skilled (i.e., handicap less than 0 and one long drive champion) and less
skilled golfers (i.e., handicap of 15+). The X-factor stretch, which comprises maximized
increase in shoulder and pelvic separation at the initiation of the downswing, has been
proposed to be more important to an effective swing than the X-factor at the top of
backswing. An increase (i.e., X-factor stretch) in the skilled group (19%) was significantly
greater than that in the less skilled group (13%). According to one study (Kwon et al.,
2013), the potential relationship between the X-factor and clubhead velocity has often
been explained with the X-factor stretch (Cheetham et al., 2001; Cole & Grimshaw,
2009) to include the stretch-shortening cycle (Hellstrom, 2009; Hume et al., 2005). In
terms of the X-factor stretch, a study conducted by Cole and Grimshaw (2009)
presented that the less skilled group exhibited a greater increase compared to the
skilled group, in contrast to information presented by Cheetham et al. (2001). The
possible reason for different results might be related to the methods used to define and
compute X-factor parameters. In order to standardize and validate the methods used in
computing the X-factor parameters, Kwon et al. (2013) have proposed a comparison of
the various methods of computation. The first method is more conventional, which
projects the hip and shoulder lines to the horizontal plane, then measures the angle
between them. The second method includes the plane of motion of the golf swing,

11
which is sloped, and thus uses a swing motion-oriented plane called the ‘functional
swing plane’ (Kwon et al., 2013). The third method uses the directly computed relative
orientation using a Cardan rotation sequence (Joyce et al., 2010). No direct relationship
existed between X-factor parameters and the maximum clubhead speed in the trials of
skilled golfers using a driver club (Joyce et al., 2010). In another study, the pelvic
rotation was significantly associated with higher clubhead speed, rather than with the X-
factor parameter (Lynn et al., 2014).
Delayed Release of Wrist
Although the relationship of delayed release to a high clubhead speed has been
debated, the delayed release of wrist cocking during the downswing can significantly
increase clubhead speed (McLaughlin & Best, 1994; Robinson, 1994; Sprigings & Neal,
2000). When the lead arm is parallel to the ground, professional golfers exhibited a
significantly more cocked-wrist position than amateur golfers (McLaughlin & Best, 1994;
Robinson, 1994). In an analysis using linear regression to assess 15 kinematic/kinetic
swing variables, Robinson (1994) asserted that the degree of wrist-cocking was the most
important determinant of the improvement in clubhead velocity. A computer simulation
study conducted by Sprigings and Neal (2000) highlighted the importance of wrist
torque applied to the club during the latter phases of the downswing for higher
clubhead speed. A wrist-cocked swing generates an additional 9% increase in clubhead
velocity at impact when the torques at impact were generated in proximal to distal
sequence and the lead arm was placed approximately 30° below the horizontal.

12
Sprigings and Mackenzie (2002) found that the use of an active wrist torque following
the delayed release was advantageous, as the main source of power transferred to the
club originated from the passive joint forces generated at the wrist joint.
Weight Shift and Foot-Ground Interaction
One concept that has gained significant attention in recent golf studies regarding
higher clubhead velocity at impact is weight shift, first introduced in Golf Digest by
Nelson (1980). However, while the term is frequently discussed in golf research, a
consensus on the definition of weight shift has remained elusive. Weight shift has been
variously described as: bodyweight shift quantified by GRF (Barrentine, Fleisig, Johnson,
& Woolley, 1994; Okuda, Gribble, & Amstrong, 2002; Williams & Cavanagh, 1983), COM
movement (Burden et al., 1998) or foot pressure variation (Dowlan, Brown, Ball, Best, &
Wrigley, 2001; Koenig, Tamres, & Mann, 1994; Wallace, Grimshaw, & Ashford, 1994;
Williams & Cavanagh, 1983). The magnitude of weight shift during the full golf swing
differs between amateur and elite golfers, as elite players significantly transferred more
of their weight toward their trail foot during the backswing and toward their lead foot
during the downswing (Koenig et al., 1994; Wallace, Graham, & Bleakley, 1990). To
effectively utilize GRF, the timing and the magnitude of shifted GRF was more important
than simply the magnitude of the GRF (Richards, Farrrell, Kent, and Kraft, 1985).
However, not all studies have supported the importance of weight shift in the golf
swing. It has been proposed that weight shift alone is not important but is necessary to
allow the body to rotate optimally (Rae, Fairweather, & Sanders, 2001).

13
An important task in a golf swing is to generate a high clubhead speed through
rotations of the body and club (Han et al., 2014). The rotational sequence of the
downswing begins from the ground up with lower extremity movement being beneficial
in producing higher clubhead speed at impact (Fujimoto-Kanatani, 1995). Maximum
external moments of the lead knee have been shown to be higher than in the trail knee
(27.7 Nm and 19.1 Nm, respectively) while maximum internal rotation torque of the
lead knee was slightly lower than the trail knee (16.1 ± 4.8 and 19.6 ± 8.1 Nm,
respectively) (Gatt, Pavol, Parker, & Grabiner, 1998). If the external resistance is created
through foot ground interaction, the golfer is unable to add force to the golfer/club
system and thus there is no change in moment. Limited research exists that investigates
the moments generated by the foot-ground interaction. However, PGA professionals
exhibited significantly more internal rotation torque about the lead foot than high
handicappers (Barrentine et al., 1994). Worsfield, Smith, and Dyson (2008) reported that
while using a driver, lower handicap golfers exhibited higher moments generated by the
feet and increased internal rotation of the lead foot. The eccentric GRFs acting on the
body due to foot-ground interactions generate force moments about the body’s COM,
promoting rotations of the body and club. It is the force moments that can contribute to
the clubhead speed (Han et al., 2014). Moreover, the peak frontal-plane GRF moment
and peak transverse-plane coupling moment showed significant correlations across all
club conditions, concluding that moment parameters provided more significant
associations with peak clubhead speed than forces (Han et al., 2014).

14
Physical Condition
The focus of past golf research has emphasized the technical, tactical, and
mental aspects of golf-specific training. The focus of recent golf research has shifted to
golf-specific strength and conditioning, and interventional training programs which may
be able to improve golf performances such as high clubhead speed and long distance
(Gordon, Moir, Davis, Witmer, & Cummings, 2009). The main purpose is to improve a
combination of balance, functional strength and flexibility (Smith, 2010). It has been
suggested that strength, muscle power, muscle balance, and aerobic conditioning are
physical contributors to greater clubhead speed (Hume et al., 2005). Through the
enhancement of specific physical conditioning, researchers have proposed that golfers
could increase clubhead speed (Doan, Newton, Kwon, & Kraemer, 2006; Hetu, Christie,
& Faigenbaum, 1998; Jones, 1999; Lennon, 1999; Lephart et al., 2007; Thompson, Myers,
& Blackwell, 2007; Westcott, Dolan, & Cavicchi, 1996).
The core muscle groups of the lower back, pelvis, and hips are essential to the
generation of a high rotational movement velocity during the golf swing. In a recent
study conducted by Gordon, Moir, Davis, Witmer, and Cummings (2009) on 15 male
golfers, total body rotational power, generated by throwing a medicine ball during a hip
toss movement, was significantly correlated to club head speed. Skilled golfers typically
demonstrate improved shoulder and core strength versus their less skilled counterparts
(Sell, Tsai, Smoliga, Myers, & Lephart, 2007). A significant correlation between the
strength of the gluteus medius and gluteus maximus muscles and clubhead velocity in

15
low handicap golfers was observed by Callaway and colleagues (Callaway et al., 2012).
This greater strength helped to transfer greater force to the golf ball. Keogh et al. (2009)
compared the strength of two groups (i.e., low and high handicap golfers) with a 12%
difference in clubhead speed. Participants performed a golf-specific rotational exercise
(i.e., a golf swing-specific cable woodchop), which is very similar to the golf swing in
terms of posture, range–of–motion, direction of force application and coordination
patterns. Low handicap golfers had a significantly greater woodchop strength, bench
press, and back squat strength, which were all statistically correlated to clubhead speed
(Keogh et al., 2009). These exercises are greatly effective in generating more power
from the whole body by mimicking the golf swing and may therefore improve the body
segmental sequence pattern, resulting in a more efficient transfer of power (Lephart et
al., 2007).
The relationship of strength and flexibility to clubhead speed of 15 male golfers’
full swings was investigated by Gordon et al. (2009). Trunk strength significantly
correlated to clubhead speed while rotational trunk flexibility did not. In another study,
no significant correlation was observed between clubhead speed and any range–of–
motion variables related to the flexibility of golfers (Keogh et al., 2009). Excessive
muscular hypertrophy may be negative because of the restricted motions of the core
muscles around the trunk and shoulder which could result in a decrement in golf
performance (Keogh et al., 2009). According to Green (2012), it is necessary for golfers
to acquire the ability to synergize the antagonistic effects of strength and flexibility in

16
order to maximize the rotational power of the golf swing (Gordon et al., 2009). Such an
improvement of muscle functionality while maintaining a high level of flexibility could
be beneficial to golf swing performance.
Club Characteristics
The effect of different types or deformations of the golf club-shaft on golf shot
outcomes have been examined in recent studies. An optimal shaft condition for
transferring kinetic energy from clubhead to ball is one which is straight at impact,
although the shaft flexibility can be observed throughout the downswing (Butler &
Windield, 1994). In a study using computer simulation, the bending flexibility of the
shaft involved the whipping effect, which contributes to a minor role in increasing
clubhead speed (Brylawski, 1994; Milne & Davis, 1992). Miao, Watari, Kawaguchi, and
Ikeda, (1999) conducted a correlation analysis between clubhead speed, grip speed, and
shaft flexibility, utilizing both a swing machine and actual golfers. The authors concluded
that the stiffness of the shaft and grip speed were significantly associated with clubhead
speed, suggesting that the relationship between clubhead speed and grip speed is
controlled partially by shaft flexibility and partially by the golfer’s ability to adjust to the
shaft’s dynamics. Therefore, the ability to use the shaft-flexibility property appropriately
is enhanced in skilled golfers when compared to less skilled golfers (Soriano, 1996).
Swing Model
The golf swing has been considered to be one of the most complex movements
(Burden et al., 1998; McHardy & Pollard, 2005; Nesbit & Serrano, 2005) in all of sports. It

17
would be of great value to create a model that would describe the golfer’s motions in
order to investigate the movement patterns of the entire body in detail during the
swing. The double pendulum model proposed initially by Cochran and Stobbs (1968)
was the first scientific model to describe the swing motion in golf biomechanical
research. The first mathematical verification of the quantities used in the equations that
describe the golf swing was a two dimensional double pendulum model. Introduced by
Jorgensen in 1970, he proposed that a delay in the uncocking of the wrist would result
in the improvement of clubhead speed. This model specifically served as a
representative prototype over for 50 years, which helped to simplify complicated
mechanical concepts related to the golf swing. In these models, segments consisted of
only two levers: an upper (the arms) and a lower (the club) lever. There is a fixed pivot
point (i.e., the wrist) for the moving segments, and those segments move in a single
planar motion during the swing. Many researchers (e.g., Jorgensen, 1970; Miura, 2001;
Pickering & Vickers, 1999; Sprigings & Neal, 2000) have, over several decades, analyzed
the golf swing motion using planar multi-pendulum swing models. However, recent
researchers have verified that the actual golf swing in the body and club systems during
the downswing is not planar (Coleman & Anderson, 2007; Coleman & Rankin, 2005;
Kwon et al., 2012; Neal & Wilson, 1985; Nesbit, 2005; Vaughan, 1981). In order to
improve the early golf swing model, the triple pendulum model was introduced
(Campbell & Reid, 1985; Sprigings & Mackenzie, 2002; Sprigings & Neal, 2000). In this
model, there are three levers: the left clavicle, the lead arm, and the club. The club

18
rotates around the pivot points of the hub at the top of the sternum and the wrists,
respectively. The left clavicle pivots around the spine and the left arm moves
independently from the rotation of the shoulders. With the development of technology
in capturing and analyzing golf swing motions, the development of a full body, multi
linked, three-dimensional biomechanical model is essential to gaining a more complete
and valid understanding on the swing (Dillman & Lange, 1994). Nesbit (2005) created a
computer simulation of the three-dimensional kinematics and kinetics of a golf swing
using 84 male golfers and one female amateur golfer of various skill levels. The full-body
model consisted of 16 segments including the club and 14 joints. Each joint was
spherical, and could move in three dimensions.
Summary
A variety of factors contribute to a higher clubhead speed. These factors include
kinematic sequence, kinetic energy transfer, X-factor, delayed release of wrist, weight
shift, foot-ground interaction, muscular strength, flexibility, and shaft flexibility. The
association between upper body motions, physical condition, and club conditioning to
peak clubhead speed has been investigated thoroughly. There is very little research on
the relationship between lower body motions and peak clubhead speed, possibly due to
the popularity of the double pendulum model. This study can offer valuable insights to
both the academic and the golf-practitioner communities by revealing key relationships
between the biomechanical factors of the lower extremity motions and the peak
clubhead speed.

19
CHAPTER III
METHODS
This chapter is divided into the following sections: participants, trial conditions,
data collection, data reduction and processing, data analysis, and statistical analysis.
Participants
A total of 25 healthy, right-handed, male golfers with a posted handicap of 3 or
better were recruited for this study (mass = 84.2 ± 9.0 kg; height = 182.3 ± 6.4 cm; age =
29.7 ± 7.9 years). The required sample size was estimated by using G*Power 3.1
software (effect size d = .8; significant level α = .05; power = .81). Golfers who were
suffering from any major injuries that might prevent full-effort golf swings were
excluded. The human participant research protocol was approved by the Institutional
Review Board of Texas Woman’s University and informed consents were obtained from
the participants prior to data collection. The purpose and procedures of the study were
explained to the participants prior to data collection.
Trial Conditions
Golfer performed swing trials with three different club conditions (i.e., driver, 5-
iron, and pitching wedge) using their own clubs in an indoor setting at Texas Woman’s
University Biomechanics Laboratory. Foam balls were used instead of actual golf balls.
Golfers chose their preferred tee heights.

20
Data Collection
A 250-Hz, 10-camera motion capture system (VICON, Centennial, CO, USA) was
used to capture the motion trajectories of a total of 65 reflective markers attached to
golfer’s body, club, and the ball plate during data collection (Figure 1). The reflective
markers were placed on the golfer’s body only by the principal investigator to ensure
consistency in marker placement across all participants. Golfers were required to wear
black spandex shorts and a black swimming cap for motion capture purposes. Golfers
wore their own gloves and shoes. Golfers were required to warm-up for at least 10 min
prior to data collection. Sufficient practice shots were allowed for acclimatization and to
find the optimal setup position and ball mat location for each golfer.
(a)
(b)
(c) (d)
Figure 1. Trials: club (a), ball plate (b), static posture (c), motion trial (d).

21
Camera calibration was performed before data collection. The global Y-axis
(laboratory reference frame) was aligned with the direction of shot toward the target
and the vertical axis (upward) was used as the global Z-axis. The global X-axis, therefore,
was the direction the right-handed golfers were facing at the setup (address) position.
Two AMTI force plates (Model OR6; Advanced Mechanical Technology, Inc.,
Watertowwn, MA, USA) were used to measure the ground reaction force data.
Data Reduction and Processing
Captured three-dimensional marker coordinates were imported into Kwon3D
Motion Analysis Suite (Version XP; Visol, Seoul, Korea) for subsequent processing and
analysis. The marker coordinates were digitally filtered using a Butterworth 4th-order
zero phase lag low-pass filter. The cutoff frequency was set at 30 Hz for clubface points
and at 15 Hz for the rest of the markers.
An 87-point body model (‘TWUGolfer’; Kwon et al., 2012) was used for the
processing. In this model, 15 segments (i.e., pelvis, abdomen, thorax, head, hips, knees,
feet, upper arms, right forearm, left radius, left ulna, and hands-club) were defined.
Twenty-two additional points (including 13 joint centers) were computed based on the
marker coordinates (Kwon et al., 2012). Zatsiorsky and Seluyanov’s body segment
parameters (ratios) corrected by De Leva (1996) were used in locating the COM of the
segments.
The segmental reference frame definitions, proximal-distal relationships among
the segments, and the rotation sequences were used to compute the orientation angles

22
(Kwon et al., 2013). Twenty reference frames (i.e., pelvis, abdomen, thorax, shoulder
girdles, head, hips, knees, feet, upper arms, right forearm, left ulna, left radius, hands-
club, clubface, and functional swing plane) were defined. The X-axes of the segmental
reference frames were aligned with the mediolateral axes of the segments, the Y-axes
with the anteroposterior axes, and the Z-axes with the longitudinal axes. Thirteen
degrees of freedom (joints/segments) were assigned to the golfer’s lower body: pelvis
(3), hip (3 each), knee (1 each), and ankle (1 each) (Table 1).
Data Analysis
Ten swing events were identified for the analysis (Figure 2): Address (AD), Mid
Backswing (MB), Late Backswing (LB), and End of Pelvis Rotation (EPR) during the
backswing; Top of Backswing (TB), Early Downswing Arm-based (EDA), Early Downswing
(ED), Mid Downswing (MD), Ball Impact (BI), and Mid Follow-through (MF) during the
downswing. EPR was used as the backswing to downswing transition event because the
lower body motions including pelvis motions were analyzed in this study.
The maximum clubhead speed immediately before the impact was extracted.
The OAs of the segments relative to their respective proximal segments and the RJM of
the joints were computed for the analysis. The orientation angles of the pelvis segment
and lower body joints were computed from the orientation matrices (Equations 1, 2,
and 3).

23
Table 1. Degrees of Freedom (Joint Motions) Assigned to Lower Body Joints
Joint/Segment Axis Orientation Angle Joint/Segment Motion Positive Negative Increase Decrease
Pelvis Z (Longitudinal) Left rotated Right rotated Left rotation Right rotation X (Mediolateral) Posteriorly tilted Anteriorly tilted Posterior tilting Anterior tilting Y (Anteroposterior) Right tilted Left tilted Right tilting Left tilting
R. Hip X (Mediolateral) Flexed Hyperextended Flexion Hyperextension Y (Anteroposterior) Adducted Abducted Adduction Abduction Z (Longitudinal) Internal rotated External rotated Internal rotation External rotation
R. Knee X (Mediolateral) Hyperextended Flexed Hyperextension Flexion R. Ankle X (Mediolateral) Dorsi-flexed Plantar-flexed Dorsi-flexion Plantar-flexion
L. Hip X (Mediolateral) Flexed Hyperextended Flexion Hyperextension Y (Anteroposterior) Abducted Adducted Abduction Adduction Z (Longitudinal) External rotated Internal rotated External rotation Internal rotation
L. Knee X (Mediolateral) Hyperextended Flexed Hyperextension Flexion L. Ankle X (Mediolateral) Dorsi-flexed Plantar-flexed Dorsi-flexion Plantar-flexion Directional abbreviations: R – right and L – left.

24
AD
MB
LB
EPR
TB
EDA
ED
MD
BI
MF Backswing Downswing Figure 2. Ten events during the backswing and downswing. Abbreviations: AD – Address, MB – Mid Backswing, LB – Late Backswing, EPR – End of Pelvis Rotation, TB – Top of Backswing, EDA – Early Downswing, Arm-based, ED – Early Downswing, MD – Mid Downswing, BI – Ball Impact, and MF – Mid Follow-through.

25
The axis unit vectors of the segmental reference frames form the global
orientation matrices (Kwon, 2008):
𝐓𝑃/𝐺 = � 𝐢𝑃𝐣𝑃𝐤𝑃
� = �𝑡11𝑃 𝑡12𝑃 𝑡13𝑃𝑡21𝑃 𝑡22𝑃 𝑡23𝑃𝑡31𝑃 𝑡32𝑃 𝑡33𝑃
�
𝐓𝐷/𝐺 = � 𝐢𝐷𝐣𝐷𝐤𝐷
� = �𝑡11𝐷 𝑡12𝐷 𝑡13𝐷𝑡21𝐷 𝑡22𝐷 𝑡23𝐷𝑡31𝐷 𝑡32𝐷 𝑡33𝐷
� , (1)
where 𝐓 is the 3 × 3 orientation matrix, 𝑃 is the proximal segment, 𝐷 is the distal
segment, 𝐺 is the global reference frame, i, j, and k are the axis unit vectors of the
segmental reference frame, and t11 – t33 are the components of the axis unit vectors.
The relative orientation matrix of the distal reference frame (frame 𝐷) to the proximal
reference frame (frame 𝑃) was computed from the orientation matrices shown in
Equation 1.
𝐓𝐷/𝑃 = 𝐓𝐷/𝐺𝐓𝑃/𝐺 = 𝐓𝐷/𝐺 𝐓′𝑃/𝐺 (2)
where 𝐓𝐷/𝑃 is the relative orientation matrix of frame D to frame P, and 𝐓′ is the
transpose of 𝐓. Relative orientation angles of the segments to their respective linked
proximal segments were computed from relative orientation matrices using the
mediolateral–anteroposterior–longitudinal (XYZ) rotation sequence:
�𝐶2𝐶3 𝑆1𝑆2𝐶3 + 𝐶1𝑆3 −𝐶1𝑆2𝐶3 + 𝑆1𝑆3−𝐶2𝐶3 −𝑆1𝑆2𝐶3 + 𝐶1𝑆3 𝐶1𝑆2𝐶3 + 𝑆1𝑆3𝑆1 −𝑆1𝐶2 𝐶1𝐶2
� = 𝐓𝐷 𝑃⁄ , (3)
where 𝐶 and 𝑆 are cos 𝜃 and sin𝜃, respectively, and 𝜃1,𝜃2,and 𝜃3 are the relative
orientation angles of the distal segment to the proximal segment forming the joint.

26
The kinetic data involving resultant joint moments for each joint was
calculated using inverse dynamics (Equations 4 and 5; Figure 3) based on Newton’s
equation of motion:
𝐅𝑗 = 𝐌𝑗 + 𝐉𝑗 = ∑ 𝑑𝐏𝑠𝑑𝑡𝑠 − ∑ 𝐖𝑠𝑠 − 𝐅𝐸 (4)
𝐍𝑗 = 𝐫𝑗 × 𝐌𝑗 = ∑ �𝑑𝐋𝑠𝑑𝑡
+ 𝐫𝑗𝑠 × 𝑑𝐏𝑠𝑑𝑡� − ∑ �𝐫𝑗𝑠 × 𝐖𝑠� − �𝐫𝑗𝐸 × 𝐅𝐸 + 𝐍𝐸�𝑠𝑠 (5)
where 𝐅𝑗 is the resultant joint force acting at the joint, 𝐌𝑗 is the muscle force not
passing through the axis of rotation, 𝐉𝑗 is the joint contact force passing through axis of
rotation (bone-on-bone force), 𝐏𝑠 is the linear momentum of the segment which is the
same as the sum of inertial forces, 𝐖𝑠 is the weight of the segments due to gravitational
force, 𝐅𝐸 is the ground reaction force which is the additional external force from the
environment acting on the segment, 𝐍𝑗 is the resultant joint moment acting at the joint,
𝐫𝑗 is the relative position vector of muscle attachment to the joint, 𝐋𝑠 is the local angular
momentum of the segment due to the rotation of the segment about its own segmental
COM, 𝐫𝑗𝑠 is the relative position vector of each segment’s COM to the joint, 𝐫𝑗𝐸 is the
relative position vector of the joint to the point of the application of the additional
external force, and 𝐍𝐸 is the additional external moment.
The peak orientation angles were identified to describe the ranges of the
orientation angles in each joint while performing the golf swing. The orientation angle
and joint moment parameters used in this study are shown in Figures 4a and 4b.

27
Figure 3. Free body diagram of left hip joint

28
(a)
(b)
Figure 4. Exemplar OA (a) and RJM (b) parameters used during the downswing phase: (a) Pelvis defined as the longitudinal–mediolateral–anteroposterior–(ZXY) rotation sequence. P𝜃1,P𝜃2, and, P𝜃3 were defined as peak orientation angles in the longitudinal, mediolateral, and anteroposterior axes, respectively. ∆𝜃1,∆𝜃2, and ∆𝜃3 were defined as ranges of the orientation angles in the longitudinal, mediolateral, anteroposterior axes, respectively. (b) Peak resultant joint moments in the right hip joints. SP1 – peak joint moment in the sagittal plane, FP1 and FP2 – peak joint moments in the frontal plane, and TP1 and TP2 – peak joint moments in the transverse plane.

29
The ensemble average patterns of the OA and RJM during the golf swing were
derived using AD to MF phases as 100% time. The ensemble average patterns of the OA
parameters are presented in Figures 5, 6, and 7 for the driver, 5-iron, and the pitching
wedge, respectively. All peak orientation angles occurred in the early downswing phase,
during the transition from backswing to downswing (Figures 5, 6, and 7). Therefore, the
OA parameters during the backswing were excluded from all subsequent analyses.
The ensemble average patterns of the RJM patterns of the lower extremity joints
are presented in Figures 8, 9, and 10 for the driver, 5-iron, and the pitching wedge,
respectively. During the downswing, two peaks were identified in the right hip joint are
identified in the frontal and transverse planes. Two peaks were also identified in the left
hip joint in the sagittal and transverse planes. Peak joint moments in the knees and
ankles were observed in the early downswing phase.
Based on the ensemble average patterns of OA and RJM parameters, peak OA
and ranges of the lower extremity joints (i.e., pelvis, hips, knees, and ankles) during the
downswing, peak RJM of the lower extremity joints (i.e., hips, knees, and ankles), were
extracted for a correlation analysis to normalized peak clubhead speed. The peak
clubhead speeds and the RJM were normalized to golfer’s body height (BH) and mass
(BM), respectively, to eliminate the effect of body size.

30
(a)
(b) (c)
(d) (e)
(f) (g)
Figure 5. Ensemble-average patterns of OA in driver condition: Event: 1 – AD, 2 – MB, 3 – LB, 4 – EPR, 5 – TB, 6 – EDA, 7 – ED, 8 – MD, 9 – BI, and 10 – MF. The AD-MF phase was used as 100% time. Directional abbreviations: A – anterior, P – posterior, R – right, L – left, I – internal and E – external. Relative positions: T – tilted, R –rotated, F – flexed, HE – hyperextended, EX – extended, AD – adducted, AB – abducted, D – dorsi-flexed, and P – plantar-flexed.

31
(a)
(b)
(c)
(d) (e)
(f) (g)
Figure 6. Ensemble-average patterns of OA in 5 - iron condition: Event: 1 – AD, 2 – MB, 3 – LB, 4 – EPR, 5 – TB, 6 – EDA, 7 – ED, 8 – MD, 9 – BI, and 10 – MF. Directional abbreviations: A – anterior, P – posterior, R – right, L – left, I – internal and E – external. Relative positions: T – tilted, R –rotated, F – flexed, HE – hyperextended, EX – extended, AD – adducted, AB – abducted, D – dorsi-flexed, and P – plantar-flexed.

32
(a)
(b) (c)
(d) (e)
(f) (g)
Figure 7. Ensemble-average patterns of OA in pitching wedge condition: Event: 1 – AD, 2 – MB, 3 – LB, 4 – EPR, 5 – TB, 6 – EDA, 7 – ED, 8 – MD, 9 – BI, and 10 – MF. Directional abbreviations: A – anterior, P – posterior, R – right, L – left, I – internal and E – external. Relative positions: T – tilted, R –rotated, F – flexed, HE – hyperextended, EX – extended, AD – adducted, AB – abducted, D – dorsi-flexed, and P – plantar-flexed.

33
(a)
(b)
(c)
(d)
(e)
(f)
Figure 8. Ensemble-average patterns of normalized RJM in driver condition: Event: 1 – AD, 2 – MB, 3 – LB, 4 – EPR, 5 – TB, 6 – EDA, 7 – ED, 8 – MD, 9 – BI, and 10 – MF. The AD-MF phase was used as 100% time. Directional abbreviations: I – internal and E – external. Moment abbreviations: F – flexor, HE – hyperextensor EX – extensor, AD – adductor, AB – abductor, R – rotator, D – dorsi-flexor, and P – plantar-flexor.

34
(a)
(b)
(c)
(d)
(e)
(f)
Figure 9. Ensemble-average patterns of normalized RJM in 5 - iron condition: Event: 1 – AD, 2 – MB, 3 – LB, 4 – EPR, 5 – TB, 6 – EDA, 7 – ED, 8 – MD, 9 – BI, and 10 – MF. The AD-MF phase was used as 100% time. Directional abbreviations: I – internal and E – external. Moment abbreviations: F – flexor, HE – hyperextensor EX – extensor, AD – adductor, AB – abductor, R – rotator, D – dorsi-flexor, and P – plantar-flexor.

35
(a)
(b)
(c)
(d)
(e)
(f)
Figure 10. Ensemble-average patterns of normalized RJM in pitching-wedge condition: Event: 1 – AD, 2 – MB, 3 – LB, 4 – EPR, 5 – TB, 6 – EDA, 7 – ED, 8 – MD, 9 – BI, and 10 – MF. The AD-MF phase was used as 100% time. Directional abbreviations: I – internal and E – external. Moment abbreviations: F – flexor, HE – hyperextensor EX – extensor, AD – adductor, AB – abductor, R – rotator, D – dorsi-flexor, and P – plantar-flexor.

36
Statistical Analysis
The select variables (Tables 2 and 3) used in the statistical analyses were peak
OA and ranges of OA of the lower extremity joints (i.e., pelvis, hips, knees, and ankles)
during the downswing, peak joint moments of the lower extremity joints (i.e., hips,
knees, and ankles), and peak clubhead speed. The mean values of the five repeated
trials were used in the statistical analyses. Pearson’s product–moment correlation
coefficients (r) were computed between the OA and RJM parameters and peak clubhead
speed in each club condition. An alpha level of .05 was used in all tests. All statistical
analyses were conducted using SPSS V. 19.0 (SPSS, Inc., Chicago, IL).

37
Table2. OA Parameters for Data Analysis during Downswing Plane Joint Peak Position Joint Motion
Sagittal
Pelvis Max Anteriorly tilted Posterior Tilting R. Hip Max Flexed Extension L. Hip Max Flexed Extension R. Knee Max Flexed Extension L. Knee Max Flexed Extension R. Ankle Max Dorsi-flexed Extension L. Ankle Max Dorsi-flexed Extension
Frontal
Pelvis Max left tilted Right tilting Max Right tilted
R. Hip Max Adducted Abduction Max Abducted
L. Hip Max Abducted Adduction Max Adducted
Transverse Pelvis Max Right rotated Left Rotation Max Left rotated R. Hip Max Internal rotated Internal rotation L. Hip Max Internal rotated Internal rotation
OA – Orientation angle. Directional abbreviations: R – right and L – left.
Table3. RJM Parameters for Data Analysis Plane Joint Dominant muscle of Peak RJM
Sagittal
R. Hip Extensor
L. Hip Flexor (P1) Extensor (P2)
R. Knee Flexor L. Knee Extensor R. Ankle Plantar-flexor L. Ankle Plantar-flexor
Frontal R. Hip Abductor (P1) Adductor (P2)
L. Hip Adductor
Transverse R. Hip Internal rotator (P1)
External rotator (P2)
L. Hip Internal rotator (P1) Internal rotator (P2)
Directional abbreviations: R – right and L – left. P1 – first peak, and P2 – second peak.

38
CHAPTER IV
RESULTS
This chapter is divided into the following sections: orientation angle and
resultant joint moment.
Orientation Angle
The mean maximum clubhead speeds at impact were 25.9 ± 1.1 BH/s (47.0 ± 2.0
m/s), 21.8 ± 1.0 BH/s (39.4 ± 1.8 m/s), and 19.7 ± 1.2 BH/s (35.9 ± 2.0 m/s) for driver, 5-
iron, and pitching wedge, respectively. Correlation coefficients (r) of OA parameters to
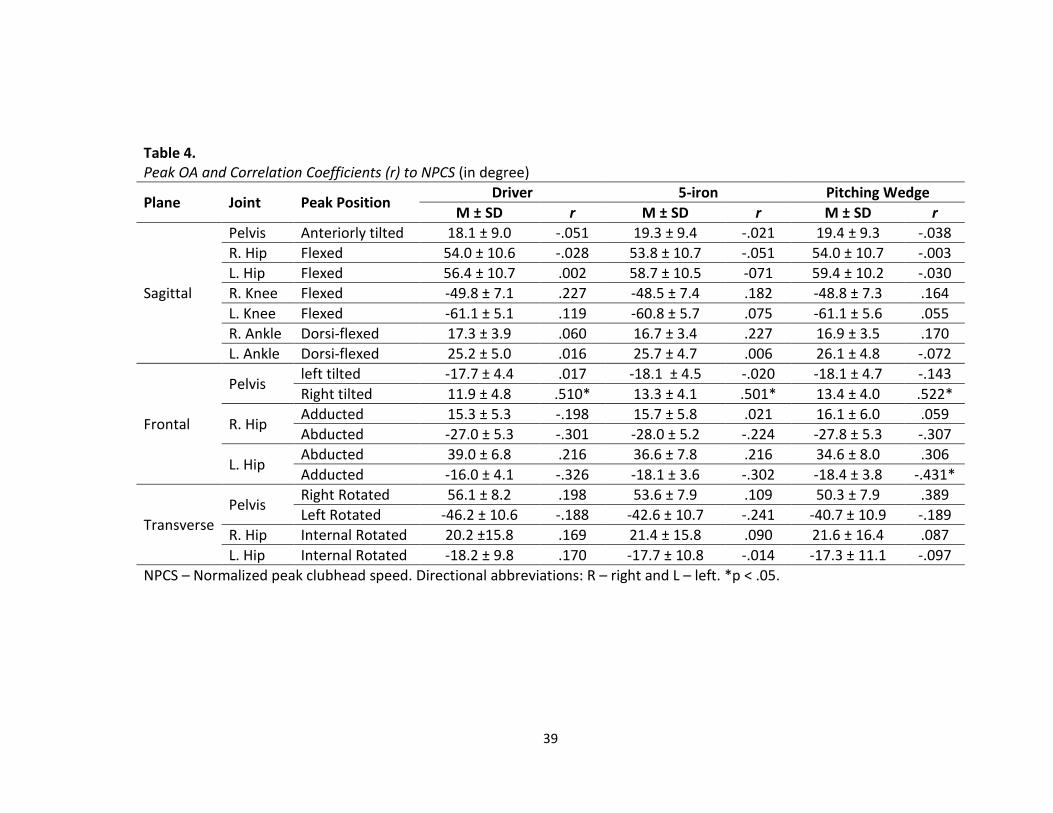
normalized peak clubhead speed (NPCS) are presented in Tables 4 and 5. Among the
peak position values of OA, the maximum right tilted position values of the pelvis during
the downswing revealed significant correlations to NPCS across all club conditions. The
maximum adducted position of the left hip joint in pitching wedge condition exhibited a
significant correlation to NPCS during the downswing. Among the ranges of OA, the
pelvis right-tilting range during the downswing consistently yielded significant
correlations to NPCS across all club conditions. Right hip extension range in pitching
wedge condition, left hip adduction range in driver and pitching wedge conditions, and
pelvis left rotation range in pitching wedge condition showed significant correlations to
NPCS during the downswing.
39
Table 4. Peak OA and Correlation Coefficients (r) to NPCS (in degree)
Plane Joint Peak Position Driver 5-iron Pitching Wedge M ± SD r M ± SD r M ± SD r
Sagittal
Pelvis Anteriorly tilted 18.1 ± 9.0 -.051 19.3 ± 9.4 -.021 19.4 ± 9.3 -.038 R. Hip Flexed 54.0 ± 10.6 -.028 53.8 ± 10.7 -.051 54.0 ± 10.7 -.003 L. Hip Flexed 56.4 ± 10.7 .002 58.7 ± 10.5 -071 59.4 ± 10.2 -.030 R. Knee Flexed -49.8 ± 7.1 .227 -48.5 ± 7.4 .182 -48.8 ± 7.3 .164 L. Knee Flexed -61.1 ± 5.1 .119 -60.8 ± 5.7 .075 -61.1 ± 5.6 .055 R. Ankle Dorsi-flexed 17.3 ± 3.9 .060 16.7 ± 3.4 .227 16.9 ± 3.5 .170 L. Ankle Dorsi-flexed 25.2 ± 5.0 .016 25.7 ± 4.7 .006 26.1 ± 4.8 -.072
Frontal
Pelvis left tilted -17.7 ± 4.4 .017 -18.1 ± 4.5 -.020 -18.1 ± 4.7 -.143 Right tilted 11.9 ± 4.8 .510* 13.3 ± 4.1 .501* 13.4 ± 4.0 .522*
R. Hip Adducted 15.3 ± 5.3 -.198 15.7 ± 5.8 .021 16.1 ± 6.0 .059 Abducted -27.0 ± 5.3 -.301 -28.0 ± 5.2 -.224 -27.8 ± 5.3 -.307
L. Hip Abducted 39.0 ± 6.8 .216 36.6 ± 7.8 .216 34.6 ± 8.0 .306 Adducted -16.0 ± 4.1 -.326 -18.1 ± 3.6 -.302 -18.4 ± 3.8 -.431*
Transverse Pelvis Right Rotated 56.1 ± 8.2 .198 53.6 ± 7.9 .109 50.3 ± 7.9 .389
Left Rotated -46.2 ± 10.6 -.188 -42.6 ± 10.7 -.241 -40.7 ± 10.9 -.189 R. Hip Internal Rotated 20.2 ±15.8 .169 21.4 ± 15.8 .090 21.6 ± 16.4 .087 L. Hip Internal Rotated -18.2 ± 9.8 .170 -17.7 ± 10.8 -.014 -17.3 ± 11.1 -.097
NPCS – Normalized peak clubhead speed. Directional abbreviations: R – right and L – left. *p < .05.

40
Table 5. Range of OA and Correlation Coefficients (r) to NPCS (in degree)
Plane Joint Joint Motion Driver 5-iron Pitching Wedge M ± SD r M ± SD r M ± SD r
Sagittal
Pelvis Posterior Tilting 19.8 ± 4.5 -.251 18.1 ± 4.6 -.207 17.0 ± 4.3 -.094 R. Hip Extension 49.2 ± 8.5 .272 42.2 ± 8.2 .130 37.6 ± 8.8 .427* L. Hip Extension 32.3 ± 9.1 -.141 31.4 ± 8.3 -.271 30.2 ± 7.9 -.066 R. Knee Extension 16.8 ± 8.2 .179 14.6 ± 7.8 .117 13.4 ± 7.7 .090 L. Knee Extension 32.7 ± 8.8 .119 31.0 ± 9.5 -.001 29.5 ± 8.2 .128 R. Ankle Plantar-flexion 25.4 ± 8.1 -.056 17.1 ± 7.8 -.049 13.0 ± 6.7 -.044 L. Ankle Plantar-flexion 18.4 ± 5.8 .217 18.4 ± 5.3 .120 17.7 ± 4.9 .186
Frontal Pelvis Right tilting 29.6 ± 5.3 .450* 31.4 ± 5.3 .409* 31.5 ± 5.6 .493* R. Hip Abduction 42.3 ± 6.3 .086 43.8 ± 6.6 .194 43.8 ± 6.7 .292 L. Hip Adduction 55.0 ± 6.3 .444* 54.7 ± 7.2 .383 52.9 ± 7.9 .515*
Transverse Pelvis Left rotation 102.3 ± 9.9 .366 96.2 ± 9.2 .373 91.0 ± 11.1 .465* R. Hip Internal rotation 15.1 ± 5.2 .169 14.7 ± 5.0 .085 14.8 ± 5.6 .159 L. Hip Internal rotation 17.2 ± 4.9 .125 15.7 ± 5.3 .051 14.6 ± 4.8 .090
NPCS – Normalized peak clubhead speed. Directional abbreviations: R – right and L – left. *p < .05.

41
Resultant Joint Moment
Table 6 shows the correlation coefficients (r) of the normalized RJM parameters
to NPCS during the downswing. Right hip extensor, left hip flexor (P1), left knee
extensor, and right ankle plantar-flexor moments in the sagittal plane and right hip
adductor moment (P2) in the frontal plane exhibited significant correlations to NPCS
across all club conditions. Right knee flexor moments in driver and pitching wedge
conditions and left ankle plantar-flexor moment in driver condition showed significant
correlations to NPCS in the sagittal plane. Left hip adductor moments in 5-iron and
pitching wedge conditions showed significant correlations to NPCS in the frontal plane.
Right hip external rotator moment in pitching wedge condition showed significant
correlations to NPCS in the transverse plane.

42
Table 6. RJM and Correlation Coefficients (r) to NPCS (in Nm/kg)
Plane Joint Dominant Muscle Driver 5-iron Pitching Wedge M ± SD r M ± SD r M ± SD r
Sagittal
R. Hip Extensor 2.39 ± .25 .396* 2.26 ± .26 .667* 2.17 ± .28 .732*
L. Hip Flexor (P1)§ .94 ± .33 .424* .73 ±.35 .544* .60 ± .32 .597* Extensor (P2)§ 1.06 ± .41 -.198 1.2 ± .40 -.222 1.34 ± .34 -.255
R. Knee Flexor .86 ± .23 .527* .85 ±.19 .383 .84 ± .20 .465* L. Knee Extensor 1.90 ± .39 .451* 1.58 ± .39 .449* 1.48 ± .38 .457* R. Ankle Plantar-flexor .74 ± .23 .515* .63 ± .19 .609* .55 ± .19 .547* L. Ankle Plantar-flexor .76 ± .36 .447* .76 ± .34 .183 .74 ± .36 .189
Frontal R. Hip
Abductor(P1)§ .91 ± .13 .030 .83 ± .22 .142 .82 ± .22 .210 Adductor(P2)§ 1.0 ± .14 .456* .67 ± .22 .585* .58 ± .20 .502*
L. Hip Adductor .58 ± .23 .384 .50 ± .16 .437* .44 ± .14 .572*
Transverse R. Hip Internal rotator (P1)§ .45 ± .08 -.106 .40 ± .15 .075 .40 ± .18 .149
External rotator (P2)§ .94 ± .16 .243 .84 ± .23 .375 .80 ± .21 .468*
L. Hip Internal rotator (P1)§ .33 ±. 21 -.077 .19 ± .20 -.265 .12 ± .18 -.260 Internal rotator (P2)§ .38 ± .18 .194 .55 ± .19 -.071 .46 ± .21 .084
NPCS – Normalized peak clubhead speed. Directional abbreviations: R – right and L – left. P1 – first peak and P2 – second peak. § See Figures 8, 9, and 10 for the peaks. *p < .05.

43
CHAPTER V
DISCUSSION
This study investigated the associations between peak clubhead speed and select
kinematic and kinetic parameters of the lower extremities in skilled golfers. Normalized
peak clubhead speed and peak OA and ranges of the lower extremities joints (i.e., pelvis,
hips, knees, and ankles) and normalized RJM parameters of the lower extremities joints
(i.e., hips, knees, and ankles) were calculated in three anatomical planes of motion
(i.e., sagittal, frontal, and transverse).
Orientation Angle
During the downswing, the pelvis motions were characterized by an initial
anterior tilt and a left lateral tilt followed by a posterior tilt and a right lateral tilt. The
pelvis exhibited continuous right rotation (Figures 5a, 6a, and 7a). The right hip joint
motions revealed a transition from adduction to abduction and consistent flexed and
internal-rotated positions (Figures 5b, 6b, and 7b). The left hip joint motions were
demonstrated by transitions from flexion and abduction to extension and adduction,
and consistent flexed and right-rotated positions (Figures 5c, 6c, 7c). The right and left
knee were observed with continuous flexed positions throughout the downswing. The
right and left knees were characterized by a transition of flexion to extension (Figures 5d,
6d, 7d, 5e, 6e, and 7e). The right ankle motion was characterized by a transition from

44
dorsi-flexion to plantar-flexion (Figures 5f, 6f, and 7f). The left ankle exhibited a
consistent flexed position and was transferred from dorsi-flexion to plantar-flexion
(Figure 5g, 6g, 7g). Similar patterns in terms of OA parameters were observed in all club
conditions.
Among the peak OA variables, only the right lateral tilted position of the pelvis
was significantly correlated to NPCS across all the club conditions during the downswing
(Table 4). Additionally, among the ranges of OA, only the right tilting motion range of
the pelvis showed significant correlations to NPCS across all club conditions during the
downswing (Table 5). Therefore, the pelvis motion in the frontal plane could be the
good consistent indicator of clubhead speed.
Among OAs during the downswing, the left rotation of the pelvis exhibited the
largest motion range (102.3, 96.2, and 91.0° for driver, 5-iron, and pitching wedge,
respectively), followed by the left hip adduction (55, 54.7, and 52.9° for driver, 5-iron,
and pitching wedge, respectively) and the right hip extension (49.2, 42.2, and 37.6° for
driver, 5-iron, and pitching wedge, respectively). Also, the pelvis right tilting (29.6, 31.4,
and 31.5° for driver, 5-iron, and pitching wedge, respectively) and the left hip extension
(32.3, 31.4, and 30.2° for driver, 5-iron, and pitching wedge, respectively) revealed
substantial motion ranges (Table 5). One of the most controversial aspects of the recent
golf swing has been whether the limited motion ranges of pelvis and hip is more
effective in generating higher clubhead speed. The findings from this study indicated the
pelvis in the transverse and frontal planes and the right and left hips in the sagittal and

45
frontal planes demonstrated sufficient motion ranges during the
downswing. Additionally, among OAs during the downswing, significant correlations to
NPCS were observed in pelvis and right/left hip joint motions while no significant
correlations to NPCS in knee and ankle joint motions were observed (Table 5). Therefore,
as long as the motion ranges of the pelvis and the right/left hip joints are placed within
the base of support, the motions of pelvis and hip joints should be not limited in
generating higher clubhead speed during the downswing.
Resultant Joint Moment
The RJM patterns of lower extremity joints are presented in Figures 8, 9, and 10.
The sagittal plane component of the right hip joint moment showed a continuous
dominance of the flexor moment with one peak. The frontal plane component was
characterized by the initial adductor dominant phase followed by the abductor
dominant phase with each peak (e.g., adductor peak and abductor peak). The transverse
plane component presented the initial internal rotator dominant phase followed by the
external rotator dominant phase with two peaks (e.g., internal rotator peak and external
rotator peak) (Figures 8a, 9a, and 10a). The sagittal plane component of the left hip joint
moment exhibited the initial flexor dominant phase followed by extensor dominant
phase with two peaks (e.g., flexor peak and extensor peak). The frontal plane
component was characterized by the initial adductor dominant phase followed by the
abductor dominant phase with one peak (e.g., adductor peak). The transverse plane
component showed internal rotator dominant phase with two peaks (e.g., two internal

46
rotator peaks) (Figures 8b, 9b, and 10b). The right knee was characterized by the
dominance of initial extensor moment followed by flexor moment and another extensor
moment with one peak (e.g., flexor peak). The left knee was characterized by the
dominance of initial extensor moment followed by flexor moment with one peak (e.g.,
extensor peak) (Figures 8c, 9c, 10c, 8d, 9d, and 10d). The plantar-flexor moments of
right and left ankles were consistently dominant throughout the downswing with one
peak each (e.g., plantar-flexor peak) (Figure 8e, 9e, 10e, 8f, 9f, and 10f). Similar patterns
in terms of the peak RJM parameters were observed in all club conditions.
Among the club conditions, RJM parameters with the driver and pitching wedge
conditions revealed the greatest number of significant correlations to NPCS (Table 6).
The RJM parameters in the sagittal, frontal, and transverse planes included in Table 6
explain 76, 55, 8% of the significant correlations to NPCS, respectively, suggesting the
RJMs in the sagittal plane are affecting the peak clubhead speed the most.
Among the RJM parameters, the right hip extensor moment revealed the largest
RJM value, followed by the left knee extensor moment (Table 6). Among hip joint
moments, the largest right hip extensor moment was consistent with the outcome of a
previous study (Foxworth et al., 2013), which compared the three dimensional hip joint
moments between the right and left legs. This result was also supported by the finding
of another study in which the gluteus maximus of the right leg, which serves as the right
hip extensor, was the most active hip muscle and drove the flexed hip into extension
during the downswing (Gatt et al., 1998). With regard to knee joint moments, the
47
finding in this study was consistent with a previous study conducted by Gatt et al., in
1998. Among knee RJMs, the maximal left knee extensor moment occurred in the
sagittal plane. Also, the right hip extensor and left knee extensor moments in the
sagittal plane exhibited significant correlations to NPCS across all club conditions. Based
on these results, the skilled golfers relied on more muscular effort of the right hip and
left knee joints in the sagittal plane to generate higher clubhead speed.
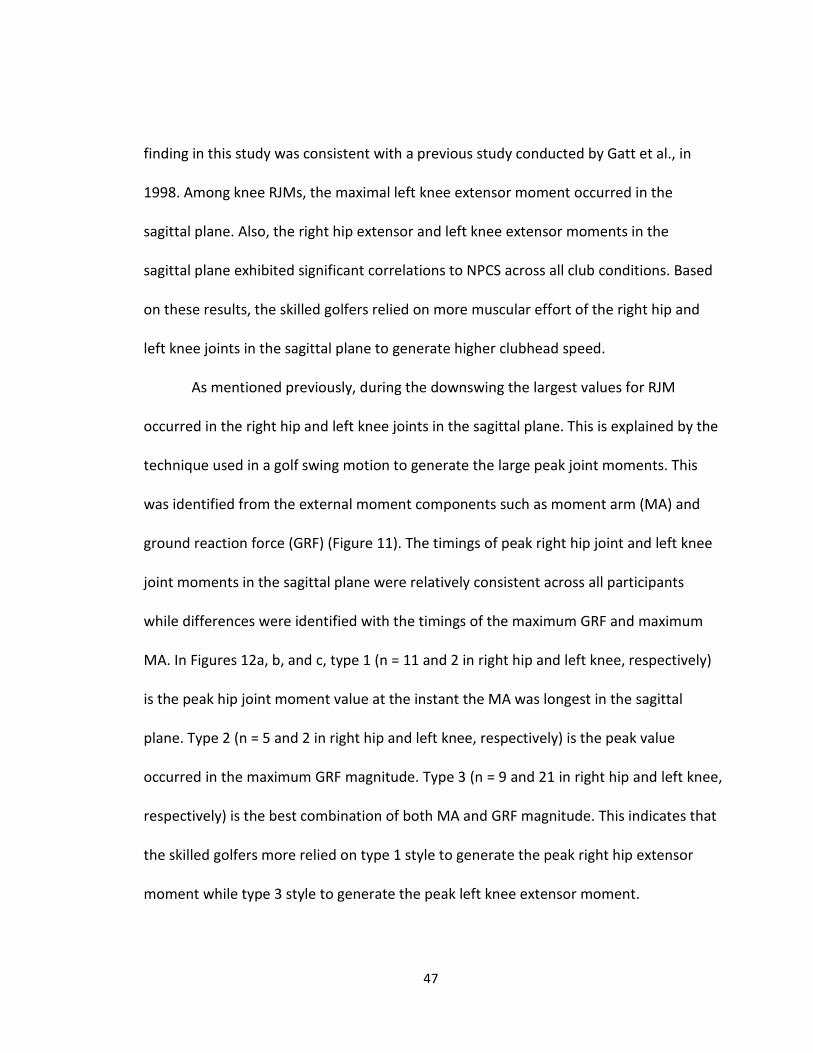
As mentioned previously, during the downswing the largest values for RJM
occurred in the right hip and left knee joints in the sagittal plane. This is explained by the
technique used in a golf swing motion to generate the large peak joint moments. This
was identified from the external moment components such as moment arm (MA) and
ground reaction force (GRF) (Figure 11). The timings of peak right hip joint and left knee
joint moments in the sagittal plane were relatively consistent across all participants
while differences were identified with the timings of the maximum GRF and maximum
MA. In Figures 12a, b, and c, type 1 (n = 11 and 2 in right hip and left knee, respectively)
is the peak hip joint moment value at the instant the MA was longest in the sagittal
plane. Type 2 (n = 5 and 2 in right hip and left knee, respectively) is the peak value
occurred in the maximum GRF magnitude. Type 3 (n = 9 and 21 in right hip and left knee,
respectively) is the best combination of both MA and GRF magnitude. This indicates that
the skilled golfers more relied on type 1 style to generate the peak right hip extensor
moment while type 3 style to generate the peak left knee extensor moment.

48
Figure 11. Exemplar moment arm from the line of action of the GRF vector to each joint and the magnitude of GRF at the instant of peak right hip RJM in the sagittal plane.

49
(a) Type 1
(b) Type 2
(c) Type 3 Figure12. Exemplar MA and GRF patterns at the instant of peak right hip RJM in the sagittal plane. Type 1 (max MA; a), Type2 (max GRF; b), and Type3 (combination of MA and GRF; c).

50
Different dominant muscles were used between the right hip extensor and left
hip flexor moments (P1), the right knee flexor and left knee extensor moments, and the
right hip abductor (P1) and left hip adductor moments at the instant of peak RJM
(Tables 6, 7, and 8). This could be explained by the discrepancy in the direction of the
GRF vector to each hip and knee joint center between the two legs. For example, in the
sagittal plane, the directions of the GRF vector to each joint center were
counterclockwise (+) in the right hip and knee while clockwise (–) in the left hip and
knee. As a result, the moments in the hip and knee joints between the two legs were
produced by the dominant muscles in the opposite direction (e.g., the right hip extensor
[–] and left hip flexor [+] moments and the right knee flexor [–] and left knee extensor [+]
moments).
Different types of muscle contractions occurred at the instant of peak RJMs
(Table 7). Based upon OA and RJM results, the type of muscle contractions can be
obtained. If the OA and the RJM results are in the same direction, a concentric
contraction occurred in that muscle group. If the results are in opposite directions, an
eccentric contraction occurred. In the transverse plane, for example, the right hip
muscles in the first peak (P1) exhibited an eccentric internal rotator contraction while
the right hip muscles in the second peak (P2) showed a concentric external rotator
contraction due to different RJM directions. The right /left hip, knee, ankle joints
exhibited the types of concentric contractions in three motion planes except for the
right hip eccentric contraction of the second peak (P2) in the transverse plane.

51
Therefore, the muscle contractions of the lower extremities that occurred at the instant
of peak RJMs are primarily concentric contractions.
Table7. Type of Muscle Contraction at Peak RJM
Plane Joint Dominant Muscle Joint Motion Type of Contraction
Sagittal
R. Hip Extensor Extension CON
L. Hip Flexor (P1)§ Flexion CON Extensor (P2)§ Extension CON
R. Knee Flexor Flexion CON L. Knee Extensor Extension CON R. Ankle Plantar-flexor Plantar-flexion CON R. Ankle Plantar-flexor Plantar-flexion CON
Frontal R. Hip Abductor (P1)§ Abduction CON Adductor (P2)§ Adduction CON
L. Hip Adductor Adduction CON
Transverse R. Hip Internal rotator (P1)§ External-rotation ECC
External rotator (P2)§ External-rotation CON
L. Hip Internal rotator (P1)§ Internal-rotation CON Internal rotator (P2)§ Internal-rotation CON
Directional abbreviations: R –right and L – left. Contraction abbreviations: CON – concentric and ECC – eccentric. P1 – first peak and P2 – second peak. § See Figures 8, 9, and 10 for the peaks.
The hip joint (between TB and EDA event; early downswing phase) reached the
fastest peak joint moments followed by the knee joint (around EDA event) and the ankle
joint (around ED event) (Table 8; Figures 8, 9, and 10). It is important to reach peak RJM
values early in lower extremity joints so the golfer has enough time to accelerate the
upper body and clubhead to obtain a higher clubhead speed. These findings can help
explain the different roles exhibited by the lower body, which dominates the early
downswing movement. The upper body controls or leads the mid-downswing

52
movement. After EDA or ED, each lower extremity joint’s RJM started to reduce,
indicating a reduction in the moment applied to rotate the pelvis (Table 8; Figures 8, 9,
and 10). The angular momentum generated through the foot-ground interaction and
muscle actions is transferred to the upper body and the clubhead through the lower
body. These results complement the findings in previous studies that describe the
kinetic chain during a golf swing (Burden et al., 1998; Callaway et al., 2012; Horan et al.,
2010; Joyce et al., 2010; Lephart et al., 2007; Neal & Dalgleish, 2008; Tinmark et al.,
2010).
Table 8. Peak RJM Timing (%)
Plane Joint Dominant Muscle Driver 5-iron Pitching Wedge
Timing (%) Timing (%) Timing (%)
Sagittal
R. Hip Extensor 83 83 83
L. Hip Flexor (P1)§ 77 78 78 Extensor (P2)§ 94 94 94
R. Knee Flexor 83 83 83 L. Knee Extensor 85 84 84 R. Ankle Plantar-flexor 87 87 87 L. Ankle Plantar-flexor 87 87 89
Frontal R. Hip
Abductor(P1)§ 73 70 70 Adductor(P2)§ 94 94 94
L. Hip Adductor 83 83 83
Transverse R. Hip Internal rotator (P1)§ 75 75 74
External rotator (P2)§ 93 93 93
L. Hip Internal rotator (P1)§ 77 77 77 Internal rotator (P2)§ 95 94 93
NPCS – Normalized peak clubhead speed. Directional abbreviations: R – right and L – left. P1 – first peak and P2 – second peak. § See Figures 8, 9, and 10 for the peaks. Event timings during the downswing phase: EPR (69), TB (71), EDA (84), ED (87), MD (92), BI (95), and MF (100).

53
Conclusion
This proposed study offers valuable insights into the relationships between the
key kinematic and kinetic factors of the lower extremity motions and peak clubhead
speed. It was hypothesized that (1) Peak OA and ranges of OA of the lower extremity
joints (i.e., hips, knees, and ankles) and pelvis in three anatomical planes of motion
(sagittal, frontal, and transverse) would be significantly correlated to NPCS in skilled
golfers and (2) Peak RJM of the lower extremity joints (hip, knee, and ankle) would be
significantly correlated to NPCS in skilled golfers.
Based on the results in this study, it was concluded that:
• Among OA parameters, only the pelvis right lateral tilted position and the pelvis
right tilting motion were significantly correlated to NPCS across all the club
conditions during the downswing. The pelvis motion in the frontal plane was
identified as the good consistent indicator of clubhead speed in skilled golfers.
Therefore, strong association between the pelvis motions in the frontal plane
and clubhead speed suggests that skilled golfers maneuver pelvic motion in the
frontal plane in generating higher clubhead speed during the downswing.
• Among RJM parameters, the right hip extensor and left knee extensor moments
in the sagittal plane exhibited significant correlations to NPCS across all club
conditions. The skilled golfers relied especially more on muscular effort from the
right hip and left knee joints in the sagittal plane. The right hip extensor and left
knee extensor moments were considered as the good consistent indicator in

54
generating higher clubhead speed in skilled golfers. Therefore, it is important to
develop a swing pattern that maximizes right hip extensor moment and left knee
extensor moment during the early downswing phase to generate a high
clubhead speed.
Recommendation for Future Study
The difference in the swing styles utilized by each individual who participated in
this study was not considered. In order to generate angular effect, some of the golfers
may be lower extremity dominant i.e. foot-ground interaction, or upper body dominant,
i.e. mid-trunk muscular effort. As shown in the equation of the RJM (Equation 5), the
RJM in the mid-trunk can be computed from inertial, gravitational, and external
components. The external moment is a result of the participant being in contact with
the ground. Without a firm connection with the ground (external term), golfers cannot
maximize the moment generated by the muscle. If the external moment value is small,
the only way to increase the moment is to rely more on the inertial moment by
accelerating the lower body angularly. This study did not shed light on the angular effect
from the mid-trunk as it comes from the inertial moment or the external
moment through good foot ground interaction. Therefore, the next study will be to
scrutinize the distinct characteristics and relationships among the inertial, gravitational,
and external moment terms about the RJM produced from the mid-trunk joint.
In order to obtain the resultant joint moment, the inverse dynamics approach
was that only combined moment of muscle forces was computed. Thus, this approach

55
gives a fair idea about the overall muscle activity at the joint while the insight about
specific muscles and their role in joint movement cannot be obtained. In order to solve
this problem, musculoskeletal modeling would be used to estimate the amount of force
muscles around the joint should produce. Therefore, a future study would combine
kinematic, kinetic, Electromyography, and 3-D data with musculoskeletal modeling to
estimate individual muscular efforts in the lower extremity joints during a golf swing.

56
REFERENCES
Ball, K. A., & Best, R. J. (2007). Different centre of pressure patterns within the golf
stroke II: group-based analysis. Journal of Sports Sciences, 25, 771-779.
doi:10.1080/02640410600875002
Barrentine, S.W., Fleisig, G.S., Johnson, H., & Woolley, T.W. (1994). Ground reaction
forces and torques of professional and amateur golfers. In A. J. Cochran & M. R.
Farrally (Eds.), Science and Golf II: Proceedings of the World Scientific Congress of
Golf (pp. 33-39). London: Spon Press.
Brylawski, A.M. (1994). An investigation of three dimensional deformation of a golf club
during downswing, In A. J. Cochran &M. R. Farrally (Eds.), Science and Golf II:
Proceedings of the 2nd World Scientific Congress of Golf (pp. 265–270), London: E
& FN Spon.
Bunn, J. (1972). Scientific principles of coaching. Englewood Cliffs, NJ: Prentice-Hall.
Burden, A. M., Grimshaw, P. N., & Wallace, E. S. (1998). Hip and shoulder rotations
during the golf swing of sub-10 handicap players. Journal of Sports Sciences, 16,
165-176. doi:10.1080/026404198366876
Butler, J.H. & Windield, D.C. (1994). The dynamic performance of the golf shaft during
the downswing, In A. J. Cochran &M. R. Farrally (Eds.), Science and Golf II:
Proceedings of the 2nd World Scientific Congress of Golf (pp. 259–264), London: E

57
& FN Spon.
Callaway, S., Glaws, K., Mitchell, M., Scerbo, H., Voight, M., & Sells, P. (2012). An analysis
of peak pelvis rotation speed in gluteus maximus and medius strength in high
versus low handicap golfers during the golf swing. International Journal of Sports
Physical, 7, 288-297.
Campbell, K. R., & Reid, R. E. (1985). The application of optimal control theory to
simplified models of complex human motions: The golf swing. In D. A. Winter, R.
W. Norman, R. P. Wells, K. C. Hayes, & A. E. Patla (Eds.), Biomechanics IX-B (pp.
527 – 538). Baltimore, MD: Human Kinetics.
Cheetham, P. J., Martin, P. E., Mottram, R. E., & St. Laurent, B. F. (2001). The importance
of stretching the ‘X-factor’ in the downswing of golf: The ‘X-factor stretch’. In P. R.
Thomas (Ed.), Optimising performance in golf. (pp. 192–199). Brisbane: Australian
Academic Press.
Chu, Y., Sell, T., & Lephart, S. (2010). The relationship between biomechanical variables
and driving performance during the golf swing. Journal of Sports Sciences, 28,
1251–1259. doi:10.1080/02640414.2010.507249
Cochran, A., & Stobbs, J. (1968). The search for the perfect swing. Philadelphia, PA: J. B.
Lippincott.
Cole, M., & Grimshaw, P. (2009). The X-factor and its relationship to golfing
performance. Journal of Quantitative Analysis in Sports, 5(1). doi:10.2202/1559-
0410.1134

58
Coleman, S. G. S., & Anderson, D. (2007). An examination of the planar nature of golf
club motion in the swings of experienced players. Journal of Sports Sciences, 25,
739-748. doi:10.1080/02640410601113239
Coleman, S. G. S., & Rankin, A. J. (2005). A three-dimensional examination of the planar
nature of the golf swing. Journal of Sports Sciences, 23, 227-234.
doi:10.1080/02640410410001730179
DeLeva, P. (1996). Adjustments to Zatsiorsky-Seluyanov’s segment inertia parameters.
Journal of Biomechanics, 29, 1223-1230. doi:10.1016/0021-9290(95)00178-6
Dillman, C.J. & Lange G.W. (1994). How has biomechanics contributed to the
understanding of the golf swing? In: Cochran, A.J. & Farrally M.R. (Eds) Science
and Golf II. Proceedings. of the World Scientific Congress of Golf Science and Golf
(pp 3-13). London: E & FN Spon. doi:10.4324/9780203474709
Doan, B. K., Newton, R. U., Kwon, Y. H. & Kraemer, W. J. (2006). Effects of physical
conditioning on intercollegiate golfer performance. Journal of Strength and
Conditioning Research, 20, 62-72. doi:10.1519/00124278-200602000-00011
Dowlan, S., Brown, D., Ball, K., Best, R. J., & Wrigley, T. (2001). Intra-subject variability in
the golf swing: A comparison of high and low handicap players. In J. Blackwell
(Ed.), Proceedings of the XIXth International Symposium of Biomechanics in Sports.
San Francisco, CA: University of San Francisco.
Fradkin, A. J., Sherman, C. A., & Finch, C. F. (2004). How well does club head speed
correlate with golf handicaps? Journal of Science and Medicine in Sport, 7, 465–

59
472. doi:10.1016/S1440-2440(04)80265-2
Fujimoto-Kanatani, K. (1995). Determining the essential elements of golf swings used by
elite golfers [dissertation]. Oregon State University, Corvallis (OR)
Foxworth, J. L., Millar, A. L., Long, B. L., Way, M., Vellucci, M. W., & Vogler, J. D. (2013).
Hip joint torques during the golf swing of young and senior healthy males. Journal
of Orthopaedic & Sports Physical Therapy, 43(9), 660-665.
doi:10.2519/jospt.2013.4417
Gatt, C.J., Pavol, M.J., Parker, R.D. & Grabiner, M.D. (1998). Three-dimensional knee
joint kinetics during the golf swing: Influences of skill level and footwear. American
journal of sports medicine, 26, 285 – 294.
Golfpredictorcom. (2015). Golf Predictor - Golf Blog . Retrieved Saturday, 28 March
2009, from http://blog.golfpredictor.com/2009/03/average-course-length-on-
useuropean-pga.html
Gordon, B.S., Moir, G.L., Davis, S.E., Witmer, C.A., & Cummings, D.M. (2009). An
investigation into the relationship of flexibility, power, and strength to club head
speed in male golfers. Journal of Strength and Conditioning Research, 23, 1606–
1610. doi:10.1519/JSC.0b013e3181a3c39d
Green, A. (2012). The biomechanical and physiological predictors of golf drive
performance, before and after a hole-to-hole distance walk [dissertation].
University of the Witwatersrand, Johannesburg.
Hale, T. and Hale, G. (1990) Lies, damned lies and statistics in golf. Science and golf:

60
Proceedings of the First World Scientific Congress of Golf. Ed: Cochran, A.J. London:
E & FN Spon. 159-164.
Han, K. H., Lee, S., & Kwon, Y.-H. (2014). Associations between maximum clubhead
speed and select GRF and moment parameters in skilled golfers. In E. J. Bradshaw,
A. Burnett & P. A. Hume (Eds.), 2014 Incheon Asian Games International Sport
Seience Congress - In commemoration of The 1988 Seoul Olympic Games ,
(pp.379) Incheon, Korea: Gyeongin National University of Education.
Hay, J.G. (1993). The biomechanics of sports techniques. Engelwood Cliffs (NJ): Prentice
Hall.
Hellstrom, J. (2009). Competitive elite golf: A review of the relationships between
playing results, technique and physique. Sports Medicine, 39, 723-741.
doi:10.2165/11315200-000000000-00000
Hetu, F.E., Christie, C.A., & Faigenbaum, A.D. (1998). Effects of conditioning on physical
and club head speed in mature golfers. Perceptual and Motor Skills, 86, 811-815.
doi:10.2466/pms.1998.86.3.811
Horan, S.A., Evans, K., Morris, M.R., & Kavanagh, J.J. (2010). Thorax and pelvis
kinematics during the downswing of male and female skilled golfers. Journal of
Biomechanics, 43, 1456-1462. doi:10.1016/j.jbiomech.2010.02.005
Hume P.A., Keogh J., and Reid D. (2005). The role of biomechanics in maximising
distance and accuracy of golf shots. Sports Medicine. 35, 429 - 449.
doi:10.2165/00007256-200535050-00005

61
Jones, D. (1999). The effects of proprioceptive neuromuscular facilitation flexibility
training on the clubhead speed of recreational golfers. In M. R. Farrally & A. J.
Cochran (Eds.), Science and golf III: Proceedings of the 1998 World Scientific
Congress of Golf.(pp. 46-50). Champaign, IL: Human Kinetics.
Jorgensen, T., (1970). On the Dynamics of the Swing of a Golf Club. American Journal of
Physics. 38, 644-651. doi:10.1119/1.1976419
Jorgensen, T. (1994). The Physics of Golf, New York: American Institute of Physics Press,
Joyce, C., Burnett, A., & Ball, K. (2010). Methodological consideration for the 3D
measurement of the X-factor and lower trunk movement in golf. Sports
Biomechanics, 9, 206–221. doi:10.1080/14763141.2010.516446
Kawashima, K., Meshizuka, T., & Takeshita, S. (1998). A Kinematic Analysis of Foot Force
Exerted on the Soles During the Golf Swing Among Skilled and Unskilled Golfers.
In M.R. Farrally & A.J. Cochran (Eds.), Science and Golf III: Proceedings of the
World Scientific Congress of Golf (pp. 40–45). United Kingdom: Human Kinetics.
Kreighbaum, E., & Barthels, K.M. (1985). Biomechanics – A qualitative approach for
studying human movement. Burgess. Minneapolis, MI.
Keogh J.W.L., Marnewick M.C., Maulder P.S., Nortje J.P., Hume P.A., and Bradshaw E.J.
(2009). Are anthropometric, flexibility and muscular strength and endurance
variables related to clubhead velocity in low- and high-handicap golfers? Journal of
Strength and Conditioning Research, 23, 1841 - 1850.
doi:10.1519/jsc.0b013e3181b73cb3

62
Koenig, G., Tamres, M., & Mann, R.W. (1994). The biomechanics of the shoe-ground
interaction in golf. In A. J. Cochran & M. R. Farrally (Eds.), Science and Golf II:
Proceedings of the World Scientific Congress of Golf (pp. 40–45). London: Spon
Press.
Kwon, Y. -H. (2008). Measurement for deriving kinematic parameters: Numerical
methods. In Y. Hong & R. M. Bartlett (Eds.), Routledge handbook of biomechanics
and human movement science (pp. 156–181). Oxfordshire:Routledge.
Kwon, Y.-H., Como, C., Singhal, K., Lee, S., & Han, K. H. (2012). Assessment of planarity of
the golf swing based on the functional swing plane of the clubhead and motion
planes of the body points in golf. Sports Biomechanics, 11, 127-148.
doi:10.1080/14763141.2012.660799
Kwon, Y.-H., Han, K. H., Como, C., Lee, S. & Singhal, K. (2013). Validity of the X-factor
computation methods and relationship between the X-factor parameters and
clubhead velocity in skilled golfers. Sports Biomechanics, 12, 231-246.
doi:10.1080/14763141.2013.771896
Lennon, H. (1999). Physiological profiling and physical conditioning for elite golfers. In
M. R. Farrally & A. J. Cochran (Eds.), Science and golf III: Proceedings of the 1998
World Scientific Congress of Golf. (pp. 58-64). Champaign, IL: Human Kinetics.
Lephart S.M., Smouga J.M., Myers J.B., Sell T.C., & Tsai Y.S. (2007). An eight-week golf-
specific exercise program improves physical characteristics, swing mechanics, and
golf performance in recreational golfers. Journal of Strength and Conditioning

63
Research, 21, 860-869. doi:10.1519/r-20606.1
Lynn, S.K., Frazier, B.S., New, K. N., Wu, W. F., Cheetham, P. J., & Noffal, G.J. (2014).
Rotational Kinematics of the Pelvis during the Golf Swing: Skill Level Differences
and Relationship to Club and Ball Impact Conditions. International journal of golf
science 2, 116-125. doi:10.1123/ijgs.2013-0011
Marshall, R.N., & Elliott, B.C. (2000). Long-axis rotation: The missing link in proximal-to-
distal segment sequencing. Journal of Sports Sciences. 18, 247-254.
doi:10.1080/026404100364983
McLaughlin, P. A., & Best, R. J. (1994). Three-dimensional kinematic analysis of the golf
swing. In A. J. Cochran and F. R. Farrally (Eds.), Science and golf II: Proceedings of
the 1994 World Scientific Congress of Golf. (pp. 91–96). London: E & FN Spon.
McHardy A., & Pollard, H. (2005). Muscle activity during the golf swing. British Journal of
Sports Medicine, 39, 799-804.
McLean, J. (1992). Widen the gap. Golf Magazine, 1992(12), 49–53.
McTeigue, M., Lamb, S. R., Mottram, R., & Pirozzolo, F. (1994). Spine and hip motion
analysis during the golf swing. In A. J. Cochran &M. R. Farrally (Eds.), Science and
Golf II: Proceedings of the world scientific congress of golf (pp. 50–58). London: E &
FN Spon.
Miao, T., Watari, M., Kawaguchi, M. and Ikeda, M. (1999). A study of clubhead speed as
a function of grip speed for a variety of shaft flexibility. In M. R. Farrally & A. J.
Cochran (Eds.), Science and golf III: proceedings of the World Scientific Congress of

64
Golf. (pp 554-561) Champaign, IL: Human Kinetics.
Milne, R. D., & Davis, J. P. (1992). The role of the shaft in the golf swing. Journal of
Biomechanics, 25, 975–983. doi:10.1016/0021-9290(92)90033-w
Miura, K. (2001). Parametric acceleration - the effect of inward pull of the golf club at
impact stage. Sports Engineering, 4, 75-83. doi:10.1046/j.1460-2687.2001.00071.x
Myers, J., Lephart, S., Tsai, Y. S., Sell, T., Smoliga, J., & Jolly, J. (2008). The role of upper
torso and pelvis rotation in driving performance during the golf swing. Journal of
Sports Sciences, 26, 181–188. doi:10.1080/02640410701373543
Neal, J. R., & Wilson, B. D. (1985). 3D kinematics and kinetics of the golf swing.
International Journal of Sport Biomechanics, 1, 221-232.
Neal, R.J., & Dalgleish, M. (2008). Stretch/Recoil & Driving distance: Implcations for
Training. Paper presented at the 3rd Annual World Golf Fitness Summit, Anaheim,
CA.http://www.thegolfathlete.com/filesloaded/file/World_Golf_Fitness_Summit_
18-Oct-2008(2).pdf
Nelson, L. (1980). A Better Weight Shift Made the Difference, Golf Digest, 37.
Nesbit, S. M. (2005). A three dimensional kinematic and kinetic study of the golf swing.
Journal of Sports Science and Medicine, 4, 499–519.
Nesbit, S.M. & Serrano, M. (2005). Work and power analysis of the golf swing. Journal of
Sports Sciences and Medicine 4, 520-533.
Norman, G. (1995). Advanced golf. Port Melbourne, Australia: William Heinemann.
Pedhazur, E. J. (1997). Multiple regression in behavioural research. Fort Worth,

65
Texas: Harcourt Brace College Publishers.
Okuda, I., Gribble, P., & Amstrong, C. (2010). Trunk rotation and weight transfer
patterns between skilled and low skilled golfers. Journal of Sports Science and
Medicine, 9, 127-133.
Penner, A.R. (2003). The physics of golf. Reports on Progress in Physics, 66, 131 – 171.
Pickering, W. M., & Vickers, G. T. (1999). On the double pendulum model of the golf
swing. Sports Engineering, 2, 161-172. doi:10.1046/j.1460-2687.1999.00028.x
Putnam, C. A. (1993). Sequential motions of body segments in striking and throwing
skills: Descriptions and explanations. Journal of Biomechanics, 26, 125-135.
doi:10.1016/0021-9290(93)90084-r
Rae, I., Fairweather, M., & Sanders, R. (2001). Using your head to improve your golf
swing. Coaches Information Service,
http://www.coachesinfo.com/category/golf/58/
Richards, J., Farrrell, J., Kent, M., & Kraft, J. (1985). Weight transfer patterns during the
golf swing. Research Quarterly for Exercise and Sport, 56, 361-365.
doi:10.1080/02701367.1985.10605341
Robertson, D. G.E., & R.E. Morsher. Work and Power of the leg muscle in soccer kicking.
In: D.A. Winter, R.W. Norman, R.P. Wells, K.C. Hayes, and A.E. Patla (Eds.).
Biomechanics IX-B (pp.533-538). Champaign, IL: Human Kinetics.
Robinson, R.L. (1994). A study of the correlation between swing characteristics and club
head velocity. In A.J. Cochran & M.R. Farrally (Eds.), Science and Golf II:

66
Proceedings of the World Scientific Congress of Golf (pp. 84–90). London: Spon
Press.
Sell, T.C., Tsai, Y.S., Smoliga, J.M., Myers, J.B., & Lephart, S.M. (2007). Strength,
flexibility, and balance characteristics of highly proficient golfers. Journal of
Strength and Conditioning Research, 21, 1166-1171. doi:10.1519/r-21826.1
Shamus, E., & Shamus, J. (2001). Sports injury: Prevention and rehabilitation. New York:
McGraw-Hill.
Smith, M.F. (2010). The role of physiology in the development of golf performance.
Sports Medicine, 40, 635-655. doi:10.2165/11532920-000000000-00000
Soriano, B.C. (1996). A biomechanical investigation of human movement during the golf
swing [dissertation]. University of California, Irvine (CA)
Sprigings, E., & Neal, R. (2000). An insight into the importance of wrist torque in driving
the golfball: a simulation study. Journal of Applied Biomechanics, 16, 356-366.
Sprigings, E.J., & Mackenzie, S.J. (2002). Examining the Delayed Release in the Golf
Swing Using Computer Simulation. Sports Engineering, 5, 23–32.
doi:10.1046/j.1460-2687.2002.00094.x
Thompson C.J., Myers Cobb K., and Blackwell J. (2007). Functional training improves club
head speed and functional fitness in older golfers. Journal of Strength and
Conditioning Research, 21, 131-137. doi:10.1519/00124278-200702000-00024
Tinmark, F., Hellström, J., Halvorsen, K., & Thorstensson, A. (2010). Elite golfers’
kinematic sequence in fullswing and partial-swing shots. Sports Biomechanics, 9,

67
236–244. doi:10.1080/14763141.2010.535842
Vaughan, C. L. (1981). A three-dimensional analysis of the forces and torques applied by
a golfer during the downswing. In Morecki, A., Fidelus, K., Kedzior, K. & Witt, A.
(Eds.), Biomechanics VII-B. Baltomore, MD: University Park Press.
Wallace, E. S., Graham, D., & Bleakley, E. W. (1990). Foot-toground pressure patterns
during the golf drive: A case study involving a low handicap player and a high
handicap player. In A. J. Cochran (Ed.), Science and golf: Proceedings of the First
World Scientific Congress of Golf (pp. 25–29). London: E & FN Spon.
Wallace, E.S., Grimshaw, P.N., & Ashford, R.L. (1994). Discrete pressure profiles of the
feet and weight transfer patterns during the golf swing. In A. J. Cochran (Ed.),
Science and golf II: Proceedings of the 1994 World Scientific Congress of Golf. (pp.
26-32). London: E & FN Spon,
Wallace, E. S., Otto, S. R. & Nevill, A. (2007). Ball launch conditions for skilled golfers
using drivers of different length in an indoor testing facility. Journal of Sport
Science, 25, 731-737. doi:10.1080/02640410601113221
Westcott, W. L., Dolan, F., & Cavicchi, T. (1996). Golf and strength training are
compatible activities. Journal of Strength and Conditioning Research, 18, 54–56.
doi:10.1519/1073-6840(1996)018<0054:gastac>2.3.co;2
Williams, K. R., & Cavanagh, P. R. (1983). The mechanics of foot action during the golf
swing and implications for shoe design. Medicine and Science in Sports
and Exercise, 15, 247-255. doi: 10.1249/00005768-198315030-00012

68
Wiseman, F., & Chatterjee, S. (2006). Comprehensive analysis of golf performance on
the PGA tour: 1990-2004. Perceptual and Motor Skills, 102, 109-117.
doi:10.2466/pms.102.1.109-117
Wiseman, F., Habibullah, M., & Yilmaz, M. (2007). A New Method for Ranking Total
Driving Performance on the PGA Tour. The Sport Journal, 10, No. 1
Worsfield, P., Smith, N.A. & Dyson, R.J. (2008). Low handicap golfers generate more
torque at the shoe-natural grass interface when using a driver. Journal of sports
science and medicine, 7, 408 – 414.
Zheng, N., Barrentine, S. W., Fleisig, G. S., & Andrews, J. R. (2008). Kinematic analysis of
swing in pro and amateur golfers. International Journal of Sports Medicine, 29,
487–493. doi:10.1055/s-2007-989229

69
APPEMDIX A
INFORMED CONSENT FORM

70
TEXAS WOMAN’S UNIVERSITY
CONSENT TO PARTICIPATE IN RESEARCH
Title: Lower body mechanics in golf and its association with maximum clubhead speed in skilled golfers
Principal Investigator: Ki Hoon Han …………………………………. [email protected] (940) 595-6191 Advisor: Young-Hoo Kwon, Ph.D. ………………………………… ykwon@ twu.edu (940) 898-2598 Explanation and Purpose of the Research
One of the most important determinants of success in golf is clubhead speed as it primarily determines the ball carry distance. Therefore, the emphasis has been placed on finding movement patterns and characteristics of the swing that result in higher clubhead speed at impact.
A substantial number of previous studies have been conducted based on the so-called double-pendulum model and its triple-pendulum sibling in which the golfer arms and club were reduced to two rigid levers connected at the wrists. In this model, only the arm and wrist motions were considered as the main contributor to the clubhead speed. As a result, the importance of lower extremity motions has practically been ignored in golf researches.
The purpose of this study is to investigate the associations between peak clubhead speed and select kinematic and kinetic parameters of the lower extremity motions during the golf swing.
Hypotheses:
1. Peak orientation angles of the lower extremities (ankle, knee, and hip) and pelvis in three different planes of motion (sagittal, frontal, and transverse) would be significantly correlated to peak clubhead speed in skilled golfers.
2. Peak joint moments of the lower extremities (ankle, knee, and hip) in three different planes of motion (sagittal, frontal, and transverse) would be significantly correlated to peak clubhead speed in skilled golfers.
Research Procedures

71
Once you agree to participate in the study and sign this Informed Consent Form, you will be asked to perform the following:
You will enter the Motion Analysis Laboratory on Texas Woman’s University-Denton Campus (Pioneer Hall 124). You will be then asked to change into clothing specific to biomechanical research (close fitting dark spandex shorts and shirt) in the participant preparation room and will also be outfitted with reflective markers (up to seventy reflective markers) over specific anatomical landmarks (Figure 1). The clothing and reflective markers will be supplied by the Biomechanics Laboratory, unless you feel more comfortable in your own spandex. The anatomical landmarks will consist of but not limited to 5 pelvis markers, 11 trunk markers , 4 head markers, 20 arm markers, 16 leg markers , 9 club markers, and 5 ball-plate markers.
Figure 1. Marker locations: front (a), back (b), ball-plate (c), and club (d).
A warm-up and familiarization period will be allotted to make certain you have adequate time to raise your core temperature warming the connective tissue, thus reducing the possibility of injury and ensuring quality of movement.
A static trial (in T-pose) will be collected and used to determine a reflective marker relationship and calculate the secondary points (i.e. joint centers) of your body. In addition, a static trial allows for certain markers to be removed in the swing trials to minimize the negative influence of the markers on your movement during data collection.
(b) (d)
(c)
(a)

72
Three different golf club conditions (driver, 5 iron, and pitching wedge) will be used. Five “good” swing trials will be collected per each golf club condition. Prior to collecting data under a new condition you will be allocated undetermined amount of time to re-familiarize yourself with the golf club being used to ensure quality movement. A “good” dynamic trial constitutes a swing that produces both a quality ball flight and normal “feel” to you.
This project involves single-session data collection. It will take approximately one and half hours in completing all procedures (explaining the consent form, attaching markers on your body, and conducting data collection).
Potential Risks
Loss of Confidentiality: The participant’s name and contact information will be collected.
You as a participant will be identified by a unique participants ID code. All computer files associated with a given participant will be identified solely by this code and will not contain any identifying information. The master cross-reference list will be kept separate from all other data collected and will be accessible only to the principal investigator and research team. No other identifying information will be collected. Upon completion of data collection sessions, the master cross-reference list will be destroyed by shredding. As computer files will not contain any identifying information, erasure of computer files is not considered necessary to protect confidentiality after destruction of the master-cross reference list. All captured motion files are stored directly to the computer; therefore, will be erased from the computer three years from the conclusion of the study. There is a potential risk of loss of confidentiality in all email, downloading and internet transactions. Confidentiality will be protected to the extent that is allowed by the law.
Coercion: Participation in the current study is strictly voluntary, and you may withdraw at any time at your discretion.
Embarrassment: Reflective markers will be attached on your body by a male principal investigator after the approval from you. The researchers will try to prevent any problems associated to the embarrassment.
Irritation from skin preparation: This step is necessary to ensure good skin-to-reflective marker adhesion during static and motion trials. Erroneous results can occur if this step is not taken. Care will be taken in skin preparation to minimize risk by cleansing the area

73
of contact. If you are sensitive to such treatment you will not be recruited or asked not to participate in the current research.
Possibility of Injury: The potential for injury will be minimized by allowing you adequate time to warm-up and adjust to the both conditions of the laboratory and the golf club being used per each trial. If you feel uncomfortable during the data collection with any of the testing conditions, you are free to discontinue your involvement in this research project.
Fatigue: You will be allowed to rest in between the testing session if you feel tired.
Loss of Time: There is a risk of loss of time to you. The loss of time will involve time of data collection and travel time to the Lab and back. There will not be any compensation for the loss of time.
The researchers will try to prevent any problems that could happen because of this research. You should let the researchers know at once if there is a problem and they will help you. However, TWU does not provide medical services or financial assistance for injuries that might happen because you are taking part in this research.
Participation and Benefits
Your involvement in this research study is completely voluntary, and you may discontinue your participation in the study at any time. The only direct benefit of this study to you is that at the completion of the study a summary of the results will be mailed to you upon request. Upon receiving the results of the research, if you happen to have any further questions you are welcome to contact the principal investigator and set-up an appointment for a private consultation to discuss your individual results. The time, date, and location will be determined at the time of contact.
Questions Regarding this Research Study
If you have any questions about the research study you may ask the researchers, their phone numbers are at the top of this form. If you have questions about your rights as a participant in this research or the way this study has been conducted, you may contact the Texas Woman’s University Office of Research and Sponsored Programs at 940-898-3378 or via e-mail at [email protected]. You will be given a copy of this signed and dated consent form to keep.

74
_______________________________________ ___________________
Signature of Participant Date
If you would like to receive a copy of the published results of this research study, please provide the following contact information:
________________________________________________________________________
Full Name
________________________________________________________________________
Mailing Address
________________________________________________________________________
City, State and Zip Code
________________________________________________________________________
Email address (If you prefer to receive the published results via email)