lower percentage of fat mass among tai chi chuan practitioners
TRANSCRIPT

International Journal of
Environmental Research
and Public Health
Article
Lower Percentage of Fat Mass among Tai ChiChuan Practitioners
Silvia Stagi 1,* , Azzurra Doneddu 2, Gabriele Mulliri 2, Giovanna Ghiani 2, Valeria Succa 1 ,Antonio Crisafulli 2 and Elisabetta Marini 1,*
1 Department of Life and Environmental Sciences, University of Cagliari, Cittadella Universitaria, Monserrato,09042 Cagliari, Italy; [email protected]
2 Department of Medical Sciences and Public Health, University of Cagliari, 09124 Cagliari, Italy;[email protected] (A.D.); [email protected] (G.M.); [email protected] (G.G.);[email protected] (A.C.)
* Correspondence: [email protected] or [email protected] (S.S.); [email protected] (E.M.);Tel.: +39-070-675-6612 (S.S.); +39-070-675-6607 (E.M.)
Received: 8 January 2020; Accepted: 11 February 2020; Published: 14 February 2020
Abstract: The aim of the study was to analyze total and regional body composition in Tai Chi Chuan(TCC) middle-aged and elderly practitioners. A cross-sectional study on 139 Italian subjects wasrealized: 34 TCC practitioners (14 men, 20 women; 62.8 ± 7.4 years) and 105 sedentary volunteers(49 men, 56 women; 62.8 ± 6.4 years). Anthropometric measurements (height, weight, arm, waist,and calf circumferences), hand-grip strength, and physical capacity values were collected. Total andregional (arm, leg, and trunk) body composition was analyzed by means of specific bioelectricalimpedance vector analysis (specific BIVA). TCC practitioners of both sexes were characterized bya normal nutritional status, normal levels of physical capacity, and normal values of hand-gripstrength. Compared to controls, they showed lower percentages of fat mass (lower specific resistance)in the total body, the arm, and the trunk, and higher muscle mass (higher phase angle) in the trunk,but lower muscle mass in the arm. Sexual dimorphism was characterized by higher muscle mass(total body, arm, and trunk) and lower %FM (arm) in men; sex differences were less accentuatedamong TCC practitioners than in the control. TCC middle-aged and elderly practitioners appear tobe less affected by the process of physiological aging and the associated fat mass changes, comparedto sedentary people.
Keywords: ageing; Tai Chi Chuan; specific bioelectrical impedance vector analysis (BIVA); bodycomposition
1. Introduction
Aging is associated with body composition variations: muscle mass progressively declines, whilefat mass (FM) initially increases, especially in the visceral region, and then levels off or decreases [1].These variations may lead to sarcopenia, a condition characterized by both low skeletal muscle massand low skeletal muscle strength or quality, and to sarcopenic obesity, due to the coexistence ofsarcopenia and fat excess or fat infiltration into muscle [2]. Sarcopenic and sarcopenic obese elderlyhave a lower independence and an increased risk of morbidity and mortality [2].
Physical activity has been shown to contribute substantially to the maintenance of the individualphysiological and psychological well-being in all phases of life [3]. In the elderly, physical exercisecan slow down or even reverse the trend towards sarcopenia [4,5]. However, which kind of physicalactivity could provide the more beneficial effects is still unclear and needs to be studied in depth [3].Furthermore, body composition changes in different body districts were still poorly studied in the
Int. J. Environ. Res. Public Health 2020, 17, 1232; doi:10.3390/ijerph17041232 www.mdpi.com/journal/ijerph

Int. J. Environ. Res. Public Health 2020, 17, 1232 2 of 13
elderly. Instead, regional body composition gives relevant information. In particular, it allows betterunderstanding of the role of physical activity in different conditions, such as sarcopenia and obesity [6].
Tai Chi Chuan (TCC) is an ancient Chinese martial art. The practice consists of the repetitionof a sequence of slow and harmonious movements, focused on balance and based on respirationtechniques. This discipline is particularly adequate for elderly people, who find difficult to performrapid movements, and has been recommended to improve quality of life and to prevent or retardsarcopenic obesity [4]. TCC practice may help improve coordination and balance [7], retard boneloss [8], maintain cardiorespiratory fitness and flexibility [9]. It also contributes to promote social andpsychological health [10], and cognitive function [11].
The effect of TCC on total and regional body composition has been poorly studied and the literatureshows a still unclear pattern. Dual-energy X-ray absorptiometry (DXA) has been used to assess bonemass density in postmenopausal TCC women [8], whereas anthropometric techniques [9,12], equationsbased on bioimpedance measures [12–16], or air displacement [17] have been applied to analyze fatand fat-free mass. The studies on regional body composition have been based on skinfold thicknessdistribution only [12]. Specific bioelectrical impedance vector analysis (specific BIVA; [18]) has neverbeen used. Specific BIVA is based on the analysis of bioelectrical values (resistance, R; reactance, Xc;Ω), standardized by body height and transversal cross-sections, in order to minimize the effect ofconductor dimensions, that is the effect of anthropometric differences. Bioelectrical vectors can beprojected on the Cartesian plane, where they are defined by their length (impedance: (R2 + Xc2)0.5) andinclination angle (phase angle: arctan Xc/ R180/π). Specific BIVA has been validated against DXA in asample of US adults [19], showing high sensitivity and specificity in the evaluation of %FM (the longerthe vector, the higher the %FM). It has also shown to be highly correlated with DXA results in elderlysubjects [20,21] and young athletes [22]. Furthermore, phase angle, a variable considered a proxy ofmuscle mass [23], has shown to be positively correlated with intracellular/extracellular water ratio(ICW/ECW), when compared to dilution techniques [22,24]. Indeed, specific BIVA has been proposed asa promising technique for body composition assessment in athletes [25], and has been already appliedin different contexts (e.g., cavers: [26]; various athletes: [22]; soccer players: [27]).
The aim of the present research was to analyze total body and regional body composition in TCCmiddle-aged and elderly practitioners by means of specific bioelectrical impedance vector analysis.
2. Materials and Methods
This observational study was realized on a cross-sectional sample of TCC practitioners and anage-matched group of sedentary subjects. The measurement process flow chart is shown in Figure 1.
2.1. Subjects
The sample was composed of 34 middle-aged and elderly TCC volunteers (14 men and 20 women)aged 62.8 ± 7.4 years, recruited from the A.S.D. Tai Chi Chuan school of Cagliari and La Porta d’Orienteof Quartu S.Elena (Italy). At the time of the measurement, the subjects had already been practicing TaiChi Chuan for an average of six years and were training three times a week or more. Four of themparticipated in other sports too (swimming, walking, yoga, cycling). All the subjects declared to eat abalanced diet, with a great intake of fruits and vegetables.
The control group was composed of 105 volunteers (49 men, 56 women) of the same mean age(62.8 ± 6.4 years), and living in the same geographical area, selected for not practicing physical exercise.
Criteria of exclusion were physical handicaps, pathologies that might influence the measurements,metallic prostheses, pacemakers, or limb amputations.
Data was deposited in the University of Cagliari repository: http://hdl.handle.net/11584/269226.The research was approved by the Independent Ethical Committee of the A.O.U. of Cagliari
(PG/2017/1700). Each participant was informed about the purposes and methods of the research andsigned consent to participate.

Int. J. Environ. Res. Public Health 2020, 17, 1232 3 of 13
Int. J. Environ. Res. Public Health 2020, 17, x 3 of 13
The research was approved by the Independent Ethical Committee of the A.O.U. of Cagliari (PG/2017/1700). Each participant was informed about the purposes and methods of the research and signed consent to participate.
Figure 1. Measurement process flow chart.
2.2. Measurements
2.2.1. Anthropometry
Anthropometric measurements (height, cm; weight, kg; waist circumference, cm; arm and calf circumferences of both sides) were taken using international standard procedures [28]. The length (cm) of each regional district was also recorded: arm length, defined as the acromion-stylion distance; leg length, as the distance between the great trochanter and the malleolus; trunk length, as the distance between injector electrodes.
Body mass index BMI was calculated by the formula: weight/height2 (kg/m2). Underweight, normal weight, overweight and obesity, and visceral obesity were defined according to BMI [29].
2.2.2. Bioimpedance
Whole body and regional bioelectrical impedance measurements (resistance, R, and reactance, Xc, at 50 kHz and 800 μA) were taken using a single-frequency phase sensitive impedance analyzer (BIA 101, Akern, Firenze, Italy).
Figure 1. Measurement process flow chart.
2.2. Measurements
2.2.1. Anthropometry
Anthropometric measurements (height, cm; weight, kg; waist circumference, cm; arm and calfcircumferences of both sides) were taken using international standard procedures [28]. The length(cm) of each regional district was also recorded: arm length, defined as the acromion-stylion distance;leg length, as the distance between the great trochanter and the malleolus; trunk length, as the distancebetween injector electrodes.
Body mass index BMI was calculated by the formula: weight/height2 (kg/m2). Underweight,normal weight, overweight and obesity, and visceral obesity were defined according to BMI [29].
2.2.2. Bioimpedance
Whole body and regional bioelectrical impedance measurements (resistance, R, and reactance, Xc,at 50 kHz and 800 µA) were taken using a single-frequency phase sensitive impedance analyzer (BIA101, Akern, Firenze, Italy).
Following the European Society for Clinical Nutrition and Metabolism Working Groupguidelines [30], the measurements were taken in the morning and the volunteers were asked toavoid drinking and eating (3 h before the test; alcohol 24 h), exercising (12 h before the test), and to voidtheir bladder before the examination. The device was checked before each session with a calibrated

Int. J. Environ. Res. Public Health 2020, 17, 1232 4 of 13
circuit whose impedance values are known: R = 380 Ω, Xc = 47 Ω (±2% error). The intra-observertechnical error of measurement (TEM) and the %TEM were calculated in a subsample of 25 subjects(R: TEM = 3.5 ohm, TEM% = 0.6%), that are within the admitted variability of the device. The accuracyof specific BIVA in evaluating %FM has been showed by Buffa et al. [19] using DXA as a reference(receiving operator curves, ROC areas: 0.84–0.92), while Marini et al. [22] showed the agreement withdilution techniques in the evaluation of ICW/ECW.
Bioimpedance measurements were taken with the subject lying supine, on the right side of thetotal body and the trunk, the right arm and leg, using two pairs of detector and injector electrodes.For total body measurements, on the hand, the injector was placed at the distal extremity of the thirdmetacarpal, and the detector on the dorsal surface of the wrist, at level of the styloid process; on thefoot, the injector was placed at the base of the second and third metatarsals, and the detector on thedorsal surface, at the median point of the tibial tarsal joint. Regional bioelectrical measurements weretaken using the following procedure. Arm: on the shoulder, the injector was placed at the acromionprocess level and the detector at 5 cm distance, following the axillary line [31]; on the hand, the sameposition of the total body was used. Leg: on the hip, the injector was placed anterior to the iliac crestand the detector at a distance of 5 cm [32]; on the foot, the same position of the total body was used.Trunk: the electrodes already positioned on the shoulder and hip for the regional measures were used.
Specific bioelectrical impedance vector analysis [18] was used to estimate body composition.Resistance and reactance were multiplied by a correction factor (A/L). For the total body, the A valuewas estimated as 0.45 arm area + 0.10 trunk area + 0.45 calf area (cm2); arm, trunk, and calf area werecalculated as C24π, where C (cm) is the circumference of the segment. The length was calculated asL = 1.1H, where H is the height in cm. In the regional approach, A/L for the arm, leg, and trunk werecalculated considering the cross section of the mid arm, calf, and wrist (A) and the arm, leg, and trunklength (L), respectively.
Specific impedance (Zsp) was calculated as (Rsp2 +Xcsp2)0.5 (Ω cm) and phase angle as arctanXc/R180/π (degree).
2.2.3. Hand-Grip Strength
Hand-grip strength was taken using a Sahean hand dynamometer (Hydraulic Hand DynamometerSaehan Corporation, MSD buba Belgium). The volunteers were asked to hold the dynamometer withthe elbow flexed at 90 and to squeeze it with maximum isometric effort for a few seconds, three timeswith a 1 min interval between each attempt. Only the highest strength value was taken into account.According to Dodds et al. [33], 27 kg for men and 16 kg for women were considered the diagnosticthreshold for assessing probable sarcopenia.
2.2.4. Mini-Nutritional Assessment
The Mini Nutritional Assessment (MNA®; [34]) is a recommended multidimensional method toevaluate nutritional status in the elderly, and was applied to the subgroup of subjects over 60 yearsold only. It is an 18 item questionnaire considering: dietary habits, living conditions, anthropometry,cognitive and disability status. A normal nutrition score is 24 or higher, a score between 17 and23.5 designates risk of malnutrition, and a score lower than 17 indicates a condition of malnutrition.

Int. J. Environ. Res. Public Health 2020, 17, 1232 5 of 13
2.2.5. Physical Capacity Assessment
Participants underwent a cardiopulmonary test (CPX) with a gas analyzer (ULTIMA CPX,MedGraphics St. Paul, MN, USA), while pedaling on a mechanically braked cycle ergometer (CUSTOMed, Ottobrunn, Germany). The test consisted of a linear increase of workload (10 W/min), startingat 20 W, at a pedaling frequency of 60 rpm, until exhaustion, which was considered the point whenthe subject was unable to maintain a pedaling rate of at least 50 rpm. During the CPX, the followingvariables were gathered: oxygen uptake (VO2), carbon dioxide production (VCO2), respiratoryexchange ratio (RER, calculated as VCO2/VO2), pulmonary ventilation (VE), and heart rate (HR).The oxygen pulse (VO2/HR), a parameter related to stroke volume and cardiac performance [35],was also calculated. Workloads reached at anaerobic threshold (WAT) and at maximum (Wmax) weretaken into consideration. AT was calculated using the V-slope method, while VO2 at Wmax (VO2max)was calculated as the average VO2 during the final 30 s of the incremental test. Achievement of VO2max
was considered as the attainment of at least two of the following criteria: (1) a plateau in VO2 despiteincreasing workload (<80 mL·min−1); (2) RER above 1.10; and (3) HR ± 10 beats·min−1 of predictedmaximum HR calculated as 220-age [36].
2.3. Statistical Analysis
The comparison between anthropometric and bioelectrical measurements in the TCC group andcontrols, considering sex, was realized using a two-way ANOVA. Cohen’s d [37] for independentsamples was calculated to measure the effect size in the comparison between TCC practitionersand controls.
Confidence ellipses, representing the area around the sample mean within which the “true mean”is expected to lie with a probability of 95%, and Hotelling’s T2 test were used to compare total bodycomposition characteristics in the TCC and control samples, and between sexes.
The SPSS program was used to calculate univariate and bivariate statistics. Specific BIVA wasapplied using an ad hoc software available online (www.specificbiva.unica.it).
3. Results
Men and women practicing Tai Chi Chuan showed in mean a normal weight condition, accordingto BMI, and were below the threshold for visceral adiposity, according to waist circumference (Table 1).A good nutritional status was observed also in the individuals aged more than 60 years (MNA: men,27.3 ± 1.0; women, 27.5 ± 0.6); no subjects were at risk of malnutrition. Compared to the age-matchedcontrol sample, TCC men and women showed higher height, lower circumferences, and lower BMI.They also showed lower total body and arm specific resistance, higher phase angle in the trunk,and lower phase angle in the arm (Table 1, Figures 2 and 3). According to specific BIVA, these valuesindicate lower %FM in the total body and the arm, and higher ICW/ECW and muscle mass in the trunk,but not in the arm. Furthermore, among the controls there was a high prevalence of individuals at riskof malnutrition (18%). Cohen’s d showed large or medium size effects on anthropometric (with theexception of stature) and on total body and arm bioelectrical comparisons (with the exception of totalbody phase angles), while the effect was small on leg and trunk bioelectrical measurements, hand-gripstrength, and age.

Int. J. Environ. Res. Public Health 2020, 17, 1232 6 of 13
Table 1. Anthropometry, total and regional body composition in the Tai Chi Chuan group. Two-way ANOVA for the comparison between sexes and with the controlsample of healthy Italian adults.
Total Body Composition
Tai Chi Chuan ControlF
Men (n = 14) Women (n = 20) Men (n = 49) Women (n = 56)
Mean s.d. Mean s.d. Mean s.d. Mean s.d. psex psport psex•sport
Age (y) 63.4 7.9 62.5 7.1 62.9 6.6 62.8 6.4 0.713 0.948 0.763Height (cm) 172.2 5.1 155.5 6.7 166.1 6.2 153.2 6.7 0.000 0.001 0.151Weight (kg) 70.1 7.2 54.1 7.4 77.8 11.8 64.0 11.5 0.000 0.000 0.615BMI (kg/m2) 23.7 2.5 22.4 3.0 28.2 4.1 27.3 4.7 0.186 0.000 0.824Waist (cm) 87.2 9.0 74.0 6.9 97.4 11.3 85.2 12.1 0.000 0.000 0.822Arm (cm) 28.6 2.1 26.0 2.2 30.3 3.1 29.0 3.2 0.000 0.000 0.297Calf (cm) 35.2 2.0 33.0 2.4 36.8 3.3 34.9 3.7 0.002 0.009 0.876Rsp (ohm·cm) 352.7 45.6 380.4 54.2 454.9 56.3 553.2 50.5 0.010 0.001 0.677Xcsp (ohm·cm) 39.7 6.5 39.2 7.4 53.4 8.9 58.8 9.1 0.794 0.001 0.955Zsp (ohm·cm) 355.0 45.6 382.5 54.3 391.12 59.4 429.0 71.8 0.011 0.001 0.680Phase angle sp () 6.5 1.0 5.9 1.0 6.7 1.0 6.1 0.8 0.001 0.275 0.756
Regional Body Composition Men (n = 14) Women (n = 20) Men (n = 27) Women (n = 33) psex psport psex•sport
Arm: R sp (ohm·cm) 248.8 31.7 285.4 47.9 266.9 44.7 330.0 61.9 0.000 0.005 0.230Arm: Xc sp (ohm·cm) 25.4 4.8 24.7 5.2 31.8 7.65 31.2 8.0 0.687 0.000 0.993Arm: Z sp sp (ohm·cm) 250.1 31.8 286.4 48.1 268.8 45.03 331.6 62.0 0.000 0.005 0.235Arm: phase angle sp () 5.8 1.0 5.0 0.6 6.8 1.1 5.4 1.1 0.000 0.002 0.287Leg: R sp (ohm·cm) 254.6 17.4 287.0 34.2 255.2 44.4 297.9 58.52 0.000 0.562 0.601Leg: Xc sp (ohm·cm) 27.3 3.6 29.6 8.0 31.3 9.6 31.7 9.9 0.476 0.116 0.621Leg: Z sp sp (ohm·cm) 256.1 17.4 288.7 33.7 257.2 45.0 299.7 58.9 0.000 0.545 0.619Leg: phase angle sp () 6.1 0.8 6.0 2.2 6.9 1.4 6.03 1.3 0.135 0.229 0.241Trunk: R sp (ohm·cm) 492.9 142.5 436.5 132.4 520.0 196.8 506.7 159.3 0.523 0.305 0.791Trunk: Xc sp (ohm·cm) 68.1 24.1 44.8 14.0 63.8 25.1 49.0 22.6 0.000 0.793 0.538Trunk: Z sp sp (ohm·cm) 497.7 144.1 438.9 132.9 524.0 198.0 509.2 160.4 0.491 0.313 0.783Trunk: phase angle sp () 7.8 1.4 5.9 1.0 7.1 1.4 5.4 1.4 0.000 0.048 0.700Hand grip (kg) 39.6 8.9 24.3 5.0 38.0 9.4 23.6 5.4 0.000 0.789 0.913
s.d.: standard deviation; BMI: body mass index; Rsp: specific resistance; Xcsp: specific reactance; Zsp: specific impedance.

Int. J. Environ. Res. Public Health 2020, 17, 1232 7 of 13Int. J. Environ. Res. Public Health 2020, 17, x 7 of 13
Figure 2. Total body confidence ellipses. Comparison between the Tai Chi Chuan (TCC) group and controls. Men: T2 = 6.6, p = 0.047; women: T2 = 8, p = 0.023.
Figure 3. Regional confidence ellipses. Comparison between TCC group and controls. Arm (men: T2 = 9.8, p = 0.001; women: T2 = 11.2, p = 0.007); trunk (men T2 = 2.7, p = 0.285; women T2 = 2.2, p = 0.340).
Figure 2. Total body confidence ellipses. Comparison between the Tai Chi Chuan (TCC) group andcontrols. Men: T2 = 6.6, p = 0.047; women: T2 = 8, p = 0.023.
Int. J. Environ. Res. Public Health 2020, 17, x 7 of 13
Figure 2. Total body confidence ellipses. Comparison between the Tai Chi Chuan (TCC) group and controls. Men: T2 = 6.6, p = 0.047; women: T2 = 8, p = 0.023.
Figure 3. Regional confidence ellipses. Comparison between TCC group and controls. Arm (men: T2 = 9.8, p = 0.001; women: T2 = 11.2, p = 0.007); trunk (men T2 = 2.7, p = 0.285; women T2 = 2.2, p = 0.340).
Figure 3. Regional confidence ellipses. Comparison between TCC group and controls. Arm (men:T2 = 9.8, p = 0.001; women: T2 = 11.2, p = 0.007); trunk (men T2 = 2.7, p = 0.285; women T2 = 2.2,p = 0.340).

Int. J. Environ. Res. Public Health 2020, 17, 1232 8 of 13
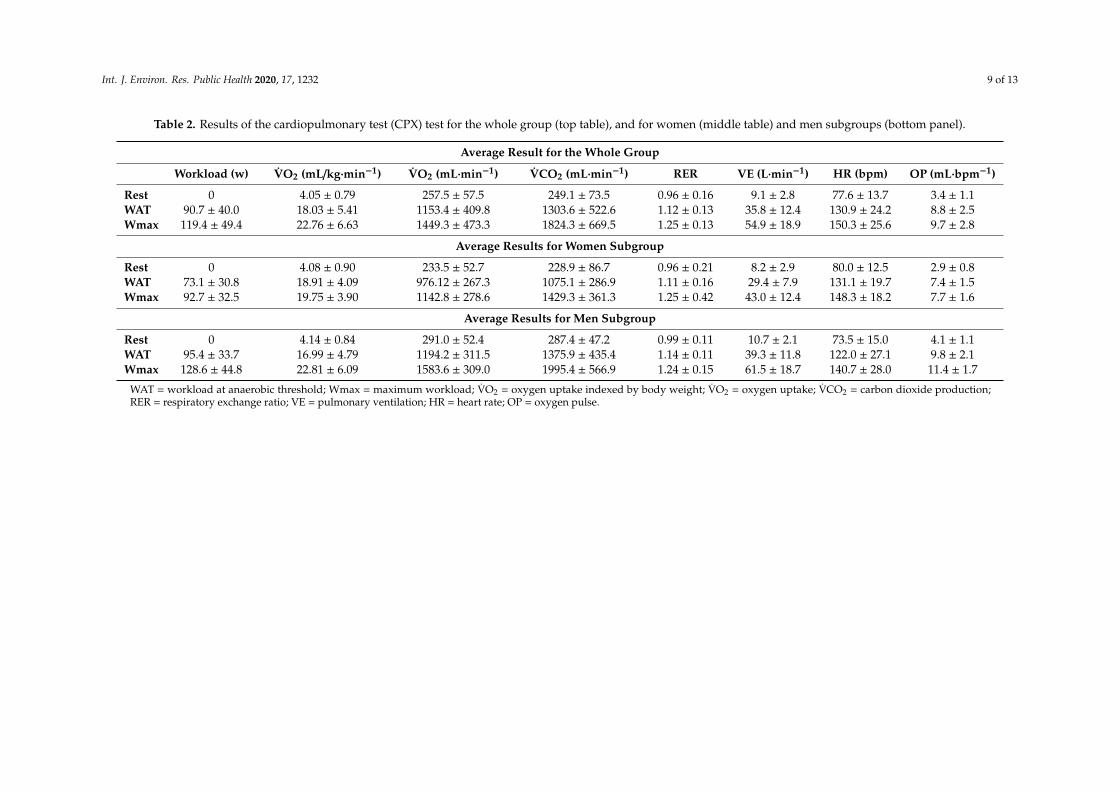
Hand-grip strength (HGS) values were above the cut offs for sarcopenia in both TCC and controls.Table 2 reports values of cardiopulmonary parameters gathered during the CPX test.Both TCC and control men showed higher values than women in all anthropometric measurements,
except for BMI, higher values of hand-grip strength and of total body, arm and trunk phase angles,and lower values of arm specific resistance and impedance (Table 1). Sex differences in bioelectricalvalues were less accentuated among TCC practitioners than in the controls. In fact, bioimpedancemean vectors were significantly different between in the control group only (Figure 4).
Int. J. Environ. Res. Public Health 2020, 17, x 8 of 13
Hand-grip strength (HGS) values were above the cut offs for sarcopenia in both TCC and controls.
Table 2 reports values of cardiopulmonary parameters gathered during the CPX test. Both TCC and control men showed higher values than women in all anthropometric
measurements, except for BMI, higher values of hand-grip strength and of total body, arm and trunk phase angles, and lower values of arm specific resistance and impedance (Table 1). Sex differences in bioelectrical values were less accentuated among TCC practitioners than in the controls. In fact, bioimpedance mean vectors were significantly different between in the control group only (Figure 4).
Figure 4. Total body confidence ellipses. Comparison between sexes. TCC: T2 = 3, 8, p = 0.177; controls: T2 = 20.1, p = 0.000.
Figure 4. Total body confidence ellipses. Comparison between sexes. TCC: T2 = 3, 8, p = 0.177; controls:T2 = 20.1, p = 0.000.
Int. J. Environ. Res. Public Health 2020, 17, 1232 9 of 13
Table 2. Results of the cardiopulmonary test (CPX) test for the whole group (top table), and for women (middle table) and men subgroups (bottom panel).
Average Result for the Whole Group
Workload (w) VO2 (mL/kg·min−1) VO2 (mL·min−1) VCO2 (mL·min−1) RER VE (L·min−1) HR (bpm) OP (mL·bpm−1)
Rest 0 4.05 ± 0.79 257.5 ± 57.5 249.1 ± 73.5 0.96 ± 0.16 9.1 ± 2.8 77.6 ± 13.7 3.4 ± 1.1WAT 90.7 ± 40.0 18.03 ± 5.41 1153.4 ± 409.8 1303.6 ± 522.6 1.12 ± 0.13 35.8 ± 12.4 130.9 ± 24.2 8.8 ± 2.5Wmax 119.4 ± 49.4 22.76 ± 6.63 1449.3 ± 473.3 1824.3 ± 669.5 1.25 ± 0.13 54.9 ± 18.9 150.3 ± 25.6 9.7 ± 2.8
Average Results for Women Subgroup
Rest 0 4.08 ± 0.90 233.5 ± 52.7 228.9 ± 86.7 0.96 ± 0.21 8.2 ± 2.9 80.0 ± 12.5 2.9 ± 0.8WAT 73.1 ± 30.8 18.91 ± 4.09 976.12 ± 267.3 1075.1 ± 286.9 1.11 ± 0.16 29.4 ± 7.9 131.1 ± 19.7 7.4 ± 1.5Wmax 92.7 ± 32.5 19.75 ± 3.90 1142.8 ± 278.6 1429.3 ± 361.3 1.25 ± 0.42 43.0 ± 12.4 148.3 ± 18.2 7.7 ± 1.6
Average Results for Men Subgroup
Rest 0 4.14 ± 0.84 291.0 ± 52.4 287.4 ± 47.2 0.99 ± 0.11 10.7 ± 2.1 73.5 ± 15.0 4.1 ± 1.1WAT 95.4 ± 33.7 16.99 ± 4.79 1194.2 ± 311.5 1375.9 ± 435.4 1.14 ± 0.11 39.3 ± 11.8 122.0 ± 27.1 9.8 ± 2.1Wmax 128.6 ± 44.8 22.81 ± 6.09 1583.6 ± 309.0 1995.4 ± 566.9 1.24 ± 0.15 61.5 ± 18.7 140.7 ± 28.0 11.4 ± 1.7
WAT = workload at anaerobic threshold; Wmax = maximum workload; VO2 = oxygen uptake indexed by body weight; VO2 = oxygen uptake; VCO2 = carbon dioxide production;RER = respiratory exchange ratio; VE = pulmonary ventilation; HR = heart rate; OP = oxygen pulse.

Int. J. Environ. Res. Public Health 2020, 17, 1232 10 of 13
4. Discussions
The present research showed that TCC practitioners of both sexes, including the older ones, wereoverall characterized by a normal nutritional status, normal levels of physical capacity, and normalvalues of hand-grip strength. With respect to a sample of sedentary people of similar age, they showedlower percentages of fat in the total body, the arm, and the trunk (as indicated by the lower specificvector length and waist circumferences), and higher muscle mass in the trunk (as indicated by thehigher phase angle), but lower muscle mass in the arm, and similar hand-grip strength. Sexualdimorphism was characterized by higher muscle mass (total body, arm, and trunk) and hand-gripstrength, and lower %FM (arm) in men; sex differences were less accentuated among TCC practitionersthan in the control.
These results suggest a positive effect of TCC practice on body composition, particularly on fatmass. Consistently with our results, the literature focused on body composition in TCC suggest amajor effect of TCC on fat mass. Lan et al. [9] observed a lower percentage of body fat among TCCpractitioners. Longitudinal studies on the effect of a 10/12-week Tai Chi program showed a reductionof %FM [13,15], or of body fat [14,17]. The analysis of regional body composition and anthropometryconfirmed the effect of TCC on %FM. The lower %FM values (lower specific vector length) amongTCC practitioners with respect to controls mainly concerned the arm and the trunk, where a lowerwaist circumference, indicative of lower visceral fat accumulation, was also detected. These results areindicative of a healthy body composition, considering the role of visceral fat in the development ofmetabolic disorders and cardiovascular diseases [38]. It should also be noted that such phenotype isunexpected, considering the increase of abdominal adiposity commonly associated with physiologicalaging [39]. The body composition of the legs, instead, was not significantly different from the control.Conversely, Yu et al. [12] detected lower values of subcutaneous adipose tissue in the thighs of TCCpractitioners than in the control.
Overall, our results also suggest a weak effect of TCC on muscle mass, as indicated by the similarhand-grip strength and similar or even lower phase angle of TCC practitioners with respect to thecontrol group. Similarly, Yu et al. [12] and Lai et al. [16] failed to detect differences in the comparisonwith a sample of swimmers, nor respect to the control [12], and Kelly and Gilman [4] observed thatTCC was not as effective at building muscle compared to other types of physical exercise. However,other studies showed an improvement of skeletal muscle mass [13,14], of muscle strength [13], and offunctional performance [40,41], and suggested that TCC would have a similar effect as walking onparameters related to aerobic metabolism [9,15].
The regional approach of this study also allowed a detailed analysis of sex differences.The observed larger muscle mass in men and the higher %FM in the women, particularly in thearm and leg, are coherent with the known pattern of sexual dimorphism [6]. Furthermore, the higherwaist circumference values of men are consistent with their generally greater central fat distribution.However, mean waist values were below the threshold for visceral obesity in both sexes, consistentlywith the results on low visceral adiposity reported among TCC subjects in this study and by otherauthors [12]. Furthermore, sex differences were less accentuated among TCC practitioners than in thecontrol. This finding is not consistent with the low degree of sexual dimorphism detected in youngsubjects practicing different kinds of physical activities [42].
On the whole, the results of this study suggest that TCC practitioners do not strictly follow thetrend towards the increase of fat mass, particularly of visceral adiposity, the reduction of hand-gripstrength, and the worsening of nutritional status generally observed among middle-aged and elderlypeople [1]. Hence, TCC practitioners appear to be less affected by the process of physiological agingand the associated fat mass and functional changes. The healthy lifestyle commonly adopted by TCCpractitioners could also contribute to such pattern.
This study has points of strength. In fact, this is the first study on total body and regional bodycomposition in middle-aged and elderly athletes of both sexes using, phase angle, and specific BIVA,that is a procedure particularly promising for body composition analysis in sport [25]. The main

Int. J. Environ. Res. Public Health 2020, 17, 1232 11 of 13
limitation of the study is related to the sample size of TCC practitioners, which is not so large due tothe peculiarity of the age range and the still limited diffusion of the discipline in Western countries.However, the information on regional body composition, that is scant in middle-aged and elderlyathletes, can be insightful for future research.
5. Conclusions
The present research showed that TCC practitioners were characterized by good nutritional status(normal values of BMI, MNA, and low levels of fat mass in the total body, in the arm, and in the trunk)and had normal values of hand-grip strength. The effect on muscle mass was less evident. Theseresults confirm the positive effect of TCC practice on body composition and functionality. Consideringthe suitableness of the practice in late adulthood over other disciplines, TCC represents a safe andeffective way to help improve nutritional status and physical function.
From a methodological point of view, specific BIVA appears a suitable technique to screen andmonitor total body and regional body composition in middle-aged and elderly subjects, in order toevaluate their nutritional status and risk of morbidity.
Author Contributions: Conceptualization, S.S. and E.M.; Data curation, S.S., A.D., G.G., A.C., and E.M.; Formalanalysis, S.S., G.M., V.S., and E.M.; Investigation, S.S., A.D., G.M., G.G., A.C., and E.M.; Supervision, E.M.;Visualization, S.S.; Writing—original draft, S.S., A.C., and E.M.; Writing—review and editing, S.S., A.D., G.M.,G.G., V.S., A.C., and E.M. All authors have read and agreed to the published version of the manuscript.
Funding: This research received no external funding.
Acknowledgments: We are most grateful to all the TCC volunteers of the A.S.D. Tai Chi Chuan school of Cagliari(Italy) and La porta d’Oriente school of Quartu (Italy). Silvia Stagi gratefully acknowledges Sardinia RegionalGovernment for the financial support of her PhD scholarship (P.O.R. Sardegna F.S.E. Operational Programme ofthe Autonomous Region of Sardinia, European Social Fund 2014-2020-Axis III Education and training, Thematicgoal 10, Priority of investment 10ii), Specific goal 10.5, Action partnership agreement 10.5.12.
Conflicts of Interest: The authors declare no conflict of interest.
References
1. Buffa, R.; Floris, G.U.; Putzu, P.F.; Marini, E. Body composition variations in ageing. Coll. Antropol. Zabreg2011, 35, 259–265.
2. Cruz-Jentoft, A.J.; Bahat, G.; Bauer, J.; Boirie, Y.; Bruyère, O.; Cederholm, T.; Cooper, C.; Landi, F.; Rolland, Y.;Sayer, A.A.; et al. Sarcopenia: Revised European consensus on definition and diagnosis. Age Ageing 2019, 48,16–31. [CrossRef]
3. Koolhaas, C.M.; Dhana, K.; Van Rooij, F.J.A.; Schoufour, J.; Hofman, A.; Franco, O.H. Physical activity typeand health-related quality of life among middle-aged and elderly adults: The Rotterdam study. J. Nutr.Health Aging 2018, 22, 246–253. [CrossRef]
4. Kelly, O.J.; Gilman, J.C. Can unconventional exercise be helpful in the treatment, management and preventionof osteosarcopenic obesity? Curr. Aging Sci. 2017, 10, 106–121. [CrossRef]
5. Fien, S.; Climstein, M.; Quilter, C.; Buckley, G.; Henwood, T.; Grigg, J.; Keogh, J.W.L. Anthropometric,physical function and general health markers of masters athletes: A cross-sectional study. Peer J. 2017, 5,e3768. [CrossRef] [PubMed]
6. Hinton, B.J.; Fan, B.; Ng, B.K.; Shepherd, J.A. Dual energy X-Ray Absorptiometry body composition referencevalues of limbs and trunk from NHANES 1999-2004 with additional visualization methods. PLoS ONE 2017,12, 1–17. [CrossRef] [PubMed]
7. Wong, A.M.K.; Pei, Y.C.; Lan, C.; Huang, S.C.; Lin, Y.C.; Chou, S.W. Is Tai Chi Chuan Effective in ImprovingLower Limb Response Time to Prevent Backward Falls in the Elderly? Age 2009, 31, 163–170. [CrossRef][PubMed]
8. Qin, L.; Choy, W.; Leung, K.; Leung, P.C.; Au, S.; Hung, W.; Dambacher, M.; Chan, K. Beneficial Effects ofRegular Tai Chi Exercise on Musculoskeletal System. J. Bone Miner. Metab. 2005, 23, 186–190. [CrossRef]
9. Lan, C.; Lai, J.S.; Wong, M.K.; Yu, M.L. Cardiorespiratory Function, Flexibility, and Body Composition amongGeriatric Tai Chi Chuan Practitioners. Arch. Phys. Med. Rehabil. 1996, 77, 612–616. [CrossRef]
Int. J. Environ. Res. Public Health 2020, 17, 1232 12 of 13
10. Chan, A.W.K.; Yu, D.S.F.; Choi, K.C. Effects of Tai Chi Qigong on Psychosocial Well-Being Among HiddenElderly, Using Elderly Neighborhood Volunteer Approach: A Pilot Randomized Controlled Trial. Clin. Interv.Aging 2017, 12, 85–96. [CrossRef]
11. Lim, K.H.L.; Pysklywec, A.; Plante, M.; Demers, L. The Effectiveness of Tai Chi for Short-Term CognitiveFunction Improvement in the Early Stages of Dementia in the Elderly: A Systematic Literature Review.Clin. Interv. Aging 2019, 14, 827–839. [CrossRef] [PubMed]
12. Yu, T.-Y.; Pei, Y.-C.; Lau, Y.-C.; Chen, C.-K.; Hsu, H.-C.; Wong, A.M.K. Comparison of the Effects of Swimmingand Tai Chi Chuan on Body Fat Composition in Elderly People. Chang Gung Med. J. 2007, 30, 128–134.[PubMed]
13. Barbat-Artigas, S.; Filion, M.E.; Dupontgand, S.; Karelis, A.D.; Aubertin-Leheudre, M. Effects of Tai ChiTraining in Dynapenic and Nondynapenic Postmenopausal Women. Menopause 2011, 18, 974–979. [CrossRef][PubMed]
14. Hsu, W.H.; Hsu, R.W.W.; Lin, Z.R.; Fan, C.H. Effects of Circuit Exercise and Tai Chi on Body Composition inMiddle-Aged and Older Women. Geriatr. Gerontol. Int. 2015, 15, 282–288. [CrossRef] [PubMed]
15. Hui, S.S.; Xie, Y.J.; Woo, J.; Kwok, T.C.Y. Practicing Tai Chi had lower energy metabolism than walkingbut similar health benefits in terms of aerobic fitness, resting energy expenditure, body composition andself-perceived physical health. Complement. Ther. Med. 2016, 27, 43–50. [CrossRef] [PubMed]
16. Lai, H.M.; Liu, M.S.Y.; Lin, T.J.; Tsai, Y.L.; Chien, E.J. Higher Dheas Levels Associated with Long-TermPracticing of Tai Chi. Chin. J. Physiol. 2017, 60, 124–130. [CrossRef]
17. Dechamps, A.; Gatta, B.; Bourdel-Marchasson, I.; Tabarin, A.; Roger, P. Pilot Study of a 10-WeekMultidisciplinary Tai Chi Intervention in Sedentary Obese Women. Clin. J. Sport Med. 2009, 19, 49–53.[CrossRef]
18. Buffa, R.; Mereu, E.; Comandini, O.; Ibanez, M.E.; Marini, E. Bioelectrical Impedance Vector Analysis (BIVA)for the Assessment of Two-Compartment Body Composition. Eur. J. Clin. Nutr. 2014, 68, 1234. [CrossRef]
19. Buffa, R.; Saragat, B.; Cabras, S.; Rinaldi, A.C.; Marini, E. Accuracy of Specific BIVA for the Assessment ofBody Composition in the United States Population. PLoS ONE 2013, 8, e58533. [CrossRef]
20. Marini, E.; Sergi, G.; Succa, V.; Saragat, B.; Sarti, S.; Coin, A.; Manzato, E.; Buffa, R. Efficacy of SpecificBioelectrical Impedance Vector Analysis (BIVA) for Assessing Body Composition in the Elderly. J. Nutr.Health Aging 2013, 17, 515–521. [CrossRef]
21. Saragat, B.; Buffa, R.; Mereu, E.; De Rui, M.; Coin, A.; Sergi, G.; Marini, E. Specific bioelectrical impedancevector reference values for assessing body composition in the Italian elderly. Exp. Gerontol. 2014, 50, 52–56.[CrossRef] [PubMed]
22. Marini, E.; Campa, F.; Buffa, R.; Stagi, S.; Matias, C.N.; Toselli, S.; Sardinha, L.B.; Silva, A.M. Phase Angle andBioelectrical Impedance Vector Analysis in the Evaluation of Body Composition in Athletes. Clin. Nutr. 2019.[CrossRef] [PubMed]
23. Norman, K.; Stobäus, N.; Pirlich, M.; Bosy-Westphal, A. Bioelectrical phase angle and impedance vectoranalysis–clinical relevance and applicability of impedance parameters. Clin. Nutr. 2012, 31, 854–861.[CrossRef] [PubMed]
24. Campa, F.; Matias, C.N.; Marini, E.; Heymsfield, S.B.; Toselli, S.; Sardinha, L.B.; Silva, A.M. Identifying athletebody-fluid changes during a competitive season with bioelectrical impedance vector analysis. Int. J. SportsPhysiol. Perform. 2019, 1, 1–21. [CrossRef]
25. Castizo-Olier, J.; Irurtia, A.; Jemni, M.; Carrasco-Marginet, M.; Fernández-García, R.; Rodríguez, F.A.Bioelectrical Impedance Vector Analysis (BIVA) in Sport and Exercise: Systematic Review and FuturePerspectives. PLoS ONE 2018, 13, e0197957. [CrossRef]
26. Antoni, G.; Marini, E.; Curreli, N.; Tuveri, V.; Comandini, O.; Cabras, S.; Gabba, S.; Madeddu, C.; Crisafulli, A.;Rinaldi, A.C. Energy expenditure in caving. PLoS ONE 2017, 12, e0170853. [CrossRef]
27. Toselli, S.; Marini, E.; Maietta Latessa, P.; Benedetti, L.; Campa, F. Maturity Related Differences in BodyComposition Assessed by Classic and Specific Bioimpedance Vector Analysis among Male Elite Youth SoccerPlayers. Int. J. Environ. Res. Public Health 2020, 22, 729. [CrossRef]
28. Lohman, T.G.; Roche, A.F.; Martorell, R. Anthropometric Standardization Reference Manual; Human KineticsBooks Champaign: Champaign, IL, USA, 1988.
29. World Health Organization. Obesity: Preventing and Managing the Global Epidemic. Report of a WHO Consultation;World Health Organization Technical Report Series; WHO: Geneva, Switzerland, 2000; Volume 894, pp. 1–253.

Int. J. Environ. Res. Public Health 2020, 17, 1232 13 of 13
30. Kyle, U.G.; Bosaeus, I.; De Lorenzo, A.D.; Deurenberg, P.; Elia, M.; Manuel Gómez, J.; Lilienthal Heitmann, B.;Kent-Smith, L.; Melchior, J.C.; Pirlich, M.; et al. Bioelectrical impedance analysis—Part II: Utilization inclinical practice. Clin. Nutr. 2004, 23, 1430–1453. [CrossRef]
31. Baumgartner, R.N.; Chumlea, W.C.; Roche, A.F. Bioelectric Impedance Phase Angle and Body Composition.Am. J. Clin. Nutr. 1988, 48, 16–23. [CrossRef]
32. Fuller, N.J.; Elia, M. Potential Use of Bioelectrical Impedance of the “whole Body” and of Body Segments forthe Assessment of Body Composition: Comparison with Densitometry and Anthropometry. Eur. J. Clin.Nutr. 1989, 43, 779–791.
33. Dodds, R.M.; Syddall, H.E.; Cooper, R.; Benzeval, M.; Deary, I.J.; Dennison, E.M.; Der, G.; Gale, C.R.;Inskip, H.M.; Jagger, C.; et al. Grip Strength across the Life Course: Normative Data from Twelve BritishStudies. PLoS ONE 2014, 9, e113637. [CrossRef] [PubMed]
34. Guigoz, Y. The Mini Nutritional Assessment (MNA®) Review of the Literature-What Does It Tell Us? J. Nutr.Health Aging 2006, 10, 466.
35. Crisafulli, A.; Piras, F.; Chiappori, P.; Votelli, S.; Caria, M.A.; Lobina, A.; Millia, R.; Tocco, F.; Concu, A.;Melis, F. Estimating stroke volume from oxygen pulse during exercise. Physiol. Meas. 2007, 28, 1201.[CrossRef] [PubMed]
36. Howley, E.T.; Bassett, D.R.; Welch, H. Criteria for maximal oxygen uptake: Review and commentary. Med.Sci. Sports Exerc. 1995, 27, 1292–1301. [CrossRef]
37. Cohen, J. Statistical Power Analysis for the Behavioral Sciences; Routledge: London, UK, 2013.38. Neeland, I.J.; Ross, R.; Després, J.P.; Matsuzawa, Y.; Yamashita, S.; Shai, I.; Seidell, J.; Magni, P.; Santos, R.D.;
Arsenault, B.; et al. Visceral and ectopic fat, atherosclerosis, and cardiometabolic disease: A positionstatement. Lancet Diabetes Endocrinol. 2019, 7, 715–725. [CrossRef]
39. Bosy-Westphal, A.; Booke, C.A.; Blöcker, T.; Kossel, E.; Goele, K.; Later, W.; Heller, M.; Glüer, C.C.; Müller, M.J.Measurement site for waist circumference affects its accuracy as an index of visceral and abdominalsubcutaneous fat in a Caucasian population. J. Nutr. 2010, 140, 954–996. [CrossRef]
40. Manor, B.; Lough, M.; Gagnon, M.M.; Cupples, A.; Wayne, P.M.; Lipsitz, L.A. Functional benefits of tai chitraining in senior housing facilities. J. Am. Geriatr. Soc. 2014, 62, 1484–1489. [CrossRef]
41. Lan, C.; Lai, J.S.; Chen, S.Y.; Wong, M.K. 12-month Tai Chi training in the elderly: Its effect on health fitness.Med. Sci. Sports Exerc. 1998, 30, 345–351. [CrossRef]
42. Buffa, R.; Marini, E.; Floris, G. Variation in sexual dimorphism in relation to physical activity. Am. J. Hum. Biol.2001, 13, 341–348. [CrossRef]
© 2020 by the authors. Licensee MDPI, Basel, Switzerland. This article is an open accessarticle distributed under the terms and conditions of the Creative Commons Attribution(CC BY) license (http://creativecommons.org/licenses/by/4.0/).