lowering your compressed air energy costs trey donze mike hotz air technologies
TRANSCRIPT

Lowering Your Compressed Air Energy Costs
Trey DonzeMike Hotz
Air Technologies
Why Care About Compressed Air?
• Compressed air is expensive
• Compressed air is essential to plant productivity
• Compressed air systems can be effectively managed to improve plant operation
• Compressed air systems usually have significant opportunities for efficiency improvement
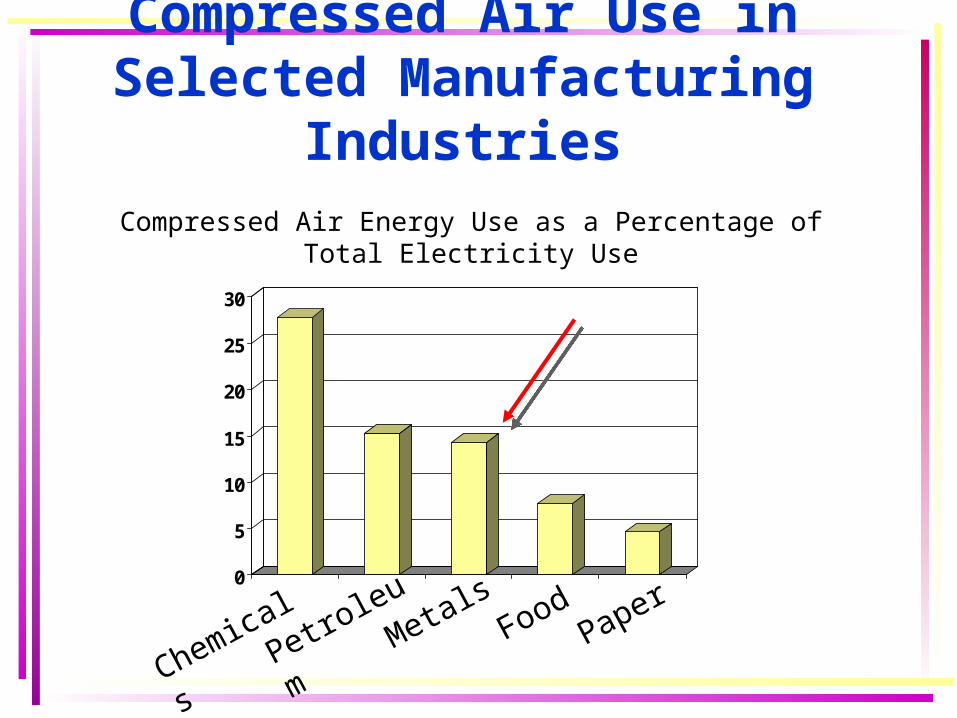
Compressed Air Use in Selected Manufacturing Industries
0
5
10
15
20
25
30
Compressed Air Energy Use as a Percentage of Total Electricity Use
ChemicalsPetroleum
MetalsFood
Paper
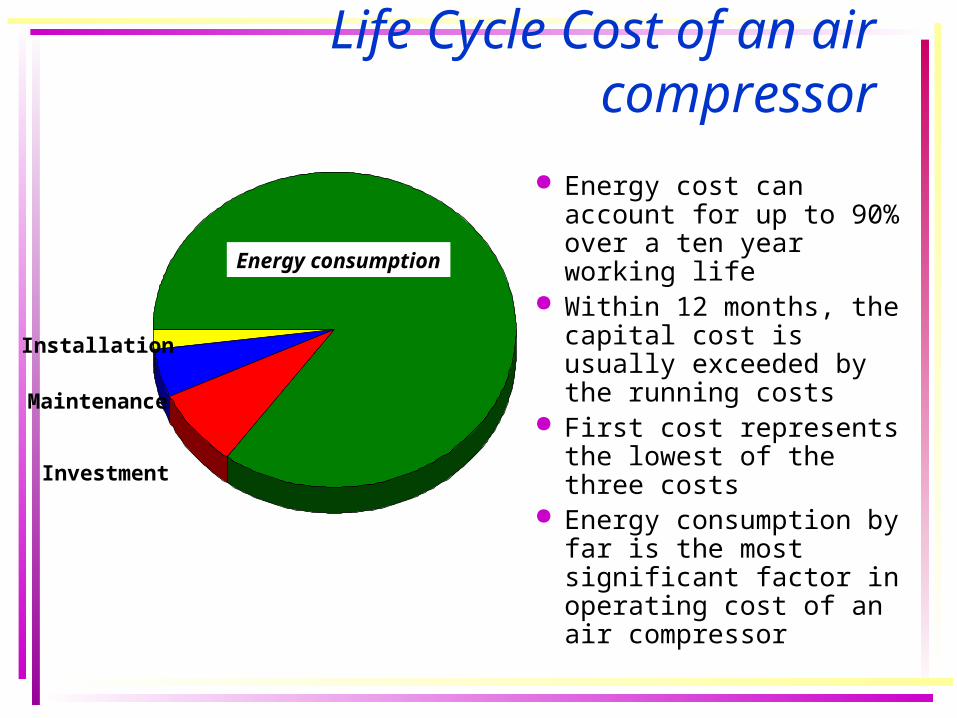
Life Cycle Cost of an air compressor
Energy cost can account for up to 90% over a ten year working life
Within 12 months, the capital cost is usually exceeded by the running costs
First cost represents the lowest of the three costs
Energy consumption by far is the most significant factor in operating cost of an air compressor
Investment
Installation
Maintenance
Energy consumption
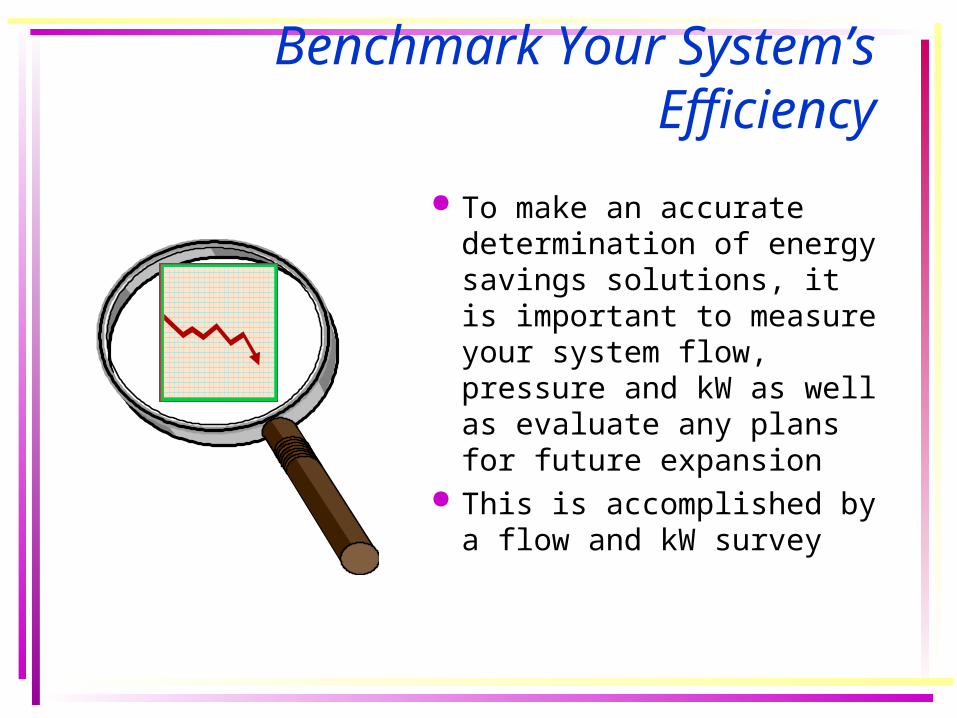
To make an accurate determination of energy savings solutions, it is important to measure your system flow, pressure and kW as well as evaluate any plans for future expansion
This is accomplished by a flow and kW survey
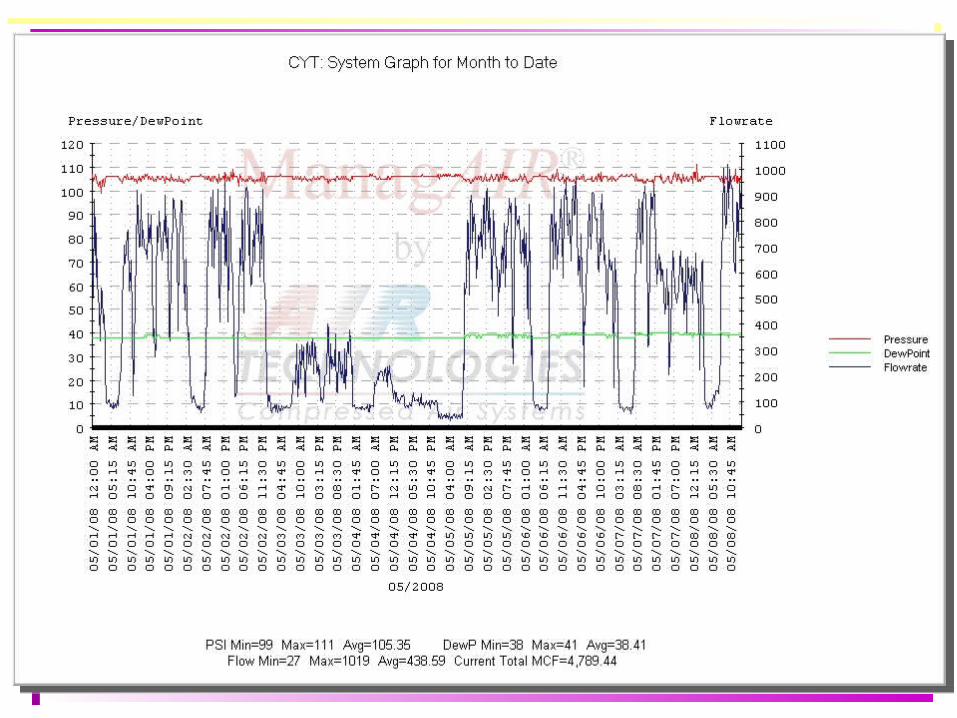
Benchmark Your System’s Efficiency
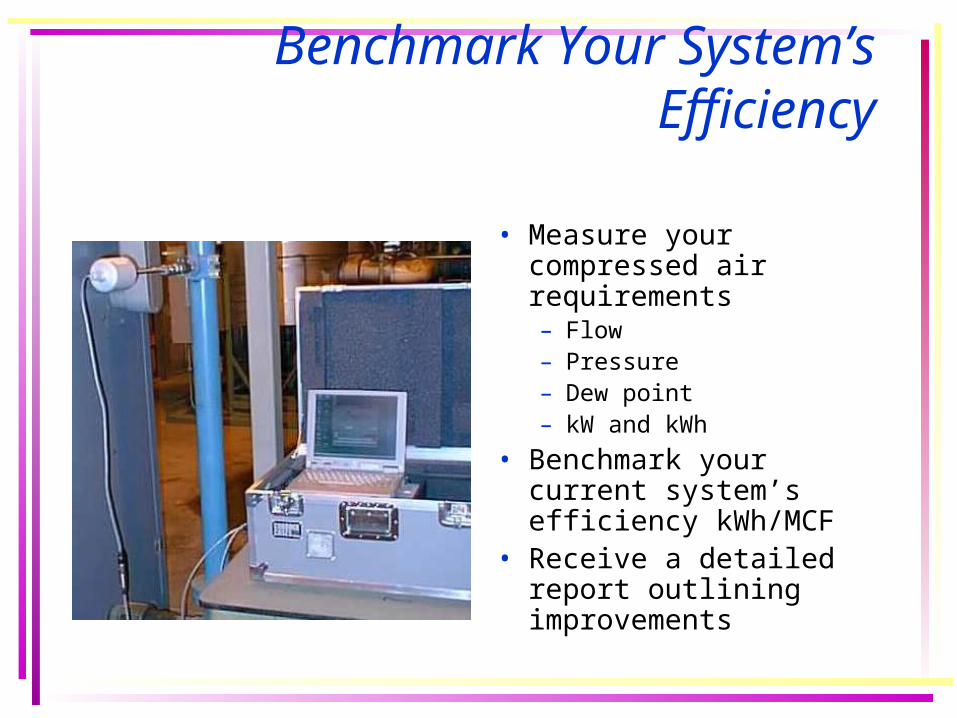
• Measure your compressed air requirements– Flow– Pressure– Dew point– kW and kWh
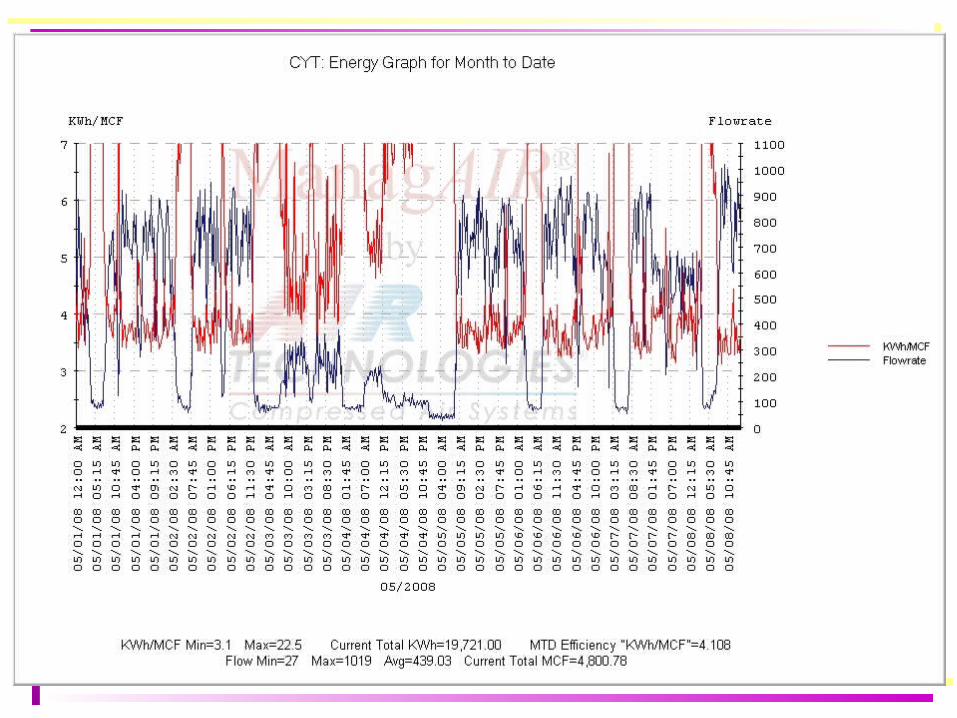
• Benchmark your current system’s efficiency kWh/MCF
• Receive a detailed report outlining improvements
Benchmark Your System’s Efficiency
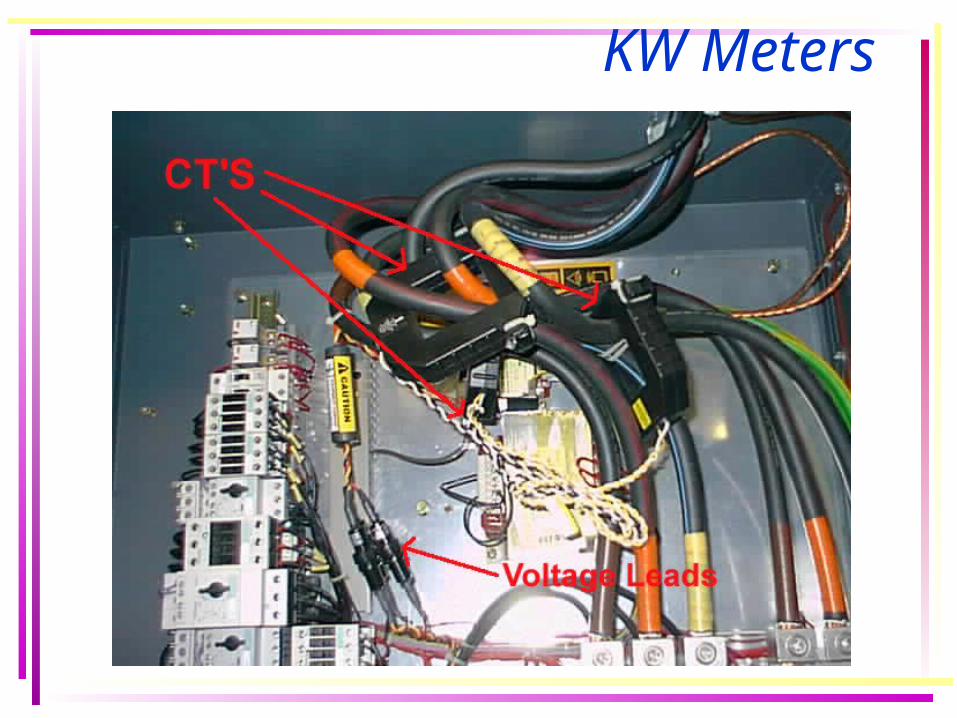
KW Meters
Typical 24 hrs/day operation with low night shift and high day shift consumption. Steady weekend consumption (leakages).
(64% of installations).
time
Five days/week operation, erratic demand fluctuations
(28% of installations).
time
Energy Reduction Opportunities
• Use Efficient Compressor Controls
• Reduce Compressed Air Usage
• Lower Compressor Discharge Pressure
• Efficiently Sequence Air Compressors
• Operate and Maintain Compressed Air Equipment at Peak Efficiency
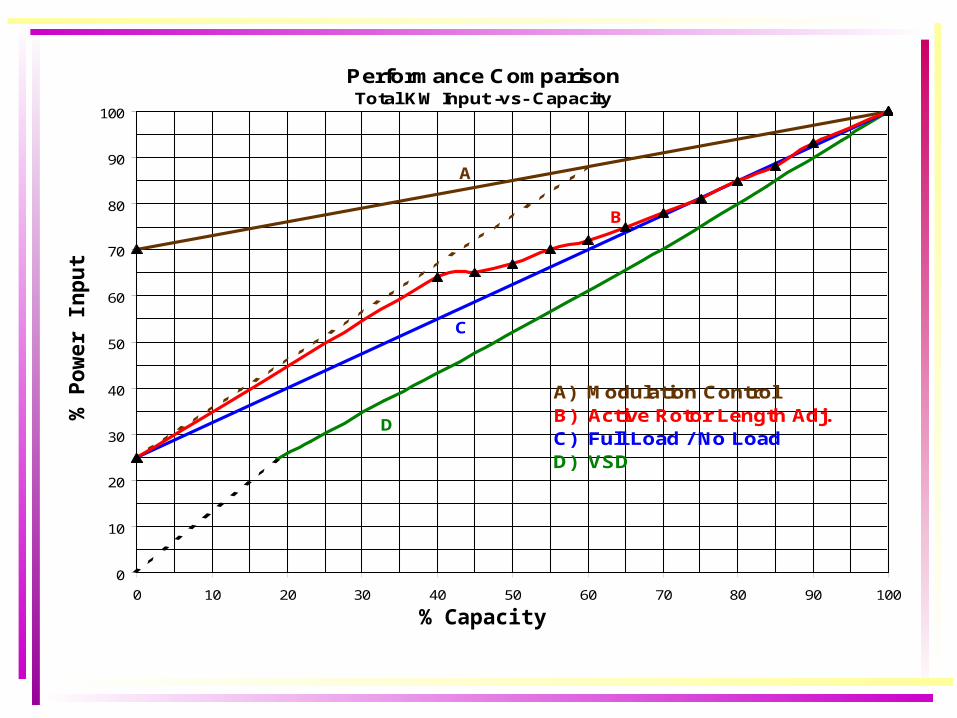
Performance ComparisonTotal KW Input -vs- Capacity
0
10
20
30
40
50
60
70
80
90
100
0 10 20 30 40 50 60 70 80 90 100
A) Modulation ControlB) Active Rotor Length Adj.C) Full Load / No LoadD) VSD
A
B
C
D
% Capacity
% P
ower
In
pu
t
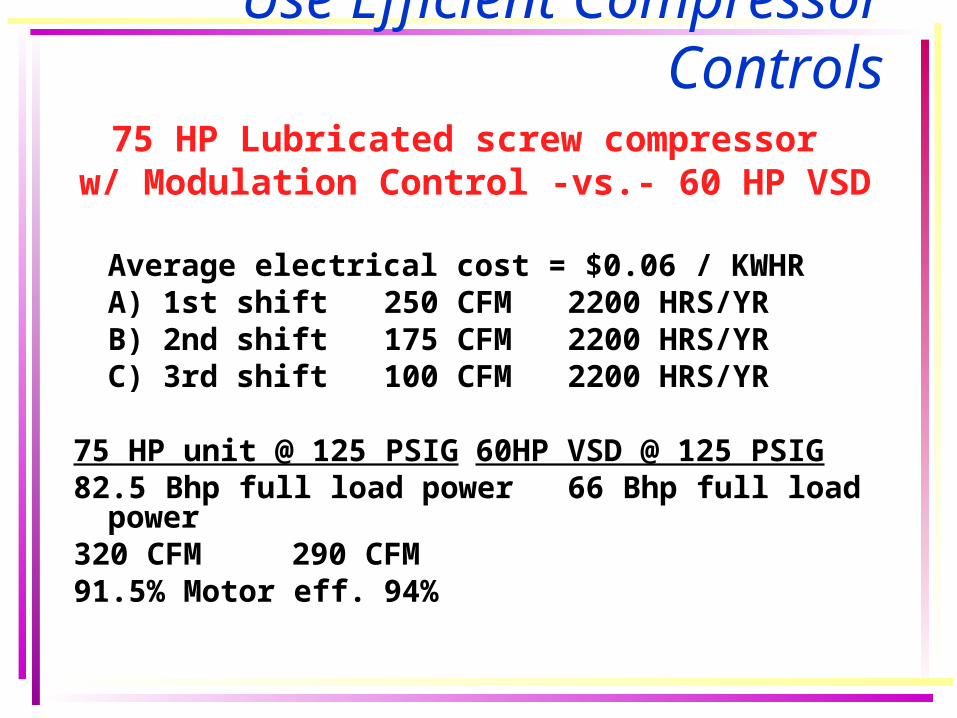
75 HP Lubricated screw compressor w/ Modulation Control -vs.- 60 HP VSD
Average electrical cost = $0.06 / KWHRA) 1st shift 250 CFM 2200 HRS/YRB) 2nd shift 175 CFM 2200 HRS/YRC) 3rd shift 100 CFM 2200 HRS/YR
75 HP unit @ 125 PSIG 60HP VSD @ 125 PSIG
82.5 Bhp full load power 66 Bhp full load power
320 CFM 290 CFM91.5% Motor eff. 94%
Use Efficient Compressor Controls
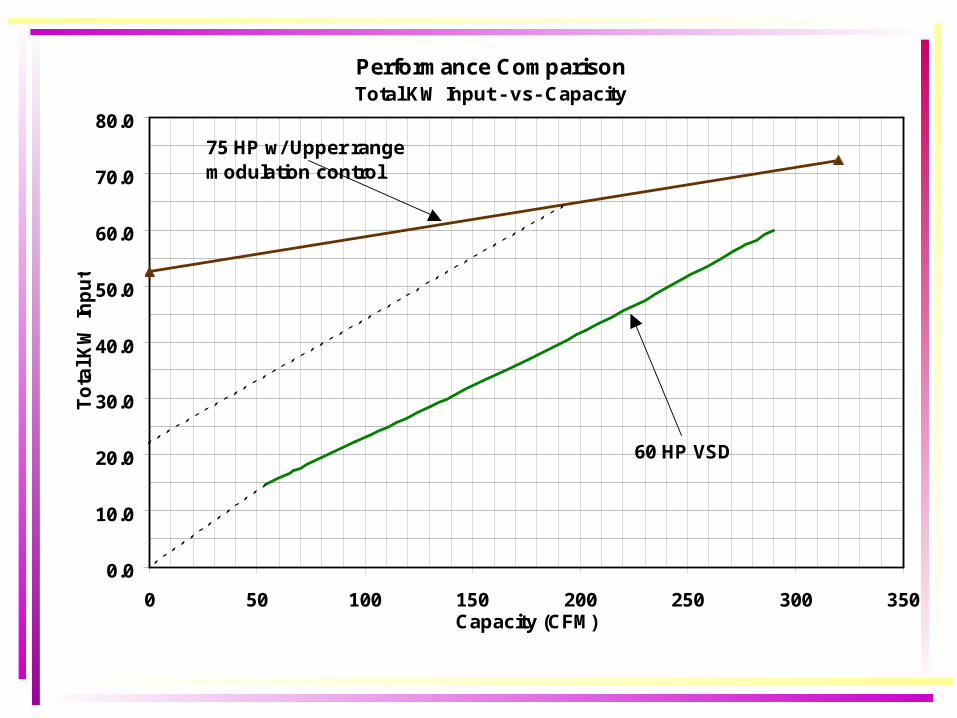
Performance ComparisonTotal KW Input - vs- Capacity
0.0
10.0
20.0
30.0
40.0
50.0
60.0
70.0
80.0
0 50 100 150 200 250 300 350Capacity (CFM)
To
tal K
W In
pu
t
60 HP VSD
75 HP w/ Upper range modulation control
Use Efficient Compressor Controls
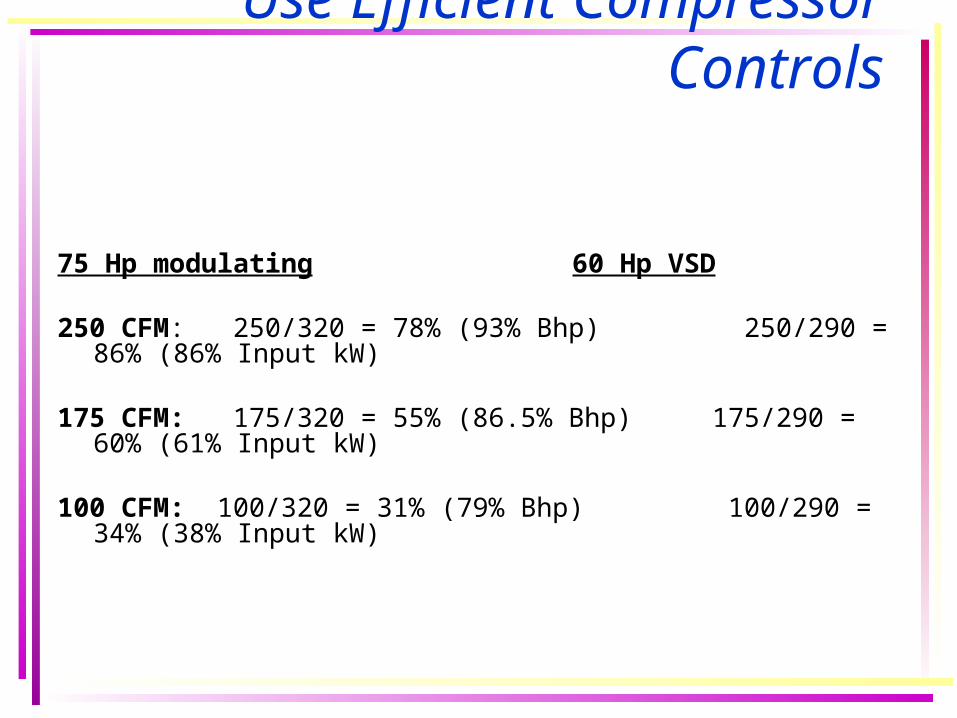
75 Hp modulating 60 Hp VSD
250 CFM: 250/320 = 78% (93% Bhp) 250/290 = 86% (86% Input kW)
175 CFM: 175/320 = 55% (86.5% Bhp) 175/290 = 60% (61% Input kW)
100 CFM: 100/320 = 31% (79% Bhp) 100/290 = 34% (38% Input kW)
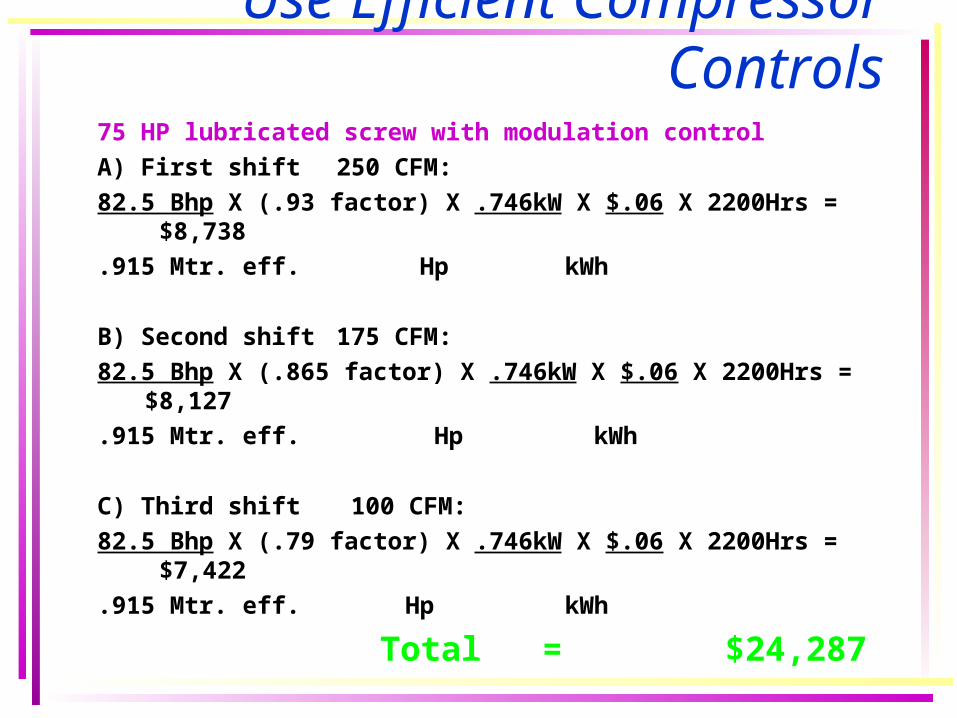
Use Efficient Compressor Controls75 HP lubricated screw with modulation control
A) First shift 250 CFM:
82.5 Bhp X (.93 factor) X .746kW X $.06 X 2200Hrs = $8,738
.915 Mtr. eff. Hp kWh
B) Second shift 175 CFM:
82.5 Bhp X (.865 factor) X .746kW X $.06 X 2200Hrs = $8,127
.915 Mtr. eff. Hp kWh
C) Third shift 100 CFM:
82.5 Bhp X (.79 factor) X .746kW X $.06 X 2200Hrs = $7,422
.915 Mtr. eff. Hp kWh
Total = $24,287
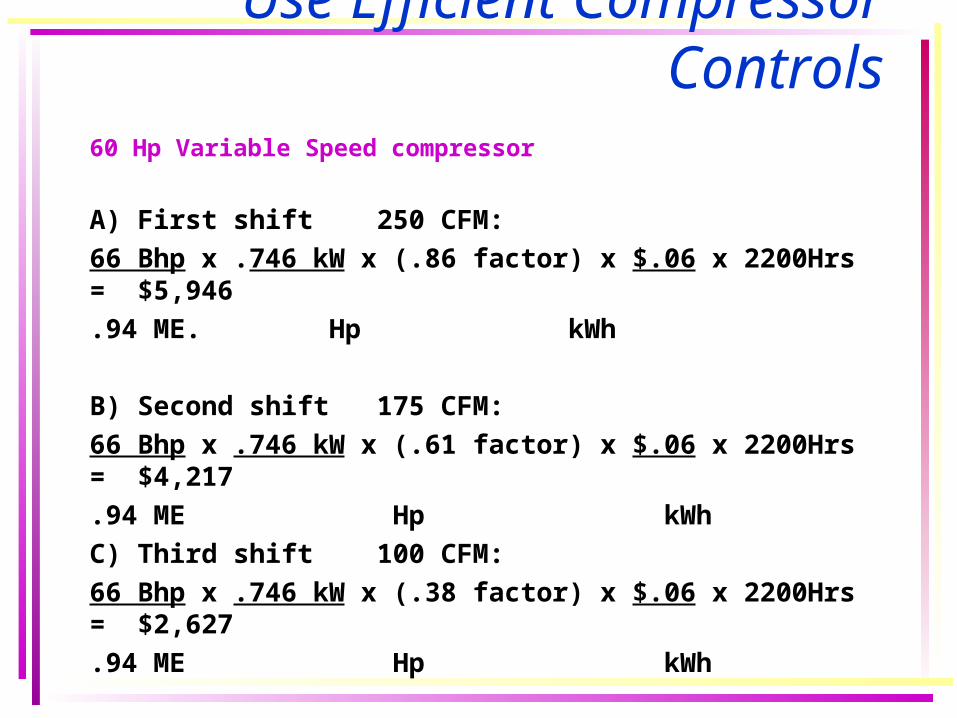
Use Efficient Compressor Controls60 Hp Variable Speed compressor
A) First shift 250 CFM:
66 Bhp x .746 kW x (.86 factor) x $.06 x 2200Hrs = $5,946
.94 ME. Hp kWh
B) Second shift 175 CFM:
66 Bhp x .746 kW x (.61 factor) x $.06 x 2200Hrs = $4,217
.94 ME Hp kWh
C) Third shift 100 CFM:
66 Bhp x .746 kW x (.38 factor) x $.06 x 2200Hrs = $2,627
.94 ME Hp kWh
Total = $12,790
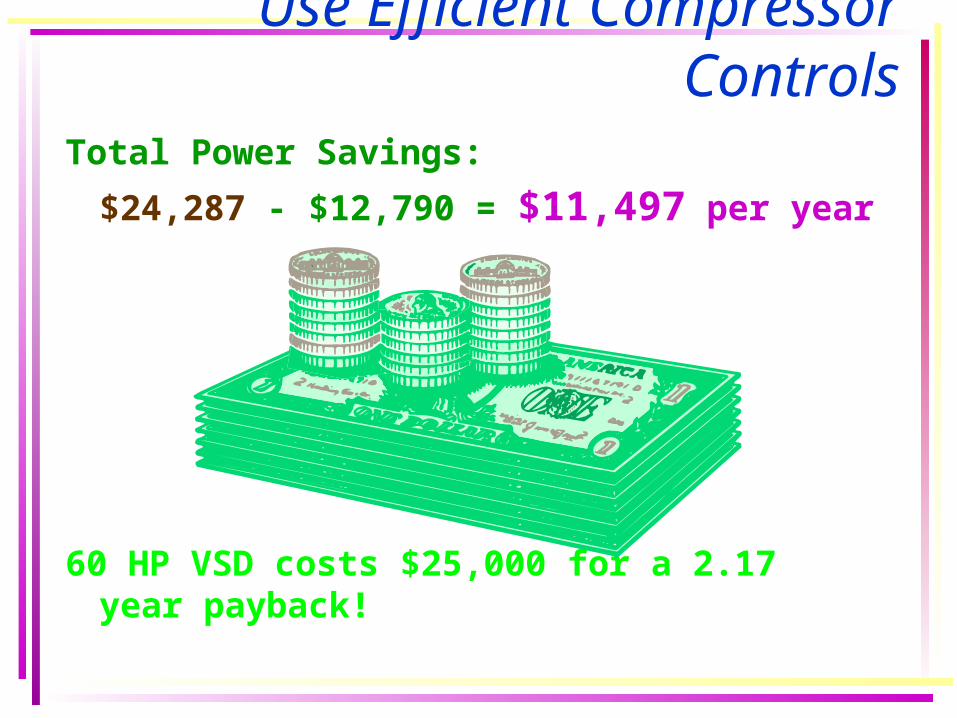
Total Power Savings:
$24,287 - $12,790 = $11,497 per year
60 HP VSD costs $25,000 for a 2.17 year payback!
Use Efficient Compressor Controls
Reduce Compressed Air Usage
• Eliminate inappropriate air users• Use brushes, blowers, or vacuum systems
instead of compressed air to clean parts or remove debris;
• Use blowers, electric actuators, or hydraulics instead of compressed air blasts to move parts;
• Use high efficiency nozzles instead of open orifices
Reduce Compressed Air Usage
• Eliminate inappropriate air users• Use fans to cool electrical cabinets instead of
compressed air vortex tubes • Apply a vacuum system instead of using
compressed air venturi methods • Use blowers instead of compressed air to
provide cooling, aspirating, blow guns, air lances, agitating, mixing, or to inflate packaging
Reduce Compressed Air Usage
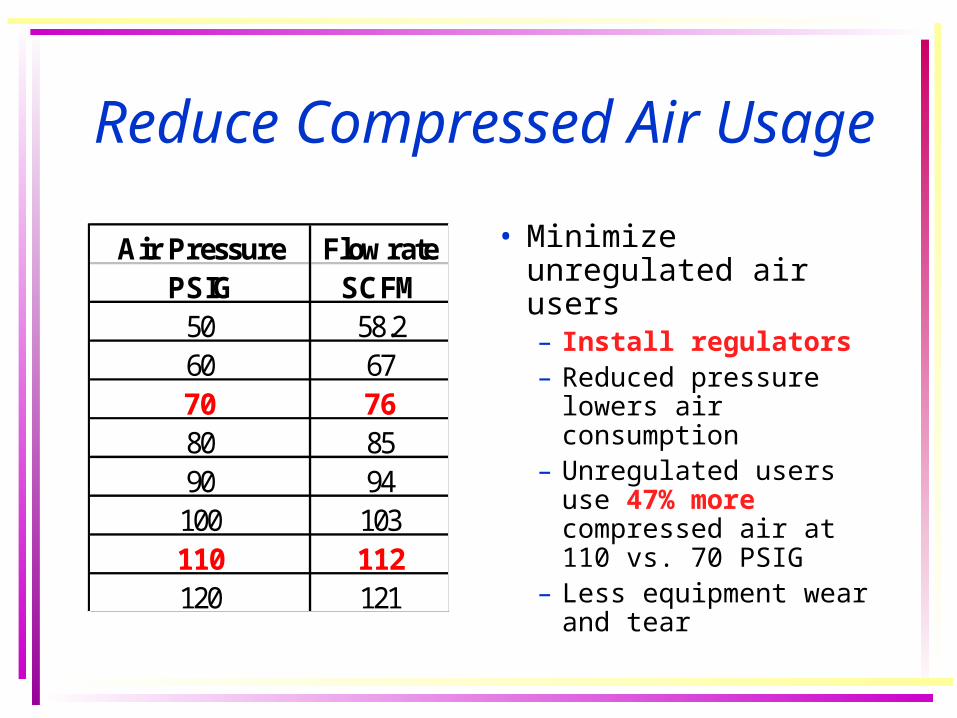
• Minimize unregulated air users– Install regulators– Reduced pressure
lowers air consumption– Unregulated users use
47% more compressed air at 110 vs. 70 PSIG
– Less equipment wear and tear
Air Pressure Flow ratePSIG SCFM
50 58.260 6770 7680 8590 94100 103110 112120 121
Reduce Compressed Air Usage
• Shut off air to equipment that is shutdown or abandoned– Install automatic solenoid valves– Valve off idled sections of the plant
Reduce Compressed Air Usage
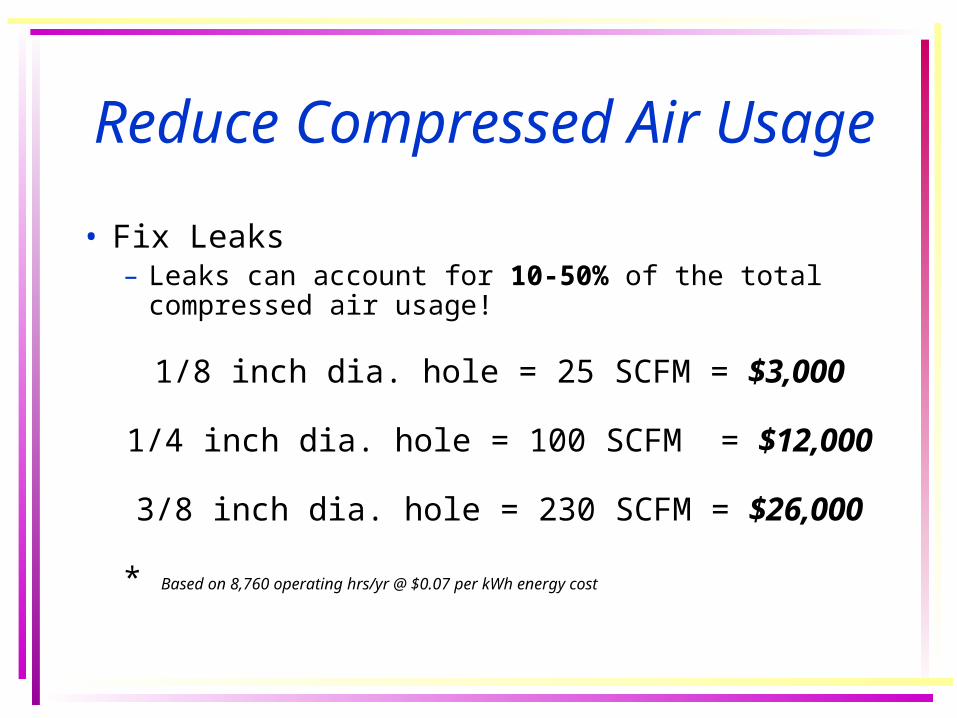
• Fix Leaks– Leaks can account for 10-50% of the total compressed
air usage!
1/8 inch dia. hole = 25 SCFM = $3,000
1/4 inch dia. hole = 100 SCFM = $12,000
3/8 inch dia. hole = 230 SCFM = $26,000
* Based on 8,760 operating hrs/yr @ $0.07 per kWh energy cost
Reduce Compressed Air Usage
• Minimize Leaks– Measure leak load to quantify the opportunity– Find the leaks with an ultrasonic leak detector– Tag the leaks– Fix the leaks– Re-measure the leak load to quantify the
savings– Develop and on-going leak reduction program
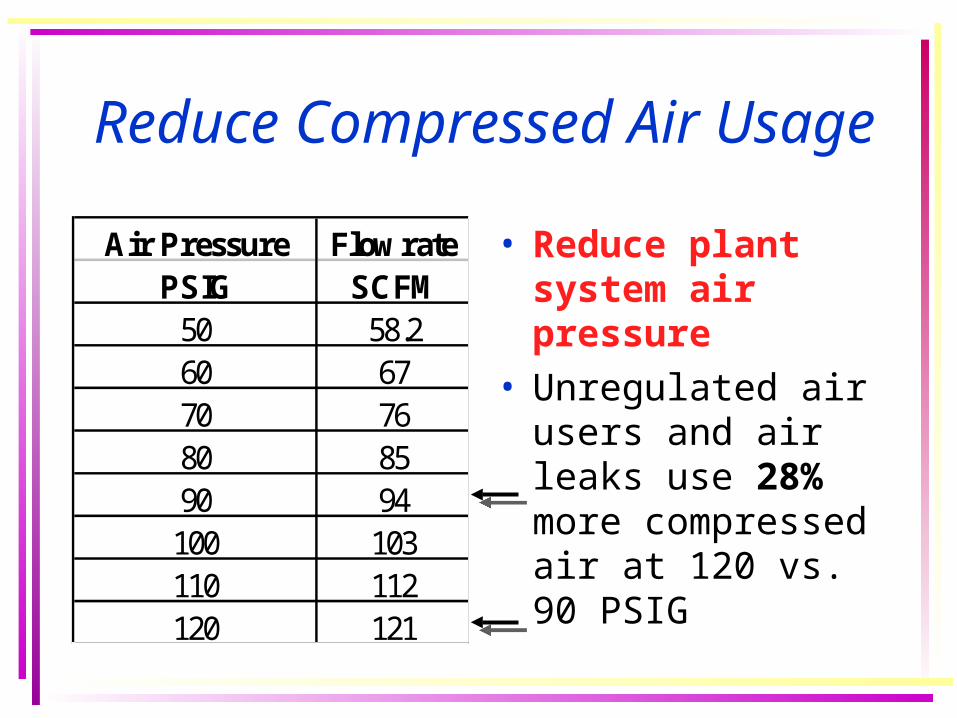
Reduce Compressed Air Usage
• Reduce plant system air pressure
• Unregulated air users and air leaks use 28% more compressed air at 120 vs. 90 PSIG
Air Pressure Flow ratePSIG SCFM
50 58.260 6770 7680 8590 94100 103110 112120 121
Reduce Compressed Air Usage
• Reduce system air pressure– Evaluate the pressure requirements of all
compressed air users– Put the small high pressure user on its’ own
compressor– Install good compressor sequencing controls– Lower the system air pressure
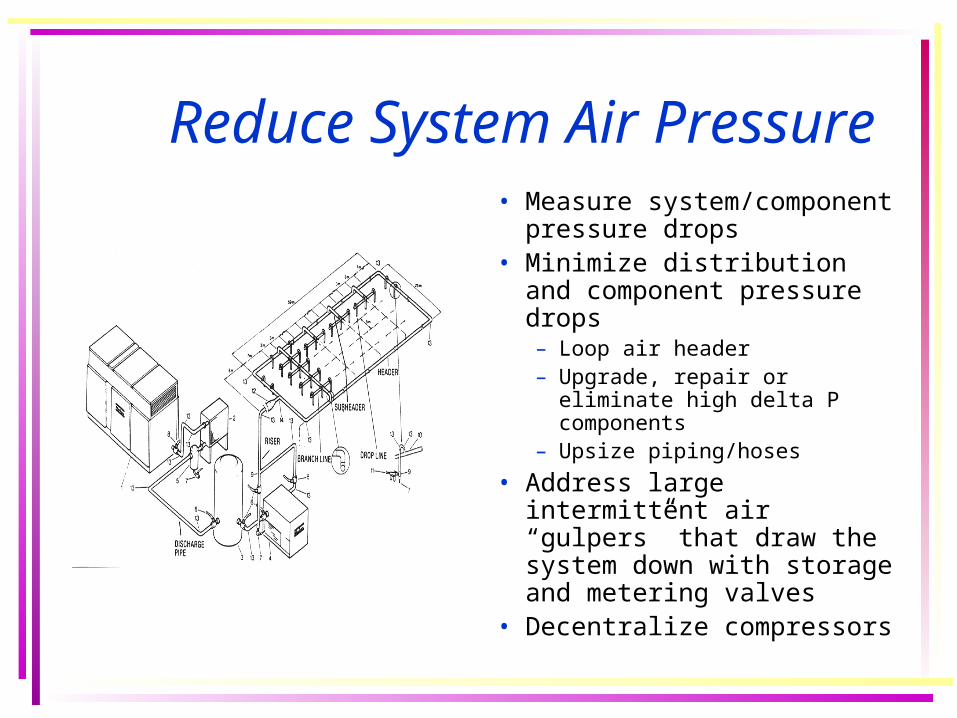
Reduce System Air Pressure• Measure system/component
pressure drops• Minimize distribution and
component pressure drops– Loop air header– Upgrade, repair or eliminate
high delta P components– Upsize piping/hoses
• Address large intermittent air “gulpers” that draw the system down with storage and metering valves
• Decentralize compressors
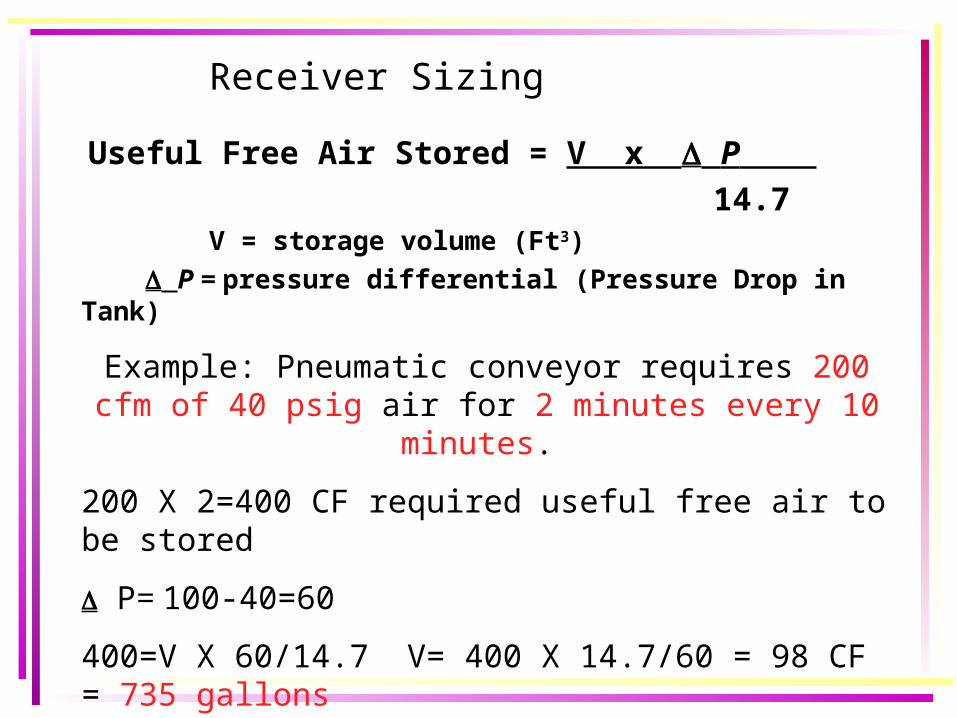
Receiver Sizing
Useful Free Air Stored = V x P
14.7 V = storage volume (Ft3)
P = pressure differential (Pressure Drop in Tank)
Example: Pneumatic conveyor requires 200 cfm of 40 psig air for 2 minutes every 10 minutes.
200 X 2=400 CF required useful free air to be stored
P= 100-40=60
400=V X 60/14.7 V= 400 X 14.7/60 = 98 CF = 735 gallons
400 CF/8 minutes=50 CFM to refill
System sees 50 CFM instead of 200 CFM!
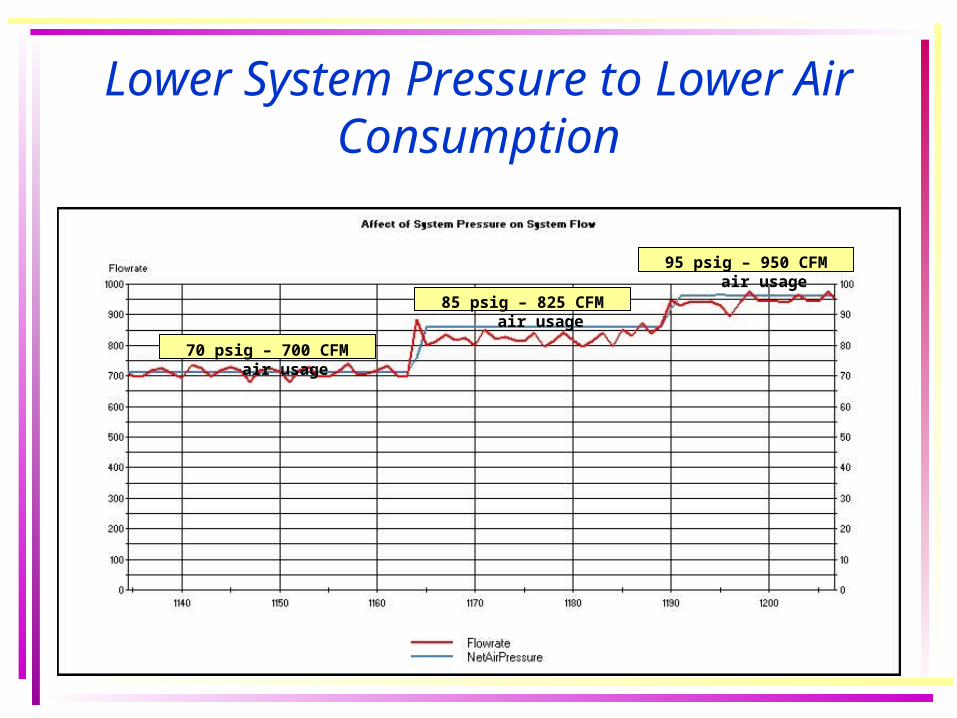
Lower System Pressure to Lower Air Consumption
70 psig – 700 CFM air usage
85 psig – 825 CFM air usage
95 psig – 950 CFM air usage
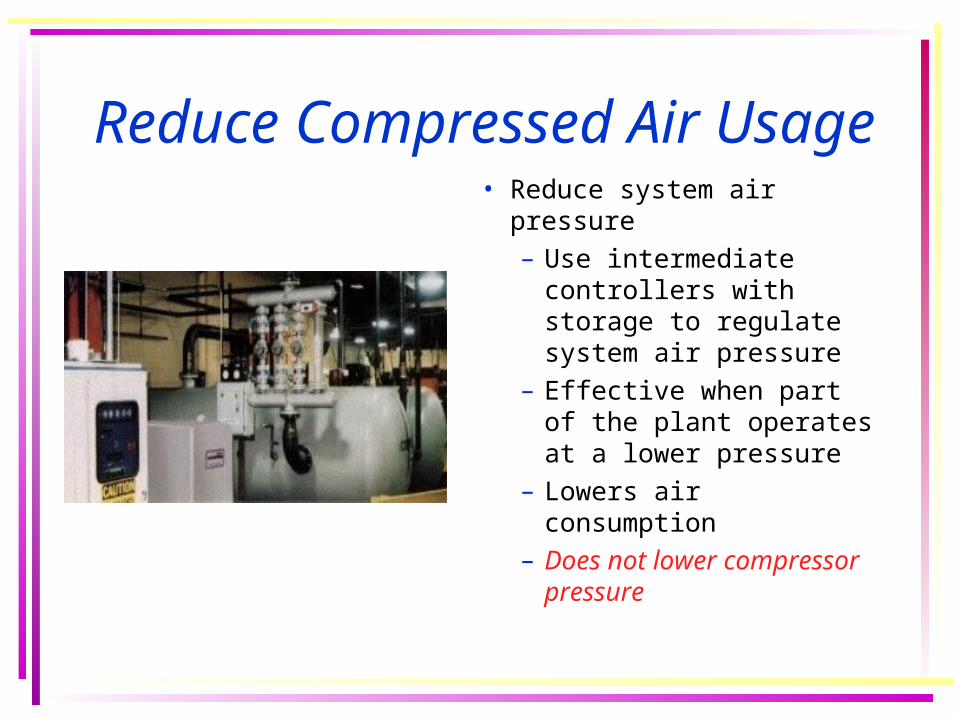
Reduce Compressed Air Usage• Reduce system air pressure
– Use intermediate controllers with storage to regulate system air pressure
– Effective when part of the plant operates at a lower pressure
– Lowers air consumption
– Does not lower compressor pressure
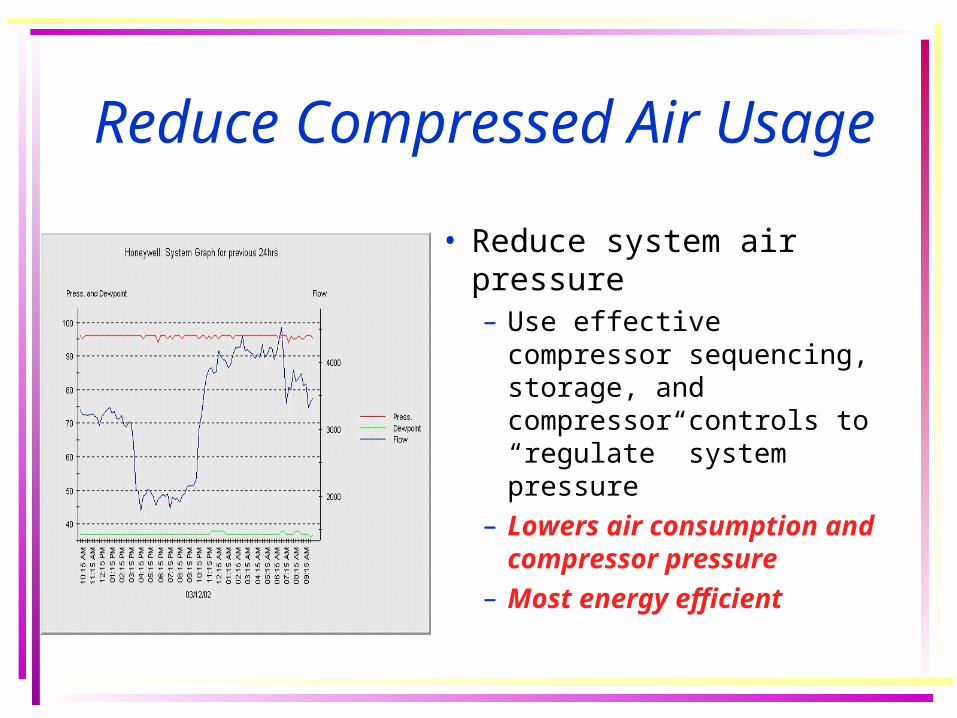
Reduce Compressed Air Usage
• Reduce system air pressure– Use effective compressor
sequencing, storage, and compressor controls to “regulate” system pressure
– Lowers air consumption and compressor pressure
– Most energy efficient
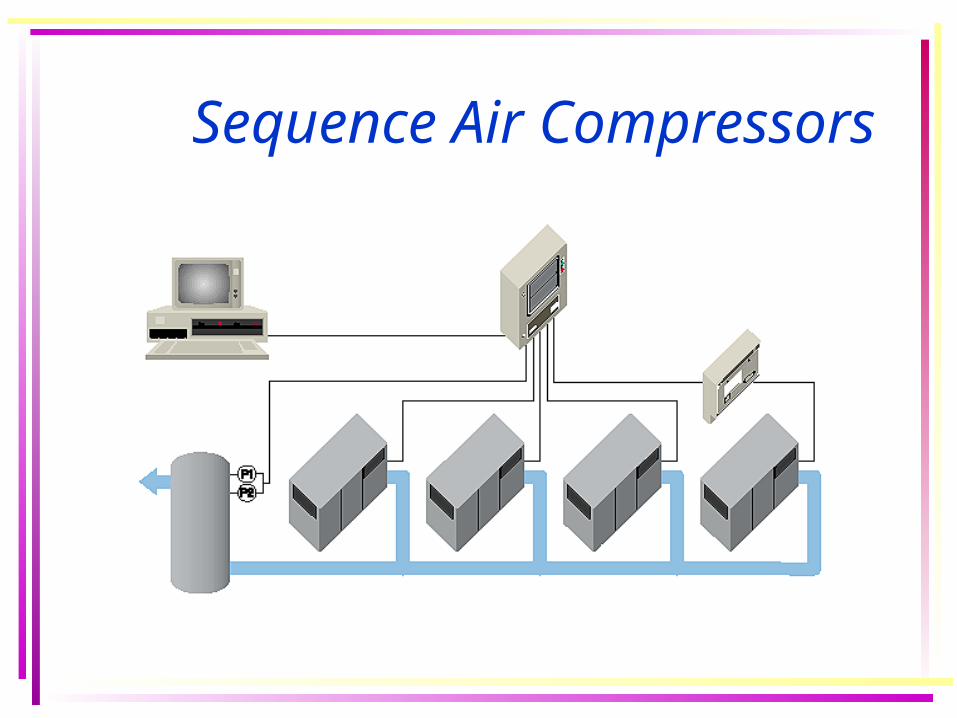
Sequence Air Compressors
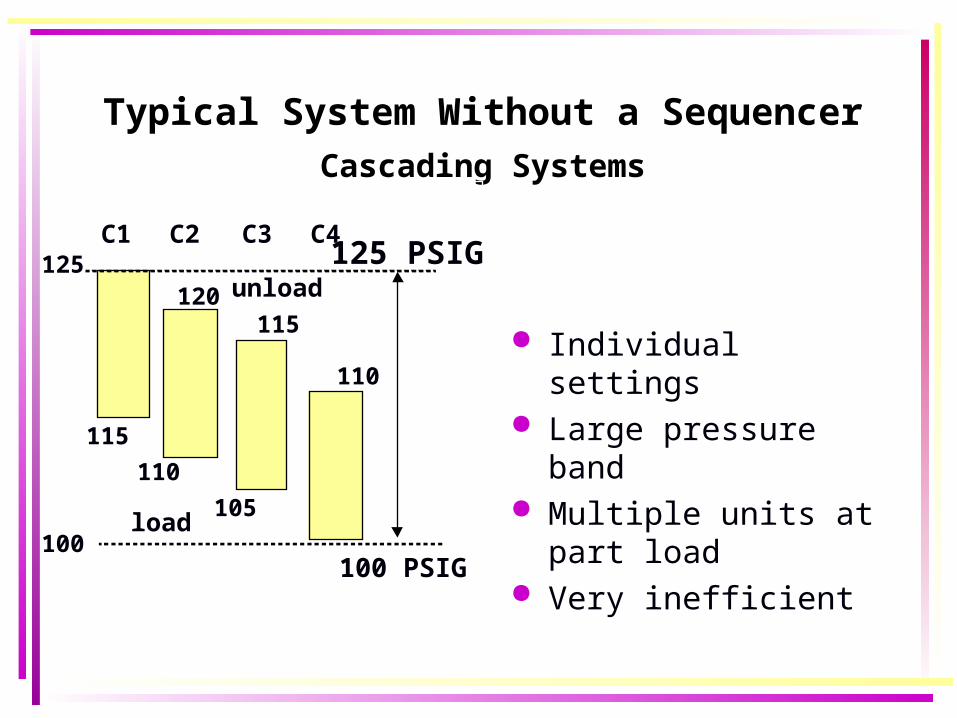
Typical System Without a Sequencer
Cascading Systems
C1 C2 C3 C4
unload
load
Individual settings Large pressure band Multiple units at part load Very inefficient
100 PSIG
110
105
115
110
120
115
125 PSIG125
100
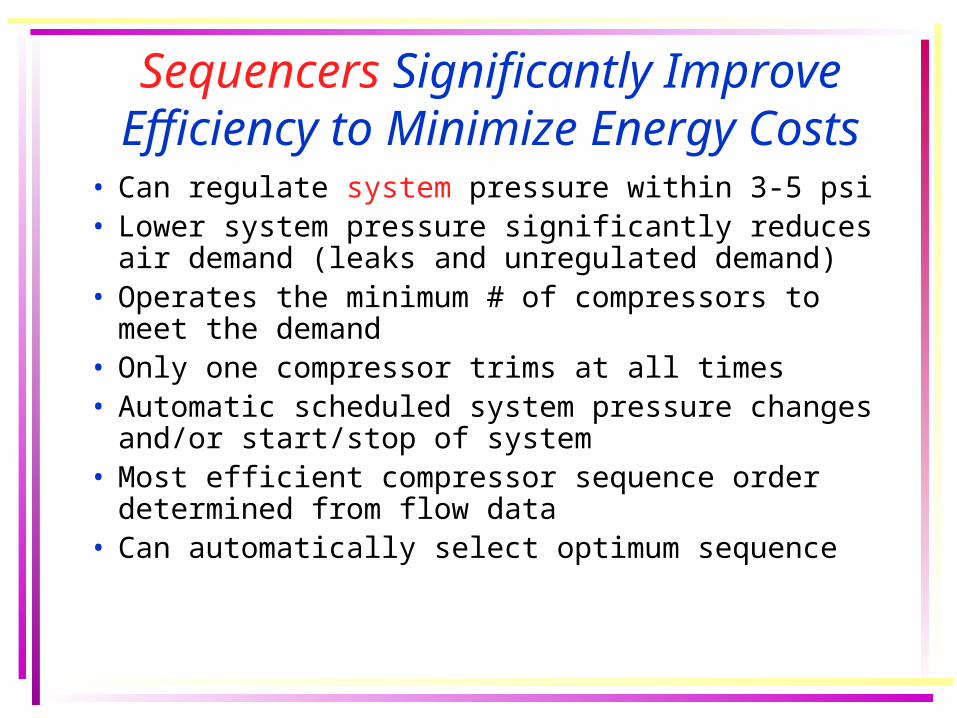
Sequencers Significantly Improve Efficiency to Minimize Energy Costs
• Can regulate system pressure within 3-5 psi• Lower system pressure significantly reduces air
demand (leaks and unregulated demand)• Operates the minimum # of compressors to meet the
demand• Only one compressor trims at all times• Automatic scheduled system pressure changes
and/or start/stop of system • Most efficient compressor sequence order
determined from flow data• Can automatically select optimum sequence
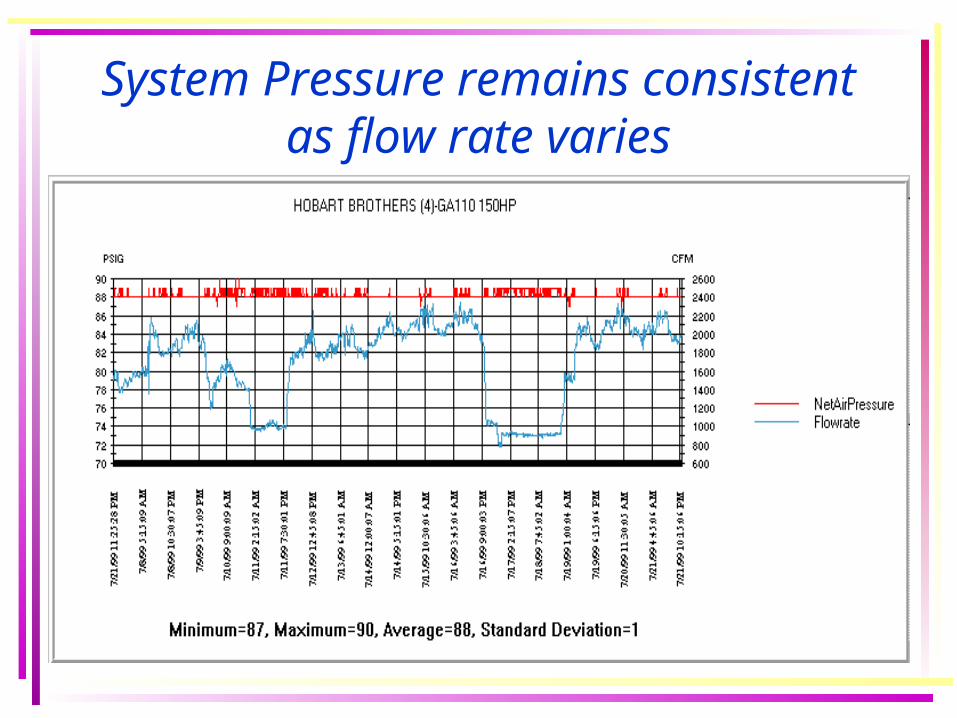
System Pressure remains consistent as flow rate varies
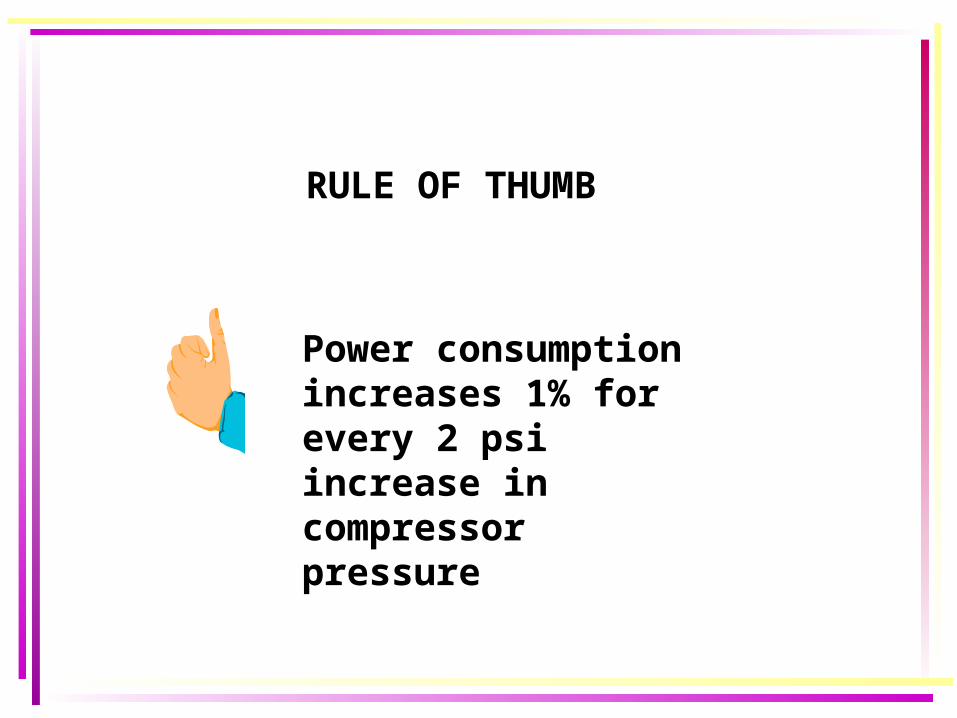
Power consumption increases 1% for every 2 psi increase in compressor pressure
RULE OF THUMB
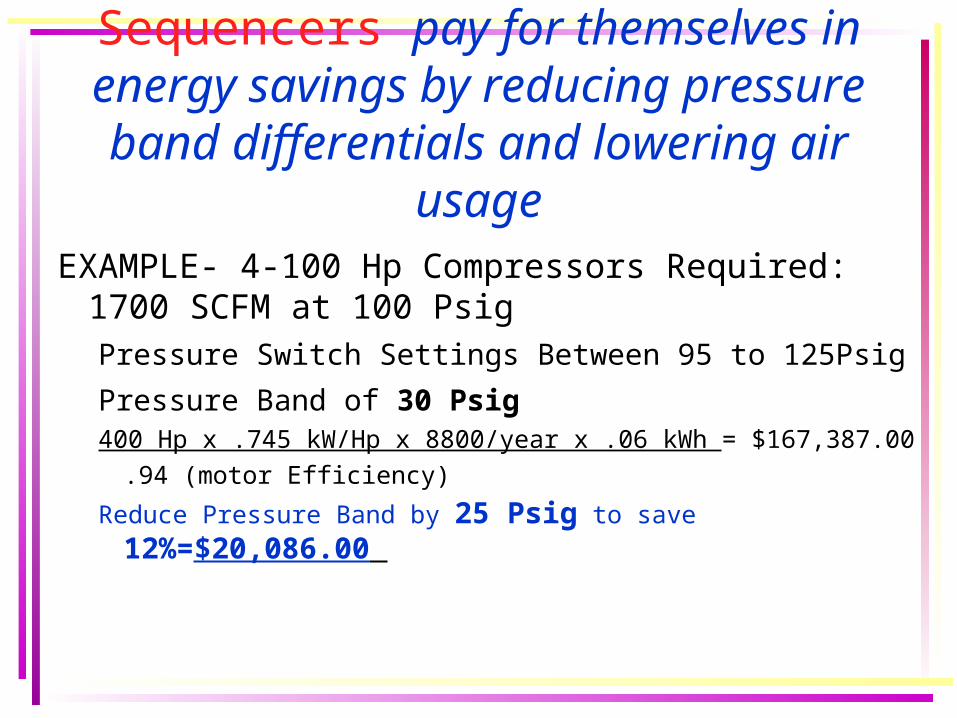
EXAMPLE- 4-100 Hp Compressors Required: 1700 SCFM at 100 Psig Pressure Switch Settings Between 95 to 125Psig
Pressure Band of 30 Psig 400 Hp x .745 kW/Hp x 8800/year x .06 kWh = $167,387.00
.94 (motor Efficiency)
Reduce Pressure Band by 25 Psig to save 12%=$20,086.00
Sequencers pay for themselves in energy savings by reducing pressure band differentials and lowering air usage
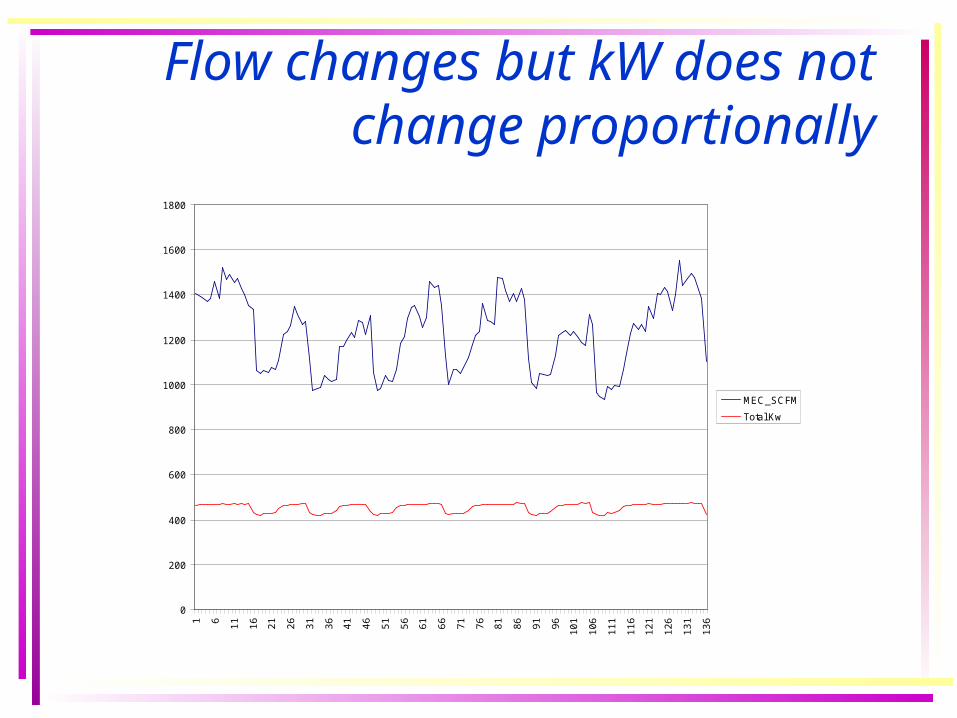
Flow changes but kW does not change proportionally
0
200
400
600
800
1000
1200
1400
1600
18001 6
11
16
21
26
31
36
41
46
51
56
61
66
71
76
81
86
91
96
10
1
10
6
11
1
11
6
12
1
12
6
13
1
13
6
MEC_SCFM
Total Kw
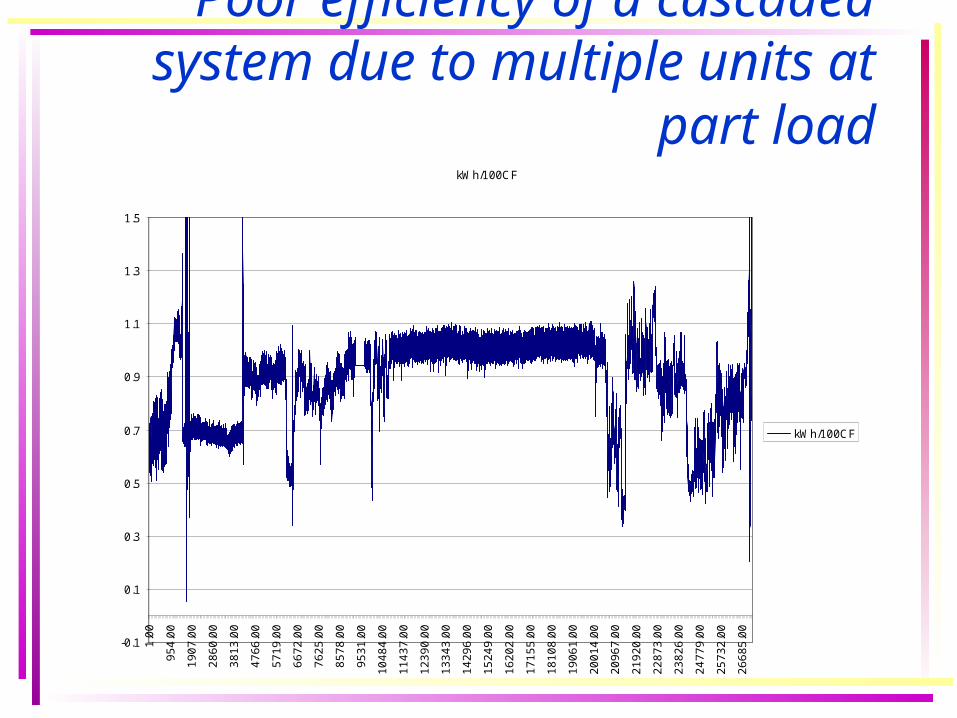
Poor efficiency of a cascaded system due to multiple units at part load
kWh/100CF
-0.1
0.1
0.3
0.5
0.7
0.9
1.1
1.3
1.5
1.0
0
95
4.0
0
19
07
.00
28
60
.00
38
13
.00
47
66
.00
57
19
.00
66
72
.00
76
25
.00
85
78
.00
95
31
.00
10
48
4.0
0
11
43
7.0
0
12
39
0.0
0
13
34
3.0
0
14
29
6.0
0
15
24
9.0
0
16
20
2.0
0
17
15
5.0
0
18
10
8.0
0
19
06
1.0
0
20
01
4.0
0
20
96
7.0
0
21
92
0.0
0
22
87
3.0
0
23
82
6.0
0
24
77
9.0
0
25
73
2.0
0
26
68
5.0
0
kWh/100CF
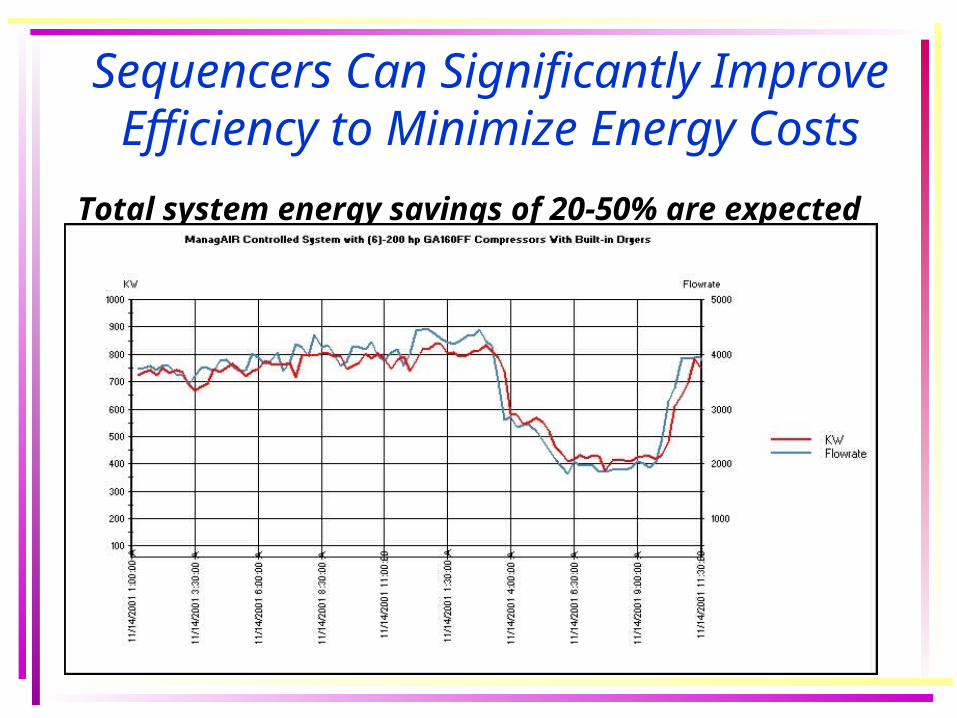
Sequencers Can Significantly Improve Efficiency to Minimize Energy Costs
Total system energy savings of 20-50% are expected
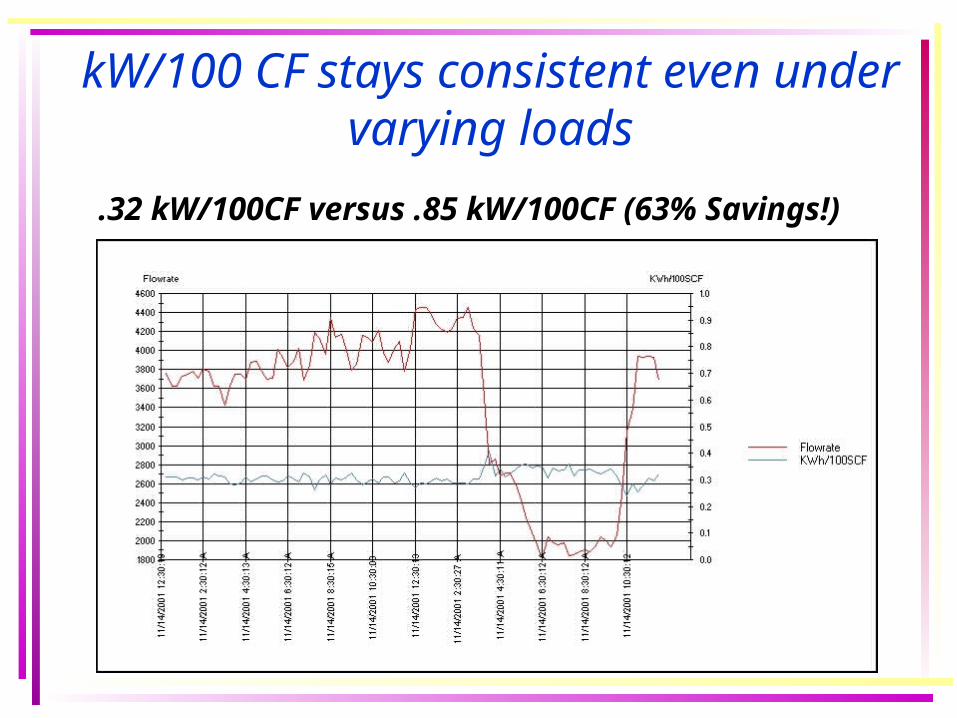
kW/100 CF stays consistent even under varying loads
.32 kW/100CF versus .85 kW/100CF (63% Savings!)
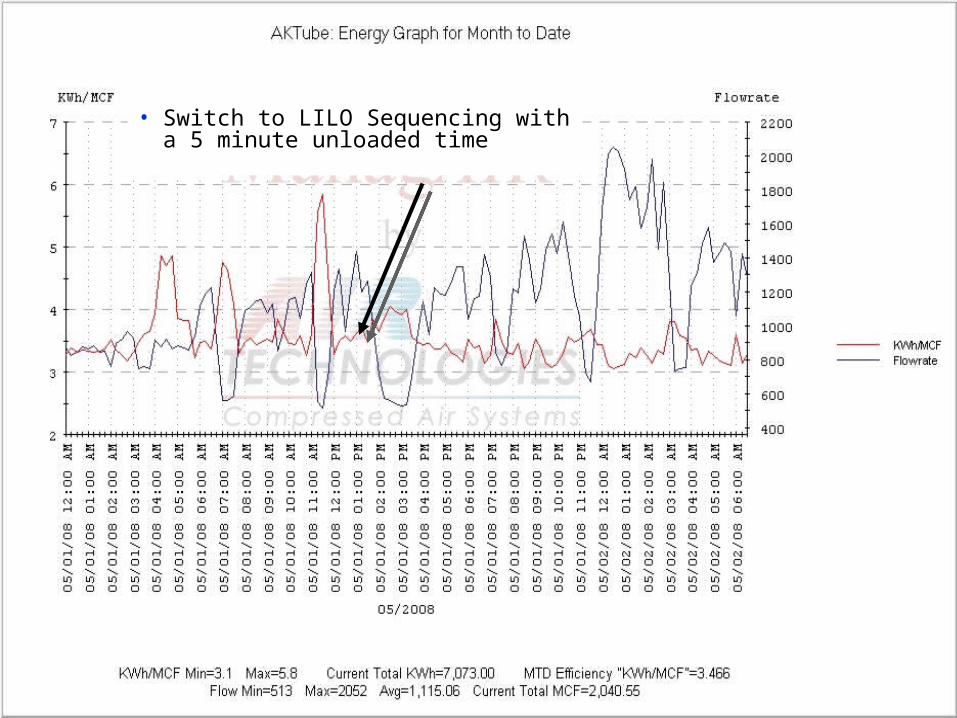
• Switch to LILO Sequencing with a 5 minute unloaded time
Total Anual Savings!
$15,347
$30,695
$122,778
$61,389
$0
$20,000
$40,000
$60,000
$80,000
$100,000
$120,000
$140,000
100 200 400 800
Total System Horsepower
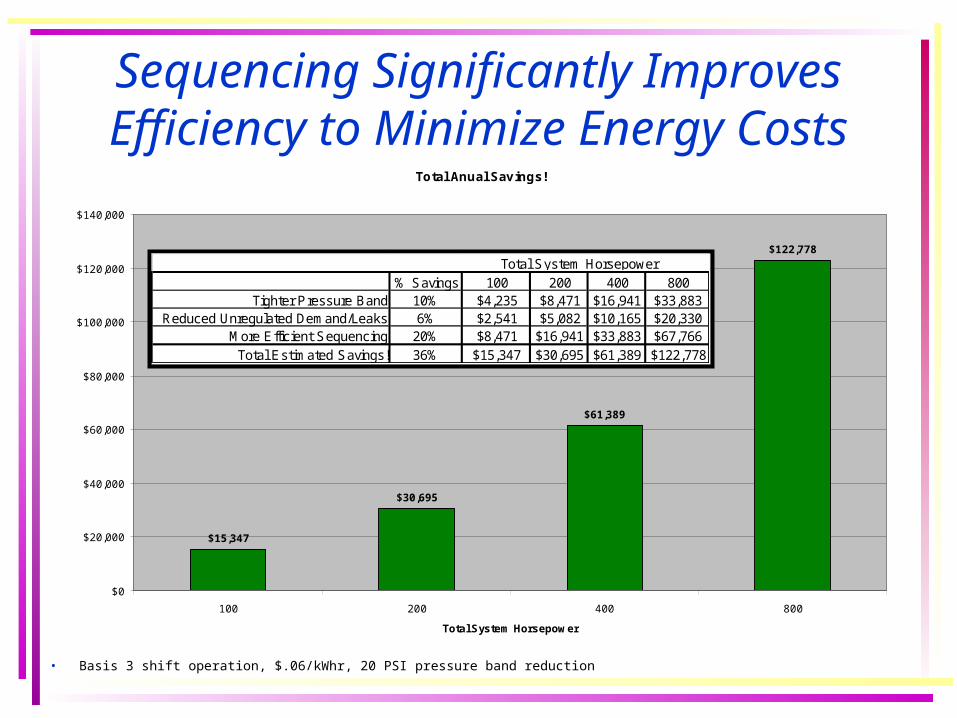
Sequencing Significantly Improves Efficiency to Minimize Energy Costs
• Basis 3 shift operation, $.06/kWhr, 20 PSI pressure band reduction
% Savings 100 200 400 800Tighter Pressure Band 10% $4,235 $8,471 $16,941 $33,883
Reduced Unregulated Demand/Leaks 6% $2,541 $5,082 $10,165 $20,330More Efficient Sequencing 20% $8,471 $16,941 $33,883 $67,766
Total Estimated Savings! 36% $15,347 $30,695 $61,389 $122,778
Total System Horsepower
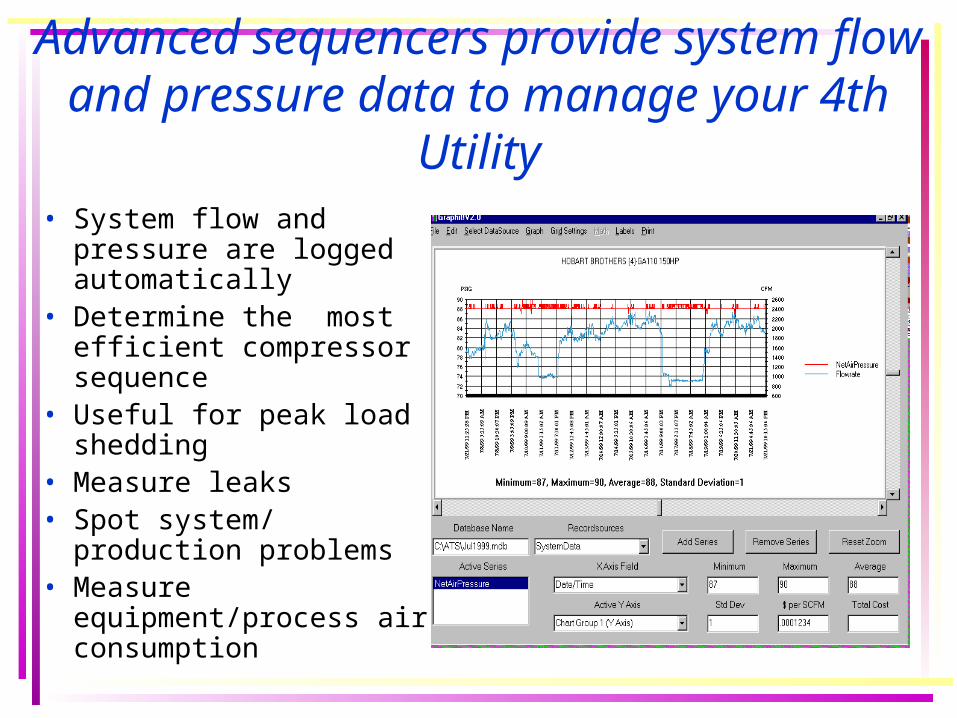
• System flow and pressure are logged automatically
• Determine the most efficient compressor sequence
• Useful for peak load shedding
• Measure leaks • Spot system/ production
problems • Measure equipment/process
air consumption
Advanced sequencers provide system flow and pressure data to manage your 4th Utility
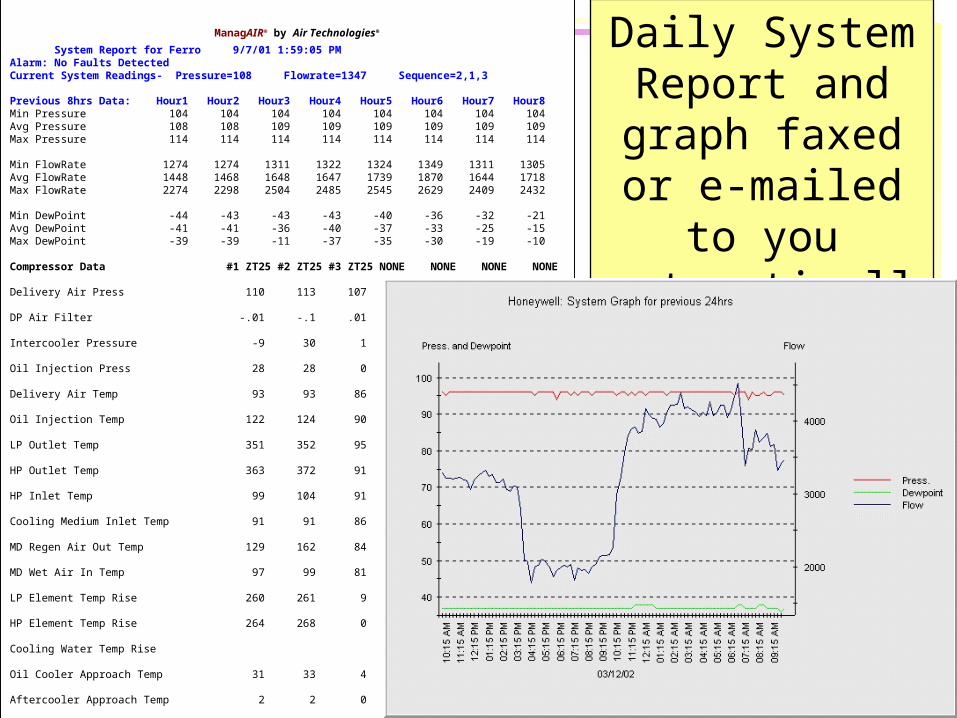
ManagAIR® by Air Technologies®
System Report for Ferro 9/7/01 1:59:05 PMAlarm: No Faults DetectedCurrent System Readings- Pressure=108 Flowrate=1347 Sequence=2,1,3
Previous 8hrs Data: Hour1 Hour2 Hour3 Hour4 Hour5 Hour6 Hour7 Hour8 Min Pressure 104 104 104 104 104 104 104 104Avg Pressure 108 108 109 109 109 109 109 109Max Pressure 114 114 114 114 114 114 114 114
Min FlowRate 1274 1274 1311 1322 1324 1349 1311 1305Avg FlowRate 1448 1468 1648 1647 1739 1870 1644 1718Max FlowRate 2274 2298 2504 2485 2545 2629 2409 2432
Min DewPoint -44 -43 -43 -43 -40 -36 -32 -21Avg DewPoint -41 -41 -36 -40 -37 -33 -25 -15Max DewPoint -39 -39 -11 -37 -35 -30 -19 -10
Compressor Data #1 ZT25 #2 ZT25 #3 ZT25 NONE NONE NONE NONE Delivery Air Press 110 113 107 DP Air Filter -.01 -.1 .01 Intercooler Pressure -9 30 1 Oil Injection Press 28 28 0 Delivery Air Temp 93 93 86 Oil Injection Temp 122 124 90 LP Outlet Temp 351 352 95 HP Outlet Temp 363 372 91 HP Inlet Temp 99 104 91 Cooling Medium Inlet Temp 91 91 86 MD Regen Air Out Temp 129 162 84 MD Wet Air In Temp 97 99 81 LP Element Temp Rise 260 261 9 HP Element Temp Rise 264 268 0 Cooling Water Temp Rise Oil Cooler Approach Temp 31 33 4 Aftercooler Approach Temp 2 2 0 Intercooler Approach Temp 8 13 5 MD Regen Temperature Drop 234 210 7 MD Inlet Temperature Diff 4 6 -5 Loaded Hours 7358 7579 8773 Running Hours 11048 11616 12606 Compressor Status UNLOADED LOADED STOPPED Motor Starts 1717 1042 1060 Link Type MKIII MKIII MKIII Isolated/Integrated CENTRAL CENTRAL CENTRAL Full Feature Dew Point Oil Filter Remaining Lifetime 2423 1413 952 Oil Filter Total Lifetime 4000 4000 4000 Oil Remaining Lifetime 4952 4383 3475 Oil Total Lifetime 16000 16000 16000 Hours Until Regrease Bearings 848 286 3471 Hours Between Bearing Regreasing 4000 4000 4000
Daily System Report and graph faxed or e-mailed
to you automatically
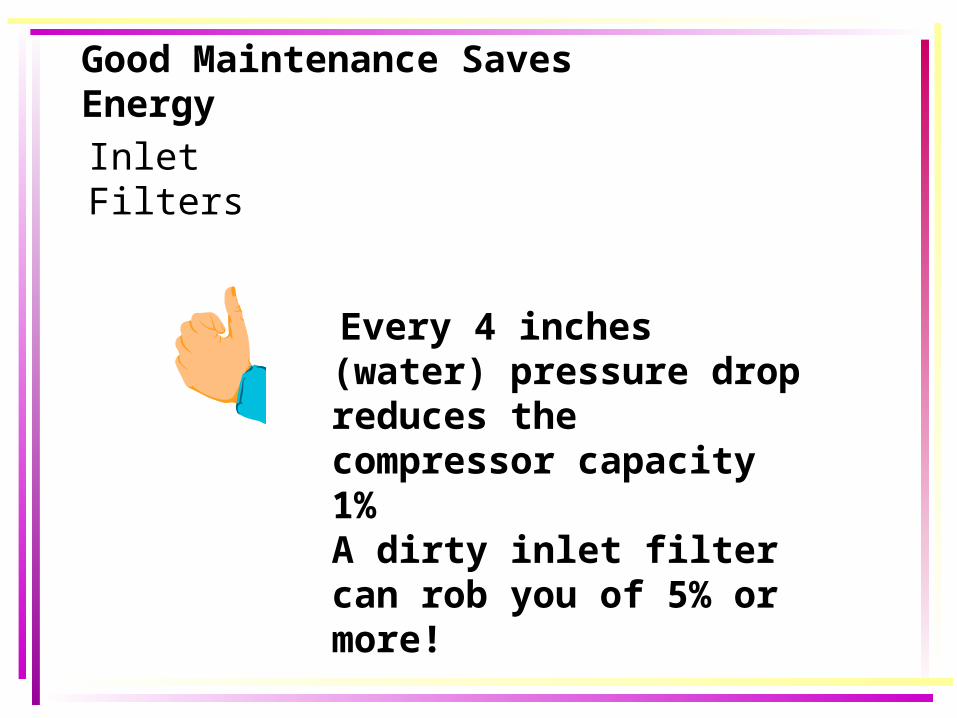
Inlet Filters
Every 4 inches (water) pressure drop reduces the compressor capacity 1%A dirty inlet filter can rob you of 5% or more!
Good Maintenance Saves Energy
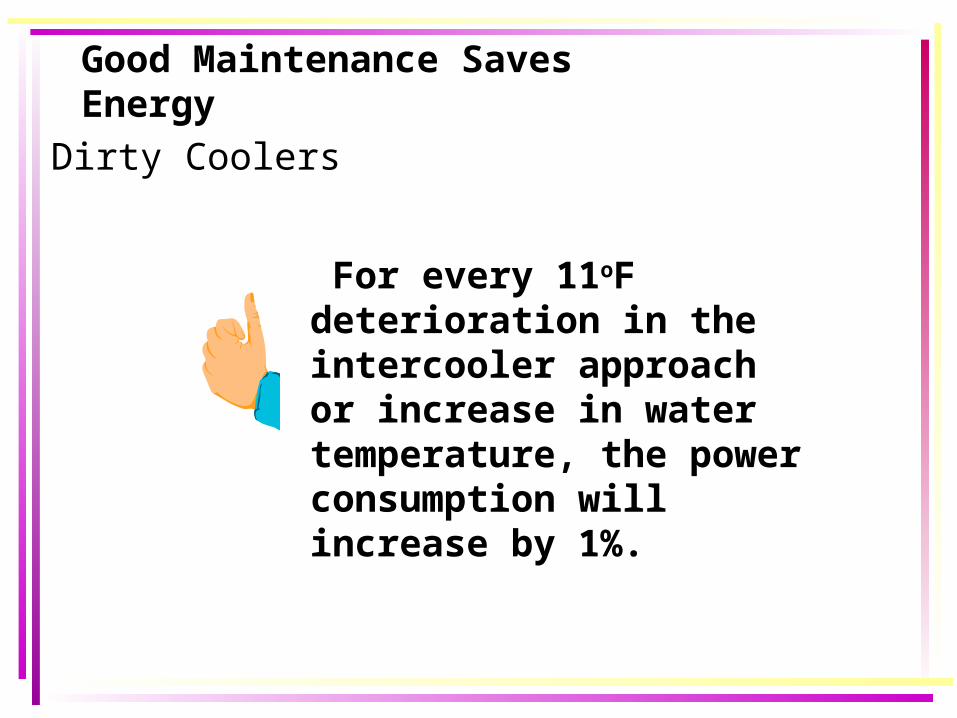
Dirty Coolers
For every 11oF deterioration in the intercooler approach or increase in water temperature, the power consumption will increase by 1%.
Good Maintenance Saves Energy
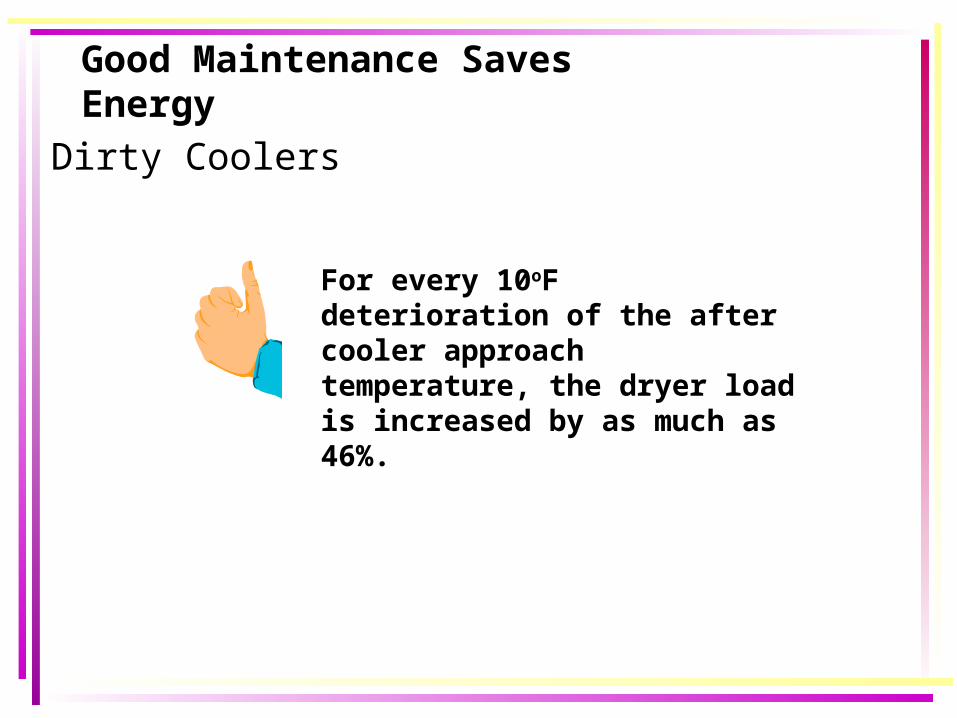
For every 10oF deterioration of the after cooler approach temperature, the dryer load is increased by as much as 46%.
Dirty Coolers
Good Maintenance Saves Energy
A dirty oil separator can increase your HP 5%
Dirty Oil Separator
Good Maintenance Saves Energy

Energy Reduction Opportunities
• Use Efficient Compressor Controls
• Reduce Compressed Air Usage
• Lower Compressor Discharge Pressure
• Efficiently Sequence Air Compressors
• Operate and Maintain Compressed Air Equipment at Peak Efficiency

Lowering Your Compressed Air Energy Costs
Trey DonzeMike Hotz
Air Technologies513-539-6747