lseg investor presentation (for pf) · c.4,000 employees based in 18 countries, ... 16% 2009-2016...
TRANSCRIPT

Investor Update 12 June 2017
Page 1

Welcome Xavier Rolet Group CEO
Page 2

London Stock Exchange Group Page 3
Topic Presenter Title
Welcome
Strategy Overview Xavier Rolet CEO, LSEG
Information Services
Mark Makepeace
Caroline O’Shaughnessy
Waqas Samad
Group Director of Information Services, LSEG and CEO, FTSE Russell
Global Head, Sales & Marketing
CEO, Benchmarks, Fixed Income and Multi Assets
Capital Markets Raffaele Jerusalmi
Michael Davie
Group Director of Capital Markets, LSEG and CEO, Borsa Italiana
Head of Rates, LSEG and Chairman, CurveGlobal
Break
LCH
Suneel Bakhshi
Daniel Maguire
Paddy Boyle
Bruce Kellaway
CEO, LCH Group
COO, LCH Group and Global Head of Rates & FX Derivatives
Global Head of ForexClear
Global Head of RepoClear, EquityClear & Collateral
COO/CIO Chris Corrado COO/CIO, LSEG
Capital Management /
Financial track record David Warren CFO, LSEG
Q&A Moderated by Paul Froud Head of Investor Relations, LSEG
Agenda

What you’ll hear today
London Stock Exchange Group Page 4
Group strategy
working well Diversified range of businesses positions us well to meet an evolving macroeconomic and
political landscape
Information Services Further growth to come from FTSE Russell – The Yield Book and Mergent provide new
opportunities to expand products, sales and efficiency
Capital Markets Working with clients to offer new services – CurveGlobal, ELITE, Turquoise Plato
LCH OTC growth to continue and further efficiency savings to drive significant improvement in
EBITDA margin
Technology Group scale and resources to support business growth and efficiencies
Strong financial
position Revenue growth and cost control – operating leverage and improved operating margins for
increased shareholder returns

Page 5
Diversified, resilient and international markets infrastructure business
Unique Open Access model, working in close partnership with customers
London Stock Exchange Group
Intellectual Property Indexes, Data and Technology
Capital Formation Primary and Secondary markets
Risk and Balance sheet
management
Clearing, Settlement and
CSD services
Successful strategy executed across three key areas

SEDOL
Real Time Data
Page 6
An interconnected business
Selected LSEG business lines and areas of focus
(1) Post completion of Citi Fixed Income Indices and The Yield Book
UnaVista
RNS
CC&G
London Stock Exchange Group
Monte Titoli

c.4,000 employees based in 18 countries, delivering services worldwide
115 Issuers on
London Stock
Exchange
operate in c.115
different
countries
#1 OTC Clearer Over $665tr
cleared in 2016,
representing
90%+ of the
global market
40 MillenniumIT technology
deployed in more than 40
venues around the world
$15tr FTSE Russell
largest global
index provider
with c.$15tr in
benchmarked
AUM(1)
800+ Companies,
advisers and
investors from 26
countries part of
innovative ELITE
community
1500+ Firms around the world using
UnaVista to meet regulatory
reporting needs
London Stock Exchange Group
(1) Post completion of Citi Fixed Income Indices and The Yield Book LSEG offices
Page 7
Proven strategy with increasing scale

671.4 628.3
674.9
814.8 852.9
1213.1
1418.6
1657.1
FY2009 FY2010 FY2011 FY2012 FY2013 FY2014 CY2015 CY2016
London Stock Exchange Group Page 8
6% Technology
Services &
Other
36% Post Trade
Services
22% Capital
Markets
36% Information
Services
14%
2009–2016 Income CAGR 2016 Income by Segment
Long term growth diversification by business activity
Continuing operations only

Diversification by both income and expenses across GBP, EUR and USD
London Stock Exchange Group Page 9
Continuing operations only, expenses include cost of sales
2016 Income
Diversified by currency
20% USD
40% GBP
35% EUR
5% Other
£1,657.1m
2016 Expenses
11% USD
54% GBP
28% EUR
7% Other
£966.4m

207.5 169.3 171.8 218.9 306.3 348.7
517.4 594.7
FY2009 FY2010 FY2011 FY2012 FY2013 FY2014 CY2015 CY2016
263 302.1
356.5
FY2014 CY2015 CY2016
London Stock Exchange Group Page 10
Growth in Information
Services driven by greater use
of benchmarks, indexes, data
and analytics, smart beta, ETFs,
fixed income indexes and
new products and geographies
Growth in LCH driven by further
OTC clearing and new services
Regulatory landscape –
provides opportunities, e.g.
EMIR and MiFID II
16% 2014-2016
Revenue
CAGR
16% 2009-2016
Revenue
CAGR
Strong growth across both ISD and LCH
Continuing operations only

— MiFID II implementation from January 2018
— MiFID II mandates Open Access across financial markets infrastructure
— Will promote greater competition, transparency and innovation through unbundling of
services and fees
— Transparency and consumer choice will create deeper pools of liquidity, reduce costs
and lead to better risk management
— LSEG well positioned with both Open Access and customer partnership at the core of
our business model and proven track record (LCH, CurveGlobal, Turquoise, MTS)
— Our Open Access business model is MiFID II ready
London Stock Exchange Group Page 11
MiFID II opportunities
Our clients have absolute choice across our value chain - fundamentally different
approach to peers

London Stock Exchange Group Page 12
SwapClear directly licensed to clear in many
jurisdictions including: EU, UK, US, Australia,
Canada, Japan, Hong Kong and Switzerland
SwapClear is a global service SwapClear – clearing volumes (May 2017)
18 International
currencies are
cleared
55 Clients from 55
countries
Euro-denominated IRS clearing
60% USD
12% GBP, CAD,
Asian & Other
European
7% EUR EU
originated
21% EUR non-EU
originated

Page 13
LSEG operates authorised clearing houses in the UK, US and
Eurozone with global and domestic licences, operating within and
across multiple jurisdictions around the world
— All CCPs EMIR authorised or equivalent
— LCH in London, New York and Paris are
DCO authorised and supervised by CFTC
— LCH is only European-based CCP
qualified to clear FCM market in US
— LCH clears listed and OTC products
— CC&G clears fixed income, repos,
equities and derivatives
London Stock Exchange Group
We are well positioned to
serve our clients,
wherever our clients
choose to clear
LSEG well positioned Operating clearing houses in multiple jurisdictions

FTSE Russell Double-digit growth to continue 2017-2019
Sustainable and attractive margins over the same period
LCH OTC revenue growth to continue at double-digit 2017-2019
Accelerating EBITDA margin growth - approaching 50% by 2019
(2016: 35.6%)
LSEG Operating expenses held at c.4% p.a. 2017-2019 increase while
Group continues to deliver revenue growth and improved margins
Next phase cost saves of £50m p.a. by exit 2019
EBITDA margin of c.55% by 2019 (2016: 46.5%)
London Stock Exchange Group Page 14
Further growth and enhanced returns
Increasing operating leverage - increasing operating margin

Information Services
Division
Mark Makepeace Group Director of Information Services
CEO, FTSE Russell
Page 15

Technology
Info Services
Capital Markets
Group
Post Trade
FTSE Russell
Agenda
Page 16
Information Services Division (ISD) Overview
Mark Makepeace, Group Director of Information Services and
CEO, FTSE Russell
Index Growth and Future Opportunities
Caroline O’Shaughnessy, Global Head of Sales & Marketing
Fixed Income Opportunities, The Yield Book & Citi Indexes
Waqas Samad, CEO Benchmarks, Fixed Income and Multi-Assets
Summary
Mark Makepeace
London Stock Exchange Group

Technology
Info Services
Capital Markets
Group
Post Trade
FTSE Russell
Page 17
134 174 197
349 409
97 91 84
82
91
75 84 83
86
95
FY 2013 (March 13year end)
FY 2014 (March 14year end)
CY 2014 CY 2015 CY 2016
Other
Real TimeData
FTSERussell
Double-digit growth Sustainable margins
Source: LSEG Annual Reports FY2013-2016. Total may not sum due to rounding
Acquisition of Russell
Indexes (Dec 2014)
£349m £306m
£364m
£595m
£517m
£1,657m
£595m Information
services
£447m LCH
£368m Capital Markets
£146m CC&G &
Monte Titoli
£88m Technology
£12m Other
CAGR of 18% Information Services revenue
CAGR of 18% from FY2013-2016
Organic & inorganic Combination of organic &
inorganic growth drivers
Growth in Information Services revenue
London Stock Exchange Group
Technology
Info Services
Capital Markets
Group
Post Trade
FTSE Russell
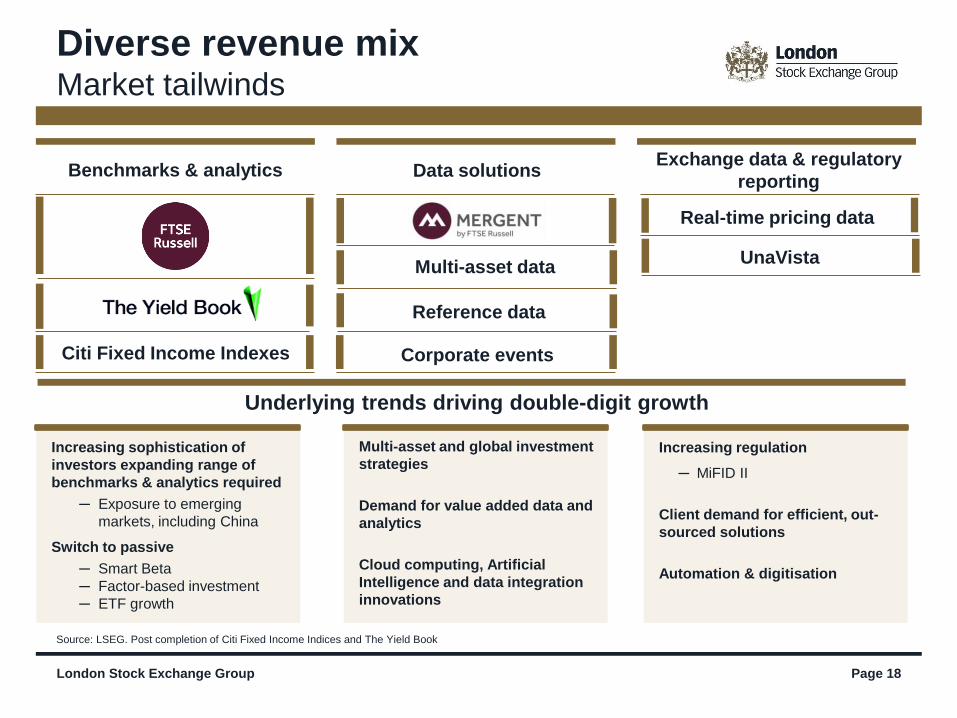
Diverse revenue mix Market tailwinds
Page 18
Benchmarks & analytics Exchange data & regulatory
reporting Data solutions
Real-time pricing data
Reference data
Underlying trends driving double-digit growth
UnaVista
Increasing sophistication of
investors expanding range of
benchmarks & analytics required
─ Exposure to emerging
markets, including China
Switch to passive
─ Smart Beta
─ Factor-based investment
─ ETF growth
Multi-asset and global investment
strategies
Demand for value added data and
analytics
Cloud computing, Artificial
Intelligence and data integration
innovations
Increasing regulation
─ MiFID II
Client demand for efficient, out-
sourced solutions
Automation & digitisation
Corporate events Citi Fixed Income Indexes
Multi-asset data
Source: LSEG. Post completion of Citi Fixed Income Indices and The Yield Book
London Stock Exchange Group

Technology
Info Services
Capital Markets
Group
Post Trade
FTSE Russell
Page 19
Sources: (1) Pro-forma FTSE Russell and The Yield Book, Dec 2016; (2) MSCI, 2016; (3) S&P, 2015 (latest published); (4) eVestment; Morningstar.
Total By client segment4
FTSE Russell
MSCI
S&P Dow Jones
~ $15tr Total assets
benchmarked1
~ $11tr Total assets
benchmarked2
~ $7.5 tr Total assets
benchmarked
to S&P 5003
20% Fixed Income
80% Equity
94% Equity
6% Other
100% Equity
45% Other
55% Institutional
47% Other
53% Institutional
63% Other
37% Institutional
By asset class4 By investment strategy4
79% Active
21% Passive
85% Active
15% Passive
70% Active
30% Passive
London Stock Exchange Group
Index business has global scale Broad & deep opportunity set

Technology
Info Services
Capital Markets
Group
Post Trade
FTSE Russell
FTSE Russell & The Yield Book The largest multi-asset index company globally
Page 20
Strategic Rationale
— Establishes FTSE Russell as
global leader in fixed income
index and analytics and multi-
asset capabilities
— Targeted business expansion
with addition of over 300
institutional client
relationships
— Significant operational
expansion in US and Asia
Consideration
$685m Implied EV / 2016 EBITDA
multiple of 14.9x
Synergies
$30m 3 year revenue synergies
$18m 3 year cost synergies
EPS accretive in year 1
Products
— Comprehensive global fixed
income analytics and indexes
— The World Government Bond
Index (WGBI) is among the
most widely followed globally
— Sophisticated modelling and
analytics capabilities of The
Yield Book widely used by fixed
income investors
Source: RNS, “LSEG to acquire The Yield Book and Citi Fixed Income Indices”, 30/05/2017. (1) Based on a pro forma estimate of the central costs to be allocated to the
Business under LSEG ownership
$15tr
FTSE Russell & The
Yield Book combined
AUM
20% Fixed Income
80% Equity
$107m
2016 revenue
$46m
2016 EBITDA1
for the Yield Book and Citi Indexes
London Stock Exchange Group

Technology
Info Services
Capital Markets
Group
Post Trade
FTSE Russell
Mergent allows creation of new products for index clients and provides
scalable data operations at low cost
Page 21
Source: FTSE Russell, 2017.
Creation of complementary data products for index users from higher
quality data sets and long-dated histories
Scalable & low-cost operations in US and Asia
Multi-asset content and product for index and analytics business
Flexibility in data use for new products through IP ownership
FTSE Russell & Mergent New index products & scalable data operations
London Stock Exchange Group

Index Growth, Clients and
Products
Caroline O’Shaughnessy Global Head of Sales & Marketing
Page 22

Technology
Info Services
Capital Markets
Group
Post Trade
FTSE Russell
Page 23
Core client base driving growth Global adoption of products & network effect
Global
relationships
Diverse
product
range
Core index
─ Cap-weighted
─ Smart beta / Factors
─ Custom
Multi-asset
─ Equity
─ Fixed Income
─ Real Estate
Global
─ Developed & emerging markets
─ China
─ Futures & options:
CME, CBOE, ICE and SGX
─ Exchange partnerships:
JSE, TSEC, Bursa Malaysia
Embedded
in the entire
investment
process
Sources: LSEG Annual Report 2016, eVestment, Morningstar, FTSE Russell
investment
banks
Top 10 top asset managers
97 / 100 of the largest US
plan sponsors
48 / 50
~$15tr
Active & passive assets
benchmarked
~$500bn ETF assets
~$3tr Global passive assets
#1 US equity
institutional assets
benchmarked
#1 UK equity mutual funds
benchmarked
#1 Indexer for China
A shares ETFs
#2 US equity ETF
AUM
benchmarked
derivatives contracts
traded on 15 exchanges
globally in 2016
221m
#2 Fixed income institutional
assets benchmarked
globally
London Stock Exchange Group

Technology
Info Services
Capital Markets
Group
Post Trade
FTSE Russell
Page 24
High quality recurring revenue Range of clients & licensing models
2016 Revenue Split1
45% 55%
Asset linked
Clients
Derivatives Exchanges
Stock Exchanges
Investment & Actuarial Consultants
Asset owners
Active Fund Managers
Passive Fund Managers
Investment Bankers & Brokers
FTSE Russell asset linked revenues
Derivatives
Non-ETF
Passive Funds
55% 45%
2014 2015 2016
Subscription
Recurring revenues2
Source: LSEG, 2016. Note: (1) Rounded %; (2) Pro-forma inclusion of Russell Indexes in 2014
ETF
+£21m +£44m
FTSE Russell
revenue:
£409m 2016
London Stock Exchange Group

Technology
Info Services
Capital Markets
Group
Post Trade
FTSE Russell
Smart Beta
Passive and ETF Emerging Markets including China
Ability to commercialise trends Index growth through deep client relationships
Page 25
Source: (1) BlackRock, 2016; (2) eVestment; (3) ETFGI; (4) Morningstar; (5) BCG, Doubling Down on Data; (6) Credit Suisse “Emerging Capital Markets: the road to 2030”;
(7) SGX, December 2016 – Market Statistics
Fixed Income and multi-asset
2016 2020F 2025F
2013 2016
$282bn
$1,000bn
$2,400bn
70m
22m
$2tr+ AUM increase Smart Beta ETF AUM growth to 2025F1
4.5x4 Passive mutual fund AUM grew
18% in 2016, 4.5x faster than
actively managed funds
42%5 Passive forecasted to comprise
42% of cumulative net flows to
2020
.
+47% CAGR FTSE China A50 index futures
volume +47% CAGR since 2013
Global institutional
AUM by asset class2
Global ETP AUM by
asset class3
China A50 futures contracts traded7
18% Fixed income
75% Equity
7% Other
42% Fixed income
54% Equity
4% Other
ETF AUM 2012-20164
$1.9tr $2.3tr $2.7tr $3.0tr $3.6tr
2012 2013 2014 2015 2016
22% 14%
39% 36%
Equity market Corporate debt
2014 2030F
39% Emerging markets forecast to
make up 39% of global equity
market value by 2030
Emerging markets capitalisation6
London Stock Exchange Group

Fixed Income, The Yield
Book & Citi Indexes
Waqas Samad CEO Benchmarks, Fixed Income and Multi-Asset
Page 26

Technology
Info Services
Capital Markets
Group
Post Trade
FTSE Russell 2014 Pre - 2000 2013
The Yield Book Accelerates FTSE Russell fixed income strategy
FTSE UK
Gilts
FTSE TMX
JV
Bank of
China (HK)
Offshore
RMB Bond
Index
FTSE ASFA
Australia
Bond Index
FTSE TMX
acquires
MTS Indexes
2017
LSEG
acquires
Mergent
LSEG to
acquire The
Yield Book
Adds Canadian
fixed income
indexes &
analytics
Leading source
of US corporate
and municipal
bond terms and
conditions
Builds on
equity index
success in
China
Asset owner-
led innovation
Leading
benchmark for
UK Gilt
investments
Leading global
fixed income
index and
analytics
provider
Page 27
2016
Leading
Eurozone
government
bond indexes
Page 27 London Stock Exchange Group
Post completion of Citi Fixed Income Indices and The Yield Book

Technology
Info Services
Capital Markets
Group
Post Trade
FTSE Russell
Page 28
Broadening client relationships Complementary and synergistic offering
Product
— Family of fixed income benchmarks with 35+ years history
includes the widely followed World Government Bond Index
(WGBI)
— Leading fixed income analytics platform with 25 years of
history
— Extensive fixed income securities database
— Opportunity to use FTSE Russell sales capability to
develop index business and products
Combined assets under management
14% The Yield Book &
Citi Fixed Income
Indexes
80% FTSE Russell
Equity
Clients
— $107m revenue from analytics and index services in 2016
— 300 clients globally, including 200 fixed income asset
managers and asset owners
— Used by most leading US fixed income managers
— Citi will remain a significant client and long-term partner
— Significant operations in Asia
~$15tr AUM
6% FTSE Russell
Fixed Income
London Stock Exchange Group
Source: LSEG, Citi. Post completion of Citi Fixed Income Indices and The Yield Book

Technology
Info Services
Capital Markets
Group
Post Trade
FTSE Russell
Page 29
Combination of The Yield Book and Citi Fixed Income Indexes with FTSE Russell
creates a unique multi-asset index company with ~$15tr AUM
Accelerate
commercialisation of
index business and
FTSE Russell growth
New fixed income and
multi-asset index and
analytic products
Deepen and extend
client base through
FTSE Russell sales
organisation
EPS accretive in year 1
$48m synergies in 3 years
EBITDA margin will increase to match FTSE Russell
A unique index company Diversified product range & global scale
London Stock Exchange Group
Source: FTSE Russell. Post completion of Citi Fixed Income Indices and The Yield Book

Summary
Mark Makepeace Group Director of Information Services
CEO, FTSE Russell
Page 30

Technology
Info Services
Capital Markets
Group
Post Trade
FTSE Russell
Successful track-record of value creation through acquisitions
Page 31
3 year synergy
targets achieved
3 year synergy target
delivered ahead of
schedule
Leading provider of
proprietary fixed
income and global
equity data
Low cost data collection
model
Mergent data to drive
index adoption and new
product development
Accelerates data and
analytics offering, builds
US and Asia presence and
fixed income client base
globally
3 year synergy target:
2011 2014 2017
£18m Revenue
£10m Cost
£18m ($30m) Revenue
£46m ($78m)
Cost
$30m
Revenue
$18m Cost
2016
Source: FTSE, Frank Russell Company, Mergent & The Yield Book and Citi Fixed Income Indices acquisition announcements.
Post completion of Citi Fixed Income Indices and The Yield Book
London Stock Exchange Group

Technology
Info Services
Capital Markets
Group
Post Trade
FTSE Russell
Page 32
— Active to passive
— Investment innovation
— Increasing
sophistication of
investment processes
— Index industry
consolidation
— Global sales
capability
— Recurring revenue
and high retention
rates
— Embedded in global
investment processes
— Open access
— Global leader in multi-
asset indexes
— Diverse and
innovative products:
global, multi-asset,
smart beta, analytics
— Consistent double-
digit growth
— Organic and
inorganic growth;
effective synergy
delivery
— Scale business
creates efficiencies
Positive secular
trends
Robust business
model
Strategic focus &
ambition
Proven execution
capability
FTSE Russell will continue to deliver high levels of top line growth through organic and
inorganic strategies
+ + +
London Stock Exchange Group
Continued double-digit growth Attractive and sustainable margins

Capital Markets Division
Raffaele Jerusalmi Director of Capital Markets
CEO, Borsa Italiana
Page 33

London Stock Exchange Group
Growth Opportunities in Capital Markets
Raffaele Jerusalmi
Director of Capital Markets
CEO, Borsa Italiana
Opportunities for CurveGlobal
Michael Davie
Chairman, CurveGlobal
Page 34
Agenda

Leading primary and secondary markets
London Stock Exchange Group Page 35
Capital Markets Total Income: 2013 ‒ 2016
77 89 89 91
127 139 144
165
92
105 98
113 £297m
£333m £330m
£368m
CY 2013 CY 2014 CY 2015 CY 2016
Secondary Markets - Fixed income, derivatives & other
Secondary Markets - Equities
Primary Markets
Capital Markets EBITDA margin of 51% in 2016
Capital Markets has delivered growth across varied market conditions
£1,657m
£595m Information
services
£368m Capital
Markets
£146m CC&G &
Monte Titoli
£447m LCH
£88m Technology
£12m Other
LSEG 2016 Total Income by segment
Total may not sum due to rounding

A digital platform bringing together listed companies,
institutional investors and financial intermediaries to
enable easier interactions and increase productivity
Launched in 2015
A full-service programme designed to
share best practices and increase growth
opportunities, including the understanding
of capital markets
Launched in 2012
Catalyst for growth
An online private placement platform
designed to streamline the capital
raising process for companies
Launched in 2016
ELITE Supporting private high growth SMEs
London Stock Exchange Group Page 36
ELITE is a programme that helps fast-growing private companies prepare and structure for further
growth through sharing experiences, access to financing opportunities and education.
(1) Source: Global insights from regional Alternative Finance studies, KPMG; Cambridge Centre for Alternative Finance (Oct 2016). Excludes China alternative finance volumes of
$101.69bn. Converted to EUR at BoE 2015 annual average exchange rate (0.90 EUR/USD).
800+ Growing community of over
800 companies, investors and
advisers
€44bn ELITE companies generate
€44bn revenue, with over
196,000 employees across 34
sectors
26 The ELITE community spans
26 countries across Europe
and beyond
€39bn Global alternative finance
market volume of €39bn in
2015 (1)
Connection to investment opportunities Capital for growth
ELITE Growth ELITE Connect ELITE Club Deal

Delivering MiFID II solutions In partnership with customers
London Stock Exchange Group
Turquoise Plato Block Discovery™ Value Traded
Award winning innovation designed in cooperation with Plato
Partnership, a unique collaboration with buy-side and sell-side firms
Average trade size 30 times industry dark pool average
Page 37
0
500
1,000
1,500
2,000
2,500
3,000
3,500
Se
p-1
4
Nov-1
4
Jan
-15
Ma
r-1
5
Ma
y-1
5
Jul-
15
Se
p-1
5
Nov-1
5
Jan
-16
Ma
r-1
6
Ma
y-1
6
Jul-
16
Se
p-1
6
Nov-1
6
Jan
-17
Ma
r-1
7
Ma
y-1
7
Va
lue
tra
de
d, E
UR
mill
ion
s
Turquoise Plato
partnership announced
September 2016
Equities Facilitating MiFID II compliant dark liquidity on
LSE plc through intra-day auctions and Mid
Price Pegged Orders
ETFs
Request-for-quote functionality for ETFs and
ETPs launched in UK and Italy, providing a
solution for customers to execute large
bilateral trades on-exchange
TRADEcho
Multi-asset, pan-European pre- and post-trade
reporting solutions to help customers meet
MiFID II obligations, in partnership with Boat
Services
Turquoise
SwapMatch
A neutral arranging mechanism to match
clients’ block interests in OTC equity total
return swaps to support balance sheet
efficiency
MiFID II ready solutions – delivering innovative services providing choice and flexibility to customers
Selected Regulatory-Driven Client Solutions

London Stock Exchange Group Page 38
Fixed Income Opportunities for growth across multiple segments
Significant presence across inter-dealer, dealer-to-client and retail trading segments. Positioned for growth as regulatory
tailwinds and market participants increasingly support shift to electronic trading.
LSEG Institutional & Retail Fixed Income Platforms
A leading electronic platform for interdealer and dealer-to-client European bond and repo trading
Average daily volumes exceeding €100bn and 50% share of inter-dealer European government bond trading
in 2016 (1)
US presence via MTS BondsPro provides all-to-all liquidity in USD and non-USD corporate bonds and
emerging market debt
International Securities
Market (ISM) Recently launched MTF for primary debt issuance targeted at institutional and professional investors
operating alongside the LSE Main Market and Professional Securities Market
MOT & ExtraMOT A leading position in terms of trading and turnover on Italian retail market, supporting investors’ access to
bonds, debt and government securities
EuroTLX Dedicated to investors trading in retail size, with liquidity providers present for each instrument across a
wide range of fixed income securities
ORB Provides investors with access to on-screen secondary market for UK debt instruments in retail size, with
over 60 gilts and 100 corporate bonds available for trading
Further growth opportunities arising from closer integration of fixed income assets across LSEG
(1) Source: Celent 2016 European Fixed Income Market Sizing (Oct 2016)
Reta
il
Ins
titu
tio
na
l

CurveGlobal
Michael Davie Chairman, CurveGlobal
Page 39

LSEDM
— FCA regulated exchange
— Robust trading infrastructure
and connectivity
— Rates futures: EUR and GBP,
short-term and long-term
— Open access by design
— IP, brand, capital
— The largest Rates margin
pool and default fund
— 90%+ share of global cleared
OTC Rates(1)
— LCH Spider portfolio
margining tools
Page 40
Utilising open interest in LCH for portfolio margining
benefits, with access to a single default fund across
OTC and listed trades
Partnership approach with customers driving
innovation 1
Delivering capital efficiencies to market through
LCH 2
USPs
London Stock Exchange Group
Innovation in partnership with customers
(1) Source: ClarusFT

(1) Source: LSEG analysis. Based on total short term interest rate (STIR) derivatives open interest on CurveGlobal, ICE (EUR and GBP) and Eurex (EUR only) as at 24 May 2017
2017 Priorities
Build the community — Utilise the dealer bank shareholder cornerstone to grow adoption across more banks (both
house and FCM), market-makers, proprietary trading firms and the buy-side
Evolve connectivity — From traditional fixed income point-to-point via vendor offerings to full smart order router
deployment
Evidence best
execution — Leverage MiFID best execution driver – compelling, objective analysis of CurveGlobal liquidity
Facilitate optimisation — Encourage block trading for risk transfer and optimal risk taking
— Create tools and community to enable smarter risk management
0
20,000
40,000
60,000
80,000
100,000
120,000
30 Sep 14 Oct 28 Oct 11 Nov 25 Nov 09 Dec 23 Dec 06 Jan 20 Jan 03 Feb 17 Feb 03 Mar 17 Mar 31 Mar 14 Apr 28 Apr 12 May
Contr
acts
Tra
ded
(s
ingle
sid
ed)
ContractsTradedOpen Interest
CurveGlobal Weekly Trading Volume & Open Interest
Page 41
1.1% share of STIR
open interest (1)
London Stock Exchange Group
Steady progress through early stage adoption

Further opportunities and drivers of growth
Portfolio
margining for LTIR
futures
— Could potentially enable material duration offset and “full curve” portfolio margining for some
customers
— Of particular interest to relative hedge fund community and their FCMs
— Sea change when individual traders are charged all end-to-end trading costs at point of
execution
Compression and
other post-trade
optimisation
— OTC notional continues to grow despite extensive use of compression services
— Opportunity to add CurveGlobal futures as replacement products, with potential for portfolio
margining in LCH
— Partnership with LCH, TriOptima, Quantile and others
Packaged trades — CurveGlobal can straddle the OTC-listed divide
— Symbiotic trading of Bonds, Futures & OTC swaps with OTF/MTF partners, cleared into LCH
Innovation - GBP
risk free rate
products
— Bank of England risk free rate decision for SONIA+ pending – market consultation during H2
2017
— CurveGlobal can list futures products for stand-alone execution, or in conjunction with OTC via
OTF/MTF partners, cleared into LCH
— Other risk-free rates also in scope (e.g. £SONET)
Page 42 London Stock Exchange Group

LCH Group
Suneel Bakhshi CEO, LCH Group
Page 43

Agenda
London Stock Exchange Group Page 44
Introduction
Rates and Credit
ForexClear
RepoClear and Net Treasury Income
Driving growth and operating leverage
Suneel Bakhshi, CEO, LCH Group
Daniel Maguire, COO, LCH Group & Global Head
of Rates & FX Derivatives
Paddy Boyle, Global Head of ForexClear
Bruce Kellaway, Global Head of RepoClear,
EquityClear & Collateral
Daniel Maguire, COO, LCH Group & Global Head
of Rates & FX Derivatives

London Stock Exchange Group
— Customer driven business model, underpinned by our commitment to best
in class risk management and open access, leading to innovation and
unrivalled service adoption
— Regulatory tailwinds support growth in our core business – aimed to attract
further business through new services
— Universe and diversity of clearing participants continues to grow, creating
greater network effects across our business
— More asset classes in more geographies set to benefit from cleared and
uncleared services
Page 45
Uniquely positioned as a leading global clearing house

A growing contributor to LSEG financial performance
London Stock Exchange Group Page 46
110 138 157
191
146
160 115
117
62
60
56
82 4
31
33
58
£322m
£389m £361m
£447m
FY 2014 (March 14year end)
2014 2015 2016
OTC Non-OTC NTI Other
(1) LCH total income profile includes the migration of LME business to LME Clear in September 2014 (2) 2014 figures include 11 months only (3) Based on annualised figures for
2014 based on 11 months actual income (4) Other income includes non-cash collateral and compression fees
LSEG 2016 Total Income by segment LCH Group Total Income: FY2014 – 2016 (1)
(2)
(4)
Total may not sum due to rounding
£1,657m
£447m LCH
£595m Information
services
£146m CC&G &
Monte Titoli
£368m Capital
Markets
£88m Technology
£12m Other

Rates & Credit
Daniel Maguire COO, LCH Group
Global Head of Rates & FX Derivatives
Page 47

London Stock Exchange Group Page 48
Delivering against growth opportunities
Service Revenue Targets (1) Current Status
SwapClear
Client clearing €30m - 40m p.a. Achieved in 2016
Compression €10m - 15m p.a. Achieved in 2016
Inflation swaps €10m p.a. On target to achieve in 2017
ForexClear €25m - 40m p.a. On target
European Repo service €10m - 20m p.a. On target
We have delivered, or are on track to deliver, the revenue targets and key initiatives presented
at the May 2015 Post Trade Investor Day
Update on
Rates Portfolio
Margining
— A core component of LCH’s risk management offering across the entire Rates spectrum
— LCH Spider, the open access portfolio margining service for interest rate derivatives,
went live in May 2016, starting with Short Term Interest Rate Futures against SwapClear
— Clearing services for CurveGlobal went live in September 2016
— LCH Spider II, portfolio margining of Bund, Bobl, Schatz and Gilt Futures against
SwapClear, scheduled for go live by Q4 2017 (subject to regulatory approval)
(1) Incremental annual revenue opportunities relative to CY 2014 baseline, to be achieved by exit 2018

2010 2016 Future
Trend
Number of clearing members 35 107
Number of dealers 52 197
Number of members offering client clearing 21 49
Number of active clients (in year) 5 767
Number of clearing countries 11 55
Average daily trades 2,969 14,792
Average daily USD notional 0.72tr 2.63tr
Total GBP Initial Margin (IM requirement) £8.1bn £85.3bn
Geographic hubs 1 4
London Stock Exchange Group Page 49
SwapClear
(1) Total income reported is converted to Euro at prevailing FX rates and includes revenues from clearing, compression services and NTI (2) Source: ClarusFT
Continued global leadership in OTC rates clearing
Headline Statistics
€36m
€62m €79m
€145m
€188m
€253m
€315m
0m
50m
100m
150m
200m
250m
300m
350m
2010 2011 2012 2013 2014 2015 2016
SwapClear Total Income Growth (€m) (1)
44% 2010-2016
CAGR
Successfully expanding and diversifying revenue streams, including client
clearing, compression services and LCH SwapAgent
Regulatory tailwinds supporting growth in core business and new product
areas
90%+ Share of clearing
notional value (client
and member) (2)

London Stock Exchange Group Page 50
Significant increase in client volumes, notional cleared and revenue contribution across
EMEA, North America and Asia Pacific, with further growth expected
SwapClear Client Clearing
2014 2015 2016
Cleared Notional ($US tr) 122 93 139
Cleared Notional Market Share (1) 74% 76% 87%
Cleared Trades (000s) 410 680 950
Cleared Trades Market Share (1) 49% 61% 75%
Compressed Trades (000s) 340 580 810
Outstanding Notional ($US tr) 12.6 16.0 22.9
Outstanding Trades (000s) 110 180 270
Initial Margin ($US bn) 9 19 44
Number of clients clearing 251 348 579
Headline Statistics
108
985
1,576
2,618
3,688
4,534
-
1,000
2,000
3,000
4,000
5,000
2012 2013 2014 2015 2016 2017YTD
Average Daily Client Trades
Future growth drivers include mandated EU client clearing and
extension of non-deliverable IRS to additional Asian currencies
(KRW, INR, CNY) to meet global and local client demand
Expansion of the client community strengthens network effects
to drive growth in existing and new products
+27% Continued growth in
2017 – client trades
up 27% y-o-y in Q1
2017
+55% Increase in number
of clients clearing in
Q1 2017 versus prior
year
Source: (1) ClarusFT (2) 2017 YTD as of 31st May 2017
(2)

London Stock Exchange Group Page 51
Continuing to deliver significant value to members and clients
SwapClear compression services
Notional Outstanding (USD tr) Notional Compressed (USD tr) Cleared and Compressed Notionals (USD tr)
Compelling benefits for members and clients from capital and
operational savings are expected to drive further growth in
compression services
LCH compression services capturing increased share of the total
compressed, whilst partnering with other service providers on an
open access basis
$21bn Estimated capital
savings realised by
members from
compression
services in 2016
+64% Notional
compressed in Q1
2017 was 64%
higher than any
previous Q1 period
251
666
281
384
252
Notionaloutstanding31/12/2015
Grossnotionalcleared
Maturingtrades
Notionalcompressed
Notionaloutstanding31/12/2016
0
50
100
150
200
250
300
350
400
450
2013 2014 2015 2016
Member Client
0
50
100
150
200
250
300
350
400
450
2013 2014 2015 2016
Member Client

London Stock Exchange Group Page 52
Uncleared Margin Rules driving clearing volumes and benefits for members and clients
SwapClear Inflation Swaps
30 43 33 30
171 170
220
189
231 231
397
265
335
0
50
100
150
200
250
300
350
400
450
0
50
100
150
200
250
300
350
400
450
May-16 Jun-16 Jul-16 Aug-16 Sep-16 Oct-16 Nov-16 Dec-16 Jan-17 Feb-17 Mar-17 Apr-17 May-17
EUR GBP USD
Inflation Swap Volume (USD bn)
Blended rate compression for inflation swaps to be launched in Q4
2017, allowing participants to realise greater operational and capital
efficiencies to support further volume growth
$1.1tr Cleared in 2016 with more than 120
buy-side and sell-side participants
+218%

6% 8%
13%
17%
23%
20% 18%
22%
31%
0%
5%
10%
15%
20%
25%
30%
35%
Q2 2015 Q3 2015 Q4 2015 Q1 2016 Q2 2016 Q3 2016 Q4 2016 Q1 2017 Q2 2017
3% 1%
3%
10%
7%
18%
23%
26%
21%
0%
5%
10%
15%
20%
25%
30%
Q2 2015 Q3 2015 Q4 2015 Q1 2016 Q2 2016 Q3 2016 Q4 2016 Q1 2017 Q2 2017
(1) Q2 2017 data as of May 31st 2017. (2) Subject to regulatory approval. Source: LCH, ICE Clear Europe cleared notional data
London Stock Exchange Group Page 53
Clearing the broadest set of CDS across both European and US underlyings
Drivers for further growth
— Introduction of Uncleared Margin Rules and
European clearing mandate for index CDS
— Onboarding of Select Members uniquely
clearing at LCH SA
— Onboarding of buy-side clients ahead of the
Category 2 clearing obligation
— Launch of an industry-first clearing service for
Credit Index Options in Q3 2017 (2)
CDSClear
CDSClear – Share of Overall Indices (1)
CDSClear – Share of Overall Single Names (1)
+160% €449bn cleared in 2016, up
160% versus 2015
Performance
31% Share of overall indices at
31% in Q2 2017, up from 6%
in Q2 2015 (1)

London Stock Exchange Group Page 54
14 dealers already committed, including:
A new service developed with dealer support to simplify the processing, margining and
settlement of uncleared derivatives
LCH SwapAgent
Category Bilateral
LCH
SwapAgent
Standardised collateral documentation X
Standardised trade processing X
Independent valuation agent X
Dispute elimination X
VM / coupon / interest netting X
Standardised risk factor calculation X
Standardised payment processing X
Cross-currency and swaptions
Uncleared Service Comparison: LCH SwapAgent vs. Bilateral
— LCH SwapAgent extends SwapClear infrastructure to the bilateral market without novation to a central
counterparty and default fund contributions
— Service launched in May 2017, to be followed by extended product offering to include cross-currency swaps and
swaptions
— Opens up new opportunities in uncleared services and the wider Rates market infrastructure, with quicker time
to market given lighter regulation versus cleared services
Winner: 2017 Financial News Post-
Trade Initiative of the Year
Service Adoption

ForexClear
Paddy Boyle Global Head of ForexClear
Page 55

ForexClear – The FX Opportunity
(1) Source: BIS Triennial Central Bank Survey Global foreign exchange market turnover in 2016 (Dec 2016)
Instrument Category Average Daily
Turnover (1) LCH offering
NDFs $134bn Live today
Vanilla Options $151bn Live in Q4 2017
FX Swaps &
Deliverable Forwards $2,944bn
Some will clear alongside vanilla options
Some will clear as NDFs as a product substitute Spot $1,652bn
NDOs $22bn Likely to follow vanilla options
Currency Swaps $82bn Less obvious to clear as most risk excluded
from bilateral margin requirements
Exotics $81bn Challenging to clear due to limited liquidity
under stress
Economic incentives increasingly driving FX products into scope for central clearing
Current
ForexClear
focus
London Stock Exchange Group Page 56
2018-19
ForexClear
focus
Not a
ForexClear
focus
LCH well positioned to address capital and margin challenges within the vast $5.1tr
daily FX market

London Stock Exchange Group Page 57
A step-change in volumes following the introduction of Uncleared Margin Rules, with scope
for significant further growth
A strong foundation in NDF clearing ...
ForexClear: Cleared Notional and Total Trades
Additional volume growth expected with strong member and client
take up, additional phases of Uncleared Margin Rules and increased
interest in compression services
0
20
40
60
80
100
120
140
0
100
200
300
400
500
600
700
800
900
1,000
Ma
r-1
2M
ay-1
2Jul-1
2S
ep-1
2N
ov-1
2Jan-1
3M
ar-
13
Ma
y-1
3Jul-1
3S
ep-1
3N
ov-1
3Jan-1
4M
ar-
14
Ma
y-1
4Jul-1
4S
ep-1
4N
ov-1
4Jan-1
5M
ar-
15
Ma
y-1
5Jul-1
5S
ep-1
5N
ov-1
5Jan-1
6M
ar-
16
Ma
y-1
6Jul-1
6S
ep-1
6N
ov-1
6Jan-1
7M
ar-
17
Ma
y-1
7
Tra
de c
ount
(‘000)
Cle
are
d n
otional ($
bn)
NDF Notional NDF Trades
(1) Average daily notional, cleared trades and
percentage growth figures are for Sep 2016 to
May 2017, compared to pre UMR which refers to
the 12 month period from Sep 2015 – Aug 2016
(2) Source: ClarusFT
+775% +600% in cleared notional
following Uncleared
Margin Rules
(UMR) in September
2016 (1)
in trade count
following UMR
in September
2016 (1)
$32bn 4,460 Average daily
notional, up from
$4.5bn pre UMR (1)
Average daily
cleared trades, up
from 510 pre UMR (1)
15% of total NDF market
now cleared,
including 35% of total
dealer NDF flow (2)

Alternative to deliverable
forwards for participants who
do not require delivery
G10 NDFs
Technically ready
and progressing
through
regulatory
approvals
Utilising the EM
NDF platform to
provide a cleared
solution
FX Options
A ‘clearing to settlement’ solution
for OTC FX options and
associated spot and forwards
trades, in partnership with
settlement provider CLS
14 Members
engaged
Technical
development nearing
completion and
regulatory approval
well advanced
Additional areas for growth
– Client clearing
– Compression services
– Tenor / currency extensions
– Margin optimisation
London Stock Exchange Group Page 58
... provides a compelling platform for growth
58
Well positioned to target large pool of FX participants, including existing LCH network,
to support further service adoption

RepoClear and Net Treasury
Income
Bruce Kellaway Global Head of RepoClear, EquityClear & Collateral
Page 59

London Stock Exchange Group Page 60
RepoClear
A leading provider of clearing for cash bonds and repos across multiple European markets
LCH Nominal Volumes (all fixed income)
0
5
10
15
20
25
30
35
40
45
50
Q12007
Q12008
Q12009
Q12010
Q12011
Q12012
Q12013
Q12014
Q12015
Q12016
Q12017
Nom
ina
l V
alu
e (
in €
tr)
Ltd Nominal (in € tr) SA Nominal (in € tr)
— Highest ever nominal cleared in Q1
2017, with strong growth in Gilts
— Cost of leverage ratio means member
banks looking to net repos where
possible – increasing attractiveness of
central clearing
— Continued robust volumes relative to
wider repo market
— New Sponsored Clearing model will
bring benefits of clearing to the buy-side
— LCH SA’s expanded repo offering allows
members to benefit from risk offsets in
Euro-based repos through T2S

London Stock Exchange Group Page 61
Collateral ‒ Net Treasury Income
Significant contributor to LCH Group performance, generating £82m of net treasury income
in 2016 (18% of total LCH income)
LCH Group Collateral Held1 (€bn) — Total collateral continues to grow –
both cash and non-cash
— Blended investment return on cash
remains stable and drives higher net
treasury income as collateral grows
— Investment options are diversifying –
e.g. central bank accounts, direct
buy-side investment counterparts and
FRNs
— Optimisation of investment
management has reduced risk and
associated capital consumption
within LCH
0
20
40
60
80
100
120
140
160
180
40
45
50
55
60
65
70
75
80
85
90
Jun-15 Sep-15 Dec-15 Mar-16 Jun-16 Sep-16 Dec-16 Mar-17
To
tal P
ort
folio
Cash / N
on-C
ash
Member Collateral Client Collateral Cash Non-Cash
(1) Excludes default funds

Driving growth and operating
leverage
Daniel Maguire LCH Group COO
Global Head of Rates & FX Derivatives
Page 62

London Stock Exchange Group Page 63
Driving growth and operating leverage
1) Deliver double digit income growth per annum through to 2019
2) Deliver EBITDA margin in LCH approaching 50% in 2019 (2016: 36%)
Financial Targets:
Growth Efficiency
Streamline and reduce LCH cost base, including
leveraging LSEG resources and scale
— Replace legacy systems with best of breed
technology, using LSEG solutions where
appropriate
— Leverage LSEG shared services company to
enable LCH to focus on core activities
— Drive future investment and resource allocation
based on clear product and service strategy
Continued expansion and diversification of revenue
streams
— Further growth in the user community to drive
incremental revenue from existing and new
services
— Aim to attract new business through unwavering
commitment to customer partnership, open access,
innovation and best in class risk management
Delivery of financial targets driven by:

Delivering best in class
capabilities
Chris Corrado Group CIO
Group COO
Page 64

CIO / COO function
London Stock Exchange Group Page 65
To be the enabler of LSEG as a leading
financial markets infrastructure provider
To provide safe, stable, and trusted
operations
To provide technology that provides our
businesses with competitive advantage

Delivering high quality infrastructure
London Stock Exchange Group Page 66
In-source technology
via acquisition of high
quality, development
capability
Gain control of tech to
support future growth
and reduce costs
Large-scale offshore
facility
2009
In-sourcing and
expanding software
development, testing
and operations
management
capabilities
Addition of scale
operational centres
near-shore and
off-shore
2013 / 2015 2017
LCH implementation of
Millennium CCP
MiFID II readiness
Acquisition integration
Multiple emerging technology
proof of concepts
Utilise Mergent data
capabilities Group-wide
Align resources to business
unit needs
Strengthened management
team and operational controls
Delivery of critical
infrastructure and
efficiency initiatives
Business Services Ltd
(BSL)
Creation of Group-wide shared
service delivery centre
Reduced costs through
centralised technology
operations and back office,
leveraging low cost centres
Scalable; extension to
corporate functions in 2017
2016

LSEG 2016 costs1
Page 67
Total:
£707m
Centralisation Creation of shared services company BSL; LCH back
office and technology integration with Group.
Leveraging scale Progressive off-shoring and near-shoring; delivering
value from acquisitions.
Lowering the cost of change Automation and simplification; Group PMO control;
introduction of enterprise architecture through
CTO function.
Enhancing speed to market Resources aligned to business needs; strategic
deployment of innovative technology; migration to
agile delivery methodology.
Efficiency enhancement initiatives
Scalable and efficient operations
London Stock Exchange Group
(1) Expenses as reported in note 5 of the December 2016 financial statements excluding; depreciation, non-acquisition software amortisation and impairment; and amortisation of
purchased intangible assets and non-recurring items. All figures rounded to nearest million.
£160m
Other costs
£429m
Staff costs
£118m
IT costs ex staff

c.4,000 LSEG employees based in 18 countries, delivering services worldwide
London Stock Exchange Group
LSEG offices
Page 68
IT scale enables global customer service
Development/service centres
80:20 Target ratio of LSEG
technology staff
offshore : onshore,
moving from current
70:30 ratio
20% LSEG average
cost per head in
low cost centres
is c.20% of high
cost locations
2,520 Total LSEG
technology
employees(1)
Approx. technology FTE per location
USA, 220
Russia, 450 UK, 400
Italy, 200
Sri Lanka, 1,150
MillenniumIT, 900
Business Services Limited, 250
Malaysia, 100
(1) Includes Mergent data operations staff

— High performing, low-cost technology
enabling growth and efficiency
— As an open access Group, LSEG provides
technology to over 40 exchanges and
financial services infrastructure providers
— Key customer partnership projects such as
CurveGlobal and Turquoise Plato enabled
through Group technology capabilities
— Development of in-house solutions creates
new opportunities with 3rd parties, e.g.
clearing systems
— Flexible and efficient technology
capabilities are critical to acquisition
integration and value creation
LSEG customer partnerships deepen relationships
LSEG 2016 Technology revenue
65%
Software and
services
35% Hosting and
connectivity
Total:
£88m
Page 69 London Stock Exchange Group

Business application and operational value for LSEG
Page 70
High impact technologies adapted to financial markets infrastructure
Distributed ledger
technology
Machine learning
& big data
Cloud-enabled
computing
— Resiliency / reconciliation
— Trade / pre-trade
— Custody / clearing &
settlement
— Business Intelligence
— Market Supervision
— Risk Analytics
— Infrastructure and
development flexibility
— Data management
— Cost reduction
Additional opportunities accessible via partnerships with customers, regulators, technology providers
Enhancing core businesses through new technology
London Stock Exchange Group Page 70

Capital Management / Financial track record David Warren Group CFO
Page 71

2.0
1.1
1.7
2.1
1.9
1.2
1.4
1.0
1.5 1.6
London Stock Exchange Group Page 72 London Stock Exchange Group Page 72
(1) FY 2012 Pro forma as if FTSE owned for whole year, FY 2014 pro forma as if LCH.Clearnet owned for whole year, 31 December 2014 and 30 June 2015 pro forma as if Frank Russell Co owned for
whole year. Operating Net debt : Adjusted EBITDA. Net debt excludes all cash and cash equivalents of LCH and £200m of further Group cash and cash equivalents held locally for regulatory purposes
Leverage1
31 December 2016
Operating net debt £882m
(31 December 2015: £1,273m)
Net debt: Pro forma EBITDA 1.1x
(excluding £848m restricted cash)
Adjusted for 2017
Net debt: 2016 Pro forma EBITDA
c.2.0x (includes Mergent acquisition,
£200m share buy-back and The Yield
Book and Citi’s Fixed Income Indices
acquisition, excludes restricted cash and
any 2017 free cash flow)
Ratings
LSEG: S&P long term A- and Moody’s
Baa1
Financial position
Facilities
257 373
250
300
343
586
227
2017 2018 2019 2020 2021
Undrawn
Drawn - Bonds
Drawn - Revolving credit facilities
Calendar year

London Stock Exchange Group Page 73
Capital management framework
Balance Sheet Prudency
Maintain existing leverage target
of 1.0-2.0x Net Debt / EBITDA
Flexibility to operate within this range for normal investment /
development and to go above this range in the short term for compelling
strategic opportunities
Manage credit rating, debt profile, and regulatory requirements
Investment for growth
Preserve flexibility to pursue
growth both organically and
through ‘bolt-on’/strategic M&A
Selective inorganic investment opportunities - meeting high internal
hurdles
Continued organic investments
Ordinary dividend policy
Progressive ordinary dividend
policy
Progressive dividend - reflects confidence in strong future financial
position
Operating in target 2.5-3.0x dividend cover range
Interim dividend payment of 1/3 of prior full year dividend results
Other capital returns
If expect to hold surplus cash for
prolonged period
£200m on market buy-back currently being executed
Continue to keep options under review

London Stock Exchange Group Page 74
Strong track record of progressive dividend payments
Dividend cover of 2.9x in 2016 now in targeted range
Share buy-back
10% 2009-2016
CAGR
£200m on market programme
commenced April
2017
Increasing shareholder returns Dividend and buy-back
22.5 22.5 24.7 26.1 27.2 28.4
36.0
43.1
FY2009 FY2010 FY2011 FY2012 FY2013 FY2014 CY2015 CY2016

London Stock Exchange Group Page 75
324%
138% 134%
102%
51%
0%
100%
200%
300%
LSEG ExchangeGroups Avg.
Info ProvidersAverage
S&P 500 FTSE 100
(1) Total shareholder return represents the total return of stock to investors (i.e. capital gain / share price appreciation plus dividends). Exchange groups included in average:
LSEG, CBOE, NDAQ, ICE, CME, ASX, DB1, BM&F, HKEX, SGX; Info providers included in average: S&P Global, MSCI, Thomson Reuters, FactSet.
Source: LSEG analysis; Total shareholder returns sourced from Bloomberg
Rank Company TSR Return
1 Ashtead group 907.1%
2 Micro Focus International 560.3%
3 Barratt Developments 500.2%
4 Taylor Wimpey 463.9%
5 Persimmon 452.1%
6 St. James’s Place 345.5%
7 Provident Financial 335.4%
8 London Stock Exchange Group 324.2%
9 Mondi 293.2%
10 Paddy Power Betfair 276.8%
Total shareholder returns1 2011-2016 LSEG in Top 10 for FTSE 100 TSR 2011-2016
Total Shareholder returns

FTSE Russell Double-digit growth to continue 2017-2019
Sustainable and attractive margins over the same period
LCH OTC revenue growth to continue at double-digit 2017-2019
Accelerating EBITDA margin growth - approaching 50% by 2019
(2016: 35.6%)
LSEG Operating expenses held at c.4% p.a. 2017-2019 increase while
Group continues to deliver revenue growth and improved margins
Next phase cost saves of £50m p.a. by exit 2019
EBITDA margin of c.55% by 2019 (2016: 46.5%)
London Stock Exchange Group Page 76
Further growth and enhanced returns
Increasing operating leverage - increasing operating margin

Appendix: Speaker biographies
Page 77

London Stock Exchange Group
Today’s presenters
Chris was appointed Group COO and Group
CIO in November 2015. He was previously
Managing Director at MSCI, CIO/CTO,
responsible for technology, data services
and program management from 2013.
Chris has more than thirty years of global
experience in managing technology platforms
and transformational change in the financial
services industry. Prior to joining MSCI, Chris
held a variety of senior CTO roles in leading
banks, including Morgan Stanley and Deutsche
Bank. He has also worked for high growth
technology companies as CTO at eBay, CIO at
AT&T Wireless, and SVP of Technology,
Strategic Initiatives and Business Architecture
at Asurion, the mobile technology protection
company. He began his career at IBM.
David Warren
CFO, LSEG
Chris Corrado
COO/CIO, LSEG
David was appointed LSEG’s Chief Financial Officer
and joined the Board as a Director in July 2012.
Prior to joining LSEG, David spent nine years as CFO
at Nasdaq OMX where he was responsible for all
financial operations. This was followed by two further
years there as a Senior Advisor to the CEO. Before
joining Nasdaq OMX David, whose career also
includes seven years at Credit Suisse First Boston,
had already held a number of senior finance roles.
Xavier Rolet
CEO, LSEG
Xavier joined the Board of LSEG in March
2009 and was appointed CEO in May 2009.
Previously Xavier had been a senior
executive at Lehman Brothers from 2000 to
2008, most recently as CEO in France.
Xavier has also held senior positions at
Dresdner Kleinwort Benson (1997–2000),
Credit Suisse First Boston (1994–96) and
Goldman Sachs (1984–94). Until July 2010
he was a Non-Executive Director of LCH.
Page 78

London Stock Exchange Group
Mark Makepeace
Group Director of Information Services,
LSEG and CEO, FTSE Russell
Mark was appointed Group Director of Information
Services in October 2012 and, having established
FTSE in 1995, is also CEO of FTSE Russell.
Mark has been developing successful joint ventures
for more than 15 years and has forged alliances with
stock exchanges, academics and leading industry
groups. After beginning his career in local
government, Mark joined London Stock Exchange in
1985. He holds senior positions in several industry
bodies and is a Vice President of Unicef UK.
Waqas leads FTSE Russell’s global benchmark
business for fixed income and multi assets. This
includes overseeing the successful FTSE TMX joint
venture in North America and other fixed income
partnerships.
Waqas joined LSEG from Barclays, where he had run
the firm’s index and analytics business as CEO of
BRAIS (Barclays Risk Analytics & Index Solutions)
since joining the firm in 2007. He has been an active
voice in the index industry, serving as a board member
of the Index Industry Association. He has spent the last
23 years in the financial services industry, the last 12 of
which were in leadership roles in the index and
portfolio analytics industry.
Waqas Samad
CEO, Benchmarks,
Fixed Income and Multi Assets
Caroline joined LSEG in April 2015, taking up
responsibility for all sales, marketing and client
services activities globally for the Information
Services Division.
Caroline has more than 20 years of management
expertise leading global data and intelligent
information providers. At the Depository Trust &
Clearing Corporation (DTCC) from 2008, she was
Global Head of Sales and latterly Managing Director
Data Services. During her tenure at DTCC, Caroline
managed and developed a global enterprise sales
capability, leading sales teams in the UK, US and
Asia-Pacific. Prior to this, she was Global Head of
Alliances and Channel Development, Enterprise at
Thomson Reuters for six years, after spending eight
years serving in a similar role at Interactive Data.
Caroline O’Shaughnessy
Global Head, Sales & Marketing
Today’s presenters
Page 79

London Stock Exchange Group
Adding to his role as Director of Capital Markets,
Raffaele became CEO of Borsa Italiana in April 2010.
He was appointed to the Board of LSEG in June
2010. He is also Institore of the LSEGH (Italy) group
of companies.
Prior to joining Borsa Italiana in 1998, Raffaele had
been Head of Trading for Italian fixed income at
Credit Suisse First Boston since 1993. From 1996 he
was a member of the proprietary trading group in
London, while from 1997 to 1998 he was a Board
member of MTS, representing CSFB. Between 1989
and 1993 Raffaele was Head of Trading for fixed
income and derivatives at Cimo in Milan.
Michael Davie
Chairman, CurveGlobal
Raffaele Jerusalmi
CEO, Borsa Italiana
In October 2015, Michael became Head of Rates
Services, LSEG.
Michael was previously CEO of SwapClear, and prior
to that worked at JP Morgan from 1995 to 2010, in the
Fixed Income Markets division (Sales & Trading). He
also spent 10 years at IBM in Sales and Finance.
Michael is the Chairman of Governors of a large
private Catholic school in the UK, and was previously
a board director of Markit and TradeWeb.
Page 80
Today’s presenters

London Stock Exchange Group
Today’s presenters
Paddy was appointed as Head of FX Product
in 2016. He is a senior industry professional
having been Global Head of G10 FX Options
at Goldman Sachs.
Paddy was a member of the Bank of England
Joint Standing Committee on FX and also a
Board member of the Global FX Division of the
Global Financial Markets Association. More
recently he has been a Consulting Partner at
Turing Experts Limited involved in providing
expert witness analysis for regulatory and non-
regulatory investigations and litigation in FX.
Bruce joined LCH in September 2014 and is Global
Head of RepoClear and EquityClear. He also runs
Collateral and Liquidity Management, responsible for
investing and managing the cash and non-cash
collateral across the CCPs.
Prior to joining LCH, Bruce worked at Lloyds Banking
Group, most recently as Managing Director of Rates
Trading. He was also Interim Head of Trading for nine
months. During 20 years with Lloyds he was
instrumental in building a successful and focused rates
trading function and creating a leading GEMM (Gilt-
Edged Market Maker)
from scratch.
Bruce Kellaway
Global Head of
RepoClear,
EquityClear &
Collateral
Paddy Boyle
Global Head of
FXClear
Suneel assumed his role as Group Chief
Executive Officer of LCH in February 2014.
He is also a member of the Executive
Committee of LSEG.
Suneel gained more than 30 years of
experience at Citigroup, in trading, banking
and risk management. Most recently, he was
President and CEO, Citigroup Global Markets,
Japan. Suneel has worked around the world,
across asset classes and geographies in
delivering growth programmes and
implementing change.
Suneel Bakhshi
CEO, LCH Group
Daniel was appointed Group COO, LCH in April 2017.
He is also Global Head of Rates and FX Derivatives,
responsible for the world’s leading interest rate and FX
derivatives clearing services.
Daniel joined LCH in 1999, taking responsibility for
areas including programme delivery, management,
sales, marketing and operations. In 2010, he moved to
New York to lead the creation of LCH’s North America
operations and the successful build-out of
SwapClear’s client clearing franchise in the US. He
returned to the UK as Global Head of SwapClear in
March 2014, before taking on additional
responsibilities for Listed Rates and ForexClear.
Daniel left LCH in 2005 and returned in 2008, where
he was immediately responsible for the successful
trading and unwinding of Lehman Brothers’ LCH-
cleared bond and repo portfolio.
Daniel Maguire
COO, LCH Group
and Global Head of
Rates and FX
Derivatives
Page 81

EBITDA margin
calculation ( Adjusted operating profit – Depreciation ) / Total income
London Stock Exchange Group Page 82
Glossary
CY2016
Total income £1,657.1m
Adjusted operating profit (before amortisation of
purchased intangible assets and non-recurring items) £685.8m
Depreciation, software amortisation and impairment -£85.0m
EBITDA margin 46.5%