lsr group’s 4q/12m 2016 trading volume updatelsrgroup.ru/media/files/lsr_full_year...
TRANSCRIPT

LSR Group’s 4Q/12M 2016 Trading Volume Update
Saint Petersburg

2
Disclaimer
2
By attending the meeting where this presentation is made, or by reading the presentation slides, you agree to the bound by the following limitations:
This presentation does not constitute or form part of and should not be construed as, an offer to sell or issue or the solicitation of an offer to buy or acquire securities of PJSC LSR Group (“hereinafter – the Company”) or any of its subsidiaries in any jurisdiction or an inducement to enter into investment activity. No part of this presentation, nor the fact of its distribution, should form the basis of, or be relied on in connection with, any contract or commitment or investment decision whatsoever. The information in this document has been prepared by the Company solely for use at presentations. This document and its contents may not be distributed, published, reproduced (in whole or in part) by any medium or in any form.
No representation or warranty, express or implied, is made as to, and no reliance should be placed on, the fairness, accuracy, completeness or correctness of the information, or opinions contained herein. None of the Company nor any of its shareholders, directors, officers or employees nor any other person accepts any liability whatsoever for any loss howsoever arising from any use of this presentation or its contents or otherwise arising in connection therewith. The information set out herein may be subject to updating, completion, revision, verification and amendment and such information may change materially.
The information communicated in this document contains certain statements that are or may be forward looking. These statements typically contain the words «anticipate», «believe», «intend», «estimate», «expect», «will» and words of similar meaning. By their nature forward looking statements involve known and unknown risks, uncertainties and other factors which may cause our actual results, performance or achievements to be materially different from any future results, performance or achievements expressed or implied by such forward-looking statements. We assume no obligations to update amend or revise the forward-looking statements contained herein to reflect actual results, changes in assumptions or changes in factors affecting these statements. Investment in the Company will also involve certain risks. There maybe additional material risks that are currently not considered to be material or of which the Company and its advisors or representatives are unaware.
The forward-looking statements in this presentation are based upon various assumptions, many of which are based, in turn, upon further assumptions, including without limitation, management's examination of historical operating trends, data contained in our records and other data available from third parties. Although we believe that these assumptions were reasonable when made, these assumptions are inherently subject to significant uncertainties and contingencies which are difficult or impossible to predict and are beyond our control and we may not achieve or accomplish these expectations, beliefs or projections. In addition, important factors that, in our view, could cause actual results to differ materially from those discussed in the forward-looking statements include the achievement of the anticipated levels of revenues, profitability and growth, cost and synergy of our recent acquisitions and restructuring, the timely development and acceptance of new products, the impact of competition and competitive pricing, the ability to obtain necessary regulatory approvals and the ability to fund our future operations and capital needs through borrowing or otherwise, the ability to successfully implement any of our business strategies, the ability to integrate our business and to realize anticipated cost savings and operational benefits from such integration, our expectations about growth in demand for our products and services, the effects of inflation, interest rate and exchange rate fluctuations, and our success in identifying other risk to our business and managing the risk of the aforementioned factors, the condition of the economy and political stability in Russia and the other markets of operations and the impact of general business and global economic conditions.
Under no circumstances shall this document constitute an offer to sell or a solicitation to buy securities in any jurisdiction, including the United States of America, and nothing in this document should be construed as a recommendation or advice to any person to purchase any securities.
The distribution of this presentation in some jurisdictions may be restricted by law and persons into whose possession this presentation comes should inform themselves about, and observe, any such restrictions.

3
Highlights 4
Real Estate Development and Construction 5
Moscow 7
St. Petersburg 8
Ekaterinburg 9
Building Materials 10
Appendix 11
Contents
4
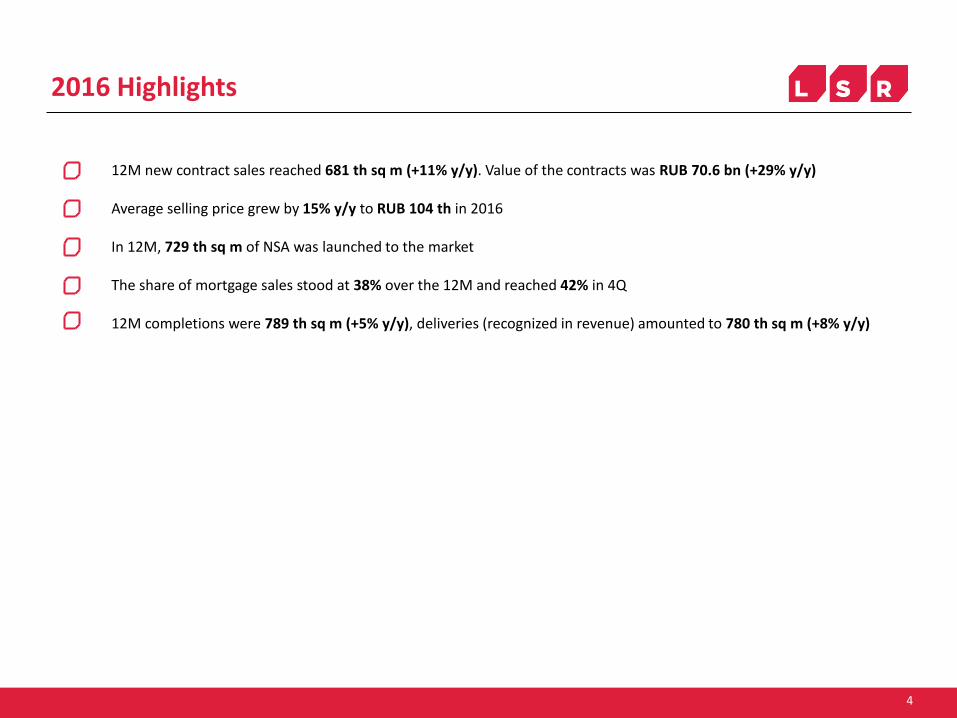
12M new contract sales reached 681 th sq m (+11% y/y). Value of the contracts was RUB 70.6 bn (+29% y/y) Average selling price grew by 15% y/y to RUB 104 th in 2016 In 12M, 729 th sq m of NSA was launched to the market The share of mortgage sales stood at 38% over the 12M and reached 42% in 4Q 12M completions were 789 th sq m (+5% y/y), deliveries (recognized in revenue) amounted to 780 th sq m (+8% y/y)
2016 Highlights
5
Source: Company
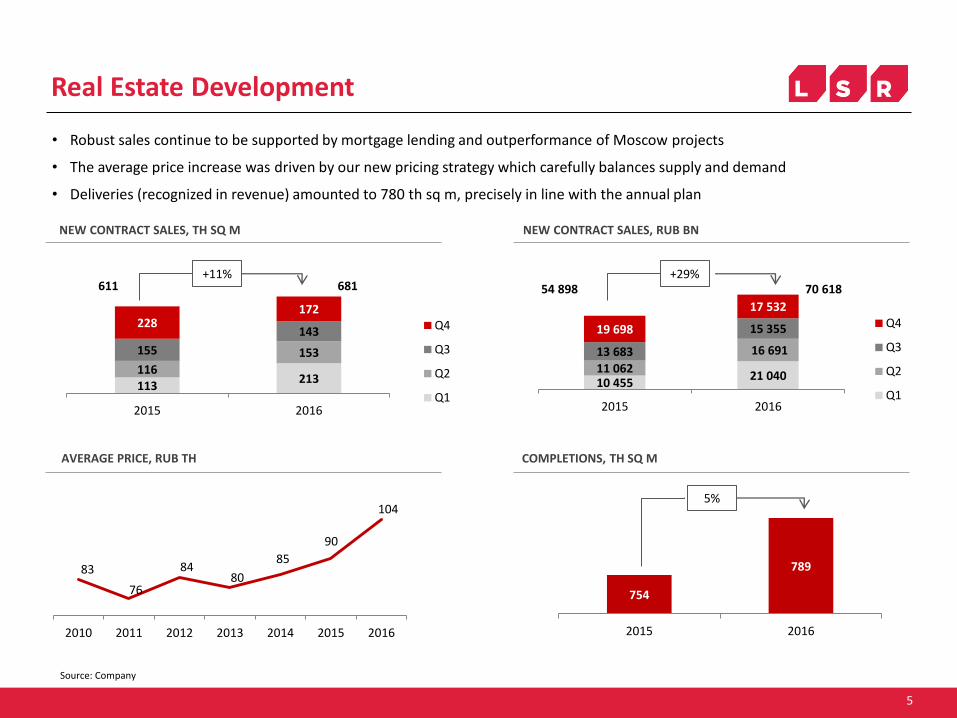
Real Estate Development
COMPLETIONS, TH SQ M
• Robust sales continue to be supported by mortgage lending and outperformance of Moscow projects
• The average price increase was driven by our new pricing strategy which carefully balances supply and demand
• Deliveries (recognized in revenue) amounted to 780 th sq m, precisely in line with the annual plan
5%
AVERAGE PRICE, RUB TH
NEW CONTRACT SALES, RUB BN NEW CONTRACT SALES, TH SQ M
+11% +29%
113 213
116
153 155
143 228
172
2015 2016
Q4
Q3
Q2
Q110 455
21 040 11 062
16 691 13 683
15 355 19 698
17 532
2015 2016
Q4
Q3
Q2
Q1
754
789
2015 2016
83
76
84 80
85
90
104
2010 2011 2012 2013 2014 2015 2016
611 681 54 898 70 618
6
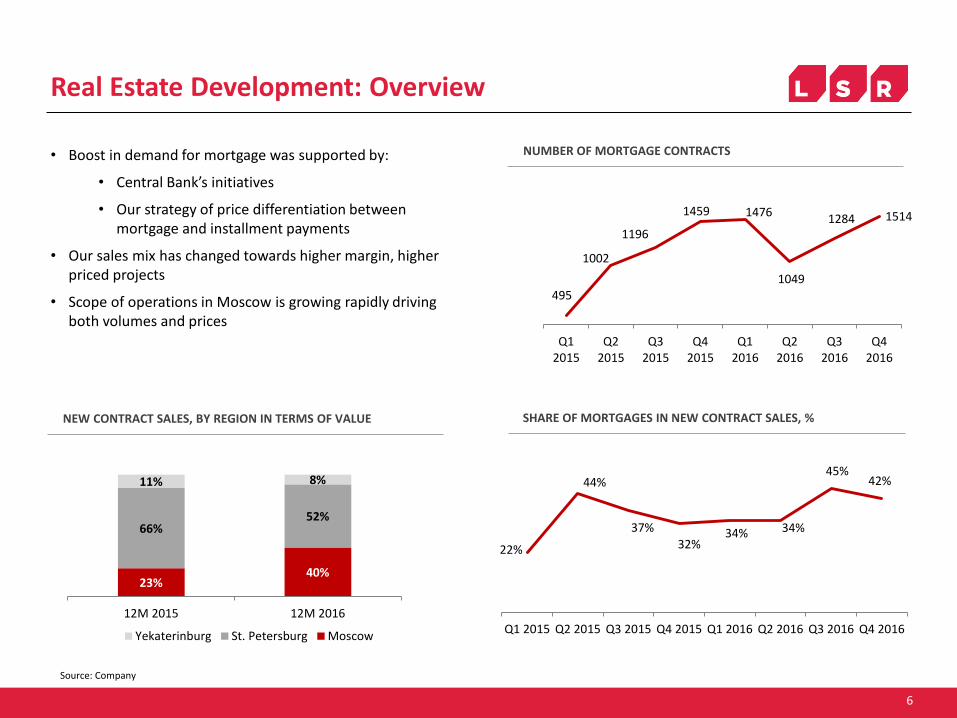
NEW CONTRACT SALES, BY REGION IN TERMS OF VALUE
Real Estate Development: Overview
• Boost in demand for mortgage was supported by:
• Central Bank’s initiatives
• Our strategy of price differentiation between mortgage and installment payments
• Our sales mix has changed towards higher margin, higher priced projects
• Scope of operations in Moscow is growing rapidly driving both volumes and prices
Source: Company
NUMBER OF MORTGAGE CONTRACTS
SHARE OF MORTGAGES IN NEW CONTRACT SALES, %
23% 40%
66% 52%
11% 8%
12M 2015 12M 2016
Yekaterinburg St. Petersburg Moscow
22%
44%
37%
32% 34% 34%
45% 42%
Q1 2015 Q2 2015 Q3 2015 Q4 2015 Q1 2016 Q2 2016 Q3 2016 Q4 2016
495
1002
1196
1459 1476
1049
1284 1514
Q12015
Q22015
Q32015
Q42015
Q12016
Q22016
Q32016
Q42016

7
NEW CONTRACT SALES BREAKDOWN BY VALUE
Real Estate Development: Moscow
NEW CONTRACT SALES, RUB BN NEW CONTRACT SALES, TH SQ M
• Sales increased by 124% y/y in value terms up to RUB 28.1 bn, and by 55% in volume terms up to 193 th sq m.
• In 2016, 272 th sq m launched to the market, including 163 th sq m in ZILART project
• Average price increased by 45% y/y due to solid project mix
Source: Company
30 64
28
55 30
36
36
38
2015 2016
Q4
Q3
Q2
Q1
+55%
2 627 8 519 2 257
7 867
2 895
5 717
4 779
6 016
2015 2016
Q4
Q3
Q2
Q1
+124%
46%
28%
21%
4%
ZILART
Luchi
Donskoy Olymp
Nakhabino Yasnoe
Other
125
193
12 558
28 119
8
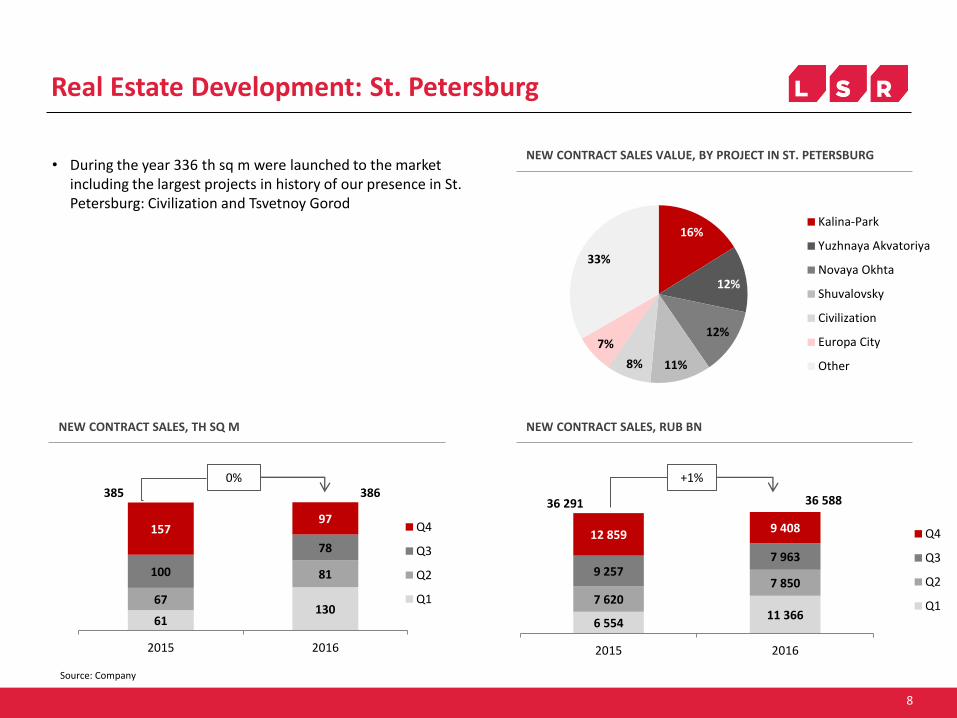
Real Estate Development: St. Petersburg
NEW CONTRACT SALES VALUE, BY PROJECT IN ST. PETERSBURG
NEW CONTRACT SALES, RUB BN
+1%
NEW CONTRACT SALES, TH SQ M
• During the year 336 th sq m were launched to the market
including the largest projects in history of our presence in St. Petersburg: Civilization and Tsvetnoy Gorod
Source: Company
6 554 11 366
7 620 7 850
9 257 7 963
12 859 9 408
2015 2016
Q4
Q3
Q2
Q161
130 67
81 100
78
157 97
2015 2016
Q4
Q3
Q2
Q1
0%
16%
12%
12%
11% 8%
7%
33%
Kalina-Park
Yuzhnaya Akvatoriya
Novaya Okhta
Shuvalovsky
Civilization
Europa City
Other
385 386 36 291 36 588

9
Real Estate Development: Yekaterinburg
NEW CONTRACT SALES VALUE, BY PROJECT IN YEKATERINBURG • 4Q sales in Yekaterinburg were the best quarter results in the
region since the beginning of 2015, increasing by 6% y/y in volume and 2% y/y in value
• This success resulted from offering smaller, more in-demand apartments and adjusting the prices
• During the year 120 th sq m were launched to the market including Rassvetniy, Rastochnaya and Michurinky projects
NEW CONTRACT SALES, TH SQ M NEW CONTRACT SALES, RUB BN
Source: Company
22 19
20 17
25 29
35 37
2015 2016
Q4
Q3
Q2
Q1
0%
1 275 1 155
1 185 974
1 530 1 675
2 059 2 107
2015 2016
Q4
Q3
Q2
Q1
-2%
49%
16%
15%
11%
8%
Rassvetny
Flagman
Michurinsky
Khrustalnye Klychi
Other
101 102 6 050 5 911

10
Sales by product 4Q 2015 4Q 2016 Change, % 12M 2015 12M 2016 Change, %
Crushed granite, th cbm 1 180 1 450 23% 5 374 6 312 17%
Sand, th cbm 1 715 1 872 9% 8 144 8 742 7%
Ready-mix concrete, cbm 210 224 7% 1 027 879 (14%)
Reinforced concrete, th cbm 70 60 (15%) 283 256 (10%)
Bricks, mn units 75 69 (8%) 348 317 (9%)
Aerated concrete, th cbm 288 295 3% 1 304 1 385 6%
Building Materials
• Aggregates’ sales dynamics continued to be supported by supplies to long-term infrastructure projects
• Ready-mix concrete and reinforced concrete remained under pressure from the general decline in early cycle construction activity
• Aerated concrete sales demonstrated steady growth dynamics due to ongoing market share consolidation
Source: Company

11 11
Appendix

12
Operating Guidance 2017: Real Estate & Construction
12
New contract sales (th sq m) Completions (th sq m)
Construction (th sq m)
+13% +27%
+8%
681
770
2016 2017
789
1 000
2016 2017
925
1 000
2016 2017
New launches (th sq m)
+22%
729 890
2016 2017

13
Operating Guidance 2017: Building Materials
13
Ready-mix concrete (th cbm)
Crushed granite (mn cbm) Sand (mn cbm) Reinforced concrete (th cbm)
Aerated concrete (mn cbm) Bricks (mn units)
+2%
+2% +5% +14%
256
260
2016 2017
6,3
6,6
2016 2017
8,7
10
2016 2017
317
330
2016 2017
1,4
1,5
2016 2017
879
900
2016 2017
+8% +4%

14
Contacts
14
For more information please contact:
Yuri Ilyin Chief communications officer Mob.: +7 921 958 23 63
Tel.: +7 (812) 320 56 53 [email protected]
You can watch the construction progress of all our projects in a free mobile app: