lte diameter signaling index - ramonmillan.com · 1 gsa lte evolution report, july 2016 2 cisco vni...
TRANSCRIPT

LTE Diameter Signaling Index 5th Edition S E P T E M B E R 2 0 1 6
1 | LTE DIAMETER SIGNALING INDEX 5TH EDITION
Table of Contents
Executive Summary 2
Industry Trends and Indicators 2
Oracle Communications LTE Diameter Signaling Index 2
Asia Leads The World In Diameter Signaling 5
Middle East and Africa Shows Strong Diameter Growth 6
Europe Generates 13% of the World’s Diameter Signaling 8
Eastern Europe 8
Western Europe 9
North America Diameter Networks Maturing 10
Latin America and the Caribbean Showing High Growth 11
Diameter Drivers – Use Cases That Impact Signaling 13
Diameter signaling is heavily influenced by the applications it supports. 13
Policy Management 13
VoLTE 15
LTE Broadcast 16
Connected Car 18
5G and The Future of Signaling 19
Appendix A 20
Report Methodology 20

2 | LTE DIAMETER SIGNALING INDEX 5TH EDITION
“Diameter signaling will grow to more than 565 million MPS by the year 2020. As use cases continue to evolve and networks move to the cloud, we see Diameter signaling at the forefront controlling the world’s networks for generations.”
DOUG SURIANO
VP AND GENERAL MANAGER
ORACLE COMMUNICATIONS
Executive Summary
The world’s LTE networks will generate 565 million Diameter messages per second (MPS) by the year
2020. This represents a compound annual growth rate of 53%. 4G services, as well as device types
and subscriber behavior heavily influence Diameter signaling. As LTE continues to grow, we will see
Diameter signaling increase as well, especially as new services are introduced in those networks.
LTE penetration rates will reach 40% by the year 2020 with 560 networks in service by the end of 2016
in 170 countries.1 LTE/4G traffic has finally surpassed 3G traffic in 2015 with 4G/LTE representing
47% of the total mobile data traffic in 2015. 2
Mobile data traffic grew 75% in 2015 and is projected to continue growing at a fast pace, again
impacting Diameter signaling as these data sessions require the support of policy management and
charging. 3
Industry Trends and Indicators Oracle Communications LTE Diameter Signaling Index
GLOBAL 2015 2016 2017 2018 2019 2020 CAGR
BasicPolicy 38,564,461 69,690,030 122,298,429 165,079,313 277,761,440 389,230,856 58.78%
VoLTE 14,149,022 21,064,113 40,479,528 52,704,948 64,687,168 80,670,785 41.64%
ConnectedCar 13,365,815 20,090,350 31,028,062 42,313,574 54,750,076 74,803,398 41.12%
LTEBroadcast 1,681,783 4,387,865 5,513,585 10,757,231 12,683,557 20,933,149 65.58%
TOTALMPS 67,761,081 115,232,358 199,319,604 270,855,066 409,882,241 565,638,188 52.87%
1 GSA LTE Evolution Report, July 2016 2 Cisco VNI 2016 3 Cisco VNI 2016

3 | LTE DIAMETER SIGNALING INDEX 5TH EDITION
Table 1: Global Diameter Signaling
Smart devices are outselling feature phones at a fast pace. Smart devices represented 43% of total
devices in 2015, and generated 97% of the data traffic in the wireless network. 32% of these devices
were smartphones, growing to 40% in 2020.4 Smartphones drive subscriber behaviors as Diameter
intensive data plans and smart devices drive Diameter transactions.
These data points are important to understand because these are the drivers to Diameter growth.
Subscribers (and their devices) impact how the network is used, which in turn impacts the number of
Diameter transactions we will see in the network.
The strongest growth area for Diameter signaling continues to be LTE Broadcast. As service providers
begin implementing eMBMS technology to handle the enormous demand for video on mobile devices,
Diameter signaling supporting LTE Broadcast will grow from 1.7 million MPS to 21 million MPS.
Policy continues to show strong growth in all markets, with a CAGR of 59%. We are seeing maturity in
policy management use cases, as service providers implement data plans and more sophisticated
applications. This is why we are projecting policy management signaling to grow from 38 million MPS
in 2015 to more than 389 million MPS in 2020.
We are finally seeing VoLTE become reality worldwide. VoLTE will contribute 81 million MPS to global
Diameter signaling by 2020 representing a CAGR of 42%. This is followed closely by Connected Car,
which we believe will contribute 75 million MPS by 2020.
As LTE penetration continues to increase, we are seeing Diameter signaling growth continue, although
in some regions we are also seeing this growth begin to flatten as the region reaches 100%
penetration rates and we see the applications begin to mature. However, we also see new programs
such as Smart Cities and Connected Car that reach beyond the traditional mobile handset that will
have a significant impact on Diameter signaling.
We will see M2M devices begin moving to 4G chipsets gradually, with 34% of M2M traffic using 4G by
2020.5 The growth in M2M/IoT devices moving to 4G/LTE networks will ultimately have an impact on
policy management signaling, simply by sheer volume of sessions requiring signaling.
4 Cisco VNI 2016 5 Cisco VNI 2016

4 | LTE DIAMETER SIGNALING INDEX 5TH EDITION
In this year’s report, we use new models to more closely reflect what we see occurring worldwide. For
example, the modeling for VoLTE and LTE Broadcast only include operators who have either
implemented, or have announced plans to implement these technologies. We have also taken into
consideration the maturity of LTE in all markets and how policy management is implemented.

5 | LTE DIAMETER SIGNALING INDEX 5TH EDITION
Asia Leads The World In Diameter Signaling
ASIA 2015 2016 2017 2018 2019 2020 CAGR
TOTALMPS 38,043,865 73,130,831 125,192,949 163,048,413 266,319,868 384,808,828 58.85%
Table 2: Total MPS for Asia
More than 56% of the world’s LTE connections will be in Asia by 2020.6 As we look at the amount of Diameter transactions coming from Asia, it helps to understand that only a handful of countries are generating the majority of Diameter signaling.
We see tremendous growth continuing in the region as Asia signaling grows from 38 million MPS in 2015 to 385 million MPS in 2020, for a CAGR of 59%. Asia represents 68% of the world’s Diameter signaling traffic. LTE penetration is perhaps highest in this region when you consider the number of LTE subscribers in China alone. The Cisco VNI projects this growing to 43% in 2020. However, 2G and 3G technologies continue to be the most widely implemented wireless technology in Asia.
Another factor of Diameter growth in the region is the amount of mobile data traffic generated by countries such as China, Japan, Indonesia, and India. China alone accounts for more than 50% of all LTE connections in Asia followed by these other three countries.
Consider the following list of LTE Diameter signaling in these four countries:
» China represents 55% of Diameter traffic in Asia » India represents 16% of Diameter traffic in Asia
» Japan represents 8% of Diameter traffic in Asia » Indonesia represents 5% of Diameter traffic in Asia
By the year 2020, China will generate 37% of the world’s Diameter signaling. India will follow at 11%, with Japan and Indonesia contributing 5% and 3% respectively.
Asia 2015 2016 2017 2018 2019 2020
China 26,205,332 52,621,452 82,459,537 101,944,377 158,826,296 211,494,397
Indonesia 567,817 1,682,213 3,717,785 6,038,921 11,950,097 19,512,373
Japan 5,531,155 8,763,354 12,179,449 14,572,269 22,215,943 29,057,714
India 98,392 1,146,774 3,941,391 9,401,970 26,424,406 62,332,295
Table 3: Top contributors in Asia
As the above table shows, China will generate 211 million MPS by 2020. This is followed by:
» India will generate 62 million MPS » Japan will generate 29 million MPS » Indonesia will generate 19.5 million MPS
Collectively these four countries alone will generate 322 million MPS, or 57% of the world’s Diameter traffic by the year 2020.
6 Ovum World Cellular Information Service

6 | LTE DIAMETER SIGNALING INDEX 5TH EDITION
Middle East and Africa Shows Strong Diameter Growth
ME & AFRICA 2015 2016 2017 2018 2019 2020 CAGR
TOTALMPS 1,876,380 3,120,310 5,992,332 9,106,869 14,006,849 18,611,641 58.23%
Table 4: Total MPS for Middle East & Africa
The Middle East & Africa will grow from 1.9 million MPS to 19 million MPS of Diameter signaling by 2020, representing a 58% CAGR. There are many factors contributing to this growth rate.
Like Asia, there is strong mobile data growth being projected for the region, which in turn will impact Diameter signaling. In 2015, the region saw mobile data grow by 117%. Mobile data will continue to grow at a rate of 71% CAGR by 2020.7 Today, 3% of all mobile connections are LTE, in 47 networks. This is expected to grow to 17% by 2020.8 This strong growth in mobile data and LTE connections will increase in Diameter transactions.
The challenge of spectrum and device cost continues to be a barrier for most countries. High illiteracy and a very low return on investment in more rural areas continue to prevent widespread implementations of LTE. Only 8.65% of the world’s LTE connections are in this region.
Most of the growth is occurring in the most populated areas with a strong economy. If the government chooses to subsidize mobile broadband connectivity, and the cost of devices decreases, this will have a positive impact on Diameter. 9
In the African region, Nigeria has the largest number of LTE connections, and is the largest generator of Diameter traffic creating 3 million MPS of Diameter signaling by 2020. The seven largest Diameter networks in this region and the percentage of Diameter signaling they will create by 2020 are reflected below.
» Nigeria represents 17% of the regions Diameter traffic by 2020
» Saudi Arabia represents 16% of the regions Diameter traffic » Turkey represents 14% of the regions Diameter traffic » Egypt represents 8% of the regions Diameter traffic
» Iran represents 6% of the Diameter traffic » South Africa represents 5% of the regions Diameter traffic » United Arab Emirates represents 5% of the regions Diameter traffic
7 Cisco VNI 2016 8 Ovum World Cellular Information Service 9 Ovum World Cellular Information Service

7 | LTE DIAMETER SIGNALING INDEX 5TH EDITION
ME & Africa 2015 2016 2017 2018 2019 2020
Egypt 3,385 42,526 152,548 442,760 976,295 1,560,753
Nigeria 24,891 120,081 374,267 907,589 1,947,019 3,073,219
SouthAfrica 131,924 163,519 299,180 463,647 721,143 922,747
Iran 156,177 176,793 348,690 581,055 909,047 1,092,532
SaudiArabia 433,125 828,602 1,396,218 1,908,577 2,592,216 2,907,247
Turkey - 257,894 662,812 1,191,695 1,971,959 2,593,950
UnitedArabEmirates 199,647 287,870 483,388 655,655 894,294 1,001,878
Table 5: Top contributors in Middle East & Africa
Nigeria will contribute the most MPS for the region by 2020 at 3 million MPS. This is followed by Saudi Arabia with 3 million MPS. This is an interesting comparison when you consider that Nigeria has a much larger population than Saudi Arabia, but it is anticipated that Saudi Arabia will have more sophisticated applications and data plans, creating many more Diameter transactions than typical.
» Nigeria will generate 3 million MPS by 2020 » Saudi Arabia will generate 3 million MPS by 2020 » Egypt will generate 1.5 million MPS
» South Africa will generate 922 thousand MPS » Iran will generate 1 million MPS » Turkey will generate 2.6 million MPS
» UAE will generate 1 million MPS
Collectively these seven nations will generate 13 million MPS by 2020, or 2% of the world’s Diameter signaling.

8 | LTE DIAMETER SIGNALING INDEX 5TH EDITION
Europe Generates 12% of the World’s Diameter Signaling
Europe represents two different pictures of LTE. Countries such as Russia in Eastern Europe represent a large portion of the Diameter signaling for the region. We split Europe between the East and West to provide better modeling.
Eastern Europe
EASTERN EUROPE 2015 2016 2017 2018 2019 2020 CAGR
TOTALMPS 1,387,231 2,910,716 6,323,222 10,237,364 19,294,400 32,910,099 88.38%
Table 6: Total MPS for Eastern Europe
Eastern Europe generates 5.82% of the global Diameter signaling traffic. The majority of this traffic is coming from Russia. Below are the largest contributors of Diameter signaling in the region.
» Russia will generate 65.55% of the regions Diameter signaling by 2020
» Poland will generate 19.32% of the regions Diameter traffic » Romania will generate 8.32% of the regions Diameter traffic » Ukraine will generate 6.07% of the regions Diameter traffic
Collectively, these four countries account for 5.78% of the world’s Diameter signaling traffic.
Eastern Europe 2015 2016 2017 2018 2019 2020
Poland 334,765 1,004,236 1,885,998 2,893,305 4,417,198 6,357,955
Romania 156,259 236,163 498,942 851,689 1,532,150 2,737,906
Russia 745,513 1,657,136 3,530,159 6,512,164 12,215,428 21,573,657
Ukraine 43,921 62,816 83,386 237,668 705,761 1,998,611
TotalMPS 1,280,458 2,960,351 5,998,485 10,494,826 18,870,537 32,668,129
Table 7: Top contributors in Eastern Europe
Eastern Europe creates 1.4 million MPS of Diameter signaling, growing to 33 million MPS by 2020. This represents a CAGR of 88%. If we break out the top producers of Diameter signaling in Eastern Europe, we are looking at 4 countries. Russia is by far the biggest producer of Diameter traffic, followed by Poland.
» Russia will generate 22 million MPS by 2020 » Poland will generate 6 million MPS by 2020
» Romania will generate 3 million MPS by 2020 » Ukraine will generate 2 million MPS by 2020
Collectively these four countries generate 33 million MPS of Diameter signaling by the year 2020.

9 | LTE DIAMETER SIGNALING INDEX 5TH EDITION
Western Europe
WESTERN EUROPE 2015 2016 2017 2018 2019 2020 CAGR
TOTALMPS 5,123,711 8,527,708 15,168,008 24,204,772 29,895,761 34,065,445 46.06%
Table 8: Total MPS for Western Europe
Western Europe generates 5 million MPS in 2015, growing to 34 million MPS by 2020 for a CAGR of 46%. There is still plenty of opportunity for growth as LTE penetration only reached 23% in 2015. This will grow to just over 53% by 2020.10
The region saw its mobile data grow by 52% in 201511, which should be reflected in Diameter growth year over year. Five countries represent the top producers of Diameter signaling.
» France will generate 16% of the regions Diameter signaling by 2020 » Germany will generate 30% of the regions Diameter signaling
» Italy will generate 18% of the regions Diameter signaling » Spain will generate 12% of the regions Diameter signaling » The United Kingdom will generate 22% of the regions Diameter signaling
Western Europe will generate 6% of the world’s Diameter signaling traffic by 2020.
Western Europe 2015 2016 2017 2018 2019 2020
France 877,572 1,556,206 2,502,389 4,192,536 4,984,820 5,566,694
Germany 1,005,475 2,025,203 3,570,220 6,518,800 8,460,633 10,194,715
Italy 503,986 1,126,945 2,120,676 4,000,816 5,229,681 6,285,151
Spain 683,854 1,081,068 1,751,818 2,993,629 3,618,368 4,031,186
UnitedKingdom 1,441,202 2,564,619 3,754,904 5,955,762 6,852,438 7,436,500
TotalMPS 4,512,089 8,354,041 13,700,007 23,661,543 29,145,940 33,514,246
Table 9: Top contributors in Western Europe
By the year 2020, Germany will be the top producer of Diameter MPS in the region, followed by Italy.
» Germany will generate 10 million MPS of Diameter signaling by 2020
» Italy will generate 6 million MPS of Diameter signaling » France will generate 6 million MPS of Diameter signaling » The United Kingdom will generate 7 million MPS of Diameter signaling
» Spain will generate 4 million MPS of Diameter signaling
Collectively these countries will generate 34 million MPS of Diameter signaling by 2020.
10 Ovum World Cellular Information Service 11 Cisco VNI 2016

10 | LTE DIAMETER SIGNALING INDEX 5TH EDITION
North America Diameter Networks Maturing
NORTH AMERICA 2015 2016 2017 2018 2019 2020 CAGR
TOTALMPS 19,796,476 24,845,744 41,731,167 55,848,798 68,486,807 79,625,280 32.10%
Table 10: Total MPS for North America
North America leads the world in LTE penetration as its service providers move aggressively to sunset 2G and 3G services. It is projected that 59% of connections in the United States will be 4G/LTE by the year 2020.12 This shows a maturing market that will be generating a lot of Diameter traffic in the years to come.
The United States represents the largest Diameter traffic generator in the region producing 95% of the regions signaling by the year 2020. This represents 13% of the world’s Diameter signaling.
North America 2015 2016 2017 2018 2019 2020
UnitedStates 16,809,747 21,850,287 36,686,346 50,629,532 61,888,971 76,020,392
TotalMPS 16,809,747 21,850,287 36,686,346 50,629,532 61,888,971 76,020,392
Table 11: Top contributors in North America
North America generates 20 million MPS in 2015, more than tripling to 80 million MPS by 2020.
12 Ovum World Cellular Information Service

11 | LTE DIAMETER SIGNALING INDEX 5TH EDITION
Latin America and the Caribbean Showing High Growth
LAD & CARIBE 2015 2016 2017 2018 2019 2020 CAGR
TOTALMPS 1,533,418 2,697,049 4,911,926 8,408,850 11,878,556 15,616,895 59.07%
Table 12: Total MPS for Latin America and the Caribbean
Latin America and the Caribbean continue to show slow but steady growth in Diameter networks. The region will generate 15.6 million MPS by 2020 at a CAGR of 59%. This is only 3% of the world’s Diameter traffic but changes in the telecommunications sector in the region bring promises of more growth.
In Mexico, a new player may add more sophisticated services to the area, while frequency auctions in Argentina show LTE growth. Brazil is talking about new broadband infrastructure but with the local economy in the state it is in today, that promise may never develop. There are currently 63 LTE networks in the region, with 14 networks in the planning phase. 13
In 2015, only 4% of the connections were LTE, although this is projected to reach 32% by 2020.14 The largest contributor of Diameter signaling continues to be Brazil, generating 63% of the regions Diameter signaling by 2020. Mexico produces 28% of the regions Diameter signaling by 2020.
» Brazil will generate 63% of the regions Diameter signaling by the year 2020 » Mexico will generate 28% of the regions Diameter signaling » Argentina will generate 13% of the regions Diameter signaling
» Colombia will generate 13% of the regions Diameter signaling » Peru will generate 8% of the regions Diameter signaling
LAD & Caribe 2015 2016 2017 2018 2019 2020
Argentina 163,066 311,783 614,464 1,013,199 1,534,591 2,017,219
Brazil 978,722 1,990,059 3,357,749 5,337,335 7,793,422 9,856,164
Colombia 167,863 276,211 570,226 974,839 1,515,686 2,004,175
Mexico 266,985 573,641 1,103,500 2,021,464 3,165,358 4,316,892
Peru 134,427 268,126 456,279 747,519 1,088,496 1,305,083
TotalMPS 1,711,063 3,419,820 6,102,218 10,094,356 15,097,553 19,499,533
Table 13: Top contributors in Latin America and the Caribbean
13 Ovum World Cellular Information Service 14 Cisco VNI 2016

12 | LTE DIAMETER SIGNALING INDEX 5TH EDITION
When it comes to Diameter MPS, Brazil leads the region with 979 thousand MPS in 2015, growing to 10 million MPS by 2020. Mexico generated 267 thousand MPS in 2015 and is expected to create 4.3 million MPS by 2020.
» Brazil will generate 10 million MPS of Diameter signaling by 2020
» Mexico will generate 4.3 million MPS of Diameter signaling » Argentina will generate 2 million MPS of Diameter signaling » Colombia will generate 2 million MPS of Diameter signaling
» Peru will generate 1.3 million MPS of Diameter signaling
Collectively these five countries will generate 19.5 million MPS of Diameter signaling by the year 2020, representing 4% of the world’s Diameter signaling.
13 | LTE DIAMETER SIGNALING INDEX 5TH EDITION
Diameter Drivers – Use Cases That Impact Signaling
Diameter signaling is heavily influenced by the applications it supports.
For example, for a mobile device to connect to the network and request a data connection there is minimal Diameter transactions. But if we look at LTE Broadcast, we can see that there are many Diameter transactions required to deliver the service to a single device.
As we have been saying from the beginning, to calculate Diameter growth, there are many variables that must be taken into consideration. The use case is the largest consideration. This is why we have separated the use cases from the regional data in this years index. We hope to put more focus on the impact of these use cases.
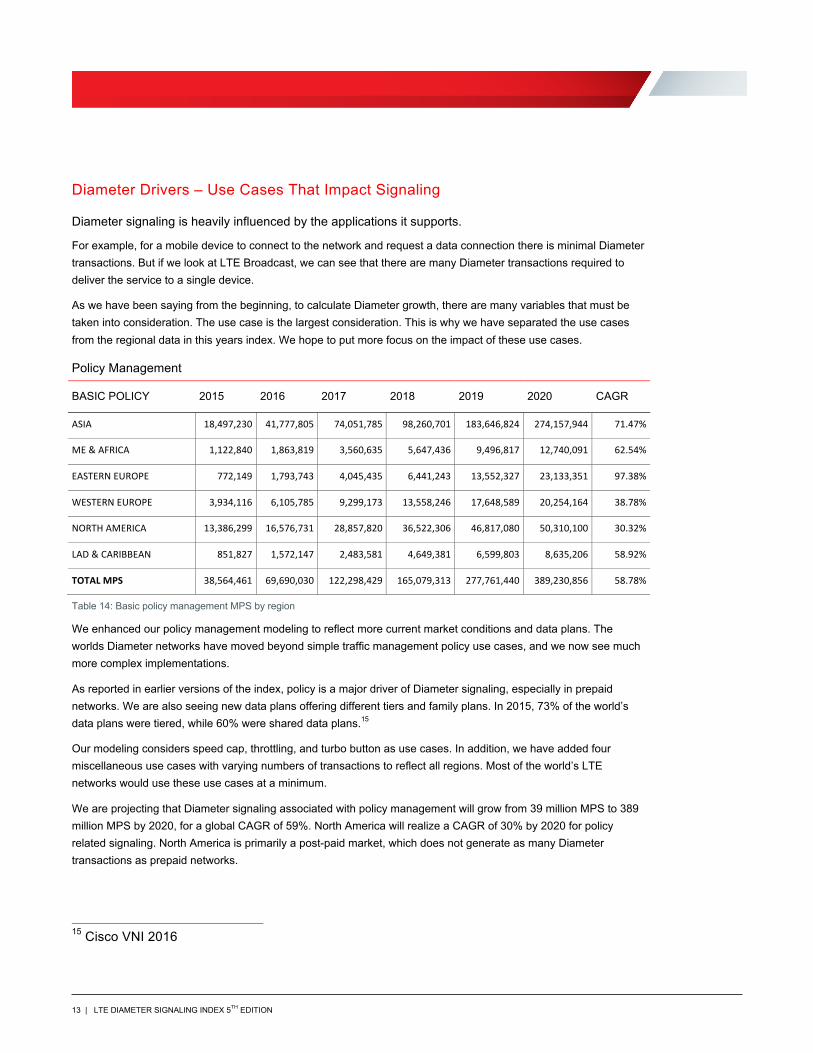
Policy Management
BASIC POLICY 2015 2016 2017 2018 2019 2020 CAGR
ASIA 18,497,230 41,777,805 74,051,785 98,260,701 183,646,824 274,157,944 71.47%
ME&AFRICA 1,122,840 1,863,819 3,560,635 5,647,436 9,496,817 12,740,091 62.54%
EASTERNEUROPE 772,149 1,793,743 4,045,435 6,441,243 13,552,327 23,133,351 97.38%
WESTERNEUROPE 3,934,116 6,105,785 9,299,173 13,558,246 17,648,589 20,254,164 38.78%
NORTHAMERICA 13,386,299 16,576,731 28,857,820 36,522,306 46,817,080 50,310,100 30.32%
LAD&CARIBBEAN 851,827 1,572,147 2,483,581 4,649,381 6,599,803 8,635,206 58.92%
TOTALMPS 38,564,461 69,690,030 122,298,429 165,079,313 277,761,440 389,230,856 58.78%
Table 14: Basic policy management MPS by region
We enhanced our policy management modeling to reflect more current market conditions and data plans. The worlds Diameter networks have moved beyond simple traffic management policy use cases, and we now see much more complex implementations.
As reported in earlier versions of the index, policy is a major driver of Diameter signaling, especially in prepaid networks. We are also seeing new data plans offering different tiers and family plans. In 2015, 73% of the world’s data plans were tiered, while 60% were shared data plans.15
Our modeling considers speed cap, throttling, and turbo button as use cases. In addition, we have added four miscellaneous use cases with varying numbers of transactions to reflect all regions. Most of the world’s LTE networks would use these use cases at a minimum.
We are projecting that Diameter signaling associated with policy management will grow from 39 million MPS to 389 million MPS by 2020, for a global CAGR of 59%. North America will realize a CAGR of 30% by 2020 for policy related signaling. North America is primarily a post-paid market, which does not generate as many Diameter transactions as prepaid networks.
15 Cisco VNI 2016
14 | LTE DIAMETER SIGNALING INDEX 5TH EDITION
We are projecting the following growth for policy management Diameter signaling globally by 2020:
» Asia generated 18.5 million MPS in 2015 growing to 274 million MPS by 2020 for a CAGR of 71% » Eastern Europe generated 772 thousand MPS in 2015 growing to 23 million MPS by 2020 for a CAGR of 97%
» ME & Africa generated 1.1 million MPS in 2015 growing to 13 million MPS by 2020 for a CAGR of 63% » Latin America & Caribe generated 851 thousand MPS in 2015 growing to 8.6 million MPS for a CAGR of 59% » Western Europe generated 3.9 million MPS in 2015 growing to 20 million MPS for a CAGR of 39%
Globally, policy management Diameter signaling will grow from 39 million MPS in 2015 to 389 million MPS in 2020, for a CAGR of 59%.

15 | LTE DIAMETER SIGNALING INDEX 5TH EDITION
VoLTE
GLOBAL 2015 2016 2017 2018 2019 2020 CAGR
ASIA 10,250,578 16,432,304 30,915,507 39,285,174 48,602,783 61,646,277 43.16%
ME&AFRICA 319,633 615,051 1,370,597 1,892,400 2,277,100 2,876,354 55.18%
EASTERNEUROPE 43,351 105,921 522,994 952,699 1,443,084 2,439,696 123.91%
WESTERNEUROPE 359,560 632,630 2,695,243 4,294,211 4,879,502 5,490,220 72.49%
NORTHAMERICA 3,175,899 3,278,206 4,432,744 5,507,371 6,483,672 6,949,962 16.96%
LAD&CARIBBEAN 0 0 542,443 773,093 1,001,027 1,268,276 NA
TOTALMPS 14,149,022 21,064,113 40,479,528 52,704,948 64,687,168 80,670,785 41.64%
Table 15: VoLTE MPS by region
VoLTE is finally becoming a reality with 55 networks deployed in 88 countries. There are 56 networks either in deployment or planning to deploy VoLTE in 39 countries.16 The modeling used in this index only considers the networks either already deployed or in planning phase. We are projecting that VoLTE will grow from 14 million MPS to 81 million MPS by 2020 for a CAGR of 42%.
» North America generated 3 million MPS in 2015 growing to 6.9 million MPS in 2020 for a CAGR of 17% » Asia generated 10 million MPS in 2015 growing to 62 million MPS in 2020 for a CAGR of 43%
» Eastern Europe generated 43 thousand MPS in 2015 growing to 2.4 million MPS in 2020 for a CAGR of 124% » ME & Africa generated 320 thousand MPS in 2015 growing to 2.9 million MPS in 2020 for a CAGR of 55% » Western Europe generated 359 thousand MPS in 2015 growing to 5.5 million MPS in 2020 for a CAGR of 72%
Latin America & the Caribbean will not be implementing VoLTE until 2017 when they are projected to generate 542 thousand MPS, growing to 1.3 million MPS by 2020. There is not enough history to calculate CAGR.
16 GSA “Evolution to LTE Report, VoLTE Global Deployments,” April 8 2016

16 | LTE DIAMETER SIGNALING INDEX 5TH EDITION
LTE Broadcast
GLOBAL 2015 2016 2017 2018 2019 2020 CAGR
ASIA 417,155 616,728 827,328 1,051,644 1,344,892 1,777,730 33.63%
ME&AFRICA 8,163 18,015 25,648 43,359 50,621 56,292 47.14%
EASTERNEUROPE 43,881 122,921 208,872 467,612 736,583 1,278,988 96.30%
WESTERNEUROPE 402,771 1,160,658 1,564,109 3,131,898 3,584,682 3,982,049 58.13%
NORTHAMERICA 809,812 2,408,383 2,682,789 5,709,124 6,166,251 12,672,447 73.34%
LAD&CARIBBEAN 0 61,160 204,839 353,594 800,528 1,165,643 NA
TOTALMPS 1,681,783 4,387,865 5,513,585 10,757,231 12,683,557 20,933,149 65.58%
Table 16: LTE Broadcast MPS by region
More than 55% of mobile data reported in 2015 was video, which will grow to 75% by the year 2020.17 This presents a major challenge to service providers as they seek a more efficient method of distributing video while optimizing their infrastructure. LTE Broadcast answers this call.
LTE Broadcast uses evolved Multimedia Broadcast Multicast Service (eMBMS) technology to more efficiently deliver video or other content from one source to multiple devices within a cell or a core network. The largest barrier to LTE Broadcast has been a lack of devices that support the technology, but there are now 97 devices supporting eMBMS, with additional devices being developed.
We included all regions in our modeling that were planning for eMBMS and calculated the MPS as if they had already deployed the technology. This gives us the ability to calculate a CAGR for LTE Broadcast. The only exception to this was Latin America and the Caribbean. West Europe service providers are either in trial or planning to implement eMBMS in 13 networks, 7 different countries. Asia follows with 11 networks in 7 different countries.18
LTE Broadcast is used for a number of different services, including:
» HD Mobile TV
» Pre-distribution of content such as software releases » Real-time traffic reports, parking space locators and safety services for Connected Cars » Sports broadcasts with statistics, replays, merchandise offers and more
» Emergency Services alerts and announcements » Digital signage (electronic billboards)
This index only takes into account the networks already deployed and those networks that have announced plans for eMBMS in its modeling.
17 Cisco VNI 2016 18 GSA “LTE Broadcast Pulse Check,” April 27 2016

17 | LTE DIAMETER SIGNALING INDEX 5TH EDITION
LTE Broadcast generates a lot more Diameter transactions than other Diameter applications, and has the biggest impact on signaling. This is reflected in our modeling below.
» Asia generated 417 thousand MPS in 2015 growing to 1.8 million MPS in 2020 for a CAGR of 34%
» ME & Africa generated 8 thousand MPS in 2015 growing to 56 thousand MPS in 2020 for a CAGR of 47% » Eastern Europe generated 43 thousand MPS in 2015 growing to 1.3 million MPS in 2020 for a CAGR of 96% » Western Europe generated 402 thousand MPS in 2015 growing to 4 million MPS in 2020 for a CAGR of 58%
» North America generated 809 thousand MPS in 2015 growing to 13 million MPS in 2020 for a CAGR of 73%
Latin America & the Caribbean are not projected to implement LTE Broadcast until 2016, generating 61 thousand MPS in its first year. We project that this will increase to 1.2 million MPS by 2020. There is not enough data to calculate a CAGR. We have projected 21 million Diameter MPS for LTE Broadcast globally.
18 | LTE DIAMETER SIGNALING INDEX 5TH EDITION
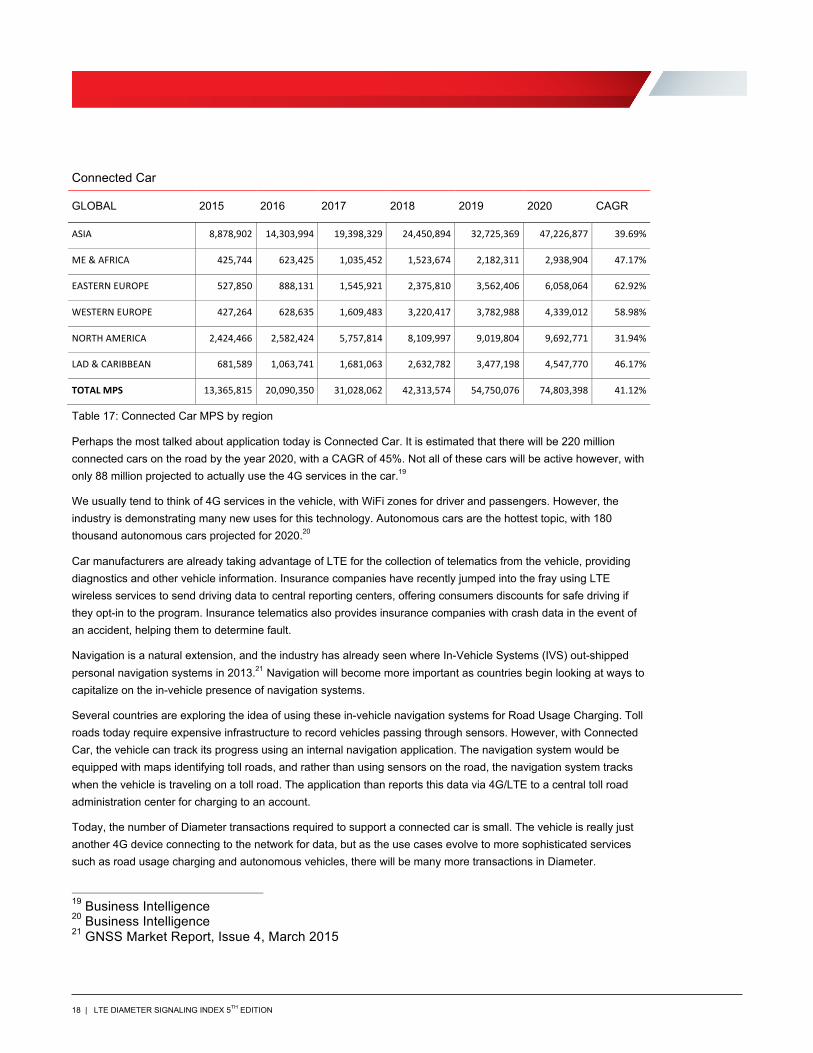
Connected Car
GLOBAL 2015 2016 2017 2018 2019 2020 CAGR
ASIA 8,878,902 14,303,994 19,398,329 24,450,894 32,725,369 47,226,877 39.69%
ME&AFRICA 425,744 623,425 1,035,452 1,523,674 2,182,311 2,938,904 47.17%
EASTERNEUROPE 527,850 888,131 1,545,921 2,375,810 3,562,406 6,058,064 62.92%
WESTERNEUROPE 427,264 628,635 1,609,483 3,220,417 3,782,988 4,339,012 58.98%
NORTHAMERICA 2,424,466 2,582,424 5,757,814 8,109,997 9,019,804 9,692,771 31.94%
LAD&CARIBBEAN 681,589 1,063,741 1,681,063 2,632,782 3,477,198 4,547,770 46.17%
TOTALMPS 13,365,815 20,090,350 31,028,062 42,313,574 54,750,076 74,803,398 41.12%
Table 17: Connected Car MPS by region
Perhaps the most talked about application today is Connected Car. It is estimated that there will be 220 million connected cars on the road by the year 2020, with a CAGR of 45%. Not all of these cars will be active however, with only 88 million projected to actually use the 4G services in the car.19
We usually tend to think of 4G services in the vehicle, with WiFi zones for driver and passengers. However, the industry is demonstrating many new uses for this technology. Autonomous cars are the hottest topic, with 180 thousand autonomous cars projected for 2020.20
Car manufacturers are already taking advantage of LTE for the collection of telematics from the vehicle, providing diagnostics and other vehicle information. Insurance companies have recently jumped into the fray using LTE wireless services to send driving data to central reporting centers, offering consumers discounts for safe driving if they opt-in to the program. Insurance telematics also provides insurance companies with crash data in the event of an accident, helping them to determine fault.
Navigation is a natural extension, and the industry has already seen where In-Vehicle Systems (IVS) out-shipped personal navigation systems in 2013.21 Navigation will become more important as countries begin looking at ways to capitalize on the in-vehicle presence of navigation systems.
Several countries are exploring the idea of using these in-vehicle navigation systems for Road Usage Charging. Toll roads today require expensive infrastructure to record vehicles passing through sensors. However, with Connected Car, the vehicle can track its progress using an internal navigation application. The navigation system would be equipped with maps identifying toll roads, and rather than using sensors on the road, the navigation system tracks when the vehicle is traveling on a toll road. The application than reports this data via 4G/LTE to a central toll road administration center for charging to an account.
Today, the number of Diameter transactions required to support a connected car is small. The vehicle is really just another 4G device connecting to the network for data, but as the use cases evolve to more sophisticated services such as road usage charging and autonomous vehicles, there will be many more transactions in Diameter.
19 Business Intelligence 20 Business Intelligence 21 GNSS Market Report, Issue 4, March 2015

19 | LTE DIAMETER SIGNALING INDEX 5TH EDITION
Our modeling projects Asia leading the world in Diameter MPS for Connected Car, followed by North America.
» Asia generated 8.9 million MPS in 2015 growing to 47 million MPS in 2020 for a CAGR of 40% » ME & Africa generated 425 thousand MPS in 2015 growing to 2.9 million MPS in 2020 for a CAGR of 47%
» Eastern Europe generated 527 thousand MPS in 2015 growing to 6 million MPS by 2020 for a CAGR of 63% » Western Europe generated 427 thousand MPS in 2015 growing to 4.3 million MPS by 2020 for a CAGR of 59% » North America generated 2.4 million MPS in 2015 growing to 9.7 million MPS in 2020 for a CAGR of 32%
» LAD & Caribbean generated 681 thousand MPS in 2015 growing to 4.5 million MPS in 2020 for a CAGR of 46%
We project that globally connected cars will generate 75 million MPS of Diameter signaling by the year 2020 for a CAGR of 41%
5G and The Future of Signaling Signaling is an important function within the telecommunications network, and the introduction of virtual networks does nothing to diminish this role. We will continue to see an increase in the use of Diameter and Session Initiation Protocol (SIP) signaling, as these are the command and control of the wireless networks.
The fact that we virtualize these networks does not eliminate the need for signaling. The real question becomes how quickly Diameter will replace Signaling System #7 (SS7) in the world’s networks, going well beyond the 40% penetration rate predicted by 2020.
We are still seeing a lot of demand for SS7 signaling in many different markets. We do not believe that SS7 is going to be eliminated by 2020, nor do we believe SS7 will go away by 2030. There is still a lot of use for SS7 signaling in the world’s’ wireless networks, as well as fixed line. There will be a co-existence between Diameter and SS7, where the Diameter signaling will be supporting premium networks while SS7 is relegated to non-premium networks.
We continue to see strong growth in HSPA technology as an alternative to LTE. HSPA of course is a 3G technology, supported by SS7. In some developing countries, we see this growth continue well through 2020, but this does not mean Diameter will not continue to enjoy wide spread implementation and growth. It is more likely that we will see Diameter reach a penetration rate of over 60%, but never 100%.
When we look at other initiatives in our industry such as Smart Cities and Connected Cars, it becomes obvious that Diameter will be key as the signaling protocol to enable these initiatives to work. The role of Diameter is increasing, and will continue to increase as these initiatives mature. This is where we see the most growth for Diameter signaling.
Diameter was built for the cloud. It is an easy migration from big iron to cloud when working with Diameter components, and a natural extension to other functions in the cloud. As more service providers begin implementing their cloud services, Diameter will be there. Telco in the cloud will be a fast growing segment in our industry and Diameter an enabler for many new cloud services.

20 | LTE DIAMETER SIGNALING INDEX 5TH EDITION
Appendix A
Report Methodology Our modeling uses LTE connections as the base for calculations. We take into consideration the Diameter interfaces and transactions required to support various use cases. These assumptions are built into our models. The models also take into consideration data from our LTE experience where possible (such as average number of PDN connections per hour, etc).
The use cases were chosen based on their impact to LTE Diameter signaling. Sometimes there are many variables to take into account, depending on the type of access, session modifications, and credit control. We build the basic Diameter requirements to establishing a service for the use case, and do not take into account the many variables. This means our report is conservative in its view, and the actual MPS for Diameter signaling is likely higher than our projections.
The forecast period shifts every year, as this Index considers growth beginning in 2015 extending through 2020. Because 2015 saw higher penetration rates in some regions than previously projected, the overall CAGR for Diameter changed accordingly.
The Index is an LTE Diameter traffic demand model rather than an engineered network model. It is a baseline model that serves as a starting point from which service providers can layer on additional factors such as network architecture, topology, capacity requirements, geo-redundancy and others needed to design a robust, reliable and scalable Diameter network. Readers are cautioned not to rely solely on this macro-level analysis to predict their unique needs.
The Index focuses solely on LTE networks and does not account for Diameter traffic on 3G networks, other than 3G-to-4G mobility. The Index also excludes IMS applications with the exception of VoLTE.
The Oracle Communications LTE Diameter Signaling Index relies on a number of industry resources such as LTE subscriber data from Ovum, industry trends from GSA, and the Cisco Visual Networking Index for general market context. IETF, 3GPP and GSM Association specifications are used for determining traffic flows for each unique service. The flows are then used to determine the number of Diameter messages that are created for individual session types. These are then applied to complex traffic models based on a number of different factors.
In this report and forecast, we use the industry standard metric of messages per second (MPS) for the volume of signaling traffic in a network. The 3GPP standards refer to Diameter transactions as two messages (request/answer). In this Index the total number of Diameter messages is counted in the MPS.

Oracle Corporation, World Headquarters Worldwide Inquiries 500 Oracle Parkway Phone: +1.650.506.7000 Redwood Shores, CA 94065, USA Fax: +1.650.506.7200
Copyright © 2016, Oracle and/or its affiliates. All rights reserved. This document is provided for information purposes only, and the contents hereof are subject to change without notice. This document is not warranted to be error-free, nor subject to any other warranties or conditions, whether expressed orally or implied in law, including implied warranties and conditions of merchantability or fitness for a particular purpose. We specifically disclaim any liability with respect to this document, and no contractual obligations are formed either directly or indirectly by this document. This document may not be reproduced or transmitted in any form or by any means, electronic or mechanical, for any purpose, without our prior written permission. Oracle and Java are registered trademarks of Oracle and/or its affiliates. Other names may be trademarks of their respective owners. Intel and Intel Xeon are trademarks or registered trademarks of Intel Corporation. All SPARC trademarks are used under license and are trademarks or registered trademarks of SPARC International, Inc. AMD, Opteron, the AMD logo, and the AMD Opteron logo are trademarks or registered trademarks of Advanced Micro Devices. UNIX is a registered trademark of The Open Group. 0116 Oracle Communications LTE Diameter Signaling Index September 2016 Author: Travis Russell
C O N N E C T W I T H U S
blogs.oracle.com/oracle
facebook.com/oracle
twitter.com/oracle
oracle.com