lucent technologies annual report 2003 (.pdf - alcatel-lucent
TRANSCRIPT
L U C E N T T E C H N O L O G I E S
2 0 0 3 A N N U A L R E P O R T
N O T I C E O F 2 0 0 4 A N N U A L M E E T I N G
A N D P R O X Y S T A T E M E N T
Lucent Technologies designs and delivers the systems, services and software that drive
next-generation communications networks. Backed by Bell Labs research and development,
Lucent uses its strengths in mobility, optical, software, data and voice networking
technologies, as well as services, to create new revenue-generating opportunities for its
customers, while enabling them to quickly deploy and better manage their networks.
Lucent’s customer base includes communications service providers, governments and
enterprises worldwide.
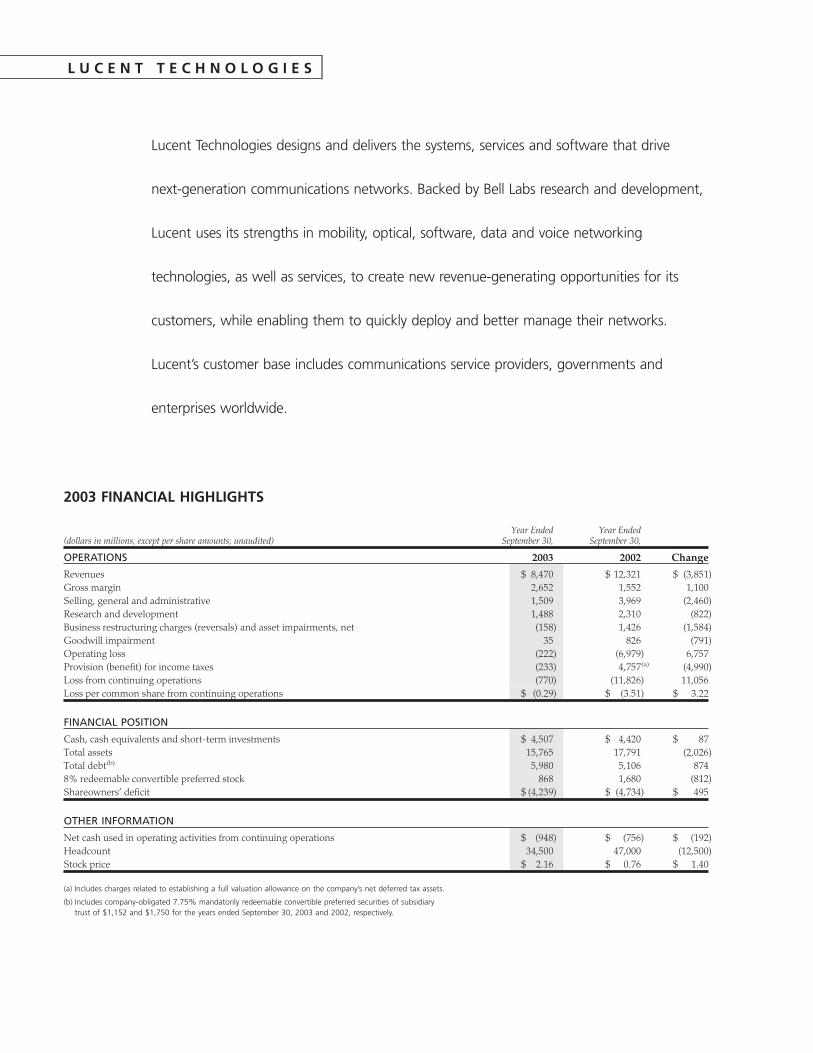
2003 FINANCIAL HIGHLIGHTS
(dollars in millions, except per share amounts; unaudited)Year Ended
September 30,Year Ended
September 30,
OPERATIONS 2003 2002 Change
Revenues $ 8,470 $ 12,321 $ (3,851)Gross margin 2,652 1,552 1,100Selling, general and administrative 1,509 3,969 (2,460)Research and development 1,488 2,310 (822)Business restructuring charges (reversals) and asset impairments, net (158) 1,426 (1,584)Goodwill impairment 35 826 (791)Operating loss (222) (6,979) 6,757Provision (benefit) for income taxes (233) 4,757(a) (4,990)Loss from continuing operations (770) (11,826) 11,056Loss per common share from continuing operations $ (0.29) $ (3.51) $ 3.22
FINANCIAL POSITION
Cash, cash equivalents and short-term investments $ 4,507 $ 4,420 $ 87Total assets 15,765 17,791 (2,026)Total debt(b) 5,980 5,106 8748% redeemable convertible preferred stock 868 1,680 (812)Shareowners’ deficit $ (4,239) $ (4,734) $ 495
OTHER INFORMATION
Net cash used in operating activities from continuing operations $ (948) $ (756) $ (192)Headcount 34,500 47,000 (12,500)Stock price $ 2.16 $ 0.76 $ 1.40
(a) Includes charges related to establishing a full valuation allowance on the company’s net deferred tax assets.
(b) Includes company-obligated 7.75% mandatorily redeemable convertible preferred securities of subsidiarytrust of $1,152 and $1,750 for the years ended September 30, 2003 and 2002, respectively.
L U C E N T T E C H N O L O G I E S
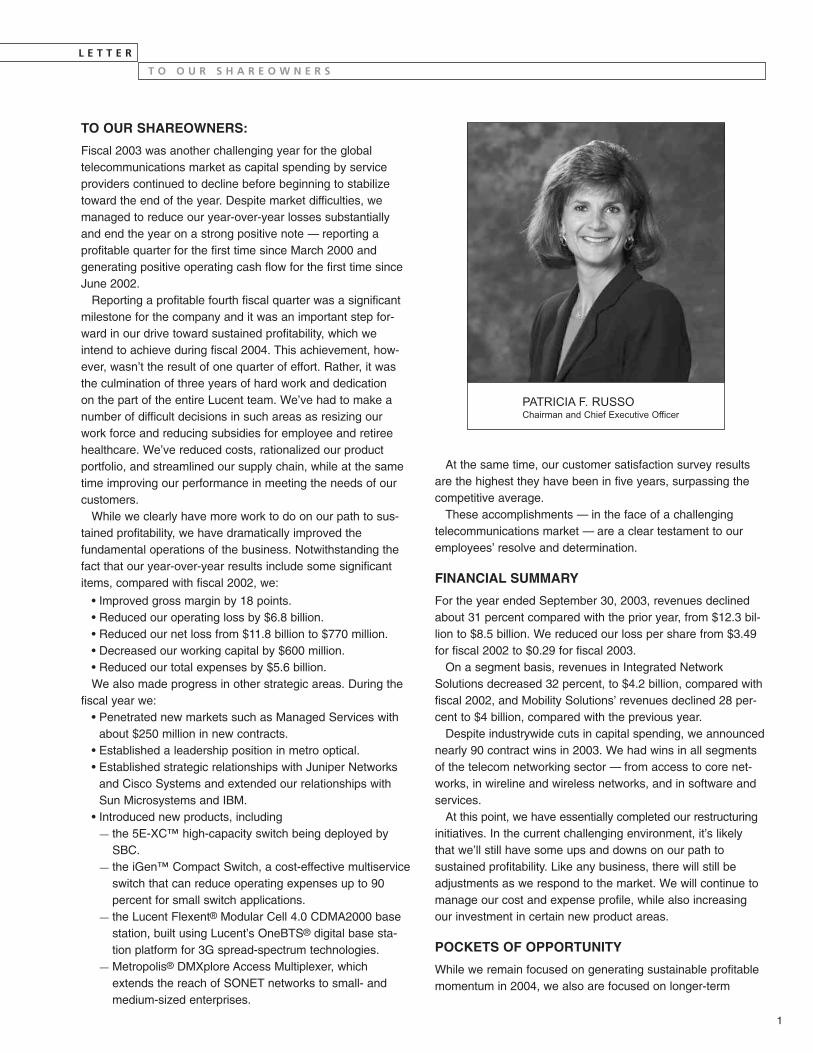
TO OUR SHAREOWNERS:
Fiscal 2003 was another challenging year for the globaltelecommunications market as capital spending by serviceproviders continued to decline before beginning to stabilizetoward the end of the year. Despite market difficulties, wemanaged to reduce our year-over-year losses substantiallyand end the year on a strong positive note — reporting aprofitable quarter for the first time since March 2000 andgenerating positive operating cash flow for the first time sinceJune 2002.
Reporting a profitable fourth fiscal quarter was a significantmilestone for the company and it was an important step for-ward in our drive toward sustained profitability, which weintend to achieve during fiscal 2004. This achievement, how-ever, wasn’t the result of one quarter of effort. Rather, it wasthe culmination of three years of hard work and dedication on the part of the entire Lucent team. We’ve had to make anumber of difficult decisions in such areas as resizing ourwork force and reducing subsidies for employee and retireehealthcare. We’ve reduced costs, rationalized our product portfolio, and streamlined our supply chain, while at the sametime improving our performance in meeting the needs of ourcustomers.
While we clearly have more work to do on our path to sus-tained profitability, we have dramatically improved thefundamental operations of the business. Notwithstanding thefact that our year-over-year results include some significantitems, compared with fiscal 2002, we:
• Improved gross margin by 18 points.• Reduced our operating loss by $6.8 billion.• Reduced our net loss from $11.8 billion to $770 million.• Decreased our working capital by $600 million.• Reduced our total expenses by $5.6 billion.We also made progress in other strategic areas. During the
fiscal year we:• Penetrated new markets such as Managed Services with
about $250 million in new contracts.• Established a leadership position in metro optical.• Established strategic relationships with Juniper Networks
and Cisco Systems and extended our relationships withSun Microsystems and IBM.
• Introduced new products, including— the 5E-XC™ high-capacity switch being deployed by
SBC.— the iGen™ Compact Switch, a cost-effective multiservice
switch that can reduce operating expenses up to 90 percent for small switch applications.
— the Lucent Flexent® Modular Cell 4.0 CDMA2000 basestation, built using Lucent’s OneBTS® digital base sta-tion platform for 3G spread-spectrum technologies.
— Metropolis® DMXplore Access Multiplexer, whichextends the reach of SONET networks to small- andmedium-sized enterprises.
At the same time, our customer satisfaction survey resultsare the highest they have been in five years, surpassing thecompetitive average.
These accomplishments — in the face of a challengingtelecommunications market — are a clear testament to ouremployees’ resolve and determination.
FINANCIAL SUMMARY
For the year ended September 30, 2003, revenues declinedabout 31 percent compared with the prior year, from $12.3 bil-lion to $8.5 billion. We reduced our loss per share from $3.49for fiscal 2002 to $0.29 for fiscal 2003.
On a segment basis, revenues in Integrated NetworkSolutions decreased 32 percent, to $4.2 billion, compared withfiscal 2002, and Mobility Solutions’ revenues declined 28 per-cent to $4 billion, compared with the previous year.
Despite industrywide cuts in capital spending, we announcednearly 90 contract wins in 2003. We had wins in all segmentsof the telecom networking sector — from access to core net-works, in wireline and wireless networks, and in software andservices.
At this point, we have essentially completed our restructuringinitiatives. In the current challenging environment, it’s likelythat we’ll still have some ups and downs on our path to sustained profitability. Like any business, there will still beadjustments as we respond to the market. We will continue tomanage our cost and expense profile, while also increasingour investment in certain new product areas.
POCKETS OF OPPORTUNITY
While we remain focused on generating sustainable profitablemomentum in 2004, we also are focused on longer-term
1
PATRICIA F. RUSSOChairman and Chief Executive Officer
L E T T E R
T O O U R S H A R E O W N E R S
L E T T E R
T O O U R S H A R E O W N E R S
challenges in terms of the opportunities they present. We haveidentified pockets of opportunity that could drive near-termgrowth in markets such as voice over Internet protocol (VoIP) and softswitch, metro optical, broadband access, high-speed wireless data and services. Our product portfolio iswell-positioned to capitalize on these opportunities.
We also have implemented plans to broaden our revenuebase into areas such as Managed and Professional Services,government and certain other markets outside the UnitedStates. In addition, we’re expanding our reach with about 200partners in 50 countries around the world. Through our GlobalBusiness Partners program, in 2003 we won several opticaland VoIP contracts in Europe, as well as contracts for our optical products in China.
INTEGRATED NETWORK SOLUTIONS
We see opportunities in the VoIP and softswitch markets, eventhough they are in their early stages, and we expect thesemarkets will grow and evolve over many years. To addressthese opportunities, we recently unveiled our Accelerate™portfolio to help our customers deploy VoIP services and net-works. Anchored by our newly launched 5E-XC switch, whichtriples the capacity of the existing 5ESS® switch, Accelerate isall about speed. These solutions put our customers on anaccelerated path to an all-IP network by rapidly enabling rev-enue-generating services that can help fund next-generationnetwork builds.
SBC announced it would deploy the 5E-XC to more cost-effectively support voice and data calls that enter and exit itslocal network.
Our new unified Softswitch — a platform that supports bothwireline and wireless applications — is another key compo-nent of our Accelerate portfolio. While the softswitch market is in its early stages, we have enjoyed some successes. Forinstance, we have announced a wireline trial of the newLucent Softswitch with China Unicom, and we have anothertrial under way in Europe. And we continue to support eightwireline softswitch customers in live network applications. With each trial, we learn more about how our customers canmake the most of our VoIP technology. And as the marketdevelops and customers decide to invest, we’ll be there.
Metro Optical
We also have strategically pursued the opportunity andmomentum in the metro optical space. As a result, we nowhave more than 80 customers for our Metropolis DMX portfo-lio, including
• Verizon, which deployed our Metropolis DMX portfolio ofoptical networking products and the LambdaUnite®
MultiService Switch (MSS) to dramatically increase the
capacity of parts of its network and to offer a wide varietyof high-speed services to its customers.
• AT&T selected our Metropolis DMX Access Multiplexer andthe Metropolis DMXtend Access Multiplexer as part of itsnext-generation intelligent optical network to increasecapacity and enable new revenue-generating services inmetropolitan areas.
• BellSouth chose the Lucent Metropolis DMX AccessMultiplexer to increase the network capacity of its opticalnetworks covering their Southeast markets.
As more and more customers deploy the DMX to build next-generation optical networks, they will need an opticalswitch/cross-connect product such as our LambdaUnite tobridge the increasingly sophisticated traffic across metro opti-cal networks or connect it with a long-haul network. We havealready deployed LambdaUnite with Deutsche Telekom;Shandong Unicom, Zheijiang Telecom, and GEFC in China;Telkom Indonesia; and ICE in Costa Rica.
Broadband Access
We believe our broadband access portfolio of products is well-positioned to capitalize on that market opportunity. Andmany of our contract wins in this area reflect this opportunity,including
• Bell Canada deployed the AnyMedia® Access System toexpand its Digital Subscriber Line (DSL) Internet serviceand wireline voice networks.
• Sprint LTD selected Lucent’s Stinger® DSL Access concen-trators, for broadband access, one of the largest contractsever for the Stinger product.
• Brasil Telecom installed 100,000 Stinger DSL AccessConcentrators.
• Telekomunikacja Polska deployed the new Stinger Micro-Remote Terminal 48, which supports high-speed servicesin space-constrained areas such as street cabinets or multitenant buildings.
In May 2003, we formed a three-year strategic relationshipwith Juniper Networks to deliver unified solutions to help service providers evolve today’s networks to tomorrow’s next-generation infrastructure. We are leveraging complemen-tary networking strengths in ATM/Frame Relay, IP/MPLS,optical, voice, network services and software to create a set ofmarket-ready “unified offers” that solve the toughest chal-lenges our service provider customers face. Since therelationship was established, we’ve made significant progress.We released the first Navis®-integrated solution, the IP VPNSolution, and announced the development of a capability todeliver ATM services with guaranteed quality of service overMPLS networks.
2

L E T T E R
T O O U R S H A R E O W N E R S
3
MOBILITY
We remain the global leader in spread-spectrum technology —shipping more than 90,000 spread-spectrum base stationsworldwide, more than 50,000 of them supporting third genera-tion (3G) CDMA2000 1X services. We continue to have strongrelationships with the world’s leading service providers, andworld-class knowledge of spread-spectrum technology — all ofwhich positions us well to capitalize on the 3G market as itevolves and matures.
There are areas of opportunity where mobile operators continue to upgrade, expand and deploy 3G networks. Forinstance, we signed a new $1 billion multiyear agreement withSprint to enhance and upgrade the largest high-speed wirelessnetwork in the United States with additional 3G equipment fromLucent. We also announced agreements valued at more than$600 million with China Unicom for Phase II and Phase IIICDMA expansion.
And we’ve announced contract wins with major serviceproviders around the world, including Reliance Infocomm inIndia, KTF in Korea, Moscow Cellular, CODETEL in theDominican Republic, VIVO — a joint venture of TelefonicaMoviles and Portugal Telecom — in Brazil, and Cingular in theUnited States.
New High-Capacity Base Station
In addition, we unveiled our new, compact, cost-effective basestation, Flexent Modular Cell 4.0 Compact, a high-capacityCDMA2000 base station and the newest addition to Lucent’sBell Labs-developed OneBTS family of base stations. It’s anideal solution for mobile operators with networks that require abase station that takes up less space. And China Unicom isdeploying the 4.0 Compact as part of its Phase III expansion.
Verizon Wireless announced the commercial launch of asuper-fast mobile data network in Washington, D.C., that pro-vides businesses and consumers with broadband access dataservices at speeds of up to 2.4 Mbps. Lucent supplied equip-ment, software and services for this 3G CDMA2000 1xEV-DOnetwork.
And more recently we announced that we are working withAT&T Wireless to deploy a 3G W-CDMA (Wideband CodeDivision Multiple Access) trial network in the greater Miamiarea to evaluate mobile voice and high-speed data services.This trial network will be the first W-CDMA, also known asUniversal Mobile Telecommunications System (UMTS),deployment for Lucent in North America, and gives bothLucent and AT&T Wireless the opportunity to explore therange of services that 3G W-CDMA can make available forcustomers.
In January, we announced a partnership with Cisco Systemsto resell select Cisco data networking products as part ofLucent’s mobile networking product portfolio for wireless
service providers. This reflects our strategy to focus on ourcore strengths while partnering with other industry leaderswhen it makes sense. Lucent’s industry-leading expertise inwireless networking and Cisco’s IP networking leadership willallow our customers to quickly tap into the new revenuestreams being created by the explosive demand for high-speed mobile data.
SERVICES
Lucent Worldwide Services (LWS) has combined talented people with network know-how and Bell Labs-developed algo-rithms, skills and methodologies to become the industry’sleading network integrator.
Going forward, we see the biggest growth opportunities forLWS in Managed Services and Professional Services, whichhelp service providers increase their revenues, reduce theiroperating costs and increase the reliability and security of theirnetworks. We’re beginning to get traction in these two areas.In fact, this year alone, we signed Managed Services con-tracts in North America, Australia, New Zealand, SouthAmerica and Europe.
Our Professional Services offers are based on Bell Labsresearch and innovations to help service providers increasenetwork reliability, efficiency and security. Most recently, weannounced a suite of wireless in-building ProfessionalServices that will enable mobile operators and enterprises toimprove voice and data coverage in high-traffic areas such ascorporate buildings, shopping malls, multitenant buildings,manufacturing facilities and airports.
This year we secured several Professional Services con-tracts with international carriers, including KTF in Korea andO2 in the United Kingdom, with whom we signed a three-yearagreement to assess and analyze the performance of its GSMand GPRS networks in Europe.
We are also focusing our efforts in the government marketwhere we provide systems integration, consulting and a hostof Professional Services solutions, ranging from network opti-mization, planning and design to network security. And we’vealready had some successes in this area. Lucent was award-ed the first communications infrastructure contract in Iraq — a$25 million subcontract awarded by Bechtel for emergencyrepair and rehabilitation of the Iraqi network. And in the fourth fiscal quarter alone, we won more than a half dozenProfessional Services contracts with other large governmentcontractors.
We also see a large growth opportunity in helping serviceproviders manage their multivendor networks. In fact, we man-age about 30 service provider and enterprise networks fromour three global network centers.
4
L E T T E R
T O O U R S H A R E O W N E R S
BELL LABS
Bell Labs, the innovation engine that powers LucentTechnologies, is taking the lead in shaping tomorrow’s broad-band networks for service providers. Spread across the globe,the more than 9,500 scientists and engineers that make upBell Labs serve a dual mission for Lucent. The bulk of the BellLabs community is focused on developing new communica-tions products and services for Lucent, and researchingreal-world technical issues such as network security, reliabilityand efficiency. Many Bell Labs researchers and developersalso work directly with Lucent’s service provider customersworldwide in an ongoing effort to improve such things as quality of service and network optimization.
Bell Labs scientists and engineers are constantly pushingthe frontiers of science and technology, while defining thevision and setting the pace of innovation for the communica-tions industry and beyond.
Innovation Central
Bell Labs also maintains a long-term basic research programthat allows its researchers to explore fields such as theoreticalcomputer science, materials science and bioengineering —fields in which Bell Labs continues to make seminal contribu-tions. Just this year, Bell Labs scientists made a surprisingdiscovery that a deep-sea sponge constructs optical fiber thatis remarkably similar to the optical fiber found in state-of-the-art telecommunications networks. These biological fiberspresent a number of technological advantages over telecomfiber, such as more flexibility, and could lead to better fiber-optic networks in the future.
On March 10, 2003, Bell Labs was granted its 30,000thUnited States patent, a testament to the continuing feverishpace of innovation at Bell Labs. This milestone patent coversthe mechanisms for guaranteeing quality of service in Internetprotocol networks, which should help make packet-based net-works as reliable as today’s telephone networks.
The R&D Council of New Jersey honored three Bell Labsscientists with the 2003 Thomas Alva Edison patent award fortheir software verification technology, an innovation that hasreplaced the slow and flawed manual process that was oftenused to test software for errors.
Bell Labs scientists also are involved in steering the courseof nanotechnology, which involves manipulating and designingmaterials at the scale of individual atoms or molecules. Bell Labs is now directly managing the New JerseyNanotechnology Consortium, located at our headquarters inMurray Hill, N.J. We have a world-class nanofabrication laband an electron beam lithography lab up and running, staffedby a team of leading scientists and engineering experts. Thework being done here is focused on commercialization, withseveral contracts already in place with customers in areassuch as defense, biotech and aerospace.
BUILDING FOR THE FUTURE
While the current environment for telecommunications equip-ment continues to be challenging, we are now seeing somesigns of stability in the overall market. Although analystsexpect little change in service provider capital expenditures in2004 from 2003, we are no longer fighting the double-digitcapital expenditure cuts that plagued the telecom market overthe past three years. The worst seems to be clearly behind us,and our focus has shifted accordingly.
Telecommunications is the backbone of the global economy,and the inherent need for communications is a key componentof the global economic recovery. Our industry, therefore, is acritically important one and will ultimately stabilize and returnto growth. It’s not a question of if, but when, as Internet con-nections become the next generation’s dial-tone, as the needfor high-speed wireless data and new applications increases,as the world’s focus turns more and more to network securityand reliability issues during times of crisis, and as the world’sembedded network infrastructures evolve to more IP-basedand wireless architectures.
Over the past year, Lucent’s senior leaders have developeda five-year strategic plan aimed at growing our business forthe long term. We looked at where we want to be in 2008 and what it will take to get there. We have defined a set ofaggressive strategic outcomes, set some stakes in the groundand are in the process of engaging all of the people of Lucentin this important work.
Our strategy supports our new stated purpose: creatingnew possibilities to enhance people’s lives by transform-ing the way the world communicates. It leverages ourlegacy of innovation, and it says that, going forward, we intendto create new ways to communicate and continue to developtechnology that will make a difference in the way people workand live. The plan draws on our expertise in software, net-working and services. We’ll be looking to new markets andnew geographies to drive our growth. We’ll tap deeper into ourinnovation engine, Bell Labs, and continue to expand partner-ships and alliances. Our aim is to be the leading networkintegrator worldwide and the No. 1 network solutions providerin the world.
We invite you to track our progress during the coming yearby logging on to www.lucent.com.
Patricia F. RussoChairman and Chief Executive Officer
December 12, 2003
LUCENT TECHNOLOGIES INC.
600 Mountain AvenueMurray Hill, New Jersey 07974
NOTICE OF 2004 ANNUAL MEETING OF SHAREOWNERS
TIME . . . . . . . . . . . . . . . . . . 9:00 a.m. ESTWednesday, February 18, 2004
PLACE . . . . . . . . . . . . . . . . The DuPont Theatre10th and Market StreetsWilmington, Delaware 19801
ITEMS OF BUSINESS . . . . . (1) To elect members of the Board of Directors, whose terms aredescribed in the proxy statement.
(2) To approve an amendment to the Restated Certificate ofIncorporation to declassify the Board of Directors and to allow forthe removal of directors without cause.
(3) To approve the Lucent Technologies Inc. 2004 EquityCompensation Plan for Non-Employee Directors.
(4) To amend the Restated Certificate of Incorporation authorizing theBoard of Directors to effect a reverse stock split at one of four ratios.
(5) To transact such other business, including consideration ofshareowner proposal(s), as may properly come before the meetingand any adjournment thereof.
RECORD DATE . . . . . . . . . . Holders of Lucent common stock of record at the close of business onDecember 22, 2003 are entitled to vote at the meeting.
ANNUAL REPORT . . . . . . . . The company’s 2003 annual report, which is not a part of the proxysoliciting materials, is included as part of this document.
PROXY VOTING . . . . . . . . . It is important that your shares be represented and voted at themeeting. You can vote your shares by completing and returning theproxy card sent to you. Most shareowners can also vote their sharesover the Internet or by telephone. If Internet or telephone voting isavailable to you, voting instructions are printed on the proxy card sent toyou. You can revoke a proxy at any time prior to its exercise at themeeting by following the instructions in the accompanying proxystatement.
RICHARD J. RAWSONSenior Vice President,
December 22, 2003 General Counsel and Secretary
F-1
LUCENT TECHNOLOGIES FINANCIAL REVIEW 2003
Page Management’s Discussion and Analysis of Financial Condition and Results of Operations F-2
Forward-Looking Statements F-2 Overview F-2 Application of Critical Accounting Estimates F-4 Results of Operations F-9 Liquidity and Capital Resources F-21 Quantitative and Qualitative Disclosures About Market Risk F-26
Five-Year Summary of Selected Financial Data F-29 Report of Management F-30 Report of Independent Auditors F-31 Consolidated Financial Statements F-32
Consolidated Statements of Operations F-32 Consolidated Balance Sheets F-33 Consolidated Statements of Changes in Shareowners’ (Deficit) Equity F-34 Consolidated Statements of Cash Flows F-35
Notes to Consolidated Financial Statements F-36
1. Summary of Significant Accounting Policies F-36 2. Business Restructuring Charges, Reversals and Asset Impairments F-41 3. Discontinued Operations F-45 4. Business Dispositions and Acquisitions F-46 5. Supplementary Financial Information F-47 6. Loss Per Common Share F-48 7. Comprehensive Income (Loss) F-49 8. Income Taxes F-49 9. Debt Obligations F-52
10. Mandatorily Redeemable Convertible Preferred Stock F-54 11. Retirements of Convertible Preferred Securities and Debt Obligations F-55 12. Employee Benefit Plans F-55 13. Stock Compensation Plans F-58 14. Operating Segments F-60 15. Financial Instruments F-63 16. Securitizations and Transfers of Financial Instruments F-66 17. Accounting Changes F-67 18. Commitments and Contingencies F-67 19. Quarterly Information (Unaudited) F-74
F-2
MANAGEMENT’S DISCUSSION AND ANALYSIS OF FINANCIAL CONDITION AND RESULTS OF OPERATIONS
FORWARD-LOOKING STATEMENTS This Management’s Discussion and Analysis of Financial Condition and Results of Operations (“MD&A”) contains forward-looking statements that are based on current expectations, estimates, forecasts and projections about us, our future performance, the industries in which we operate, our beliefs and our management's assumptions. In addition, other written or oral statements that constitute forward-looking statements may be made by us or on our behalf. Words such as “expects,” “anticipates,” “targets,” “goals,” “projects,” “intends,” “plans,” “believes,” “seeks,” “estimates,” variations of such words and similar expressions are intended to identify such forward-looking statements. These statements are not guarantees of future performance and involve certain risks, uncertainties and assumptions that are difficult to assess. Therefore, actual outcomes and results may differ materially from what is expressed or forecasted in such forward-looking statements. These risks and uncertainties include the failure of the telecommunications market to improve or to improve at the pace we anticipate; continued net losses and negative operating cash flow that may affect our ability to satisfy our cash requirements; our ability to realize the benefits we expect from our strategic direction and restructuring program; our ability to secure additional sources of funds on reasonable terms; our credit ratings; our ability to compete effectively; our reliance on a limited number of key customers; our exposure to the credit risk of our customers; our reliance on third parties to manufacture most of our products; the cost and other risks inherent in our long-term sales agreements; our product portfolio and ability to keep pace with technological advances in our industry; the complexity of our products; our ability to retain and recruit key personnel; existing and future litigation; our ability to protect our intellectual property rights and the expenses we may incur in defending such rights; changes in environmental health and safety law; changes to existing regulations or technical standards; the social, political and economic risks of our foreign operations; and the costs and risks associated with our pension and postretirement benefit obligations. For a more complete list and description of such risks and uncertainties, see the reports filed by us with the Securities and Exchange Commission. Except as required under the federal securities laws and the rules and regulations of the SEC, we do not have any intention or obligation to update publicly any forward-looking statements after the distribution of this MD&A, whether as a result of new information, future events, changes in assumptions or otherwise.
OVERVIEW We design and deliver networks for the world’s largest communications service providers. Backed by Bell Labs research and development, we rely on our strengths in mobility, optical, data and voice networking technologies, as well as in software and services, to develop next-generation networks. Our systems, services and software are designed to help customers quickly deploy and better manage their networks and create new revenue-generating services that help businesses and consumers. Beginning in fiscal 2001, the global telecommunications market deteriorated, reflecting a significant decrease in the competitive local exchange carrier market and a significant reduction in capital spending by established service providers. This trend intensified during fiscal 2002 and continued into fiscal 2003. Reasons for the market deterioration included the general economic slowdown, network overcapacity, customer bankruptcies, network build-out delays and limited availability of capital. As a result, our sales and results of operations have been and may continue to be adversely affected. The significant slowdown in capital spending in our target markets has created uncertainty as to the level of demand, which can change quickly and can vary over short periods of time, including from month to month. As a result of this uncertainty, accurate forecasting of near- and long-term results, earnings and cash flow remains difficult. In addition, since a limited number of customers account for a significant amount of our revenue, our results are subject to volatility from changes in spending by one or more of these significant customers.
F-3
As discussed in more detail throughout our MD&A:
• Our results of operations during the past three years were adversely affected by the rapid and sustained deterioration of the telecommunications market. After several years of significant growth, our revenues declined by 31%, 42% and 26% during fiscal 2003, 2002 and 2001, respectively, compared with the respective prior fiscal year. The significant reduction in capital spending by service providers, among other factors, contributed to this decline. The impact of product rationalizations and discontinuances under our restructuring program did not have a significant effect on the overall reduction in our revenues during the past three fiscal years, although certain product rationalization initiatives, such as our decision to exit GSM, have reduced our total available market opportunities.
• Our gross margin rate was 31%, 13% and 10% during fiscal 2003, 2002 and 2001, respectively. The improvement in fiscal 2003 primarily resulted from lower inventory-related charges and continued focus on cost reductions. For fiscal 2002 and 2001, product line discontinuances and the significant and rapid declines in revenues led to significant inventory charges and high-unabsorbed fixed costs, which adversely affected our gross margin rate.
• We continued to reduce our operating expenses through restructuring actions. However, these actions resulted in net business restructuring and asset impairment charges of $2.3 billion and $11.4 billion during fiscal 2002 and 2001, respectively. During fiscal 2003, net reversals of $149 million were required due to lower than estimated actual costs for prior year plans. These reversals were particularly related to the true-up of termination benefits.
• We had net recoveries of bad debt and customer financings of $223 million in fiscal 2003, primarily due to the favorable settlement of certain fully-reserved notes receivable and accounts receivable. We recognized significant provisions for bad debts and customer financings of $1.3 billion and $2.2 billion during fiscal 2002 and 2001, respectively, as a result of the significant deterioration of the financial health of certain customers. Most of these provisions were related to commitments made and loans drawn under our customer-financing program during prior years.
• We recognized a charge of $481 million during fiscal 2003 in connection with the settlement of purported class action securities lawsuits and other related lawsuits against us and certain of our current and former directors and officers for alleged violations of federal securities laws, ERISA and related claims.
• We continued to maintain a full valuation allowance on our net deferred tax assets during fiscal 2003, which primarily originated in fiscal 2002. However, we recognized an income tax benefit of $233 million during fiscal 2003, which included several discrete items that were partially offset by current tax expense related to certain non-U.S. operations. The discrete items included tax benefits from the realization of certain fully-reserved net operating losses as a result of carryback claims for taxes paid in prior years, plus additional benefits from the expected favorable resolution of certain tax audit matters. Fiscal 2002 included a tax provision of $4.8 billion despite a pre-tax loss from continuing operations of $7.1 billion due to the requirement for a full valuation allowance.
We have two segments, each organized around a separate customer set to which it sells products or services. The Integrated Network Solutions segment (“INS”) sells to global wireline service providers, including long-distance carriers, traditional local telephone companies and Internet service providers. It offers a broad range of software, equipment and services primarily related to voice networking (offerings primarily consisting of switching products, which we sometimes referred to as convergence solutions, and voice messaging products), data and network management (offerings primarily consisting of access and data networking equipment and operating support software) and optical networking. The Mobility segment sells to global wireless service providers and offers software, equipment and services to support the needs of its customers for radio access and core networks. We support these two segments through a number of central organizations, including our services organization and corporate headquarters.
F-4
Manufacturing and supply chain functions are part of a single global supply chain network organization that manages the materials and activities necessary to produce and deliver products to our customers. During this prolonged market downturn, we are working closely with our customers to position the full breadth of our products and services and we are significantly reducing our cost structure. We expect our revenues to remain flat or to increase slightly during fiscal 2004. We also expect to achieve sustained profitability some time in fiscal 2004 at a gross margin rate of approximately 35%. However, if the telecommunications market continues to decline or does not improve, or improves at a slower pace than we anticipate, our revenues and profitability will continue to be adversely affected. In that case, additional restructuring actions may be undertaken to further reduce costs, which may result in additional charges.
APPLICATION OF CRITICAL ACCOUNTING ESTIMATES Our consolidated financial statements are based on the selection of accounting policies and the application of significant accounting estimates, some of which require management to make significant assumptions. We believe that some of the more critical estimates and related assumptions that affect our financial condition and results of operations are in the areas of revenue recognition, receivables and customer financing, inventories, income taxes, intangible assets, pension and postretirement benefits, business restructuring and legal contingencies. We have discussed the application of these critical accounting estimates with our board of directors and Audit and Finance Committee. The impact of changes in the estimates and assumptions pertaining to revenue recognition, receivables and inventories is directly reflected in our segments’ operating loss. Although any charges related to our net deferred tax assets and goodwill and other acquired intangibles are not reflected in the segment results, the long-term forecasts supporting the realization of those assets and changes in them are significantly affected by the actual and expected results of each segment. Generally, the changes in estimates related to pension and postretirement benefits, our restructuring program and litigation will not affect our segment results, although execution of the restructuring program by each segment may cause related changes in the estimates. Other than the adoption of Statement of Financial Accounting Standards No. 142 (“SFAS 142”), which is more fully explained in Note 1 to our consolidated financial statements, there was no initial adoption of any accounting policy during fiscal 2003 that had a material effect on our financial condition and results of operations.
Revenue recognition Most of our sales are generated from complex contractual arrangements, which require significant revenue recognition judgments, particularly in the areas of multiple-element arrangements and collectibility. Revenues from contracts with multiple element arrangements, such as those including installation and integration services, are recognized as each element is earned based on objective evidence regarding the relative fair value of each element and when there are no undelivered elements that are essential to the functionality of the delivered elements. We have determined that the customer or a third party can install most of our equipment, and as a result, revenue may be recognized upon delivery of the equipment, provided all other revenue recognition criteria are met. In the current market environment, the assessment of collectibility is particularly critical in determining whether revenues should be recognized. As part of the revenue recognition process, we determine whether trade and notes receivables are reasonably assured of collection based on various factors, including our ability to sell those receivables and whether there has been deterioration in the credit quality of our customers that could result in our inability to collect or sell the receivables. In situations where we have the ability to sell the receivable, revenue is recognized to the extent of the value we could reasonably expect to realize from the sale. We defer revenue and related costs if we are uncertain as to whether we will be able to sell or collect the receivable. We defer revenue but recognize costs when we determine that the collection or sale of the receivable is unlikely.
F-5
For sales generated from long-term contracts, primarily those related to customized network solutions and network build-outs, we generally use the percentage of completion method of accounting. In doing so, we make important judgments in estimating revenue and cost and in measuring progress toward completion. Progress is usually measured by units of delivery. These judgments underlie our determinations regarding overall contract value, contract profitability and timing of revenue recognition. Revenue and cost estimates are revised periodically based on changes in circumstances; any expected losses on contracts are recognized immediately upon contract signing or as soon thereafter as identified. Revenues related to long-term contracts, using the percentage of completion method of accounting, represented approximately 18%, 13% and 9% of total revenues during fiscal 2003, 2002 and 2001, respectively. We also sell products through multiple distribution channels, including resellers and distributors. For products sold through these channels, revenue is generally recognized when the reseller or distributor sells the product to the end user. Deferred revenue related to collectibility concerns, undelivered elements and multiple distribution channels was approximately $222 million and $267 million as of September 30, 2003 and 2002, respectively.
Receivables and customer financing We are required to estimate the collectibility of our trade receivables and notes receivable. A considerable amount of judgment is required in assessing the realization of these receivables, including the current creditworthiness of each customer and the related aging of past due balances. We evaluate specific accounts when we become aware of information indicating that a customer may not be able to meet its financial obligations due to a deterioration of its financial condition, lower credit ratings or bankruptcy. Reserve requirements are based on the best facts available to us and are re-evaluated and adjusted as additional information is received, such as information regarding settlements of prior financing arrangements. Our reserves are also determined by using percentages applied to certain categories of aged receivables. Our provision for (recovery of) bad debts and customer financings during fiscal 2003, 2002 and 2001 amounted to approximately ($223) million, $1.3 billion and $2.2 billion, respectively. As of September 30, 2003 and 2002, our receivables of $1.5 billion and $1.6 billion, respectively, included reserves of $246 million and $325 million, respectively. Under our customer financing program, there were approximately $415 million and $951 million of reserves on the $442 million and $1.1 billion of drawn commitments as of September 30, 2003 and 2002, respectively. Significant provisions or recoveries related to changes in reserves occurred during fiscal 2003, 2002 and 2001 and may occur in the future due to the market environment or as settlements of past due balances are reached. As of September 30, 2003, there were approximately $500 million of gross receivables from long-term projects that have been winding down in Saudi Arabia (primarily retention receivables included in other assets). We are in the process of resolving various contractual claims and counter-claims with the customer in order to collect these receivables. During fiscal 2003 there were minimal project revenues realized, and collections on the related receivables slowed considerably. We believe that the financial resolution of these project close-out issues will not have an adverse effect on our results of operations.
Inventories We are required to state our inventories at the lower of cost or market. In assessing the ultimate realization of inventories, we are required to make judgments as to future demand requirements and compare these with the current or committed inventory levels. Our reserve requirements generally increase as our projected demand requirements decrease, due to market conditions, technological and product life cycle changes and longer than previously expected usage periods. We have experienced significant charges related to changes in required reserves in recent periods due to changes in strategic direction, such as discontinuances of product lines, as well as declining market
F-6
conditions. As a result, we incurred net inventory charges of approximately $56 million, $620 million and $2.4 billion during fiscal 2003, 2002 and 2001, respectively. As of September 30, 2003 and 2002, inventories of $632 million and $1.4 billion, respectively, were net of reserves of approximately $980 million and $1.5 billion, respectively. It is possible that significant changes in required inventory reserves may continue to occur in the future if there is a rapid change in the demand for our products due to a further decline in market conditions or to new technological developments.
Income taxes We currently have significant deferred tax assets, resulting from tax credit carryforwards, net operating loss carryforwards and deductible temporary differences. These deferred tax assets may reduce taxable income in future periods. A valuation allowance is required when it is more likely than not that all or a portion of a deferred tax asset will not be realized. Forming a conclusion that a valuation allowance is not needed is difficult when there is negative evidence such as cumulative losses in recent years. Cumulative losses weigh heavily in the overall assessment. As of September 30, 2001, and continuing through March 31, 2002, we provided valuation allowances on future tax benefits with relatively short carryforward periods, such as foreign tax credits, foreign net operating losses, capital losses and most state net operating losses. During this period, we believed it was more likely than not that the remaining net deferred tax assets of $5.2 billion at both September 30, 2001, and March 31, 2002, would be realized, principally based upon forecasted taxable income, generally within the 20-year research and development (“R&D”) credit and net operating loss carryforward periods, giving consideration to substantial benefits realized to date through our restructuring program. During the review of the third quarter of fiscal 2002, several significant developments were considered in determining the need for a full valuation allowance, including the continuing and recently more severe market decline, increasing uncertainty and lack of visibility in the telecommunications market as a whole, a significant decrease in sequential quarterly revenue levels, a decrease in sequential earnings after several quarters of sequential improvement and the possible need for further restructuring and cost reduction actions to attain profitability. As a result of our assessment, we established a full valuation allowance for our remaining net deferred tax assets at June 30, 2002. Since June 30, 2002, we have continued to maintain a full valuation allowance on our net deferred tax assets. We expect to continue to maintain a full valuation allowance on future tax benefits until an appropriate level of profitability is sustained, or we are able to develop tax strategies that would enable us to conclude that it is more likely than not that a portion of our deferred tax assets would be realizable. For example, during fiscal 2003, we did realize $213 million in tax benefits from certain net operating losses (which were fully-reserved) as a result of carryback claims for taxes paid in prior years, principally by previously merged companies and our former foreign sales corporation. We have also recently filed other net operating loss carryback claims, which might result in refunds that are significantly more substantial than the amounts realized in fiscal 2003 if ultimately resolved in our favor. We have maintained a full valuation allowance on these amounts since they are related to complex matters and are in the early stages of resolution. Our income tax provision (benefit) included charges related to changes in valuation allowances of approximately $156 million, $7.9 billion and $545 million during fiscal 2003, 2002 and 2001, respectively. As of September 30, 2003 and 2002, our total valuation allowance on net deferred tax assets was approximately $9.9 billion and $10.0 billion, respectively. Intangible assets We currently have intangible assets, including goodwill and other acquired intangibles of $188 million, development costs for software to be sold, leased or otherwise marketed of $323 million and internal use software development costs of $183 million. Prior to October 1, 2002, goodwill and identifiable intangible assets were amortized on a straight-line basis over their estimated useful lives. In connection with the adoption of SFAS 142 on October 1, 2002, goodwill is no longer amortized but is tested for impairment annually, or more often, if an event or circumstance indicates that an impairment loss has been incurred.
F-7
Other acquired intangibles are amortized on a straight-line basis over the periods benefited, principally in the range of four to six years. Long-lived assets, other than goodwill, are reviewed for impairment whenever events such as product discontinuances, plant closures, product dispositions or other changes in circumstances indicate that the carrying amount may not be recoverable. An impairment loss is recognized when the carrying amount of a long-lived asset exceeds the sum of the undiscounted cash flows expected to result from the asset’s use and eventual disposition. The impairment loss is measured by the amount by which the carrying amount exceeds its fair value, which is typically calculated using discounted expected future cash flows. The discount rate applied to these cash flows is based on our weighted average cost of capital, which represents the blended after-tax costs of debt and equity. The initial goodwill impairment test was completed during the first quarter of fiscal 2003, which resulted in no transitional impairment loss. We assessed the realizability of goodwill related to our multi-service switching reporting unit within INS during the third quarter of fiscal 2003 as a result of business decisions to partner with other suppliers to use their products in our sales offerings. The reporting unit’s fair value was determined using projected cash flows over a seven-year period discounted at 15% after considering terminal value and related cash flows associated with services revenues. The excess of the reporting unit’s goodwill carrying value over its implied fair value in the amount of $35 million was recognized as an impairment charge in the third quarter of fiscal 2003. The annual goodwill impairment test was completed during the fourth quarter of fiscal 2003 and did not result in an additional impairment loss. In the fourth quarter of fiscal 2003, we recognized a $50 million impairment charge related to capitalized software. This charge was required after reconsideration of the specific software that might be deployed due to continuing universal mobile telecommunications systems (“UMTS”) market delays. During fiscal 2002, the continued decline in the telecommunications market prompted a reassessment of all key assumptions underlying our goodwill valuation judgments, including those relating to short- and long-term growth rates. As a result of our analysis, we determined that impairment charges of $975 million, including $826 million of goodwill impairment charges, were required because the forecast undiscounted cash flows were less than the carrying values of certain businesses. The charges were measured on the basis of a comparison of the estimated fair values of the businesses with the corresponding carrying values. The goodwill impairment related primarily to goodwill recognized in connection with our September 2000 acquisition of Spring Tide Networks. Fair values were determined on the basis of discounted cash flows. In addition, in the fourth quarter of fiscal 2002, we recognized approximately $200 million of charges related to capitalized software impairments and $50 million of charges related to property, plant and equipment impairments. These charges were primarily related to delays and increasing uncertainties in the development of the UMTS market.
Pension and postretirement benefits Included in our results of operations are significant pension and postretirement benefit costs and credits, which are measured using actuarial valuations. Inherent in these valuations are key assumptions, including assumptions about discount rates and expected returns on plan assets. These assumptions are updated on an annual basis at the beginning of each fiscal year. We are required to consider current market conditions, including changes in interest rates, in making these assumptions. Changes in the related pension and postretirement benefit costs or credits may occur in the future due to changes in the assumptions. Our net pension and postretirement benefit credit was approximately $669 million, $972 million and $1.1 billion during fiscal 2003, 2002 and 2001, respectively, excluding the impact of restructuring actions. Approximately two-thirds of these amounts are reflected in operating expenses, with the balance in costs. The reduction in the net pension and postretirement credit during fiscal 2003 was primarily a result of lower plan assets, a reduction in the discount rate from 7.0% to 6.5%, and a reduction in the expected return on plan assets, from 9.0% to 8.75% for pensions and from 9.0% to 7.93% for postretirement benefits. The impact of these factors was partially offset by plan amendments
F-8
related to retiree benefits, including the elimination of certain retiree death benefits and reductions in certain retiree healthcare benefits. To develop our discount rate, we considered the available yields on high-quality fixed-income investments with maturities corresponding to our benefit obligations. To develop our expected return on plan assets, we also considered the historical long-term asset return experience, the expected investment portfolio mix of plan assets and an estimate of long-term investment returns. To develop our expected portfolio mix of plan assets, we considered the duration of the plan liabilities and gave more weight to equity positions, including public and private equity investments and real estate, than to fixed-income securities. Our actual 10-year average rates of return on pension plan assets were 9.9%, 9.5% and 11.5% during fiscal 2003, 2002 and 2001, respectively. The expected return on plan assets is determined using the expected rate of return and a calculated value of assets referred to as the “market-related value.” The aggregate market-related value of pension and postretirement plan assets was $39.6 billion as of September 30, 2003, which exceeded the fair value of plan assets by $7.1 billion. Differences between the assumed and actual returns are amortized to the market-related value on a straight-line basis over a five-year period. The amortization of these differences, including those resulting from the actual losses incurred during fiscal 2002 and 2001, will continue to reduce both the market-related value and our pension credit. Gains and losses resulting from changes in these assumptions and from differences between assumptions and actual experience (except those differences being amortized to the market-related value) are amortized over the expected remaining service periods of active plan participants to the extent they exceed 10% of the higher of the market-related value or the projected benefit obligation of each respective plan. Holding all other assumptions constant, a 0.5 percent increase or decrease in the discount rate would have decreased or increased the fiscal 2003 net pension and postretirement credit by approximately $50 million. Likewise, a 0.5 percent increase or decrease in the expected return on plan assets would have increased or decreased the fiscal 2003 net pension and postretirement credit by approximately $200 million. The estimated accumulated benefit obligation related to the U.S. management employees’ pension plan and several other smaller pension plans exceeded the fair value of the plan assets as of September 30, 2003 and 2002. This was due primarily to: (1) the decline in the discount rate used to estimate the pension liability as a result of declining interest rates in the United States, and (2) negative returns on the pension funds as a result of the overall decline in the equity markets in 2002. We used a discount rate of 5.75% and 6.5% to determine the pension obligation as of September 30, 2003 and September 30, 2002, respectively. We recognized a $594 million and a $2.9 billion direct charge to equity for minimum pension liabilities during the fourth quarter of fiscal 2003 and 2002, respectively. Market conditions and interest rates significantly affect the future assets and liabilities of our pension plans, and similar charges might be required in the future. It is difficult to predict these factors due to highly volatile market conditions. Holding all other assumptions constant, a 0.5 percent decrease or increase in the discount rate would have increased or decreased the minimum pension liability by approximately $800 million as of September 30, 2003.
Business restructuring Our restructuring reserves reflect many estimates, including those pertaining to employee separation costs, inventory, settlements of contractual obligations, facility exit costs and proceeds from asset sales. We reassess the reserve requirements for completing each individual plan under our restructuring program at the end of each reporting period. Actual experience has been and may continue to be different from these estimates. For example, we recognized significant reversals or charges related to revisions of our estimates for certain restructuring plans initiated in prior periods, which resulted in a net credit of $225 million and $333 million during fiscal 2003 and 2002, respectively. As of September 30, 2003 and 2002, liabilities associated with our restructuring program were $467 million and $1.1 billion, respectively. Most of the remaining reserve requirements as of September 30, 2003, are related to leases on exited facilities. Facility exit costs of $367 million are expected to be paid over the remaining lease terms, ranging from several months to 13 years, and are reflected net of expected sublease income of $248 million. Additional charges may be required in the future if the expected sublease income is not realized. Refer to Note 2 to our consolidated financial statements for more information.
F-9
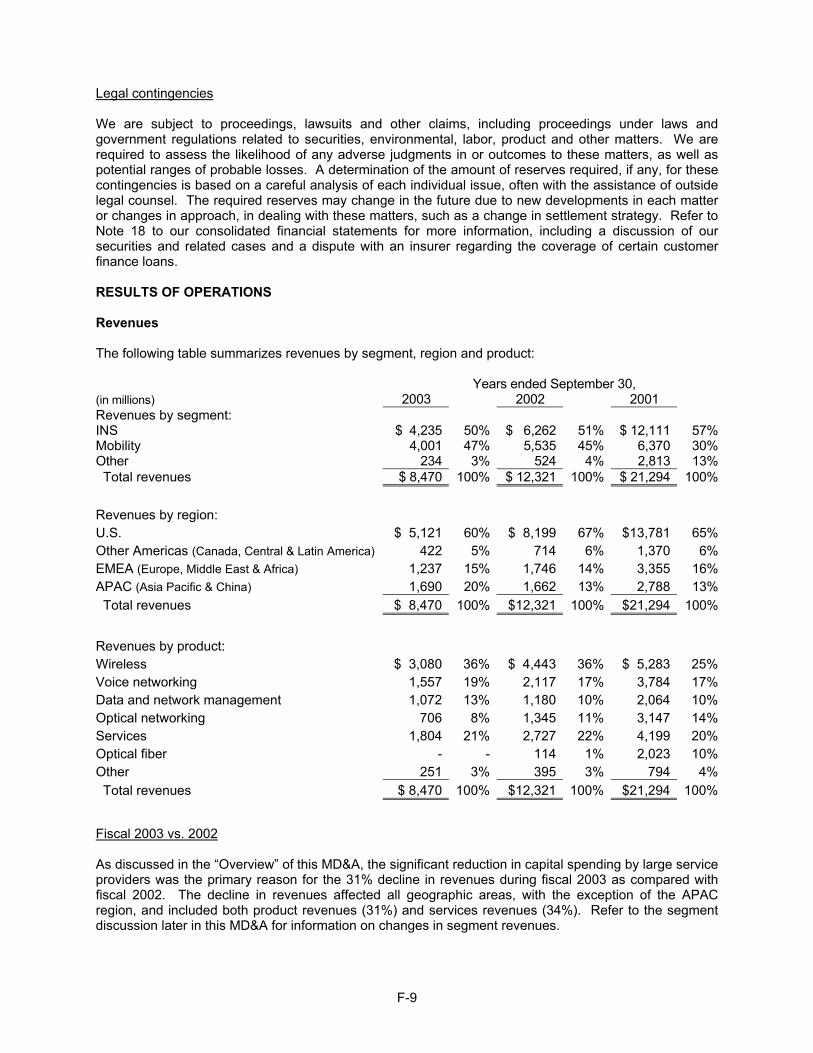
Legal contingencies We are subject to proceedings, lawsuits and other claims, including proceedings under laws and government regulations related to securities, environmental, labor, product and other matters. We are required to assess the likelihood of any adverse judgments in or outcomes to these matters, as well as potential ranges of probable losses. A determination of the amount of reserves required, if any, for these contingencies is based on a careful analysis of each individual issue, often with the assistance of outside legal counsel. The required reserves may change in the future due to new developments in each matter or changes in approach, in dealing with these matters, such as a change in settlement strategy. Refer to Note 18 to our consolidated financial statements for more information, including a discussion of our securities and related cases and a dispute with an insurer regarding the coverage of certain customer finance loans. RESULTS OF OPERATIONS Revenues The following table summarizes revenues by segment, region and product: Years ended September 30, (in millions) 2003 2002 2001 Revenues by segment: INS $ 4,235 50% $ 6,262 51% $ 12,111 57% Mobility 4,001 47% 5,535 45% 6,370 30% Other 234 3% 524 4% 2,813 13% Total revenues $ 8,470 100% $ 12,321 100% $ 21,294 100%
Revenues by region: U.S. $ 5,121 60% $ 8,199 67% $13,781 65% Other Americas (Canada, Central & Latin America) 422 5% 714 6% 1,370 6% EMEA (Europe, Middle East & Africa) 1,237 15% 1,746 14% 3,355 16% APAC (Asia Pacific & China) 1,690 20% 1,662 13% 2,788 13% Total revenues $ 8,470 100% $12,321 100% $21,294 100%
Revenues by product: Wireless $ 3,080 36% $ 4,443 36% $ 5,283 25% Voice networking 1,557 19% 2,117 17% 3,784 17% Data and network management 1,072 13% 1,180 10% 2,064 10% Optical networking 706 8% 1,345 11% 3,147 14% Services 1,804 21% 2,727 22% 4,199 20% Optical fiber - - 114 1% 2,023 10% Other 251 3% 395 3% 794 4% Total revenues $ 8,470 100% $12,321 100% $21,294 100%
Fiscal 2003 vs. 2002 As discussed in the “Overview” of this MD&A, the significant reduction in capital spending by large service providers was the primary reason for the 31% decline in revenues during fiscal 2003 as compared with fiscal 2002. The decline in revenues affected all geographic areas, with the exception of the APAC region, and included both product revenues (31%) and services revenues (34%). Refer to the segment discussion later in this MD&A for information on changes in segment revenues.
F-10
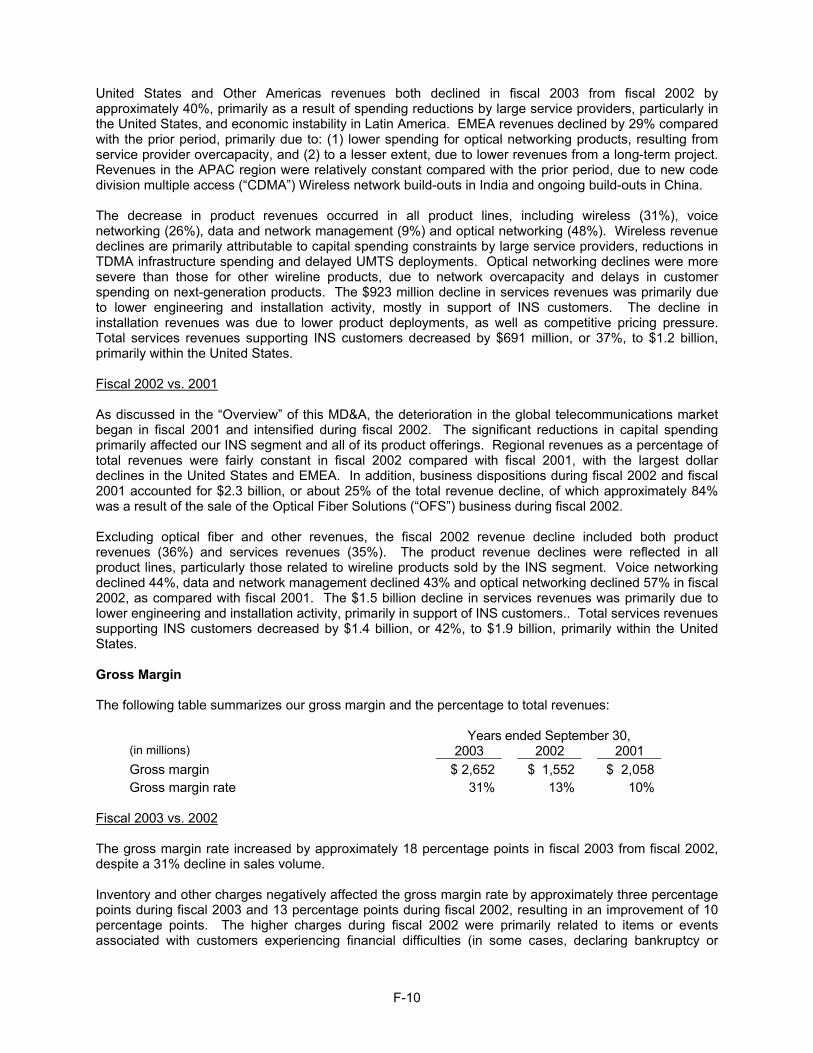
United States and Other Americas revenues both declined in fiscal 2003 from fiscal 2002 by approximately 40%, primarily as a result of spending reductions by large service providers, particularly in the United States, and economic instability in Latin America. EMEA revenues declined by 29% compared with the prior period, primarily due to: (1) lower spending for optical networking products, resulting from service provider overcapacity, and (2) to a lesser extent, due to lower revenues from a long-term project. Revenues in the APAC region were relatively constant compared with the prior period, due to new code division multiple access (“CDMA”) Wireless network build-outs in India and ongoing build-outs in China. The decrease in product revenues occurred in all product lines, including wireless (31%), voice networking (26%), data and network management (9%) and optical networking (48%). Wireless revenue declines are primarily attributable to capital spending constraints by large service providers, reductions in TDMA infrastructure spending and delayed UMTS deployments. Optical networking declines were more severe than those for other wireline products, due to network overcapacity and delays in customer spending on next-generation products. The $923 million decline in services revenues was primarily due to lower engineering and installation activity, mostly in support of INS customers. The decline in installation revenues was due to lower product deployments, as well as competitive pricing pressure. Total services revenues supporting INS customers decreased by $691 million, or 37%, to $1.2 billion, primarily within the United States. Fiscal 2002 vs. 2001 As discussed in the “Overview” of this MD&A, the deterioration in the global telecommunications market began in fiscal 2001 and intensified during fiscal 2002. The significant reductions in capital spending primarily affected our INS segment and all of its product offerings. Regional revenues as a percentage of total revenues were fairly constant in fiscal 2002 compared with fiscal 2001, with the largest dollar declines in the United States and EMEA. In addition, business dispositions during fiscal 2002 and fiscal 2001 accounted for $2.3 billion, or about 25% of the total revenue decline, of which approximately 84% was a result of the sale of the Optical Fiber Solutions (“OFS”) business during fiscal 2002. Excluding optical fiber and other revenues, the fiscal 2002 revenue decline included both product revenues (36%) and services revenues (35%). The product revenue declines were reflected in all product lines, particularly those related to wireline products sold by the INS segment. Voice networking declined 44%, data and network management declined 43% and optical networking declined 57% in fiscal 2002, as compared with fiscal 2001. The $1.5 billion decline in services revenues was primarily due to lower engineering and installation activity, primarily in support of INS customers.. Total services revenues supporting INS customers decreased by $1.4 billion, or 42%, to $1.9 billion, primarily within the United States. Gross Margin The following table summarizes our gross margin and the percentage to total revenues:
Years ended September 30, (in millions) 2003 2002 2001 Gross margin $ 2,652 $ 1,552 $ 2,058Gross margin rate 31% 13% 10%
Fiscal 2003 vs. 2002 The gross margin rate increased by approximately 18 percentage points in fiscal 2003 from fiscal 2002, despite a 31% decline in sales volume. Inventory and other charges negatively affected the gross margin rate by approximately three percentage points during fiscal 2003 and 13 percentage points during fiscal 2002, resulting in an improvement of 10 percentage points. The higher charges during fiscal 2002 were primarily related to items or events associated with customers experiencing financial difficulties (in some cases, declaring bankruptcy or
F-11
becoming insolvent), costs associated with supplier and customer contract settlements, higher provisions for slow-moving and obsolete inventory, adjustments to long-term projects and higher than expected costs due to certain customer obligations and product performance issues. During fiscal 2003 and 2002, we recognized $26 million in reversals and $64 million in charges, respectively, for inventory associated with product line rationalizations and product line discontinuances under our restructuring program. The inventory reversal had a negligible favorable impact on the gross margin rate in fiscal 2003 and had a one-percentage point negative impact on the gross margin rate in fiscal 2002. The remaining improvement in the gross margin rate was due to cost reductions realized from supply chain rationalization and efficiency gains, which accounted for six percentage points of improvement. We reduced costs across the supply chain through internal restructuring and efficiencies, product redesign and resourcing products to lower cost regions. To a lesser extent, the improvement was due to a higher proportion of Mobility and intellectual property licensing revenues to total revenues; both have higher gross margin rates than INS. The gross margin attributable to services during fiscal 2003 decreased by only $28 million, to $346 million, despite the $923 million decline in revenues over the same period. This was due to a five-percentage point increase in the services gross margin rate, to 19%, in fiscal 2003. The gross margin rate improvement was primarily due to a larger proportion of services revenues being derived from maintenance services, which historically have higher gross margin rates than engineering and installation services, and significant cost reduction efforts aimed at aligning our cost structure with market opportunities. Fiscal 2002 vs. 2001 The gross margin rate increased by approximately three percentage points in fiscal 2002 from fiscal 2001, despite a 42% decline in sales volume. Inventory and other charges negatively affected the gross margin rate in fiscal 2002 and 2001 by approximately 13 percentage points and 11 percentage points, respectively, reflecting a decline of two percentage points. The total dollar amount of charges was lower in fiscal 2002, primarily due to lower inventory levels resulting from our strategy of focusing on large service providers, our restructuring program and improved inventory management. However, due to the significant revenue decline in fiscal 2002, the charges had a greater impact on the gross margin rate. These charges were primarily related to items or events associated with customers experiencing financial difficulties (in some cases declaring bankruptcy or becoming insolvent), costs associated with supplier and customer contract settlements, higher provisions for slow-moving and obsolete inventory, adjustments to certain long-term projects and higher than expected costs due to certain customer obligations and product performance issues. During fiscal 2002 and 2001, we recognized $64 million and $1.2 billion, respectively, of inventory charges associated with product line rationalizations and product line discontinuances under our restructuring program. These inventory charges negatively affected the gross margin rate for fiscal 2002 and 2001 by one and six percentage points, respectively, resulting in an improvement of five percentage points. Also, significant reductions in capital spending by service providers reduced sales volumes across all product lines and services more quickly than the reduction in our fixed costs, which resulted in less absorption of fixed costs. The net change in unabsorbed fixed costs, as well as all other factors affecting gross margin, including changes in geographic and product mix, negatively affected the gross margin rate for fiscal 2002 and 2001. Our product mix was also negatively affected by the sale of OFS. The gross margin attributable to services during fiscal 2002 decreased by $181 million, to $374 million, due primarily to the $1.5 billion decline in revenues over the same period. The gross margin rate increased by one percentage point to 14% in fiscal 2002, primarily due to cost reductions.

F-12
Operating Expenses The following table summarizes our operating expenses:
Years ended September 30, (in millions) 2003 2002 2001 Selling, general and administrative (“SG&A”) expenses,
excluding the following two items: $ 1,717
$ 2,466 $ 4,240 Provision for (recovery of) bad debts and customer financings (223 ) 1,253 2,249 Amortization of goodwill and other acquired intangibles 15 250 921
Total SG&A 1,509 3,969 7,410 Research and development (“R&D”) 1,488 2,310 3,520 Goodwill impairment 35 826 3,849 Business restructuring charges (reversals) and asset
impairments, net (158 ) 1,426 6,308 Operating expenses $ 2,874 $ 8,531 $ 21,087
SG&A expenses Fiscal 2003 vs. 2002 Excluding provisions for bad debts and customer financings and amortization of goodwill and other acquired intangibles, SG&A expenses decreased by 30% during fiscal 2003. The decrease was primarily a result of headcount reductions under our restructuring program and other cost savings initiatives that limited discretionary spending. These savings were partially offset by accelerated depreciation and other related charges of $108 million in fiscal 2003 as a result of shortening the estimated useful lives of several properties that have been or are in the process of being sold. The restructuring program is essentially complete and therefore is not expected to further reduce SG&A expenses. Approximately 60% and 16% of the fiscal 2003 reductions were in the INS and Mobility segments, respectively, with the remaining decrease attributable to reductions in general corporate functions. Fiscal 2002 vs. 2001 Excluding provisions for bad debts and customer financings and amortization of goodwill and other acquired intangibles, SG&A expenses decreased by 42% during fiscal 2002. The decrease was primarily a result of headcount reductions under our restructuring program and other cost savings initiatives that limited discretionary spending. Approximately 80% of the fiscal 2002 reductions were in INS due to the greater degree of product rationalization and cost reduction efforts in INS . The remaining decreases were attributed to reductions in general corporate functions. Provision for (recovery of) bad debts and customer financings In the past, we provided substantial long-term financing to some of our customers as a condition of obtaining or bidding on infrastructure projects. Such financing took the form of both commitments to extend credit and third-party financial guarantees. These commitments were extended to established companies, as well as start-up companies, and ranged from modest amounts to more than a billion dollars. Our overall customer financing exposure, coupled with the rapid and sustained decline in telecommunications market conditions, negatively affected our results of operations and cash flows in fiscal 2002 and 2001. However, we had net recoveries in fiscal 2003 due to more selective customer financing practices and a reduction in customer defaults.
F-13
Fiscal 2003 vs. 2002 During fiscal 2003, we had net recoveries of bad debts and customer financings of $223 million. These recoveries were primarily due to the favorable settlement of certain fully-reserved notes receivable and accounts receivable and significantly lower bad debt and customer financing exposure. The significant provisions reflected in fiscal 2002 were due to the deterioration in the creditworthiness of certain customers as a result of the decline in the telecommunications market. Fiscal 2002 vs. 2001 During fiscal 2002 and 2001, poor market conditions contributed to the weakening financial condition of certain customer as well as bankruptcy filings and corresponding defaults. We were unable to sell or transfer significant amounts of the drawn and undrawn commitments to financial institutions or other investors on reasonable terms or at all. As a result, we provided reserves for certain trade and notes receivables and sold others at significant discounts. During fiscal 2002, $765 million of provisions were related to customer financings, with the balance relating to trade receivables. Approximately one-third of the provision for customer financings was related to one customer that defaulted under the terms and conditions of its customer financing agreement. Approximately 55% of the total provisions were related to INS customers and 39% to Mobility customers. The remaining provisions were not related to reportable segments.
Amortization of goodwill and other acquired intangibles
Fiscal 2003 vs. 2002 We adopted SFAS 142 during the first quarter of fiscal 2003. As a result, our remaining goodwill of $185 million is no longer amortized but is tested for impairment annually or more often if an event or circumstance indicates that an impairment loss has been incurred. Amortization of other acquired intangibles was $15 million during fiscal 2003 and $19 million during fiscal 2002.
Fiscal 2002 vs. 2001 Amortization of goodwill and other acquired intangibles was significantly lower in fiscal 2002 as a result of restructuring actions taken in fiscal 2001. These goodwill and acquired intangible reductions were related to the discontinuance of the Chromatis product portfolio, that reduced goodwill and other acquired intangibles by $4.1 billion. In addition, as a result of the continued downturn in the telecommunications market during fiscal 2002, impairment charges of $975 million were recognized in fiscal 2002, primarily related to goodwill associated with the Spring Tide product portfolio.
R&D
Fiscal 2003 vs. 2002 The 36% decrease in R&D expenses in fiscal 2003 was primarily due to headcount reductions and product rationalizations under our restructuring program. The restructuring program is essentially complete and is not expected to further reduce R&D expenses. Substantially all of the reduction for the fiscal year was in INS, due to the greater number of product rationalizations in INS. R&D attributed to Mobility was approximately 64% and 39% of total R&D during fiscal 2003 and 2002, respectively. Mobility spending was primarily related to CDMA and UMTS next-generation technologies. INS spending was primarily related to next-generation technologies and additional feature and function enhancements on optical networking, multi-service switching, network operating systems and circuit and packet switching products.
F-14
Fiscal 2002 vs. 2001 The 34% decrease in R&D expenses in fiscal 2002 was primarily due to headcount reductions and product rationalizations under our restructuring program. Approximately 70% of the fiscal 2002 reductions were in INS, due to the greater number of product rationalizations in INS. R&D attributed to INS was approximately 55% and 60% of total R&D during fiscal 2002 and 2001, respectively. INS spending was primarily related to optical networking, multi-service switching, network operating systems and circuit and packet switching products. Mobility spending was primarily related to CDMA and UMTS next-generation technologies. Goodwill impairment Fiscal 2003 Recent business decisions to partner with other suppliers to use their products in our sales offerings prompted an assessment of the recoverability of certain goodwill associated with the multi-service switching reporting unit within INS during the third quarter of fiscal 2003. The excess of the reporting unit’s goodwill carrying value over its implied fair value was recognized as a $35 million impairment charge during fiscal 2003. Fiscal 2002 The continued, sharper decline in the telecommunications market prompted an assessment of all key assumptions underlying goodwill valuation judgments, including those related to short- and long-term growth rates. It was determined that the carrying value of goodwill previously recognized in connection with the acquisition of Spring Tide was less than the forecasted undiscounted cash flows. As a result, a goodwill impairment charge of $826 million was recognized, based on the difference between the estimated fair value and corresponding carrying value. Fair value was determined on the basis of discounted cash flows. Fiscal 2001 We recognized a $3.8 billion goodwill impairment charge primarily as a result of the discontinuance of the Chromatis product portfolio. Business restructuring charges (reversals) and asset impairments, net
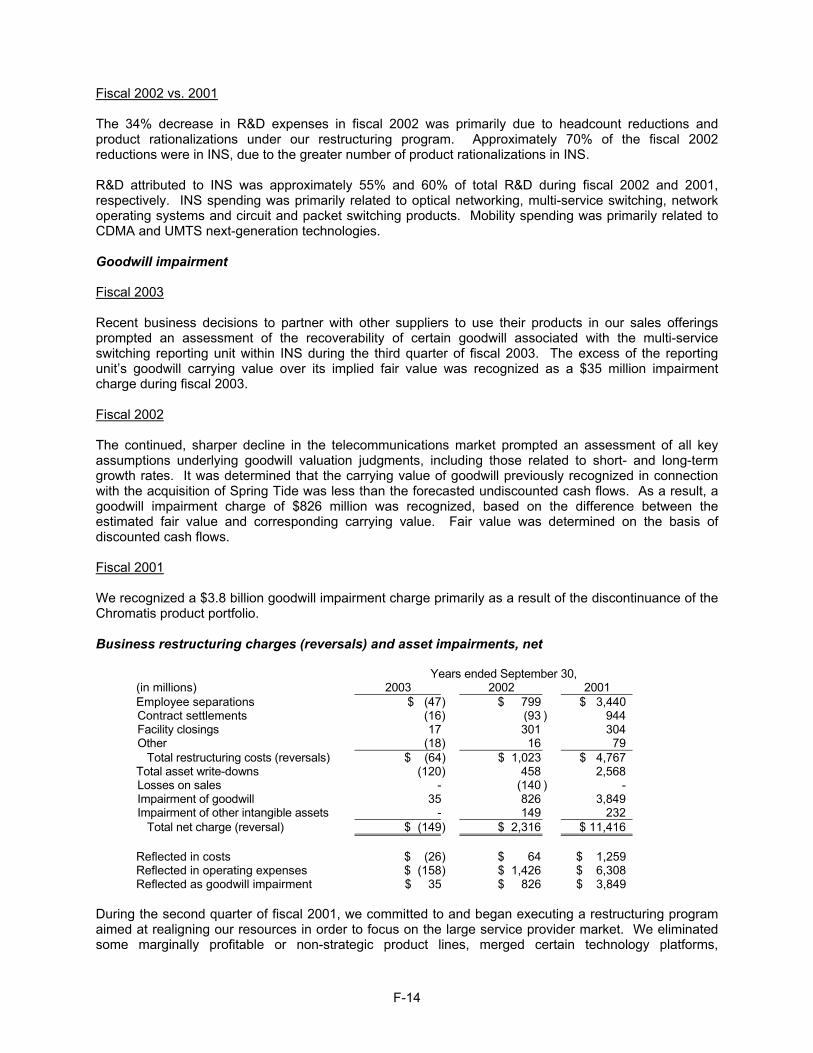
Years ended September 30, (in millions) 2003 2002 2001 Employee separations $ (47) $ 799 $ 3,440 Contract settlements (16) (93 ) 944 Facility closings 17 301 304 Other (18) 16 79 Total restructuring costs (reversals) $ (64) $ 1,023 $ 4,767 Total asset write-downs (120) 458 2,568 Losses on sales - (140 ) - Impairment of goodwill 35 826 3,849 Impairment of other intangible assets - 149 232 Total net charge (reversal) $ (149) $ 2,316 $ 11,416 Reflected in costs $ (26) $ 64 $ 1,259 Reflected in operating expenses $ (158) $ 1,426 $ 6,308 Reflected as goodwill impairment $ 35 $ 826 $ 3,849
During the second quarter of fiscal 2001, we committed to and began executing a restructuring program aimed at realigning our resources in order to focus on the large service provider market. We eliminated some marginally profitable or non-strategic product lines, merged certain technology platforms,
F-15
consolidated development activities, eliminated management positions and duplications in marketing functions and programs, centralized our sales support functions, sold or leased certain of our manufacturing facilities and made greater use of contract manufacturers. We sold or disposed of the assets related to the eliminated product lines, closed facilities and reduced work forces in many of the countries where we operated at the end of fiscal 2000. As a result, we incurred net business restructuring charges and asset impairments in fiscal 2001 and 2002 of $11.4 billion and $2.3 billion (including goodwill impairment charges), respectively. In fiscal 2003, we recognized net reversals of $149 million. Since the inception of the restructuring program, we have reduced our headcount by approximately 71,500 employees, to 34,500 employees as of September 30, 2003 (this figure includes the impacts of attrition and other headcount reductions in the ordinary course of business). In addition, the restructuring plans included facility closing charges related to exiting a significant number of owned and leased facilities, totaling approximately 15.9 million square feet, substantially all of which were exited as of September 30, 2003. We have essentially completed the restructuring actions but continue to evaluate the remaining restructuring reserves at the end of each reporting period. There may be additional charges or reversals, since the companywide-restructuring program is an aggregation of many individual plans requiring judgments and estimates. Actual costs have differed from estimated amounts in the past. The net reversals recognized in fiscal 2003 primarily related to lower than previously estimated costs of completing the restructuring actions. The actual termination benefits and curtailment costs were lower than the estimated amounts due to certain differences in actual versus assumed demographics, including the age, service lives and salaries of the separated employees. Net contract settlement reversals were related to the settlement of certain contractual obligations and purchase commitments for amounts lower than originally estimated. The additional facility closing charges were primarily due to lower estimates for expected sublease rental income on certain properties, offset by reversals resulting from negotiated settlements for lower amounts than originally planned on certain other properties. The adjustments to prior asset write-downs included changes to original plans for certain owned facility closings and reversals of inventory reserves as we utilized more discontinued product inventory than anticipated. The net charges recognized in fiscal 2002 primarily related to additional headcount reductions; revisions to facility closings as a result of changes in estimates as to the amount and timing of expected sublease rental income; net asset write-downs primarily related to property, plant and equipment, capitalized software and inventory associated with additional product exits and the disposition of a manufacturing facility. The net gains (losses) on sales were related to business dispositions in fiscal 2002, including the enterprise professional services business and the billing and customer care business. The charges recognized in fiscal 2001 primarily related to headcount reductions; contract settlement charges for the settlement of purchase commitments with suppliers and contract renegotiations or cancellations of contracts with customers; facility closings; asset write-downs primarily related to the impairment of goodwill and other acquired intangibles; and product discontinuances. Refer to Note 2 to our consolidated financial statements for additional details on our business restructuring program and the related charges and reversals.
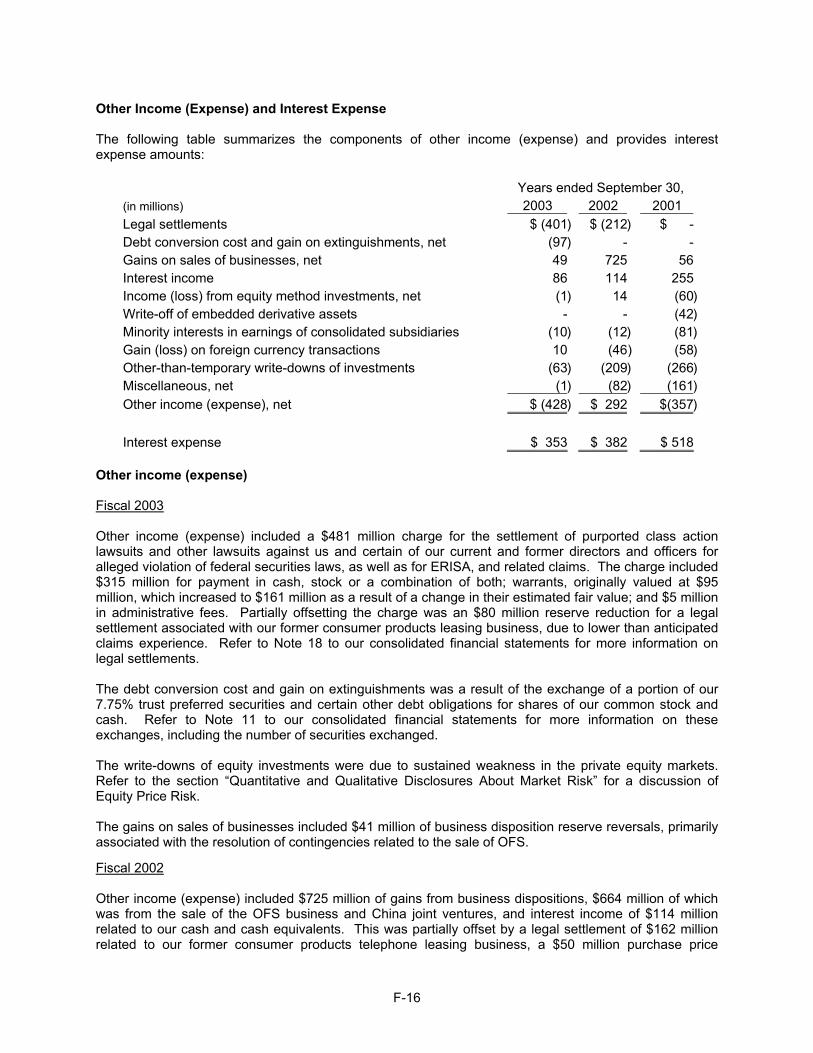
F-16
Other Income (Expense) and Interest Expense The following table summarizes the components of other income (expense) and provides interest expense amounts:
Years ended September 30, (in millions) 2003 2002 2001 Legal settlements $ (401) $ (212) $ - Debt conversion cost and gain on extinguishments, net (97) - - Gains on sales of businesses, net 49 725 56 Interest income 86 114 255 Income (loss) from equity method investments, net (1) 14 (60)Write-off of embedded derivative assets - - (42)Minority interests in earnings of consolidated subsidiaries (10) (12) (81)Gain (loss) on foreign currency transactions 10 (46 ) (58)Other-than-temporary write-downs of investments (63) (209) (266)Miscellaneous, net (1) (82 ) (161)Other income (expense), net $ (428) $ 292 $(357) Interest expense $ 353 $ 382 $ 518
Other income (expense) Fiscal 2003 Other income (expense) included a $481 million charge for the settlement of purported class action lawsuits and other lawsuits against us and certain of our current and former directors and officers for alleged violation of federal securities laws, as well as for ERISA, and related claims. The charge included $315 million for payment in cash, stock or a combination of both; warrants, originally valued at $95 million, which increased to $161 million as a result of a change in their estimated fair value; and $5 million in administrative fees. Partially offsetting the charge was an $80 million reserve reduction for a legal settlement associated with our former consumer products leasing business, due to lower than anticipated claims experience. Refer to Note 18 to our consolidated financial statements for more information on legal settlements. The debt conversion cost and gain on extinguishments was a result of the exchange of a portion of our 7.75% trust preferred securities and certain other debt obligations for shares of our common stock and cash. Refer to Note 11 to our consolidated financial statements for more information on these exchanges, including the number of securities exchanged. The write-downs of equity investments were due to sustained weakness in the private equity markets. Refer to the section “Quantitative and Qualitative Disclosures About Market Risk” for a discussion of Equity Price Risk. The gains on sales of businesses included $41 million of business disposition reserve reversals, primarily associated with the resolution of contingencies related to the sale of OFS.
Fiscal 2002 Other income (expense) included $725 million of gains from business dispositions, $664 million of which was from the sale of the OFS business and China joint ventures, and interest income of $114 million related to our cash and cash equivalents. This was partially offset by a legal settlement of $162 million related to our former consumer products telephone leasing business, a $50 million purchase price
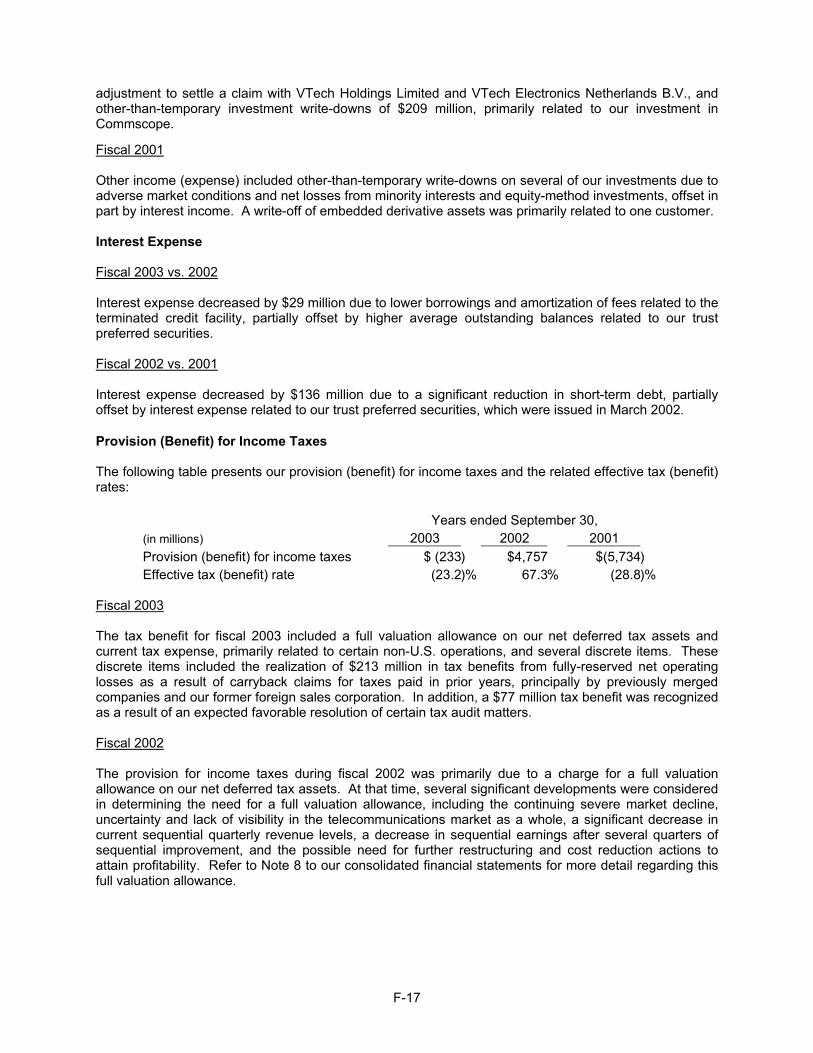
F-17
adjustment to settle a claim with VTech Holdings Limited and VTech Electronics Netherlands B.V., and other-than-temporary investment write-downs of $209 million, primarily related to our investment in Commscope.
Fiscal 2001 Other income (expense) included other-than-temporary write-downs on several of our investments due to adverse market conditions and net losses from minority interests and equity-method investments, offset in part by interest income. A write-off of embedded derivative assets was primarily related to one customer. Interest Expense Fiscal 2003 vs. 2002 Interest expense decreased by $29 million due to lower borrowings and amortization of fees related to the terminated credit facility, partially offset by higher average outstanding balances related to our trust preferred securities. Fiscal 2002 vs. 2001 Interest expense decreased by $136 million due to a significant reduction in short-term debt, partially offset by interest expense related to our trust preferred securities, which were issued in March 2002.
Provision (Benefit) for Income Taxes The following table presents our provision (benefit) for income taxes and the related effective tax (benefit) rates:
Years ended September 30, (in millions) 2003 2002 2001 Provision (benefit) for income taxes $ (233) $4,757 $(5,734) Effective tax (benefit) rate (23.2)% 67.3% (28.8)%
Fiscal 2003 The tax benefit for fiscal 2003 included a full valuation allowance on our net deferred tax assets and current tax expense, primarily related to certain non-U.S. operations, and several discrete items. These discrete items included the realization of $213 million in tax benefits from fully-reserved net operating losses as a result of carryback claims for taxes paid in prior years, principally by previously merged companies and our former foreign sales corporation. In addition, a $77 million tax benefit was recognized as a result of an expected favorable resolution of certain tax audit matters. Fiscal 2002 The provision for income taxes during fiscal 2002 was primarily due to a charge for a full valuation allowance on our net deferred tax assets. At that time, several significant developments were considered in determining the need for a full valuation allowance, including the continuing severe market decline, uncertainty and lack of visibility in the telecommunications market as a whole, a significant decrease in current sequential quarterly revenue levels, a decrease in sequential earnings after several quarters of sequential improvement, and the possible need for further restructuring and cost reduction actions to attain profitability. Refer to Note 8 to our consolidated financial statements for more detail regarding this full valuation allowance.
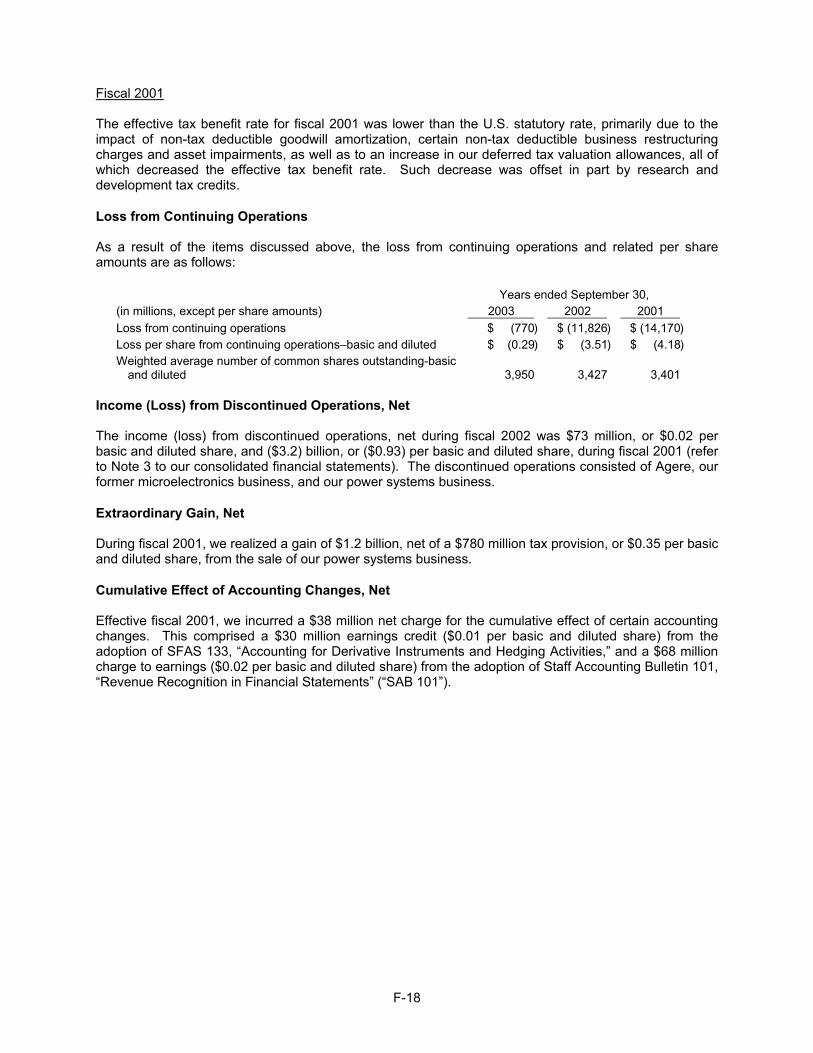
F-18
Fiscal 2001 The effective tax benefit rate for fiscal 2001 was lower than the U.S. statutory rate, primarily due to the impact of non-tax deductible goodwill amortization, certain non-tax deductible business restructuring charges and asset impairments, as well as to an increase in our deferred tax valuation allowances, all of which decreased the effective tax benefit rate. Such decrease was offset in part by research and development tax credits.
Loss from Continuing Operations As a result of the items discussed above, the loss from continuing operations and related per share amounts are as follows:
Years ended September 30, (in millions, except per share amounts) 2003 2002 2001 Loss from continuing operations $ (770) $ (11,826) $ (14,170) Loss per share from continuing operations–basic and diluted $ (0.29) $ (3.51) $ (4.18) Weighted average number of common shares outstanding-basic
and diluted 3,950 3,427 3,401
Income (Loss) from Discontinued Operations, Net The income (loss) from discontinued operations, net during fiscal 2002 was $73 million, or $0.02 per basic and diluted share, and ($3.2) billion, or ($0.93) per basic and diluted share, during fiscal 2001 (refer to Note 3 to our consolidated financial statements). The discontinued operations consisted of Agere, our former microelectronics business, and our power systems business.
Extraordinary Gain, Net During fiscal 2001, we realized a gain of $1.2 billion, net of a $780 million tax provision, or $0.35 per basic and diluted share, from the sale of our power systems business.
Cumulative Effect of Accounting Changes, Net Effective fiscal 2001, we incurred a $38 million net charge for the cumulative effect of certain accounting changes. This comprised a $30 million earnings credit ($0.01 per basic and diluted share) from the adoption of SFAS 133, “Accounting for Derivative Instruments and Hedging Activities,” and a $68 million charge to earnings ($0.02 per basic and diluted share) from the adoption of Staff Accounting Bulletin 101, “Revenue Recognition in Financial Statements” (“SAB 101”).
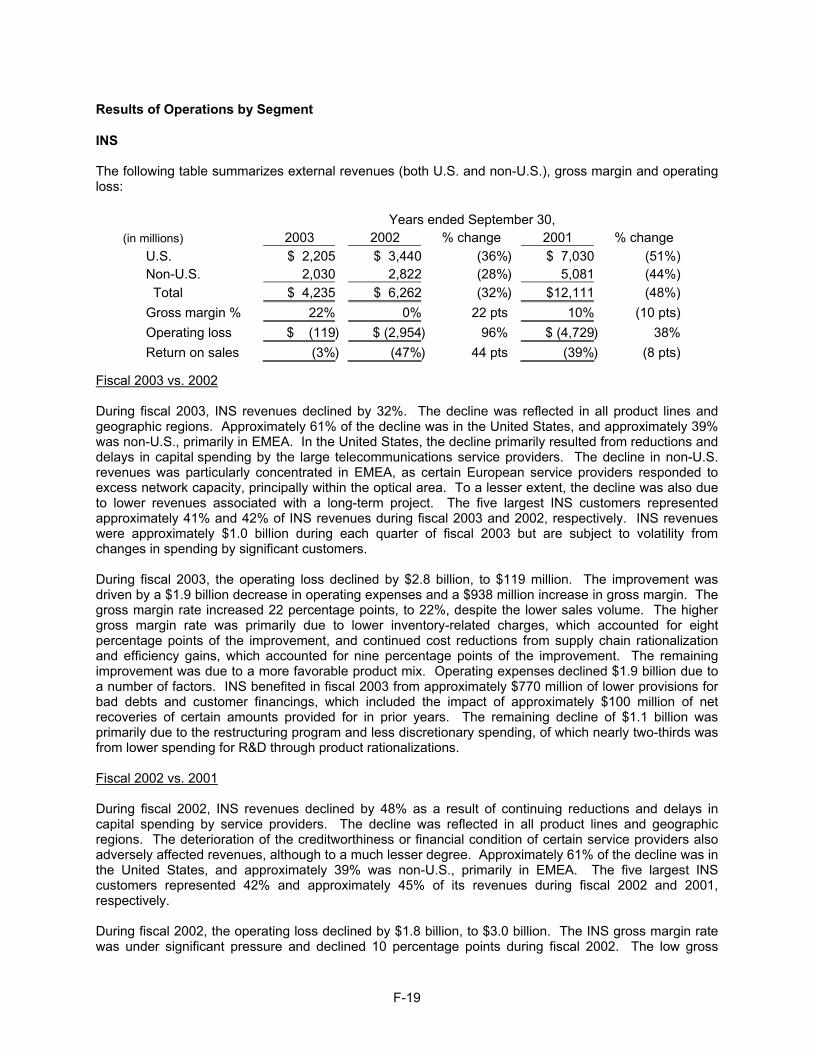
F-19
Results of Operations by Segment
INS The following table summarizes external revenues (both U.S. and non-U.S.), gross margin and operating loss:
Years ended September 30, (in millions) 2003 2002 % change 2001 % change
U.S. $ 2,205 $ 3,440 (36%) $ 7,030 (51%)Non-U.S. 2,030 2,822 (28%) 5,081 (44%) Total $ 4,235 $ 6,262 (32%) $12,111 (48%)Gross margin % 22% 0% 22 pts 10% (10 pts)Operating loss $ (119) $ (2,954) 96% $ (4,729) 38% Return on sales (3%) (47%) 44 pts (39%) (8 pts)
Fiscal 2003 vs. 2002 During fiscal 2003, INS revenues declined by 32%. The decline was reflected in all product lines and geographic regions. Approximately 61% of the decline was in the United States, and approximately 39% was non-U.S., primarily in EMEA. In the United States, the decline primarily resulted from reductions and delays in capital spending by the large telecommunications service providers. The decline in non-U.S. revenues was particularly concentrated in EMEA, as certain European service providers responded to excess network capacity, principally within the optical area. To a lesser extent, the decline was also due to lower revenues associated with a long-term project. The five largest INS customers represented approximately 41% and 42% of INS revenues during fiscal 2003 and 2002, respectively. INS revenues were approximately $1.0 billion during each quarter of fiscal 2003 but are subject to volatility from changes in spending by significant customers. During fiscal 2003, the operating loss declined by $2.8 billion, to $119 million. The improvement was driven by a $1.9 billion decrease in operating expenses and a $938 million increase in gross margin. The gross margin rate increased 22 percentage points, to 22%, despite the lower sales volume. The higher gross margin rate was primarily due to lower inventory-related charges, which accounted for eight percentage points of the improvement, and continued cost reductions from supply chain rationalization and efficiency gains, which accounted for nine percentage points of the improvement. The remaining improvement was due to a more favorable product mix. Operating expenses declined $1.9 billion due to a number of factors. INS benefited in fiscal 2003 from approximately $770 million of lower provisions for bad debts and customer financings, which included the impact of approximately $100 million of net recoveries of certain amounts provided for in prior years. The remaining decline of $1.1 billion was primarily due to the restructuring program and less discretionary spending, of which nearly two-thirds was from lower spending for R&D through product rationalizations. Fiscal 2002 vs. 2001 During fiscal 2002, INS revenues declined by 48% as a result of continuing reductions and delays in capital spending by service providers. The decline was reflected in all product lines and geographic regions. The deterioration of the creditworthiness or financial condition of certain service providers also adversely affected revenues, although to a much lesser degree. Approximately 61% of the decline was in the United States, and approximately 39% was non-U.S., primarily in EMEA. The five largest INS customers represented 42% and approximately 45% of its revenues during fiscal 2002 and 2001, respectively. During fiscal 2002, the operating loss declined by $1.8 billion, to $3.0 billion. The INS gross margin rate was under significant pressure and declined 10 percentage points during fiscal 2002. The low gross

F-20
margin rate was primarily due to unabsorbed fixed costs as a result of significantly lower revenue levels, as well as significant inventory-related charges. Operating expenses declined by approximately 50%, to $3.0 billion, of which $2.2 billion resulted from headcount reductions and less discretionary spending. The remaining decrease was from lower provisions for bad debts and customer financings of $755 million, primarily due to the significant charges incurred for amounts due from one customer, Winstar, in the prior year. Mobility The following table summarizes external revenues (both U.S. and non-U.S.), gross margin and operating income (loss):
Years ended September 30, (in millions) 2003 2002 % change 2001 % change
U.S. $ 2,681 $ 4,337 (38%) $ 4,960 (13%)Non-U.S. 1,320 1,198 10% 1,410 (15%) Total $ 4,001 $ 5,535 (28%) $ 6,370 (13%)Gross margin % 38% 28% 10 pts 20% 8 ptsOperating income (loss) $ 322 $ (587) 155% $ (1,605) 63% Return on sales 8% (11%) 19 pts (25%) 14 pts
Fiscal 2003 vs. 2002 During fiscal 2003, Mobility revenues decreased by 28%. The decrease resulted from reductions in capital spending, primarily in the United States, as large service providers continued to preserve capital resources. The declines in U.S. revenues were also attributable to two large service providers, AT&T Wireless and Cingular, that selected alternatives to our TDMA technologies. The decline in revenues attributable to these two customers represented approximately 50% of the Mobility U.S. revenue decline during fiscal 2003. Non-U.S. revenues increased by 10% during fiscal 2003, primarily as a result of large CDMA network build-outs in the APAC region, primarily China and India. The five largest Mobility customers represented approximately 71% and 77% of its revenues during fiscal 2003 and 2002, respectively. Future revenue trends may remain volatile as a result of this concentration among a limited number of customers. Quarterly revenues ranged from $826 million to nearly $1.3 billion during fiscal 2003. During fiscal 2003, operating income increased by $909 million due to a $934 million decrease in operating expenses, partially offset by a slight decline in gross margin. Despite the decline in U.S. revenues, the gross margin rate increased 10 percentage points, to 38%, in fiscal 2003. The higher gross margin rate was due to lower inventory-related charges, which accounted for seven percentage points of the improvement, supply chain rationalization and efficiency gains, which accounted for two percentage points of the improvement, and, to a lesser extent, favorable product mix. The operating expense decrease was primarily due to approximately $640 million of lower provisions for bad debts and customer financings, including the impact of approximately $130 million of net recoveries of certain amounts reserved in prior years. In addition, approximately $100 million of the decline was due to the net impact of impairment charges of $50 million and $250 million during fiscal 2003 and 2002, respectively, related to certain capitalized software development assets and equipment for UMTS offset by expensing our UMTS development costs as incurred during fiscal 2003. The remainder of the operating expense decline was primarily due to cost reductions realized from our restructuring program and to less discretionary spending. Fiscal 2002 vs. 2001 During fiscal 2002, Mobility revenues decreased by 13%. The decrease in the United States resulted primarily from reductions in capital spending by certain service providers. The decrease in non-U.S. revenues for fiscal 2002 resulted from reductions in Central and Latin America and the APAC region,
F-21
primarily due to a loss of fiscal 2002 revenues from One.Tel, which went into receivership during 2001, partially offset by higher revenues in China and the EMEA region. In addition, approximately 20% of the decline was related to lower revenues from a U.S. customer that defaulted on its customer financing commitment. The five largest Mobility customers represented 77% and approximately 70% of its revenues during fiscal 2002 and 2001, respectively. During fiscal 2002, the Mobility operating loss declined by $1.0 billion, to $587 million. Driving this improvement was an increase in gross margin of $262 million and a decrease in operating expenses of $756 million. The gross margin rate increased eight percentage points to 28% due to lower inventory-related and warranty-related charges, as well as cost reductions. However, the gross margin rate in fiscal 2002 was still significantly affected by similar charges. The reduction in operating expenses resulted from a reduction in provisions for bad debts and customer financings of $266 million, as well as a reduction in other operating expenses of $490 million, primarily related to headcount reductions under our restructuring program and lower discretionary spending. In fiscal 2002, approximately 50% of Mobility’s provisions for bad debts and customer financings were due to one customer that defaulted on its customer financing commitment. In fiscal 2001, Mobility incurred significant provisions for bad debts and customer financings for amounts due from two significant customers. LIQUIDITY AND CAPITAL RESOURCES
Cash flow overview Cash and cash equivalents increased $927 million during fiscal 2003, to $3.8 billion, primarily from $1.6 billion of cash proceeds received from the issuance of convertible senior debentures and an $845 million net reduction in short-term investments. This increase was partially offset by $948 million of cash used in operations and approximately $500 million of repayments of certain debt obligations and convertible preferred securities. Operating activities Cash used in operating activities of $948 million for fiscal 2003 primarily resulted from a loss from operations of $779 million (adjusted for non-cash items) and changes in other operating assets and liabilities of $864 million. This was partially offset by a reduction in working capital requirements (receivables, inventories and contracts in process and accounts payable) of $695 million. The reduction in working capital was due to the decrease in sales volume during the fourth quarter of fiscal 2003 compared with the fourth quarter of fiscal 2002. Generally, working capital requirements will increase or decrease with quarterly revenue levels. Our working capital requirements have also been reduced through more favorable billing terms, collection efforts and streamlined supply chain operations. The changes in other operating assets and liabilities include cash outlays for our restructuring program of $629 million and capitalized software of $313 million. Cash used in operating activities was $756 million for fiscal 2002. This primarily resulted from a loss from continuing operations of $2.9 billion (adjusted for non-cash items) and changes in other operating assets and liabilities of $2.4 billion, offset in part by a reduction in working capital requirements of $4.5 billion. The reduction in working capital primarily resulted from the significant decrease in sales volume during fiscal 2002 compared with fiscal 2001. In addition to the effect of reduced sales volume, the decline in inventory and contracts in process was also a result of our continued efforts to streamline supply chain operations and accelerate billings for our long-term contracts. The changes in other operating assets and liabilities include cash outlays under our restructuring program of $1.0 billion and a reduction in other operating assets and liabilities due to the decrease in sales volume and headcount. Federal and state income tax refunds in fiscal 2002 amounted to approximately $1.0 billion, including $616 million received in connection with changes to tax legislation. Cash used in operating activities was $3.4 billion for fiscal 2001. This primarily resulted from a loss from continuing operations of $6.6 billion (adjusted for non-cash items) and changes in other operating assets and liabilities of $602 million. Changes in other operating assets and liabilities primarily include a net
F-22
increase in notes receivable and higher software development assets, offset in part by business restructuring liabilities. The increases in net cash used in operating activities were partially offset by a reduction in working capital requirements of $3.7 billion. The receivables improvement was largely due to improved collections and lower sales volumes in fiscal 2001 as compared with fiscal 2000. Improvements in inventory and contracts in process resulted from streamlining inventory supply chain operations, as well as lower amounts in net contracts in process due to the wind-down of a project in Saudi Arabia. Investing activities Cash provided by investing activities of $758 million for fiscal 2003 was primarily due to net maturities of short-term investments of $845 million, proceeds from the sale of facilities of $158 million and the sale of certain other investments of $78 million. Capital expenditures were $291 million, which included $102 million for the repurchase of certain real estate under a synthetic lease agreement that was previously used to fund certain real estate construction costs. In addition, during fiscal 2003 we purchased the remaining 10% minority interest in AGCS for $23 million. We currently do not expect any significant cash proceeds from business or asset dispositions in the near future. Cash provided by investing activities of $757 million for fiscal 2002 was primarily from the $2.6 billion of net cash proceeds received from the disposition of businesses and the sale of certain manufacturing operations, partially offset by $1.5 billion of purchases of short-term investments and $449 million of capital expenditures of. Cash proceeds from dispositions primarily included the $2.1 billion received from the sale of our OFS businesses, $60 million from the sale of our voice enhancement and echo cancellation business, $93 million from the sale of New Venture Partners II LP, $250 million from the sale of our billing and customer care business and $96 million from the sale of certain manufacturing operations to Solectron. Cash provided by investing activities of $2.0 billion for fiscal 2001 was primarily due to $2.5 billion in proceeds from the sale of the power systems business, $572 million from the sale of two of our manufacturing operations to Celestica and $177 million of sales or disposals of property, plant and equipment. These proceeds were partially offset by capital expenditures of $1.4 billion. Financing activities Cash provided by financing activities of $1.1 billion for fiscal 2003 was primarily due to the issuance of 2.75% Series A and Series B convertible senior debentures for a net amount of $1.6 billion. A portion of the net proceeds was used to repay or retire certain debt obligations and convertible preferred securities, all of which have higher interest or dividend rates than the debentures we issued (the remainder of the proceeds could be used for general corporate purposes). Specifically, we paid approximately $500 million toward these obligations, including the prepayment of $240 million of a mortgage loan for three of our primary facilities, retirement of $176 million of certain other long-term debt obligations and $69 million for the partial retirement of our 8% redeemable convertible preferred stock. We also received other proceeds of $113 million from prepaid forward sales agreements for our investment in Corning common stock, which we received in connection with the sale of our OFS business. These forward sales agreements were reflected as secured borrowings as of September 30, 2003, and matured on October 1, 2003. We also settled our 8% redeemable convertible preferred stock dividend requirement of $91 million with 46 million shares of our common stock and $6 million of cash. Cash provided by financing activities of $468 million for fiscal 2002 included $1.8 billion of proceeds from the sale of 7.75% convertible trust preferred securities in March 2002. Fees paid in connection with this transaction were approximately $46 million. Partially offsetting these proceeds were repayments of $1.1 billion for amounts outstanding under our credit facilities and other short-term borrowings and $149 million for preferred stock dividends. Cash provided by financing activities for fiscal 2001 was $2.6 billion, primarily due to net proceeds received from the issuance of 8% redeemable convertible preferred stock in August 2001 of $1.8 billion (a portion of the proceeds received were used to reduce borrowings under our credit facilities), net borrowings under our credit facilities of $3.5 billion ($2.5 billion of the debt associated with borrowings
F-23
was assumed by Agere), and proceeds from a real estate debt financing of $302 million under which certain real estate was transferred to a separate, consolidated wholly-owned subsidiary. Borrowings under our credit facilities were used to fund our operations and to pay down $2.1 billion of short-term borrowings, which primarily represented commercial paper. We had no commercial paper outstanding as of September 30, 2001. In addition, we repaid the current portion of long-term debt that matured in July 2001 of $750 million. Dividends paid on our common stock in fiscal 2001 were $204 million. We are currently authorized by our board of directors to issue shares of our common stock or use cash in exchange for the above-referenced convertible securities and certain other debt obligations. As disclosed in more detail in Note 11 to our consolidated financial statements, we retired approximately $2.1 billion of our convertible securities and certain other debt obligations in exchange for approximately 621 million shares of our common stock and $487 million in cash through September 30, 2003, in several separate and privately negotiated transactions. These transactions reduced future obligations at a discount and are expected to reduce annual interest and dividend requirements. We may issue more of our common shares in similar transactions in the future, which would result in additional dilution to our common shareowners. Subsequent to September 30, 2003, and through December 5, 2003, we retired $23 million of our convertible securities for $24 million of cash. We may retire additional debt obligations and convertible securities for cash in the future. On November 24, 2003, we exchanged all of our outstanding 8% redeemable convertible preferred stock for 8% convertible subordinated debentures. This exchange was made pursuant to rights we had under the terms of the preferred stock to exchange them for the convertible subordinated debentures. These debentures have the same payment dates and record dates as the preferred stock dividends. However, the interest payments on the debentures must be paid in cash. The subordinated debentures have terms substantially the same as the preferred stock with respect to put rights, redemptions and conversion into common stock. Any outstanding amounts related to these securities will be classified as debt maturing within one year due to the August 2004 redemption feature. This action increased our flexibility to settle this obligation by eliminating certain legal requirements related to available capital surplus as defined by Delaware law. Future capital requirements We expect our operations will continue to use cash during fiscal 2004. The lower cash requirements for restructuring actions and the effects of cost reduction actions, including the full-year impact of actions completed during fiscal 2003, are expected to be offset by less favorable working capital impacts and cash required for postretirement healthcare benefits. Our near-term cash requirements are primarily related to funding our operations (including our restructuring program), capital expenditures, debt and other obligations discussed below. We expect to continue to use cash to meet these requirements throughout fiscal 2004. We believe our cash and cash equivalents of $3.8 billion and short-term investments of $686 million as of September 30, 2003, are sufficient to fund our cash requirements for the next 12 months. However, we cannot provide assurance that our actual cash requirements will not be greater than we currently expect. If sources of liquidity are not available or if we cannot generate sufficient cash flow from operations, we might be required to obtain additional sources of funds through additional operating improvements, capital market transactions, asset sales or financing from third parties, or a combination thereof. We cannot provide assurance that these additional sources of funds will be available or, if available, would have reasonable terms. The cash requirements of our restructuring program are approximately $2.7 billion, of which approximately $2.2 billion had been paid through September 30, 2003. The remaining cash requirement is expected to be paid over several years, including approximately $200 million during fiscal 2004. Most of the remaining cash requirement is for lease obligations, which are net of expected sublease rental income of approximately $248 million. If we do not receive this expected income, our cash requirements under the restructuring program could increase.
F-24
We do not expect to make contributions to our U.S. pension plans in fiscal 2004 or fiscal 2005. Our current expected funding requirements for postretirement healthcare benefits are approximately $300 million in fiscal 2004. For more information on these obligations, including their expected longer-term effects on liquidity, see the detailed risk factors included in Part 1, Item 1, of our Form 10-K for the year ended September 30, 2003. In addition, legislative and regulatory changes are being considered that could alter the manner in which liabilities are determined for the purpose of calculating required pension contributions under ERISA. Depending on the outcome of the proposals, our longer-term funding requirement for our pension plans could be significantly affected. Until the proposals are finalized, we cannot predict the impact on our financial position. We have agreed to indemnify the Insured Special Purpose Trust (“ISPT”) and its lenders and investors for certain defaulted principal and interest payments related to customer finance loans that were held by the ISPT and are subject to a dispute with an unaffiliated insurer. These funding requirements are $78 million in fiscal 2004 and $208 million thereafter through 2008. The ISPT has been included in our consolidated financial statements since April 1, 2003. Refer to Note 18 to our consolidated financial statements for additional information on the ISPT and the dispute regarding insurance coverage. Our 8% subordinated debentures are redeemable at the option of the holders on various dates, the earliest of which is August 2, 2004. Provided certain criteria are met, we have the option to satisfy this put with cash, shares of our common stock or a combination of both. The principal amount of these securities was $852 million as of December 5, 2003. As discussed in more detail in Note 18 to our consolidated financial statements, we may fund up to $315 million of our shareowner litigation settlement with cash, shares of our common stock or a combination of both. We expect to finalize this settlement during fiscal 2004 or 2005. Letters of credit are obtained to ensure the performance or payment to third parties in accordance with specified terms and conditions. On May 28, 2003, we entered into two new senior secured credit agreements that currently provide for the issuance of new letters of credit and the renewal of existing letters of credit until December 31, 2004. The agreements are subject to certain cash collateral requirements that may increase if we fail to maintain specified levels of consolidated minimum operating income (adjusted for certain defined items) or if we fail to maintain a minimum amount of unrestricted cash and short-term investments. As of September 30, 2003, outstanding letters of credit and amounts unused and available to us under these agreements were $298 million and $290 million, respectively. On May 28, 2003, we also amended our Guarantee and Collateral Agreement and our Collateral Sharing Agreement. Under these agreements, certain of our U.S. subsidiaries have guaranteed certain of our obligations, and these subsidiaries have pledged substantially all of their assets as collateral. These agreements provide security for certain of our obligations, including letters of credit, specified hedging arrangements, guarantees to lenders for vendor financing, lines of credit, an agreement relating to our ISPT, cash management and other bank operating arrangements. The amount of these outstanding obligations was $543 million as of September 30, 2003. We have effective shelf registration statements with the SEC for the issuance of up to approximately $1.9 billion of securities, including shares of common stock and preferred stock, debt securities, warrants, stock purchase contracts and stock purchase units.
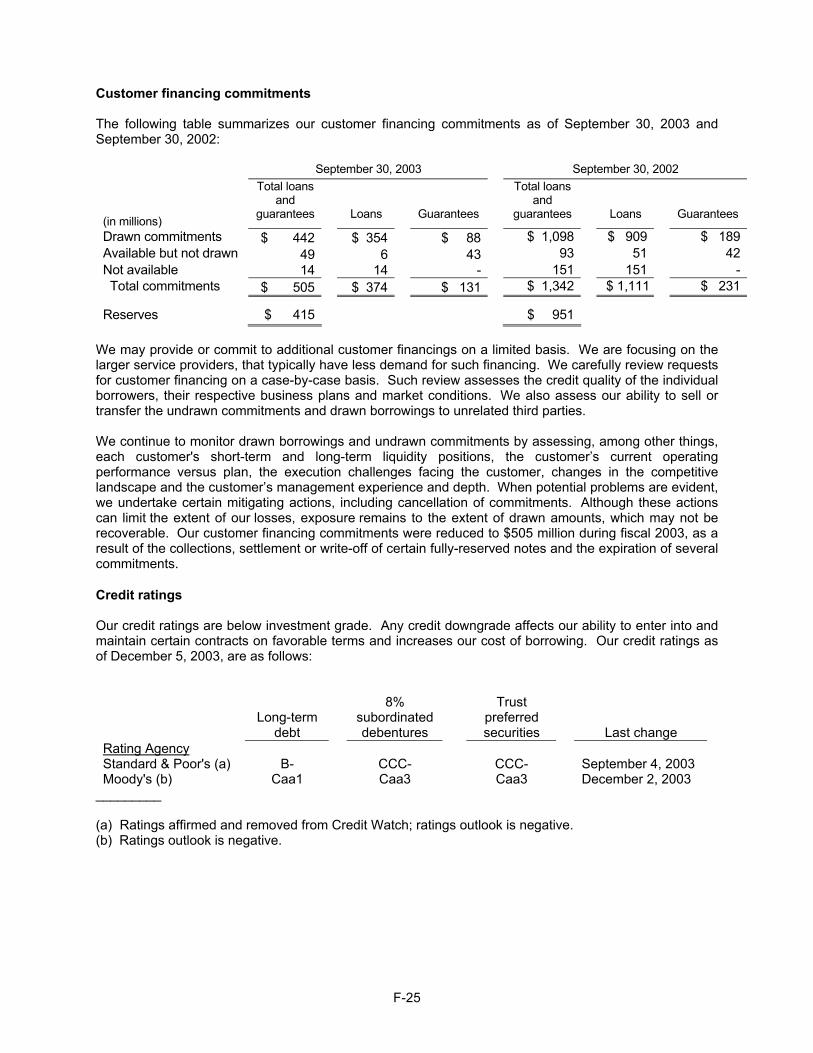
F-25
Customer financing commitments The following table summarizes our customer financing commitments as of September 30, 2003 and September 30, 2002:
September 30, 2003 September 30, 2002
(in millions)
Total loans and
guarantees
Loans
Guarantees
Total loans and
guarantees
Loans
Guarantees
Drawn commitments $ 442 $ 354 $ 88 $ 1,098 $ 909 $ 189Available but not drawn 49 6 43 93 51 42Not available 14 14 - 151 151 - Total commitments $ 505 $ 374 $ 131 $ 1,342 $ 1,111 $ 231
Reserves $ 415 $ 951 We may provide or commit to additional customer financings on a limited basis. We are focusing on the larger service providers, that typically have less demand for such financing. We carefully review requests for customer financing on a case-by-case basis. Such review assesses the credit quality of the individual borrowers, their respective business plans and market conditions. We also assess our ability to sell or transfer the undrawn commitments and drawn borrowings to unrelated third parties. We continue to monitor drawn borrowings and undrawn commitments by assessing, among other things, each customer's short-term and long-term liquidity positions, the customer’s current operating performance versus plan, the execution challenges facing the customer, changes in the competitive landscape and the customer’s management experience and depth. When potential problems are evident, we undertake certain mitigating actions, including cancellation of commitments. Although these actions can limit the extent of our losses, exposure remains to the extent of drawn amounts, which may not be recoverable. Our customer financing commitments were reduced to $505 million during fiscal 2003, as a result of the collections, settlement or write-off of certain fully-reserved notes and the expiration of several commitments.
Credit ratings Our credit ratings are below investment grade. Any credit downgrade affects our ability to enter into and maintain certain contracts on favorable terms and increases our cost of borrowing. Our credit ratings as of December 5, 2003, are as follows:
Long-term
debt
8%
subordinated debentures
Trust
preferred securities
Last change Rating Agency Standard & Poor's (a) B- CCC- CCC- September 4, 2003 Moody's (b) Caa1 Caa3 Caa3 December 2, 2003
_________
(a) Ratings affirmed and removed from Credit Watch; ratings outlook is negative. (b) Ratings outlook is negative.
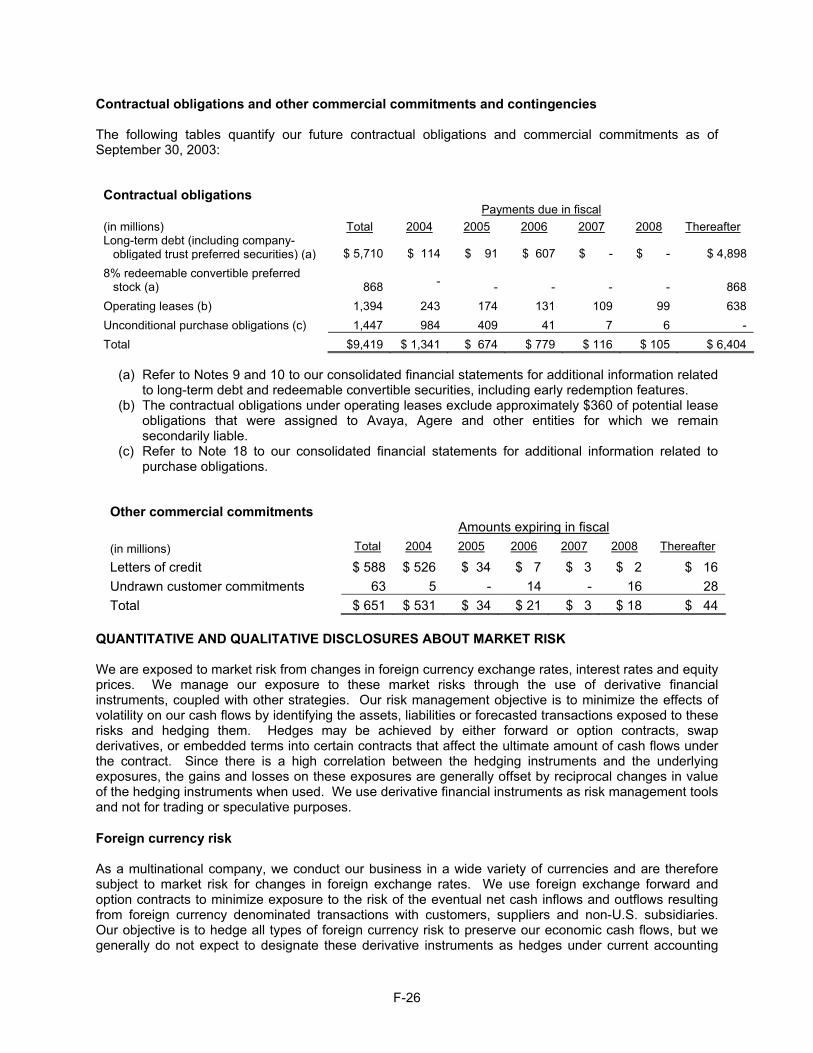
F-26
Contractual obligations and other commercial commitments and contingencies The following tables quantify our future contractual obligations and commercial commitments as of September 30, 2003:
Contractual obligations
Payments due in fiscal
(in millions) Total 2004 2005 2006 2007 2008 Thereafter Long-term debt (including company-
obligated trust preferred securities) (a) $ 5,710 $ 114 $ 91 $ 607 $ - $ - $ 4,898
8% redeemable convertible preferred stock (a) 868
- - - - - 868
Operating leases (b) 1,394 243 174 131 109 99 638
Unconditional purchase obligations (c) 1,447 984 409 41 7 6 -
Total $9,419 $ 1,341 $ 674 $ 779 $ 116 $ 105 $ 6,404
(a) Refer to Notes 9 and 10 to our consolidated financial statements for additional information related to long-term debt and redeemable convertible securities, including early redemption features.
(b) The contractual obligations under operating leases exclude approximately $360 of potential lease obligations that were assigned to Avaya, Agere and other entities for which we remain secondarily liable.
(c) Refer to Note 18 to our consolidated financial statements for additional information related to purchase obligations.
Other commercial commitments
Amounts expiring in fiscal
(in millions) Total 2004 2005 2006 2007 2008 Thereafter
Letters of credit $ 588 $ 526 $ 34 $ 7 $ 3 $ 2 $ 16
Undrawn customer commitments 63 5 - 14 - 16 28
Total $ 651 $ 531 $ 34 $ 21 $ 3 $ 18 $ 44
QUANTITATIVE AND QUALITATIVE DISCLOSURES ABOUT MARKET RISK We are exposed to market risk from changes in foreign currency exchange rates, interest rates and equity prices. We manage our exposure to these market risks through the use of derivative financial instruments, coupled with other strategies. Our risk management objective is to minimize the effects of volatility on our cash flows by identifying the assets, liabilities or forecasted transactions exposed to these risks and hedging them. Hedges may be achieved by either forward or option contracts, swap derivatives, or embedded terms into certain contracts that affect the ultimate amount of cash flows under the contract. Since there is a high correlation between the hedging instruments and the underlying exposures, the gains and losses on these exposures are generally offset by reciprocal changes in value of the hedging instruments when used. We use derivative financial instruments as risk management tools and not for trading or speculative purposes.
Foreign currency risk As a multinational company, we conduct our business in a wide variety of currencies and are therefore subject to market risk for changes in foreign exchange rates. We use foreign exchange forward and option contracts to minimize exposure to the risk of the eventual net cash inflows and outflows resulting from foreign currency denominated transactions with customers, suppliers and non-U.S. subsidiaries. Our objective is to hedge all types of foreign currency risk to preserve our economic cash flows, but we generally do not expect to designate these derivative instruments as hedges under current accounting
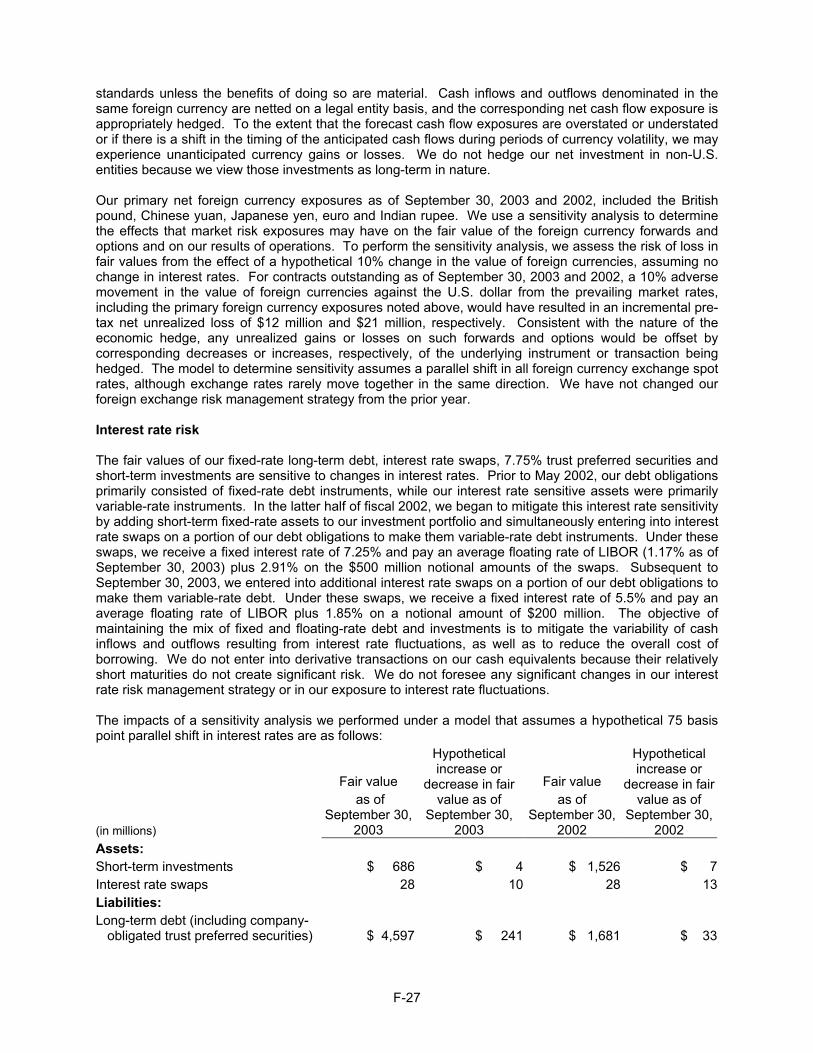
F-27
standards unless the benefits of doing so are material. Cash inflows and outflows denominated in the same foreign currency are netted on a legal entity basis, and the corresponding net cash flow exposure is appropriately hedged. To the extent that the forecast cash flow exposures are overstated or understated or if there is a shift in the timing of the anticipated cash flows during periods of currency volatility, we may experience unanticipated currency gains or losses. We do not hedge our net investment in non-U.S. entities because we view those investments as long-term in nature. Our primary net foreign currency exposures as of September 30, 2003 and 2002, included the British pound, Chinese yuan, Japanese yen, euro and Indian rupee. We use a sensitivity analysis to determine the effects that market risk exposures may have on the fair value of the foreign currency forwards and options and on our results of operations. To perform the sensitivity analysis, we assess the risk of loss in fair values from the effect of a hypothetical 10% change in the value of foreign currencies, assuming no change in interest rates. For contracts outstanding as of September 30, 2003 and 2002, a 10% adverse movement in the value of foreign currencies against the U.S. dollar from the prevailing market rates, including the primary foreign currency exposures noted above, would have resulted in an incremental pre-tax net unrealized loss of $12 million and $21 million, respectively. Consistent with the nature of the economic hedge, any unrealized gains or losses on such forwards and options would be offset by corresponding decreases or increases, respectively, of the underlying instrument or transaction being hedged. The model to determine sensitivity assumes a parallel shift in all foreign currency exchange spot rates, although exchange rates rarely move together in the same direction. We have not changed our foreign exchange risk management strategy from the prior year. Interest rate risk The fair values of our fixed-rate long-term debt, interest rate swaps, 7.75% trust preferred securities and short-term investments are sensitive to changes in interest rates. Prior to May 2002, our debt obligations primarily consisted of fixed-rate debt instruments, while our interest rate sensitive assets were primarily variable-rate instruments. In the latter half of fiscal 2002, we began to mitigate this interest rate sensitivity by adding short-term fixed-rate assets to our investment portfolio and simultaneously entering into interest rate swaps on a portion of our debt obligations to make them variable-rate debt instruments. Under these swaps, we receive a fixed interest rate of 7.25% and pay an average floating rate of LIBOR (1.17% as of September 30, 2003) plus 2.91% on the $500 million notional amounts of the swaps. Subsequent to September 30, 2003, we entered into additional interest rate swaps on a portion of our debt obligations to make them variable-rate debt. Under these swaps, we receive a fixed interest rate of 5.5% and pay an average floating rate of LIBOR plus 1.85% on a notional amount of $200 million. The objective of maintaining the mix of fixed and floating-rate debt and investments is to mitigate the variability of cash inflows and outflows resulting from interest rate fluctuations, as well as to reduce the overall cost of borrowing. We do not enter into derivative transactions on our cash equivalents because their relatively short maturities do not create significant risk. We do not foresee any significant changes in our interest rate risk management strategy or in our exposure to interest rate fluctuations. The impacts of a sensitivity analysis we performed under a model that assumes a hypothetical 75 basis point parallel shift in interest rates are as follows:
(in millions)
Fair value as of
September 30, 2003
Hypothetical increase or
decrease in fair value as of
September 30, 2003
Fair value as of
September 30, 2002
Hypothetical increase or
decrease in fair value as of
September 30, 2002
Assets: Short-term investments $ 686 $ 4 $ 1,526 $ 7Interest rate swaps 28 10 28 13 Liabilities: Long-term debt (including company-
obligated trust preferred securities) $ 4,597 $ 241 $ 1,681 $ 33
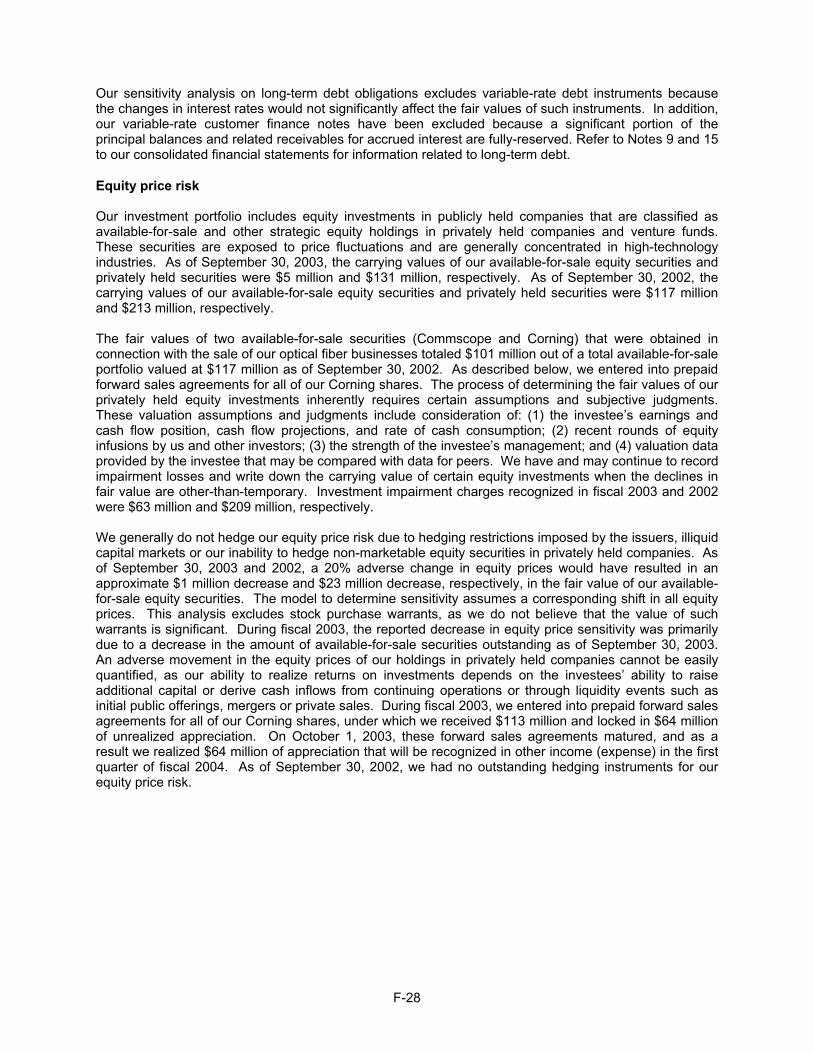
F-28
Our sensitivity analysis on long-term debt obligations excludes variable-rate debt instruments because the changes in interest rates would not significantly affect the fair values of such instruments. In addition, our variable-rate customer finance notes have been excluded because a significant portion of the principal balances and related receivables for accrued interest are fully-reserved. Refer to Notes 9 and 15 to our consolidated financial statements for information related to long-term debt.
Equity price risk Our investment portfolio includes equity investments in publicly held companies that are classified as available-for-sale and other strategic equity holdings in privately held companies and venture funds. These securities are exposed to price fluctuations and are generally concentrated in high-technology industries. As of September 30, 2003, the carrying values of our available-for-sale equity securities and privately held securities were $5 million and $131 million, respectively. As of September 30, 2002, the carrying values of our available-for-sale equity securities and privately held securities were $117 million and $213 million, respectively. The fair values of two available-for-sale securities (Commscope and Corning) that were obtained in connection with the sale of our optical fiber businesses totaled $101 million out of a total available-for-sale portfolio valued at $117 million as of September 30, 2002. As described below, we entered into prepaid forward sales agreements for all of our Corning shares. The process of determining the fair values of our privately held equity investments inherently requires certain assumptions and subjective judgments. These valuation assumptions and judgments include consideration of: (1) the investee’s earnings and cash flow position, cash flow projections, and rate of cash consumption; (2) recent rounds of equity infusions by us and other investors; (3) the strength of the investee’s management; and (4) valuation data provided by the investee that may be compared with data for peers. We have and may continue to record impairment losses and write down the carrying value of certain equity investments when the declines in fair value are other-than-temporary. Investment impairment charges recognized in fiscal 2003 and 2002 were $63 million and $209 million, respectively. We generally do not hedge our equity price risk due to hedging restrictions imposed by the issuers, illiquid capital markets or our inability to hedge non-marketable equity securities in privately held companies. As of September 30, 2003 and 2002, a 20% adverse change in equity prices would have resulted in an approximate $1 million decrease and $23 million decrease, respectively, in the fair value of our available-for-sale equity securities. The model to determine sensitivity assumes a corresponding shift in all equity prices. This analysis excludes stock purchase warrants, as we do not believe that the value of such warrants is significant. During fiscal 2003, the reported decrease in equity price sensitivity was primarily due to a decrease in the amount of available-for-sale securities outstanding as of September 30, 2003. An adverse movement in the equity prices of our holdings in privately held companies cannot be easily quantified, as our ability to realize returns on investments depends on the investees’ ability to raise additional capital or derive cash inflows from continuing operations or through liquidity events such as initial public offerings, mergers or private sales. During fiscal 2003, we entered into prepaid forward sales agreements for all of our Corning shares, under which we received $113 million and locked in $64 million of unrealized appreciation. On October 1, 2003, these forward sales agreements matured, and as a result we realized $64 million of appreciation that will be recognized in other income (expense) in the first quarter of fiscal 2004. As of September 30, 2002, we had no outstanding hedging instruments for our equity price risk.
F-29
Five-Year Summary of Selected Financial Data (in millions, except per share amounts)
Years ended September 30, 2003 2002 2001 2000 1999
RESULTS OF OPERATIONS Revenues $ 8,470 $ 12,321 $ 21,294 $ 28,904 $ 26,993 Business restructuring charges (reversals) and
asset impairments (184) 1,490 7,567 - - Impairment of goodwill 35 826 3,849 - - Provision (benefit) for income taxes (233) 4,757 (5,734) 924 1,456
Income (loss) from continuing operations (770 ) (11,826 ) (14,170) 1,433 2,369 Earnings (loss) per common share from
continuing operations: Basic (0.29 ) (3.51 ) (4.18) 0.44 0.76 Diluted (0.29 ) (3.51 ) (4.18) 0.43 0.74
Dividends per common share - - 0.06 0.08 0.08
FINANCIAL POSITION Cash, cash equivalents and short-term
investments $ 4,507 $ 4,420 $ 2,390 $ 1,467 $ 1,686 Total assets 15,765 17,791 33,664 47,512 34,246 Total debt 5,980 5,106 4,409 6,498 5,788 8.00% redeemable convertible preferred
stock 868 1,680 1,834 - - Shareowners’ (deficit) equity (4,239) (4,734) 11,023 26,172 13,936
F-30
REPORT OF MANAGEMENT Management is responsible for the preparation of Lucent Technologies Inc.’s consolidated financial statements and all related information appearing in this Annual Report. The consolidated financial statements and notes have been prepared in conformity with accounting principles generally accepted in the United States of America and include certain amounts that are estimates based upon currently available information and management’s judgment of current conditions and circumstances. To provide reasonable assurance that assets are safeguarded against loss from unauthorized use or disposition and that accounting records are reliable for preparing financial statements, management maintains a system of accounting and other controls, including an internal audit function. Even an effective internal control system, no matter how well designed, has inherent limitations - including the possibility of circumvention or overriding of controls - and therefore can provide only reasonable assurance with respect to financial statement presentation. The system of accounting and other controls is improved and modified in response to changes in business conditions and operations and recommendations made by the independent accountants and the internal auditors. The Audit and Finance Committee of the board of directors, which is composed of independent directors, meets periodically with management, the internal auditors and the independent auditors to review the manner in which these groups are performing their responsibilities and to carry out the Audit and Finance Committee’s oversight role with respect to auditing, internal controls and financial reporting matters. Both the internal auditors and the independent auditors periodically meet privately with the Audit and Finance Committee and have access to its individual members. Lucent engaged PricewaterhouseCoopers LLP, independent auditors, to audit the consolidated financial statements in accordance with auditing standards generally accepted in the United States of America, which includes consideration of our internal control structure for purposes of designing their audit procedures.
Patricia F. Russo Chairman and Chief Executive Officer
Frank A. D’Amelio Executive Vice President and Chief Financial Officer
F-31
REPORT OF INDEPENDENT AUDITORS
To the Board of Directors and Shareowners of LUCENT TECHNOLOGIES INC.:
In our opinion, the accompanying consolidated balance sheets and related consolidated statements of operations, changes in shareowners’ (deficit) equity and cash flows present fairly, in all material respects, the financial position of Lucent Technologies Inc. and its subsidiaries as of September 30, 2003 and 2002, and the results of their operations and their cash flows for each of the three years in the period ended September 30, 2003, in conformity with accounting principles generally accepted in the United States of America. These financial statements are the responsibility of the Company’s management; our responsibility is to express an opinion on these financial statements based on our audits. We conducted our audits of these statements in accordance with auditing standards generally accepted in the United States of America, which require that we plan and perform the audit to obtain reasonable assurance about whether the financial statements are free of material misstatement. An audit includes examining, on a test basis, evidence supporting the amounts and disclosures in the financial statements, assessing the accounting principles used and significant estimates made by management, and evaluating the overall financial statement presentation. We believe that our audits provide a reasonable basis for our opinion. As discussed in Note 1 to the consolidated financial statements, in 2003 the Company changed its accounting method for goodwill and other intangible assets. As discussed in Note 17 to the consolidated financial statements, in 2001 the Company changed its accounting methods for revenue recognition and for derivative financial instruments.
Florham Park, New Jersey October 22, 2003, except for the second paragraph of Note 10, as to which the date is November 24, 2003.
F-32
LUCENT TECHNOLOGIES INC. AND SUBSIDIARIES CONSOLIDATED STATEMENTS OF OPERATIONS
(in millions, except per share amounts)
Years ended September 30, 2003 2002 2001
Revenues: Products $ 6,666 $ 9,594 $ 17,095 Services 1,804 2,727 4,199 Total revenues 8,470 12,321 21,294 Costs: Products 4,360 8,416 15,592 Services 1,458 2,353 3,644 Total costs 5,818 10,769 19,236 Gross margin 2,652 1,552 2,058 Operating expenses:
Selling, general and administrative 1,509 3,969 7,410 Research and development 1,488 2,310 3,520 Goodwill impairment 35 826 3,849 Business restructuring charges (reversals) and asset impairments,
net (158) 1,426 6,308 Total operating expenses 2,874 8,531 21,087
Operating loss (222) (6,979) (19,029)Other income (expense), net (428) 292 (357)Interest expense 353 382 518 Loss from continuing operations before income taxes (1,003) (7,069) (19,904)Provision (benefit) for income taxes (233) 4,757 (5,734)Loss from continuing operations (770) (11,826) (14,170)Income (loss) from discontinued operations, net - 73 (3,172)Loss before extraordinary item and cumulative effect of accounting changes (770) (11,753 ) (17,342)Extraordinary gain, net - - 1,182 Cumulative effect of accounting changes, net - - (38)Net loss (770) (11,753 ) (16,198)Conversion and redemption costs – 8% redeemable convertible preferred
stock (287) (29) - Preferred stock dividends and accretion (103) (167 ) (28)Net loss applicable to common shareowners $ (1,160) $ (11,949 ) $ (16,226)Loss per common share — basic and diluted
Loss from continuing operations $ (0.29 ) $ (3.51 ) $ (4.18)Net loss applicable to common shareowners $ (0.29 ) $ (3.49) $ (4.77)
Weighted average number of common shares Outstanding — basic and diluted 3,950 3,427 3,401
See Notes to Consolidated Financial Statements.
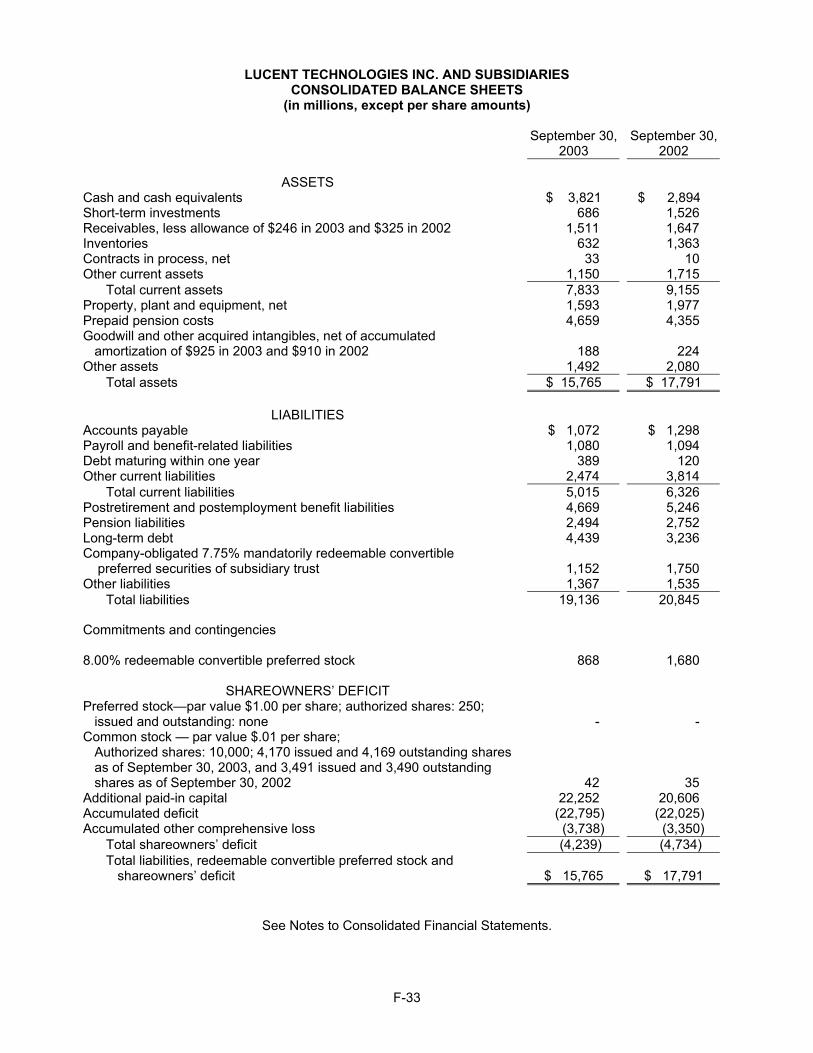
F-33
LUCENT TECHNOLOGIES INC. AND SUBSIDIARIES CONSOLIDATED BALANCE SHEETS
(in millions, except per share amounts)
September 30,
2003 September 30,
2002
ASSETS Cash and cash equivalents $ 3,821 $ 2,894 Short-term investments 686 1,526 Receivables, less allowance of $246 in 2003 and $325 in 2002 1,511 1,647 Inventories 632 1,363 Contracts in process, net 33 10 Other current assets 1,150 1,715
Total current assets 7,833 9,155 Property, plant and equipment, net 1,593 1,977 Prepaid pension costs 4,659 4,355 Goodwill and other acquired intangibles, net of accumulated
amortization of $925 in 2003 and $910 in 2002 188 224 Other assets 1,492 2,080
Total assets $ 15,765 $ 17,791
LIABILITIES Accounts payable $ 1,072 $ 1,298 Payroll and benefit-related liabilities 1,080 1,094 Debt maturing within one year 389 120 Other current liabilities 2,474 3,814
Total current liabilities 5,015 6,326 Postretirement and postemployment benefit liabilities 4,669 5,246 Pension liabilities 2,494 2,752 Long-term debt 4,439 3,236 Company-obligated 7.75% mandatorily redeemable convertible preferred securities of subsidiary trust 1,152 1,750 Other liabilities 1,367 1,535
Total liabilities 19,136 20,845 Commitments and contingencies 8.00% redeemable convertible preferred stock 868 1,680
SHAREOWNERS’ DEFICIT
Preferred stock—par value $1.00 per share; authorized shares: 250; issued and outstanding: none - -
Common stock — par value $.01 per share; Authorized shares: 10,000; 4,170 issued and 4,169 outstanding shares as of September 30, 2003, and 3,491 issued and 3,490 outstanding shares as of September 30, 2002 42 35
Additional paid-in capital 22,252 20,606 Accumulated deficit (22,795) (22,025) Accumulated other comprehensive loss (3,738) (3,350)
Total shareowners’ deficit (4,239) (4,734) Total liabilities, redeemable convertible preferred stock and
shareowners’ deficit $ 15,765
$ 17,791
See Notes to Consolidated Financial Statements.
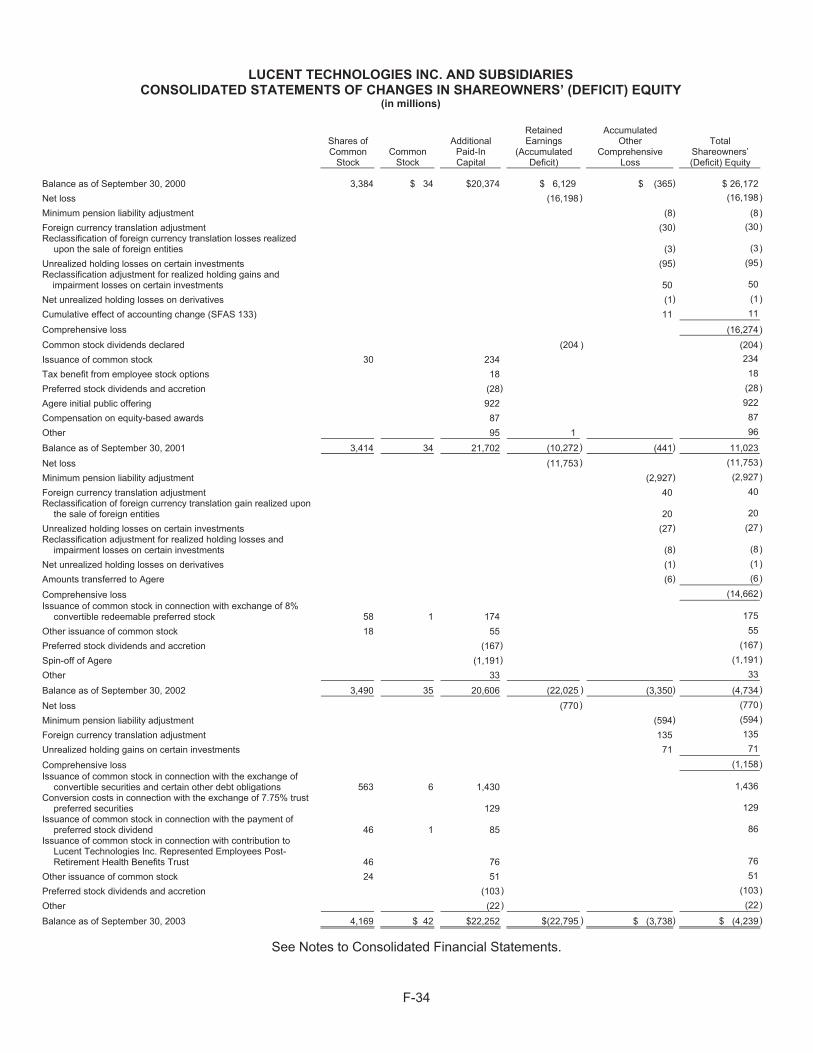
F-34
LUCENT TECHNOLOGIES INC. AND SUBSIDIARIES CONSOLIDATED STATEMENTS OF CHANGES IN SHAREOWNERS’ (DEFICIT) EQUITY
(in millions)
Shares of Common
Stock Common
Stock
AdditionalPaid-In Capital
Retained Earnings
(Accumulated Deficit)
Accumulated Other
Comprehensive Loss
Total Shareowners’ (Deficit) Equity
Balance as of September 30, 2000 3,384 $ 34 $20,374 $ 6,129 $ (365) $ 26,172 Net loss (16,198 ) (16,198) Minimum pension liability adjustment (8) (8) Foreign currency translation adjustment (30) (30) Reclassification of foreign currency translation losses realized
upon the sale of foreign entities (3) (3) Unrealized holding losses on certain investments (95) (95) Reclassification adjustment for realized holding gains and impairment losses on certain investments 50 50 Net unrealized holding losses on derivatives (1) (1) Cumulative effect of accounting change (SFAS 133) 11 11
Comprehensive loss (16,274)
Common stock dividends declared (204 ) (204) Issuance of common stock 30 234 234 Tax benefit from employee stock options 18 18 Preferred stock dividends and accretion (28) (28) Agere initial public offering 922 922 Compensation on equity-based awards 87 87 Other 95 1 96
Balance as of September 30, 2001 3,414 34 21,702 (10,272 ) (441) 11,023
Net loss (11,753 ) (11,753) Minimum pension liability adjustment (2,927) (2,927) Foreign currency translation adjustment 40 40 Reclassification of foreign currency translation gain realized upon
the sale of foreign entities 20 20 Unrealized holding losses on certain investments (27) (27) Reclassification adjustment for realized holding losses and
impairment losses on certain investments (8) (8) Net unrealized holding losses on derivatives (1) (1) Amounts transferred to Agere (6) (6)
Comprehensive loss (14,662) Issuance of common stock in connection with exchange of 8%
convertible redeemable preferred stock 58 1 174 175 Other issuance of common stock 18 55 55 Preferred stock dividends and accretion (167) (167) Spin-off of Agere (1,191) (1,191) Other 33 33
Balance as of September 30, 2002 3,490 35 20,606 (22,025 ) (3,350) (4,734)
Net loss (770 ) (770) Minimum pension liability adjustment (594) (594) Foreign currency translation adjustment 135 135 Unrealized holding gains on certain investments 71 71
Comprehensive loss (1,158) Issuance of common stock in connection with the exchange of
convertible securities and certain other debt obligations 563 6 1,430 1,436 Conversion costs in connection with the exchange of 7.75% trust
preferred securities 129 129 Issuance of common stock in connection with the payment of
preferred stock dividend 46 1 85 86 Issuance of common stock in connection with contribution to
Lucent Technologies Inc. Represented Employees Post-Retirement Health Benefits Trust 46 76 76
Other issuance of common stock 24 51 51 Preferred stock dividends and accretion (103) (103) Other (22) (22)
Balance as of September 30, 2003 4,169 $ 42 $22,252 $(22,795 ) $ (3,738) $ (4,239)
See Notes to Consolidated Financial Statements.
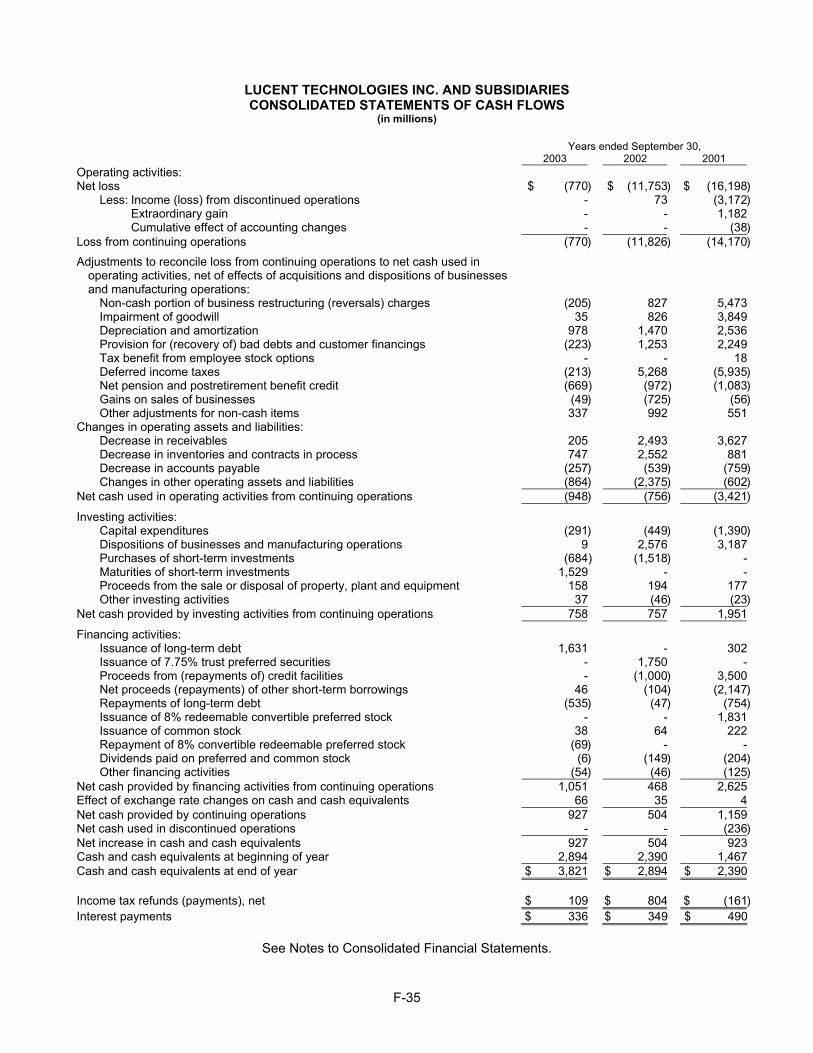
F-35
LUCENT TECHNOLOGIES INC. AND SUBSIDIARIES CONSOLIDATED STATEMENTS OF CASH FLOWS
(in millions)
Years ended September 30, 2003 2002 2001
Operating activities: Net loss $ (770) $ (11,753 ) $ (16,198)
Less: Income (loss) from discontinued operations - 73 (3,172) Extraordinary gain - - 1,182 Cumulative effect of accounting changes - - (38)
Loss from continuing operations (770) (11,826 ) (14,170)
Adjustments to reconcile loss from continuing operations to net cash used in operating activities, net of effects of acquisitions and dispositions of businesses and manufacturing operations:
Non-cash portion of business restructuring (reversals) charges (205) 827 5,473 Impairment of goodwill 35 826 3,849 Depreciation and amortization 978 1,470 2,536 Provision for (recovery of) bad debts and customer financings (223) 1,253 2,249 Tax benefit from employee stock options - - 18 Deferred income taxes (213) 5,268 (5,935) Net pension and postretirement benefit credit (669) (972) (1,083) Gains on sales of businesses (49) (725) (56) Other adjustments for non-cash items 337 992 551
Changes in operating assets and liabilities: Decrease in receivables 205 2,493 3,627 Decrease in inventories and contracts in process 747 2,552 881 Decrease in accounts payable (257) (539) (759) Changes in other operating assets and liabilities (864) (2,375) (602)
Net cash used in operating activities from continuing operations (948) (756) (3,421)
Investing activities: Capital expenditures (291) (449) (1,390) Dispositions of businesses and manufacturing operations 9 2,576 3,187 Purchases of short-term investments (684) (1,518) - Maturities of short-term investments 1,529 - - Proceeds from the sale or disposal of property, plant and equipment 158 194 177 Other investing activities 37 (46) (23)
Net cash provided by investing activities from continuing operations 758 757 1,951
Financing activities: Issuance of long-term debt 1,631 - 302 Issuance of 7.75% trust preferred securities - 1,750 - Proceeds from (repayments of) credit facilities - (1,000) 3,500 Net proceeds (repayments) of other short-term borrowings 46 (104) (2,147) Repayments of long-term debt (535) (47) (754) Issuance of 8% redeemable convertible preferred stock - - 1,831 Issuance of common stock 38 64 222 Repayment of 8% convertible redeemable preferred stock (69) - - Dividends paid on preferred and common stock (6) (149) (204) Other financing activities (54) (46) (125)
Net cash provided by financing activities from continuing operations 1,051 468 2,625 Effect of exchange rate changes on cash and cash equivalents 66 35 4 Net cash provided by continuing operations 927 504 1,159 Net cash used in discontinued operations - - (236) Net increase in cash and cash equivalents 927 504 923 Cash and cash equivalents at beginning of year 2,894 2,390 1,467 Cash and cash equivalents at end of year $ 3,821 $ 2,894 $ 2,390 Income tax refunds (payments), net $ 109 $ 804 $ (161) Interest payments $ 336 $ 349 $ 490
See Notes to Consolidated Financial Statements.
LUCENT TECHNOLOGIES INC. NOTES TO CONSOLIDATED FINANCIAL STATEMENTS
F-36
1. SUMMARY OF SIGNIFICANT ACCOUNTING POLICIES Basis of Consolidation The consolidated financial statements include all majority-owned subsidiaries over which we exercise control. We consolidated a variable-interest entity in accordance with FASB Interpretation No. 46, “Consolidation of Variable Interest Entities” (“FIN 46”), since it was determined that we were the primary beneficiary. Refer to Note 9 for additional information. Investments over which we exercise significant influence, but do not control (generally a 20% to 50% ownership interest), are accounted for under the equity method of accounting. All material intercompany transactions and balances have been eliminated. Except as otherwise noted, all amounts and disclosures reflect only continuing operations. In January 2003, the FASB issued FIN 46, requiring the consolidation of certain variable interest entities. In general, a variable interest entity is a corporation, partnership, trust or other legal structure used for business purposes that either does not have equity investors with voting rights or lacks sufficient financial resources to support its activities. Prior to the issuance of FIN 46, VIEs were more commonly referred to as special-purpose entities or off-balance sheet arrangements. A company must consolidate a VIE if it is determined to be the VIE’s primary beneficiary that stands to share in the majority of the VIE’s expected losses or expected residual returns. Use of Estimates The consolidated financial statements are prepared in conformity with accounting principles generally accepted in the United States of America. Our consolidated financial statements are based on the selection of accounting policies and the application of significant accounting estimates, some of which require management to make significant assumptions. We believe that some of the more critical estimates and related assumptions that affect our financial condition and results of operations are in the areas of revenue recognition, receivables and customer financing, inventories, income taxes, intangible assets, pension and postretirement benefits, business restructuring and legal contingencies. Estimates and assumptions are periodically reviewed, and the effects of any material revisions are reflected in the consolidated financial statements in the period that they are determined to be necessary. Foreign Currency Translation For operations outside the United States that prepare financial statements in currencies other than the U.S. dollar, results of operations and cash flows are translated at average exchange rates during the period, and assets and liabilities are translated at end-of-period exchange rates. Translation adjustments are included as a separate component of accumulated other comprehensive loss in shareowners’ deficit. Revenue Recognition Revenue is recognized when persuasive evidence of an agreement exists, delivery has occurred, the amount is fixed and determinable, and collection of the resulting receivable, including receivables of customers to which we have provided customer financing, is probable. For sales generated from long-term contracts, primarily those related to customized network solutions and network build-outs, the percentage of completion method of accounting is generally used and progress towards completion is measured using units of delivery. In doing that process, we make important judgments in estimating revenue and costs and in measuring progress toward completion. These judgments underlie the determinations regarding overall contract value, contract profitability and timing of revenue recognition. Revenue and cost estimates are revised periodically based on changes in circumstances; any losses on contracts are recognized immediately. We also sell products through multiple distribution channels, including resellers and distributors. For products sold through these channels, revenue is generally recognized when the reseller or distributor sells the product to the end user.
F-37
Most sales are generated from complex contractual arrangements that require significant revenue recognition judgments, particularly in the areas of multiple-element arrangements and collectibility. Revenues from contracts with multiple-element arrangements, such as those including installation and integration services, are recognized as each element is earned based on the relative fair value of each element and only when there are no undelivered elements that are essential to the functionality of the delivered elements. We have determined that most equipment is generally installed by us within 90 days, but can be installed by the customer or a third party. As a result, revenue is recognized when title passes to the customer, which usually is upon delivery of the equipment, provided all other revenue recognition criteria are met. Services revenues are generally recognized at time of performance. In the current market environment, the assessment of collectibility is particularly critical in determining whether revenue should be recognized. As part of the revenue recognition process, we determine whether trade and notes receivables are reasonably assured of collection based on various factors, including the ability to sell those receivables and whether there has been deterioration in the credit quality of customers that could result in the inability to collect or sell the receivables. In situations where we have the ability to sell the receivables, revenue is recognized to the extent of the value we could reasonably expect to realize from the sale. We defer revenue and related costs when we are uncertain as to whether we will be able to collect or sell the receivable. We defer revenue but recognize costs when we determine that the collection or sale of the receivable is unlikely. Research and Development and Software Development Costs Research and development costs are charged to expense as incurred. However, the costs incurred for the development of computer software that will be sold, leased or otherwise marketed (“marketed software”) are capitalized when technological feasibility has been established, generally when all of the planning, designing, coding and testing activities that are necessary in order to establish that the product can be produced to meet its design specifications, including functions, features and technical performance requirements, are completed. These capitalized costs are subject to an ongoing assessment of recoverability based on anticipated future revenues and changes in hardware and software technologies. Costs that are capitalized include direct labor and related overhead. Capitalization ceases and amortization of marketed software development costs begins when the product is available for general release to customers. Amortization is provided on a product-by-product basis, generally using the straight-line method over a 12 to 18-month period. Unamortized marketed software development costs determined to be in excess of the net realizable value of the product are expensed immediately. Internal Use Software We capitalize direct costs incurred during the application development stage and the implementation stage for developing, purchasing or otherwise acquiring software for internal use. These costs are amortized over the estimated useful lives of the software, generally three years. All costs incurred during the preliminary project stage are expensed as incurred. Stock-Based Compensation We follow Accounting Principles Board Opinion No. 25, “Accounting for Stock Issued to Employees,” for our stock-based compensation plans and do not recognize expense for stock option grants if the exercise price is at least equal to the market value of the common stock at the date of grant. Stock-based compensation expense reflected in the as reported net loss includes expense for restricted stock unit awards and option modifications and the amortization of certain acquisition-related deferred compensation expense. The following table summarizes the pro forma effect of stock-based compensation on net loss and loss per share as if the fair value expense recognition provisions of Statement of Financial Accounting Standards (“SFAS”) No. 123, “Accounting for Stock-Based Compensation,” had been adopted. No tax benefits were attributed to the stock-based employee compensation expense during fiscal 2003 due to providing a full valuation allowance on net deferred tax assets.
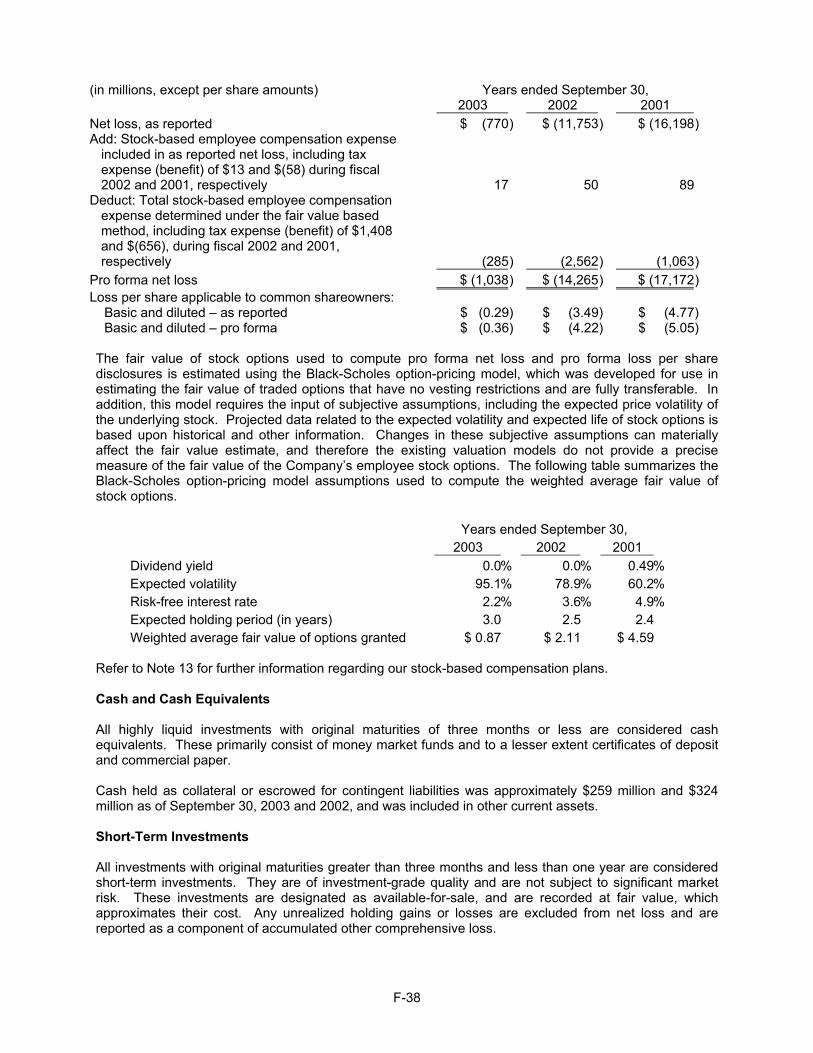
F-38
(in millions, except per share amounts) Years ended September 30, 2003 2002 2001 Net loss, as reported $ (770 ) $ (11,753) $ (16,198) Add: Stock-based employee compensation expense
included in as reported net loss, including tax expense (benefit) of $13 and $(58) during fiscal 2002 and 2001, respectively
17
50 89
Deduct: Total stock-based employee compensation expense determined under the fair value based method, including tax expense (benefit) of $1,408 and $(656), during fiscal 2002 and 2001, respectively
(285
) (2,562) (1,063)
Pro forma net loss $ (1,038 ) $ (14,265) $ (17,172 ) Loss per share applicable to common shareowners: Basic and diluted – as reported $ (0.29) $ (3.49) $ (4.77) Basic and diluted – pro forma $ (0.36) $ (4.22) $ (5.05) The fair value of stock options used to compute pro forma net loss and pro forma loss per share disclosures is estimated using the Black-Scholes option-pricing model, which was developed for use in estimating the fair value of traded options that have no vesting restrictions and are fully transferable. In addition, this model requires the input of subjective assumptions, including the expected price volatility of the underlying stock. Projected data related to the expected volatility and expected life of stock options is based upon historical and other information. Changes in these subjective assumptions can materially affect the fair value estimate, and therefore the existing valuation models do not provide a precise measure of the fair value of the Company’s employee stock options. The following table summarizes the Black-Scholes option-pricing model assumptions used to compute the weighted average fair value of stock options.
Years ended September 30, 2003 2002 2001
Dividend yield 0.0 % 0.0% 0.49% Expected volatility 95.1% 78.9% 60.2% Risk-free interest rate 2.2% 3.6% 4.9% Expected holding period (in years) 3.0 2.5 2.4 Weighted average fair value of options granted $ 0.87 $ 2.11 $ 4.59
Refer to Note 13 for further information regarding our stock-based compensation plans. Cash and Cash Equivalents All highly liquid investments with original maturities of three months or less are considered cash equivalents. These primarily consist of money market funds and to a lesser extent certificates of deposit and commercial paper. Cash held as collateral or escrowed for contingent liabilities was approximately $259 million and $324 million as of September 30, 2003 and 2002, and was included in other current assets. Short-Term Investments All investments with original maturities greater than three months and less than one year are considered short-term investments. They are of investment-grade quality and are not subject to significant market risk. These investments are designated as available-for-sale, and are recorded at fair value, which approximates their cost. Any unrealized holding gains or losses are excluded from net loss and are reported as a component of accumulated other comprehensive loss.
F-39
Inventories Inventories are stated at the lower of cost (determined principally on a first-in, first-out basis) or market. Contracts in Process Net contracts in process are stated at cost plus accrued profits less progress billings. Property, Plant and Equipment Property, plant and equipment are stated at cost less accumulated depreciation. Depreciation is determined using accelerated and straight-line methods over the estimated useful lives of the various asset classes. Useful lives for buildings and building improvements, furniture and fixtures, and machinery and equipment principally range from five to fifty years, five to ten years and two to ten years, respectively. Financial Instruments Various financial instruments, including foreign exchange forward and option contracts and interest rate swap agreements, are used to manage risk by generating cash flows that offset the cash flows of certain transactions in foreign currencies or underlying financial instruments in relation to their amount and timing. Our derivative financial instruments are for purposes other than trading. Non-derivative financial instruments include letters of credit, commitments to extend credit and guarantees of debt. Our investment portfolio includes securities accounted for under the cost and equity methods, as well as equity investments in public and privately held companies that are generally concentrated in high-technology industries. These investments are included in other assets. Marketable equity securities with readily determinable fair values are classified as available-for-sale securities and reported at fair value. Unrealized gains and losses on the changes in fair value of these securities are reported as a component of accumulated other comprehensive loss until sold or considered to be other than temporarily impaired. At the time of sale, any such gains or losses are recognized in other income (expense). All equity investments are periodically reviewed to determine if declines in fair value below cost basis are other-than-temporary. Significant and sustained decreases in quoted market prices, a series of historical and projected operating losses by the investee or other factors are considered as part of the review. If the decline in fair value has been determined to be other-than-temporary, an impairment loss is recorded in other income (expense), and the individual security is written down to a new cost basis. Securitizations and Transfers of Financial Instruments We may sell trade and notes receivables with or without recourse and/or discounts in the normal course of business. The receivables are removed from the consolidated balance sheet at the time they are sold. Sales and transfers that do not meet the criteria for surrender of control are accounted for as secured borrowings. The value assigned to undivided interests retained in securitized trade receivables is based on the relative fair values of the interests retained and sold in the securitization. Fair values are measured by the present value of estimated future cash flows of the securitization facility. Refer to Note 16 for further discussions of securitizations and transfers of financial instruments. Goodwill and Other Intangible Assets On October 1, 2002, SFAS 142, “Goodwill and Other Intangible Assets,” was adopted. As a result, goodwill is no longer amortized but is tested for impairment in the fourth quarter of each fiscal year or more often if an event or circumstance indicates that an impairment loss has been incurred, by comparing each reporting unit's implied fair value to its carrying value. We experienced no transitional impairment loss upon adoption of SFAS 142. Prior to adoption, goodwill and identifiable intangible assets were amortized on a straight-line basis over their estimated useful lives. Other acquired intangibles continue to be amortized on a straight-line basis over the periods benefited, principally in the range of four to six years.
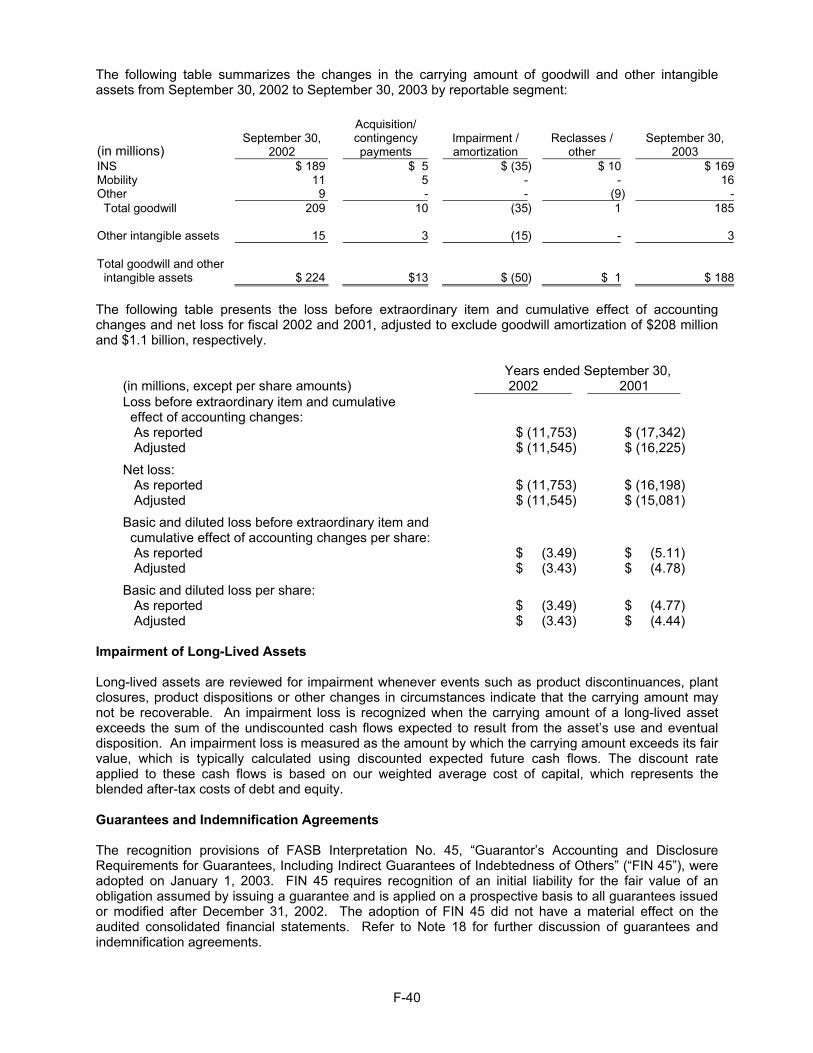
F-40
The following table summarizes the changes in the carrying amount of goodwill and other intangible assets from September 30, 2002 to September 30, 2003 by reportable segment: (in millions)
September 30, 2002
Acquisition/ contingency payments
Impairment / amortization
Reclasses / other
September 30,
2003 INS $ 189 $ 5 $ (35) $ 10 $ 169Mobility 11 5 - - 16Other 9 - - (9) - Total goodwill 209 10 (35) 1 185 Other intangible assets 15 3 (15) - 3 Total goodwill and other intangible assets
$ 224
$13
$ (50
) $ 1
$ 188
The following table presents the loss before extraordinary item and cumulative effect of accounting changes and net loss for fiscal 2002 and 2001, adjusted to exclude goodwill amortization of $208 million and $1.1 billion, respectively.
Years ended September 30, (in millions, except per share amounts) 2002 2001 Loss before extraordinary item and cumulative effect of accounting changes:
As reported $ (11,753) $ (17,342) Adjusted $ (11,545) $ (16,225) Net loss: As reported $ (11,753) $ (16,198) Adjusted $ (11,545) $ (15,081) Basic and diluted loss before extraordinary item and cumulative effect of accounting changes per share:
As reported $ (3.49) $ (5.11) Adjusted $ (3.43) $ (4.78) Basic and diluted loss per share: As reported $ (3.49) $ (4.77) Adjusted $ (3.43) $ (4.44)
Impairment of Long-Lived Assets Long-lived assets are reviewed for impairment whenever events such as product discontinuances, plant closures, product dispositions or other changes in circumstances indicate that the carrying amount may not be recoverable. An impairment loss is recognized when the carrying amount of a long-lived asset exceeds the sum of the undiscounted cash flows expected to result from the asset’s use and eventual disposition. An impairment loss is measured as the amount by which the carrying amount exceeds its fair value, which is typically calculated using discounted expected future cash flows. The discount rate applied to these cash flows is based on our weighted average cost of capital, which represents the blended after-tax costs of debt and equity. Guarantees and Indemnification Agreements The recognition provisions of FASB Interpretation No. 45, “Guarantor’s Accounting and Disclosure Requirements for Guarantees, Including Indirect Guarantees of Indebtedness of Others” (“FIN 45”), were adopted on January 1, 2003. FIN 45 requires recognition of an initial liability for the fair value of an obligation assumed by issuing a guarantee and is applied on a prospective basis to all guarantees issued or modified after December 31, 2002. The adoption of FIN 45 did not have a material effect on the audited consolidated financial statements. Refer to Note 18 for further discussion of guarantees and indemnification agreements.
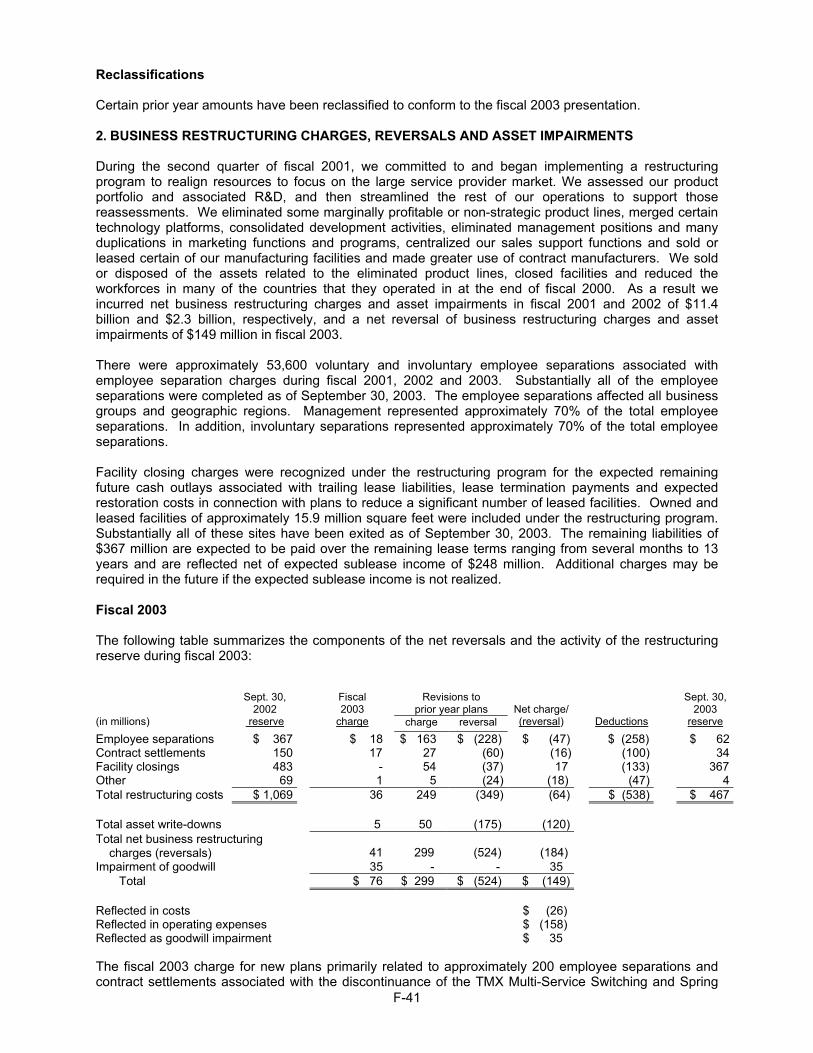
F-41
Reclassifications Certain prior year amounts have been reclassified to conform to the fiscal 2003 presentation. 2. BUSINESS RESTRUCTURING CHARGES, REVERSALS AND ASSET IMPAIRMENTS During the second quarter of fiscal 2001, we committed to and began implementing a restructuring program to realign resources to focus on the large service provider market. We assessed our product portfolio and associated R&D, and then streamlined the rest of our operations to support those reassessments. We eliminated some marginally profitable or non-strategic product lines, merged certain technology platforms, consolidated development activities, eliminated management positions and many duplications in marketing functions and programs, centralized our sales support functions and sold or leased certain of our manufacturing facilities and made greater use of contract manufacturers. We sold or disposed of the assets related to the eliminated product lines, closed facilities and reduced the workforces in many of the countries that they operated in at the end of fiscal 2000. As a result we incurred net business restructuring charges and asset impairments in fiscal 2001 and 2002 of $11.4 billion and $2.3 billion, respectively, and a net reversal of business restructuring charges and asset impairments of $149 million in fiscal 2003. There were approximately 53,600 voluntary and involuntary employee separations associated with employee separation charges during fiscal 2001, 2002 and 2003. Substantially all of the employee separations were completed as of September 30, 2003. The employee separations affected all business groups and geographic regions. Management represented approximately 70% of the total employee separations. In addition, involuntary separations represented approximately 70% of the total employee separations. Facility closing charges were recognized under the restructuring program for the expected remaining future cash outlays associated with trailing lease liabilities, lease termination payments and expected restoration costs in connection with plans to reduce a significant number of leased facilities. Owned and leased facilities of approximately 15.9 million square feet were included under the restructuring program. Substantially all of these sites have been exited as of September 30, 2003. The remaining liabilities of $367 million are expected to be paid over the remaining lease terms ranging from several months to 13 years and are reflected net of expected sublease income of $248 million. Additional charges may be required in the future if the expected sublease income is not realized. Fiscal 2003 The following table summarizes the components of the net reversals and the activity of the restructuring reserve during fiscal 2003:
Revisions to
prior year plans
(in millions)
Sept. 30,
2002 reserve
Fiscal 2003
charge charge reversal
Net charge/ (reversal)
Deductions
Sept. 30,
2003 reserve
Employee separations $ 367 $ 18 $ 163 $ (228) $ (47) $ (258) $ 62Contract settlements 150 17 27 (60) (16) (100) 34Facility closings 483 - 54 (37) 17 (133) 367Other 69 1 5 (24) (18) (47) 4Total restructuring costs $ 1,069 36 249 (349) (64) $ (538) $ 467 Total asset write-downs 5 50 (175) (120) Total net business restructuring charges (reversals)
41
299
(524)
(184)
Impairment of goodwill 35 - - 35 Total $ 76 $ 299 $ (524) $ (149) Reflected in costs $ (26) Reflected in operating expenses $ (158) Reflected as goodwill impairment $ 35 The fiscal 2003 charge for new plans primarily related to approximately 200 employee separations and contract settlements associated with the discontinuance of the TMX Multi-Service Switching and Spring
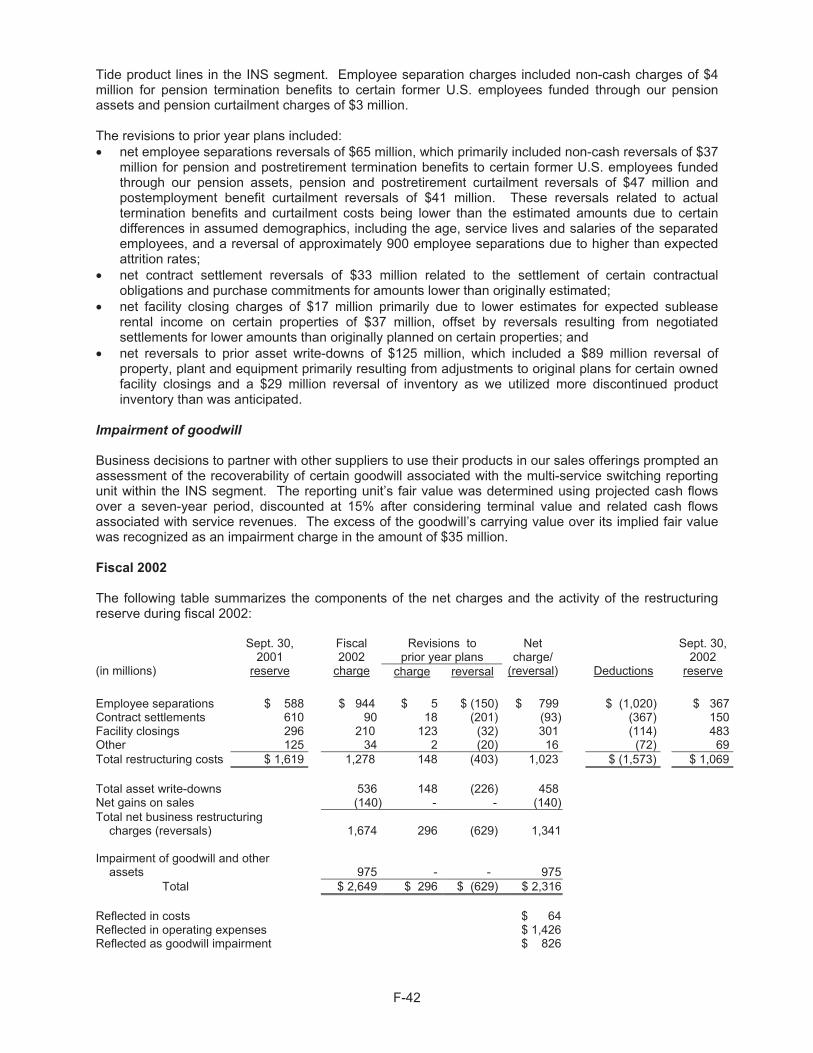
F-42
Tide product lines in the INS segment. Employee separation charges included non-cash charges of $4 million for pension termination benefits to certain former U.S. employees funded through our pension assets and pension curtailment charges of $3 million. The revisions to prior year plans included: • net employee separations reversals of $65 million, which primarily included non-cash reversals of $37
million for pension and postretirement termination benefits to certain former U.S. employees funded through our pension assets, pension and postretirement curtailment reversals of $47 million and postemployment benefit curtailment reversals of $41 million. These reversals related to actual termination benefits and curtailment costs being lower than the estimated amounts due to certain differences in assumed demographics, including the age, service lives and salaries of the separated employees, and a reversal of approximately 900 employee separations due to higher than expected attrition rates;
• net contract settlement reversals of $33 million related to the settlement of certain contractual obligations and purchase commitments for amounts lower than originally estimated;
• net facility closing charges of $17 million primarily due to lower estimates for expected sublease rental income on certain properties of $37 million, offset by reversals resulting from negotiated settlements for lower amounts than originally planned on certain properties; and
• net reversals to prior asset write-downs of $125 million, which included a $89 million reversal of property, plant and equipment primarily resulting from adjustments to original plans for certain owned facility closings and a $29 million reversal of inventory as we utilized more discontinued product inventory than was anticipated.
Impairment of goodwill Business decisions to partner with other suppliers to use their products in our sales offerings prompted an assessment of the recoverability of certain goodwill associated with the multi-service switching reporting unit within the INS segment. The reporting unit’s fair value was determined using projected cash flows over a seven-year period, discounted at 15% after considering terminal value and related cash flows associated with service revenues. The excess of the goodwill’s carrying value over its implied fair value was recognized as an impairment charge in the amount of $35 million. Fiscal 2002 The following table summarizes the components of the net charges and the activity of the restructuring reserve during fiscal 2002:
Revisions to prior year plans
(in millions)
Sept. 30, 2001
reserve
Fiscal 2002
charge charge reversal
Net charge/
(reversal)
Deductions
Sept. 30, 2002
reserve Employee separations $ 588 $ 944 $ 5 $ (150) $ 799 $ (1,020) $ 367Contract settlements 610 90 18 (201) (93) (367) 150Facility closings 296 210 123 (32) 301 (114) 483Other 125 34 2 (20) 16 (72) 69Total restructuring costs $ 1,619 1,278 148 (403) 1,023 $ (1,573) $ 1,069 Total asset write-downs 536 148 (226) 458 Net gains on sales (140) - - (140) Total net business restructuring charges (reversals)
1,674
296
(629)
1,341
Impairment of goodwill and other assets
975
-
-
975
Total $ 2,649 $ 296 $ (629) $ 2,316 Reflected in costs $ 64 Reflected in operating expenses $ 1,426 Reflected as goodwill impairment $ 826
F-43
The fiscal 2002 charge for new plans included: • employee separation charges for approximately 17,300 employees, which included charges for
pension termination benefits of $241 million, $205 million of which were non-cash charges for certain former U.S. employees funded through our pension assets, pension and postretirement curtailment charges of $337 million and postemployment benefit curtailment credits of $34 million;
• contract settlement charges for settlements of purchase commitments with suppliers and contract renegotiations or cancellations of contracts with customers, all of which resulted from the discontinuance of various product lines;
• charges for facility closings representing the expected remaining future cash outlays associated with trailing lease liabilities, lease termination payments and expected restoration costs, net of expected sublease income of $136 million; and
• net asset write-downs for property, plant and equipment write-downs of $304 million, primarily related to facility closings and product rationalizations, capitalized software write-downs of $72 million, inventory charges of $129 million, that were associated with product exits in certain voice networking, data and network management and optical networking products in the INS segment, goodwill and other acquired intangibles write-down of $22 million and other charges of $9 million.
The revisions to prior year plans included: • revisions to employee separation reserves due to higher than expected attrition rates that resulted in
a reduction in expected terminations by 2,200 employees. Also, the actual severance cost per person was lower than the original estimates after execution of the various plans in many countries;
• net contract settlement reversals primarily for settling certain purchase commitments for amounts lower than originally planned;
• net facility closing charges primarily due to additional space consolidation as well as changes in estimates for the amount and timing of expected sublease rental income of $63 million as a result of changes in the current commercial real estate market;
• net reversals to prior asset write-downs primarily related to adjustments to estimated inventory charges. In establishing the initial charge for inventory, we included an estimate of amounts relating to products rationalized or discontinued that were not required to fulfill existing customer obligations. To the extent the fulfillment of those customer obligations differed from amounts estimated, additional inventory charges or reserve reductions were required; and
• net gains on sales related to business dispositions that were contemplated as part of our overall restructuring program, and included $193 million of gains primarily related to the sale of the billing and customer care business and losses of $53 million that were primarily related to the sale of the enterprise professional services business.
Impairment of goodwill and other assets The continued and sharper decline in the telecommunications market prompted an assessment of all key assumptions underlying goodwill valuation judgments, including those relating to short- and long-term growth rates. It was determined that the carrying values of goodwill and other intangible assets primarily related to the September 2000 acquisition of Spring Tide were less than the forecasted undiscounted cash flows. As a result, a goodwill impairment charge and other intangible assets impairment charges of $826 million and $149 million, respectively, were recognized based on the difference between the estimated fair values and corresponding carrying values. Fair values were determined on the basis of discounted cash flows.
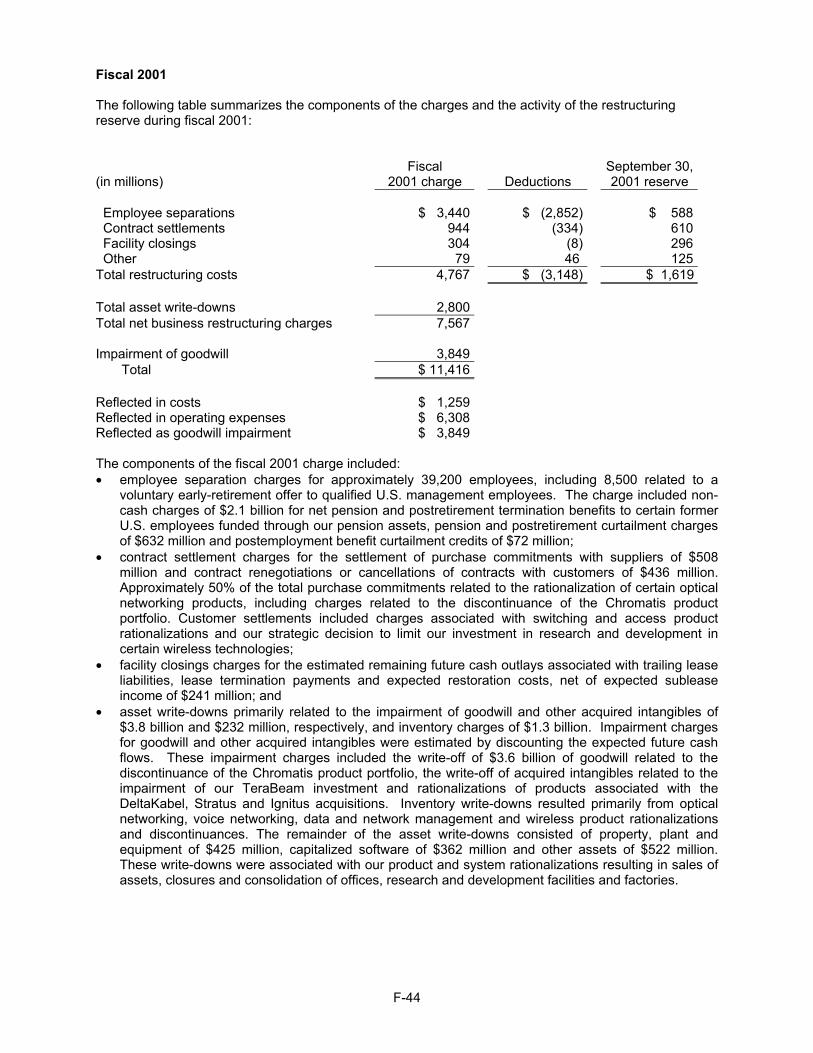
F-44
Fiscal 2001 The following table summarizes the components of the charges and the activity of the restructuring reserve during fiscal 2001: (in millions)
Fiscal
2001 charge
Deductions
September 30, 2001 reserve
Employee separations $ 3,440 $ (2,852) $ 588 Contract settlements 944 (334) 610 Facility closings 304 (8) 296 Other 79 46 125Total restructuring costs 4,767 $ (3,148) $ 1,619 Total asset write-downs 2,800 Total net business restructuring charges 7,567 Impairment of goodwill 3,849 Total $ 11,416 Reflected in costs $ 1,259 Reflected in operating expenses $ 6,308 Reflected as goodwill impairment $ 3,849 The components of the fiscal 2001 charge included: • employee separation charges for approximately 39,200 employees, including 8,500 related to a
voluntary early-retirement offer to qualified U.S. management employees. The charge included non-cash charges of $2.1 billion for net pension and postretirement termination benefits to certain former U.S. employees funded through our pension assets, pension and postretirement curtailment charges of $632 million and postemployment benefit curtailment credits of $72 million;
• contract settlement charges for the settlement of purchase commitments with suppliers of $508 million and contract renegotiations or cancellations of contracts with customers of $436 million. Approximately 50% of the total purchase commitments related to the rationalization of certain optical networking products, including charges related to the discontinuance of the Chromatis product portfolio. Customer settlements included charges associated with switching and access product rationalizations and our strategic decision to limit our investment in research and development in certain wireless technologies;
• facility closings charges for the estimated remaining future cash outlays associated with trailing lease liabilities, lease termination payments and expected restoration costs, net of expected sublease income of $241 million; and
• asset write-downs primarily related to the impairment of goodwill and other acquired intangibles of $3.8 billion and $232 million, respectively, and inventory charges of $1.3 billion. Impairment charges for goodwill and other acquired intangibles were estimated by discounting the expected future cash flows. These impairment charges included the write-off of $3.6 billion of goodwill related to the discontinuance of the Chromatis product portfolio, the write-off of acquired intangibles related to the impairment of our TeraBeam investment and rationalizations of products associated with the DeltaKabel, Stratus and Ignitus acquisitions. Inventory write-downs resulted primarily from optical networking, voice networking, data and network management and wireless product rationalizations and discontinuances. The remainder of the asset write-downs consisted of property, plant and equipment of $425 million, capitalized software of $362 million and other assets of $522 million. These write-downs were associated with our product and system rationalizations resulting in sales of assets, closures and consolidation of offices, research and development facilities and factories.
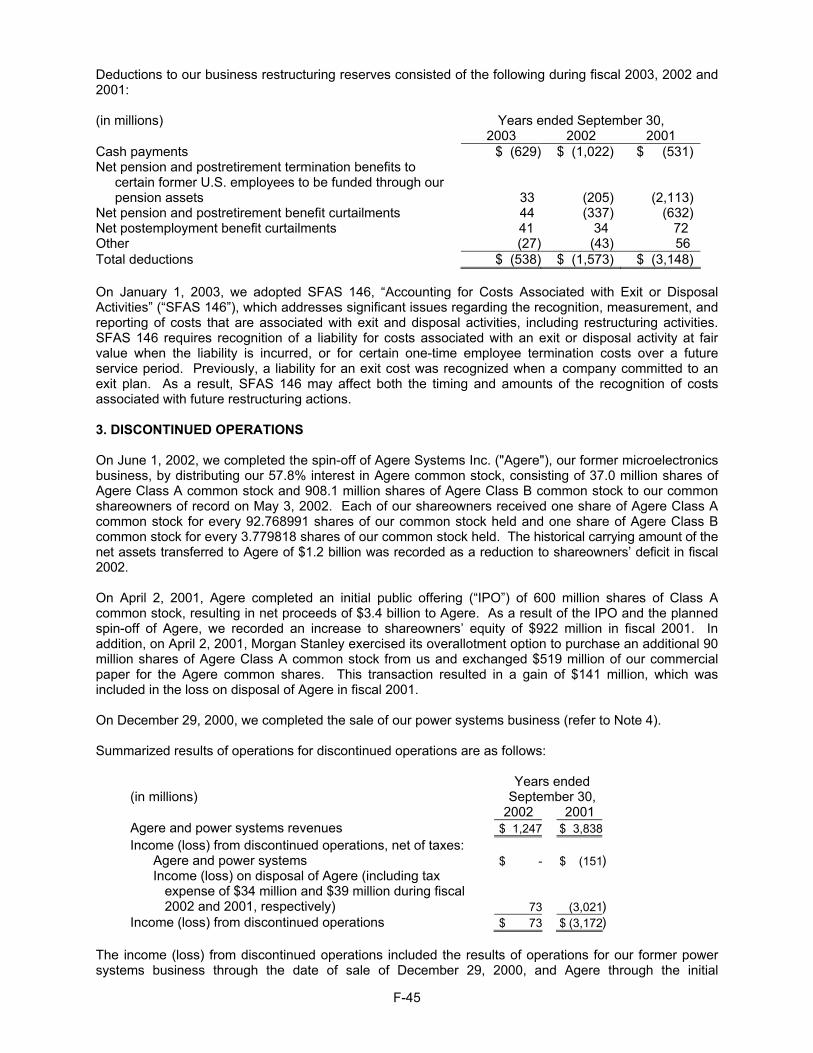
F-45
Deductions to our business restructuring reserves consisted of the following during fiscal 2003, 2002 and 2001: (in millions) Years ended September 30, 2003 2002 2001 Cash payments $ (629) $ (1,022) $ (531)Net pension and postretirement termination benefits to
certain former U.S. employees to be funded through our pension assets
33
(205)
(2,113)Net pension and postretirement benefit curtailments 44 (337) (632)Net postemployment benefit curtailments 41 34 72 Other (27) (43) 56 Total deductions $ (538) $ (1,573) $ (3,148) On January 1, 2003, we adopted SFAS 146, “Accounting for Costs Associated with Exit or Disposal Activities” (“SFAS 146”), which addresses significant issues regarding the recognition, measurement, and reporting of costs that are associated with exit and disposal activities, including restructuring activities. SFAS 146 requires recognition of a liability for costs associated with an exit or disposal activity at fair value when the liability is incurred, or for certain one-time employee termination costs over a future service period. Previously, a liability for an exit cost was recognized when a company committed to an exit plan. As a result, SFAS 146 may affect both the timing and amounts of the recognition of costs associated with future restructuring actions.
3. DISCONTINUED OPERATIONS On June 1, 2002, we completed the spin-off of Agere Systems Inc. ("Agere"), our former microelectronics business, by distributing our 57.8% interest in Agere common stock, consisting of 37.0 million shares of Agere Class A common stock and 908.1 million shares of Agere Class B common stock to our common shareowners of record on May 3, 2002. Each of our shareowners received one share of Agere Class A common stock for every 92.768991 shares of our common stock held and one share of Agere Class B common stock for every 3.779818 shares of our common stock held. The historical carrying amount of the net assets transferred to Agere of $1.2 billion was recorded as a reduction to shareowners’ deficit in fiscal 2002. On April 2, 2001, Agere completed an initial public offering (“IPO”) of 600 million shares of Class A common stock, resulting in net proceeds of $3.4 billion to Agere. As a result of the IPO and the planned spin-off of Agere, we recorded an increase to shareowners’ equity of $922 million in fiscal 2001. In addition, on April 2, 2001, Morgan Stanley exercised its overallotment option to purchase an additional 90 million shares of Agere Class A common stock from us and exchanged $519 million of our commercial paper for the Agere common shares. This transaction resulted in a gain of $141 million, which was included in the loss on disposal of Agere in fiscal 2001. On December 29, 2000, we completed the sale of our power systems business (refer to Note 4). Summarized results of operations for discontinued operations are as follows:
(in millions) Years ended
September 30, 2002 2001
Agere and power systems revenues $ 1,247 $ 3,838 Income (loss) from discontinued operations, net of taxes:
Agere and power systems $ - $ (151) Income (loss) on disposal of Agere (including tax
expense of $34 million and $39 million during fiscal 2002 and 2001, respectively) 73 (3,021)
Income (loss) from discontinued operations $ 73 $ (3,172) The income (loss) from discontinued operations included the results of operations for our former power systems business through the date of sale of December 29, 2000, and Agere through the initial
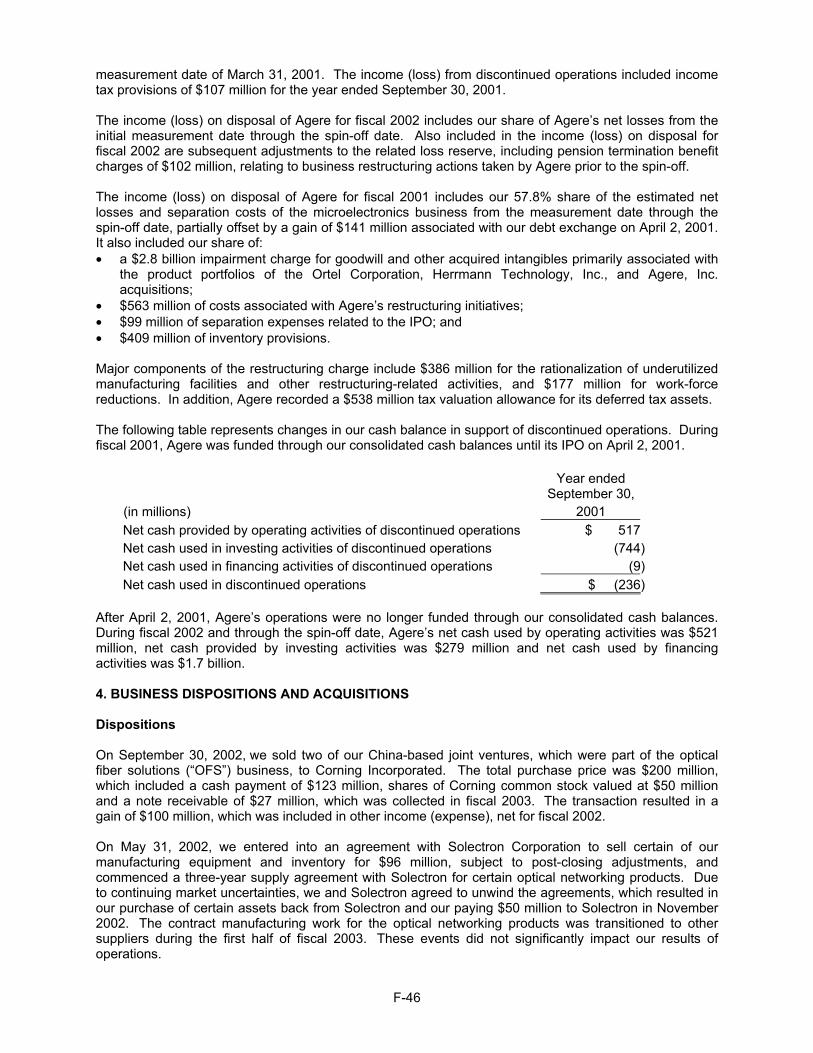
F-46
measurement date of March 31, 2001. The income (loss) from discontinued operations included income tax provisions of $107 million for the year ended September 30, 2001. The income (loss) on disposal of Agere for fiscal 2002 includes our share of Agere’s net losses from the initial measurement date through the spin-off date. Also included in the income (loss) on disposal for fiscal 2002 are subsequent adjustments to the related loss reserve, including pension termination benefit charges of $102 million, relating to business restructuring actions taken by Agere prior to the spin-off. The income (loss) on disposal of Agere for fiscal 2001 includes our 57.8% share of the estimated net losses and separation costs of the microelectronics business from the measurement date through the spin-off date, partially offset by a gain of $141 million associated with our debt exchange on April 2, 2001. It also included our share of: • a $2.8 billion impairment charge for goodwill and other acquired intangibles primarily associated with
the product portfolios of the Ortel Corporation, Herrmann Technology, Inc., and Agere, Inc. acquisitions;
• $563 million of costs associated with Agere’s restructuring initiatives; • $99 million of separation expenses related to the IPO; and • $409 million of inventory provisions. Major components of the restructuring charge include $386 million for the rationalization of underutilized manufacturing facilities and other restructuring-related activities, and $177 million for work-force reductions. In addition, Agere recorded a $538 million tax valuation allowance for its deferred tax assets. The following table represents changes in our cash balance in support of discontinued operations. During fiscal 2001, Agere was funded through our consolidated cash balances until its IPO on April 2, 2001.
(in millions)
Year ended September 30,
2001
Net cash provided by operating activities of discontinued operations $ 517 Net cash used in investing activities of discontinued operations (744) Net cash used in financing activities of discontinued operations (9) Net cash used in discontinued operations $ (236)
After April 2, 2001, Agere’s operations were no longer funded through our consolidated cash balances. During fiscal 2002 and through the spin-off date, Agere’s net cash used by operating activities was $521 million, net cash provided by investing activities was $279 million and net cash used by financing activities was $1.7 billion. 4. BUSINESS DISPOSITIONS AND ACQUISITIONS Dispositions On September 30, 2002, we sold two of our China-based joint ventures, which were part of the optical fiber solutions (“OFS”) business, to Corning Incorporated. The total purchase price was $200 million, which included a cash payment of $123 million, shares of Corning common stock valued at $50 million and a note receivable of $27 million, which was collected in fiscal 2003. The transaction resulted in a gain of $100 million, which was included in other income (expense), net for fiscal 2002. On May 31, 2002, we entered into an agreement with Solectron Corporation to sell certain of our manufacturing equipment and inventory for $96 million, subject to post-closing adjustments, and commenced a three-year supply agreement with Solectron for certain optical networking products. Due to continuing market uncertainties, we and Solectron agreed to unwind the agreements, which resulted in our purchase of certain assets back from Solectron and our paying $50 million to Solectron in November 2002. The contract manufacturing work for the optical networking products was transitioned to other suppliers during the first half of fiscal 2003. These events did not significantly impact our results of operations.
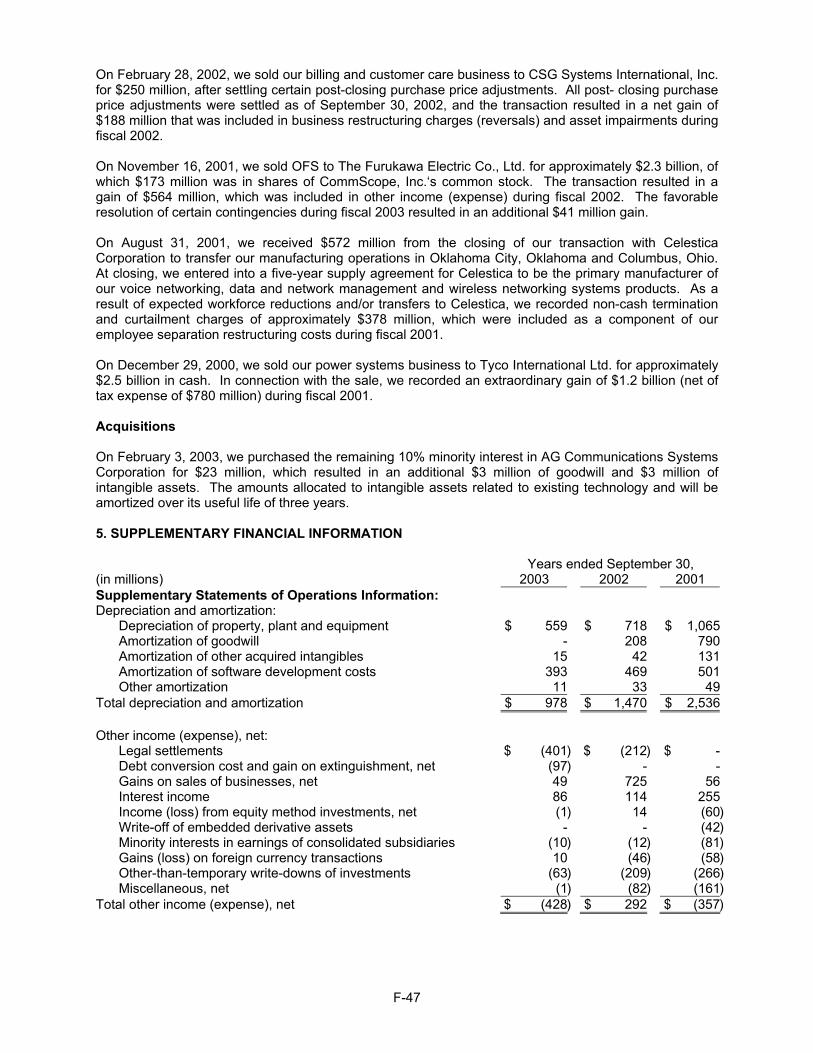
F-47
On February 28, 2002, we sold our billing and customer care business to CSG Systems International, Inc. for $250 million, after settling certain post-closing purchase price adjustments. All post- closing purchase price adjustments were settled as of September 30, 2002, and the transaction resulted in a net gain of $188 million that was included in business restructuring charges (reversals) and asset impairments during fiscal 2002. On November 16, 2001, we sold OFS to The Furukawa Electric Co., Ltd. for approximately $2.3 billion, of which $173 million was in shares of CommScope, Inc.‘s common stock. The transaction resulted in a gain of $564 million, which was included in other income (expense) during fiscal 2002. The favorable resolution of certain contingencies during fiscal 2003 resulted in an additional $41 million gain. On August 31, 2001, we received $572 million from the closing of our transaction with Celestica Corporation to transfer our manufacturing operations in Oklahoma City, Oklahoma and Columbus, Ohio. At closing, we entered into a five-year supply agreement for Celestica to be the primary manufacturer of our voice networking, data and network management and wireless networking systems products. As a result of expected workforce reductions and/or transfers to Celestica, we recorded non-cash termination and curtailment charges of approximately $378 million, which were included as a component of our employee separation restructuring costs during fiscal 2001. On December 29, 2000, we sold our power systems business to Tyco International Ltd. for approximately $2.5 billion in cash. In connection with the sale, we recorded an extraordinary gain of $1.2 billion (net of tax expense of $780 million) during fiscal 2001. Acquisitions On February 3, 2003, we purchased the remaining 10% minority interest in AG Communications Systems Corporation for $23 million, which resulted in an additional $3 million of goodwill and $3 million of intangible assets. The amounts allocated to intangible assets related to existing technology and will be amortized over its useful life of three years. 5. SUPPLEMENTARY FINANCIAL INFORMATION
Years ended September 30, (in millions) 2003 2002 2001 Supplementary Statements of Operations Information: Depreciation and amortization:
Depreciation of property, plant and equipment $ 559 $ 718 $ 1,065 Amortization of goodwill - 208 790 Amortization of other acquired intangibles 15 42 131 Amortization of software development costs 393 469 501 Other amortization 11 33 49
Total depreciation and amortization $ 978 $ 1,470 $ 2,536 Other income (expense), net:
Legal settlements $ (401) $ (212) $ - Debt conversion cost and gain on extinguishment, net (97) - - Gains on sales of businesses, net 49 725 56 Interest income 86 114 255 Income (loss) from equity method investments, net (1) 14 (60) Write-off of embedded derivative assets - - (42) Minority interests in earnings of consolidated subsidiaries (10) (12) (81) Gains (loss) on foreign currency transactions 10 (46) (58) Other-than-temporary write-downs of investments (63) (209) (266) Miscellaneous, net (1) (82) (161)
Total other income (expense), net $ (428) $ 292 $ (357)
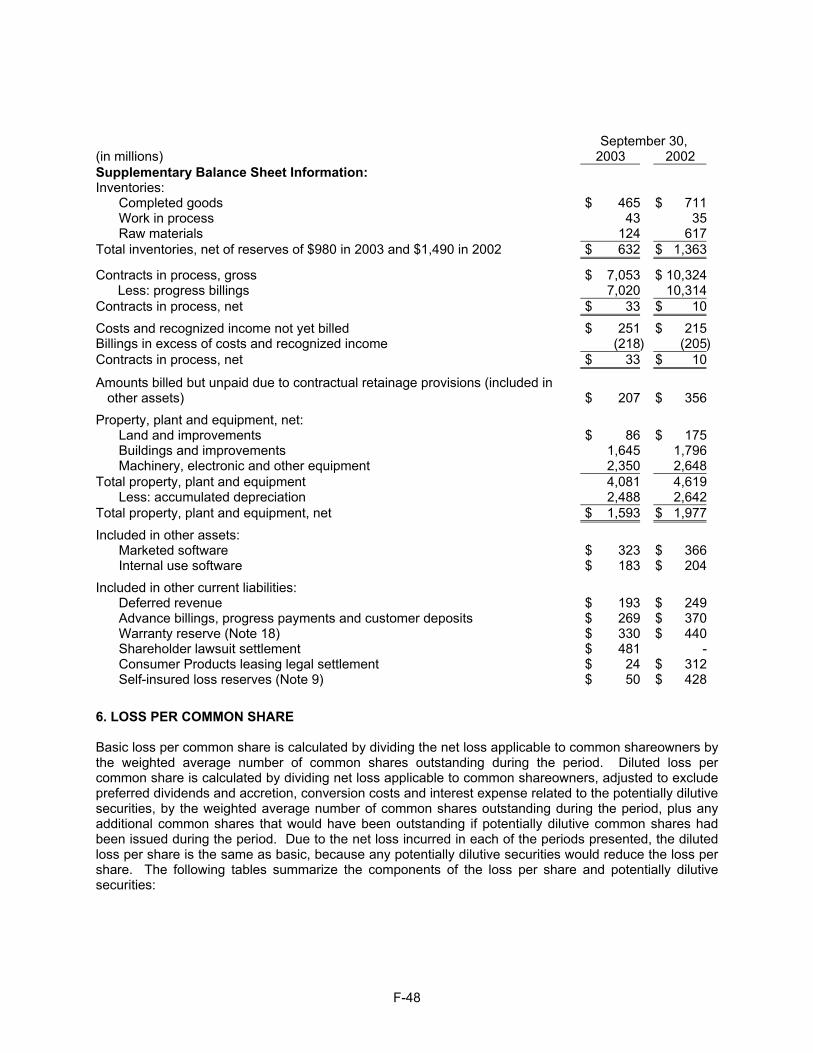
F-48
September 30, (in millions) 2003 2002 Supplementary Balance Sheet Information: Inventories:
Completed goods $ 465 $ 711 Work in process 43 35 Raw materials 124 617
Total inventories, net of reserves of $980 in 2003 and $1,490 in 2002 $ 632 $ 1,363
Contracts in process, gross $ 7,053 $ 10,324 Less: progress billings 7,020 10,314 Contracts in process, net $ 33 $ 10 Costs and recognized income not yet billed $ 251 $ 215 Billings in excess of costs and recognized income (218 ) (205) Contracts in process, net $ 33 $ 10
Amounts billed but unpaid due to contractual retainage provisions (included in other assets)
$ 207 $ 356
Property, plant and equipment, net: Land and improvements $ 86 $ 175 Buildings and improvements 1,645 1,796 Machinery, electronic and other equipment 2,350 2,648
Total property, plant and equipment 4,081 4,619 Less: accumulated depreciation 2,488 2,642
Total property, plant and equipment, net $ 1,593 $ 1,977 Included in other assets:
Marketed software $ 323 $ 366 Internal use software $ 183 $ 204
Included in other current liabilities: Deferred revenue $ 193 $ 249 Advance billings, progress payments and customer deposits $ 269 $ 370 Warranty reserve (Note 18) $ 330 $ 440 Shareholder lawsuit settlement $ 481 - Consumer Products leasing legal settlement $ 24 $ 312 Self-insured loss reserves (Note 9) $ 50 $ 428
6. LOSS PER COMMON SHARE Basic loss per common share is calculated by dividing the net loss applicable to common shareowners by the weighted average number of common shares outstanding during the period. Diluted loss per common share is calculated by dividing net loss applicable to common shareowners, adjusted to exclude preferred dividends and accretion, conversion costs and interest expense related to the potentially dilutive securities, by the weighted average number of common shares outstanding during the period, plus any additional common shares that would have been outstanding if potentially dilutive common shares had been issued during the period. Due to the net loss incurred in each of the periods presented, the diluted loss per share is the same as basic, because any potentially dilutive securities would reduce the loss per share. The following tables summarize the components of the loss per share and potentially dilutive securities:
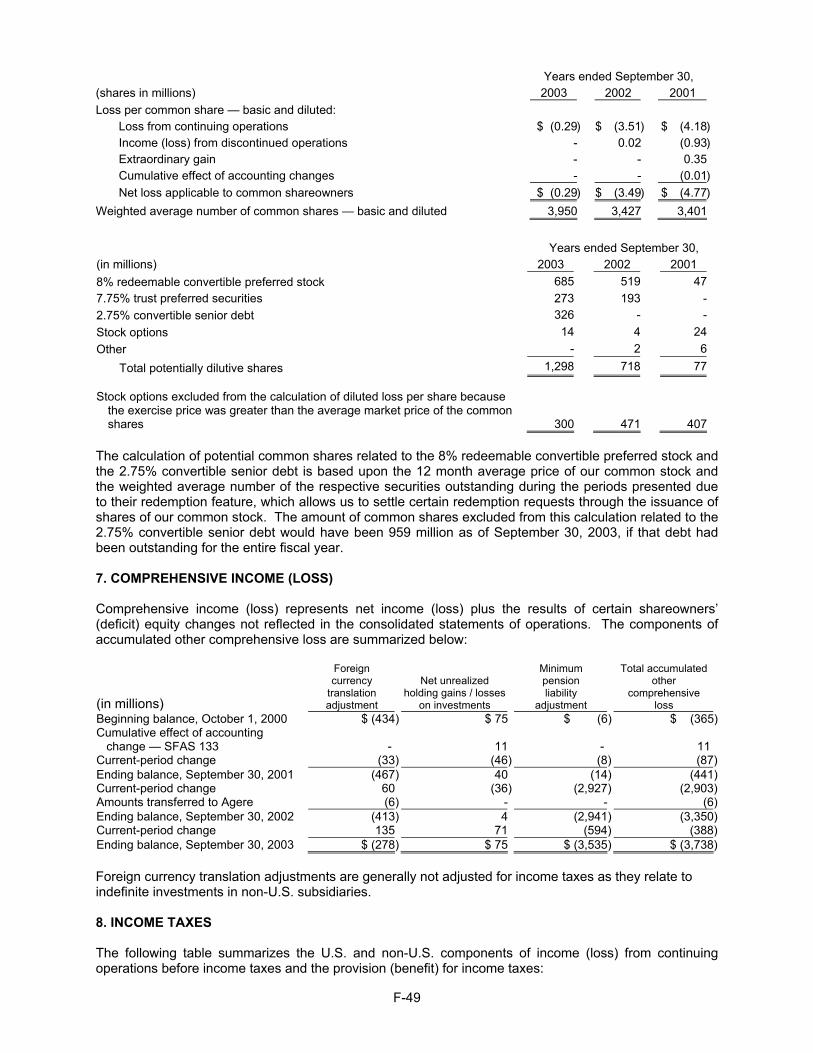
F-49
Years ended September 30, (shares in millions) 2003 2002 2001 Loss per common share — basic and diluted:
Loss from continuing operations $ (0.29) $ (3.51) $ (4.18) Income (loss) from discontinued operations - 0.02 (0.93) Extraordinary gain - - 0.35 Cumulative effect of accounting changes - - (0.01) Net loss applicable to common shareowners $ (0.29) $ (3.49) $ (4.77)
Weighted average number of common shares — basic and diluted 3,950 3,427 3,401
Years ended September 30, (in millions) 2003 2002 2001 8% redeemable convertible preferred stock 685 519 477.75% trust preferred securities 273 193 - 2.75% convertible senior debt 326 - -Stock options 14 4 24Other - 2 6
Total potentially dilutive shares 1,298 718 77
Stock options excluded from the calculation of diluted loss per share because the exercise price was greater than the average market price of the common shares 300
471 407 The calculation of potential common shares related to the 8% redeemable convertible preferred stock and the 2.75% convertible senior debt is based upon the 12 month average price of our common stock and the weighted average number of the respective securities outstanding during the periods presented due to their redemption feature, which allows us to settle certain redemption requests through the issuance of shares of our common stock. The amount of common shares excluded from this calculation related to the 2.75% convertible senior debt would have been 959 million as of September 30, 2003, if that debt had been outstanding for the entire fiscal year. 7. COMPREHENSIVE INCOME (LOSS) Comprehensive income (loss) represents net income (loss) plus the results of certain shareowners’ (deficit) equity changes not reflected in the consolidated statements of operations. The components of accumulated other comprehensive loss are summarized below:
(in millions)
Foreign currency
translation adjustment
Net unrealized holding gains / losses
on investments
Minimum pension liability
adjustment
Total accumulated other
comprehensive loss
Beginning balance, October 1, 2000 $ (434) $ 75 $ (6) $ (365)Cumulative effect of accounting change — SFAS 133 - 11 - 11Current-period change (33) (46) (8) (87)Ending balance, September 30, 2001 (467) 40 (14) (441)Current-period change 60 (36) (2,927) (2,903)Amounts transferred to Agere (6) - - (6)Ending balance, September 30, 2002 (413) 4 (2,941) (3,350)Current-period change 135 71 (594) (388)Ending balance, September 30, 2003 $ (278) $ 75 $ (3,535) $ (3,738) Foreign currency translation adjustments are generally not adjusted for income taxes as they relate to indefinite investments in non-U.S. subsidiaries. 8. INCOME TAXES The following table summarizes the U.S. and non-U.S. components of income (loss) from continuing operations before income taxes and the provision (benefit) for income taxes:
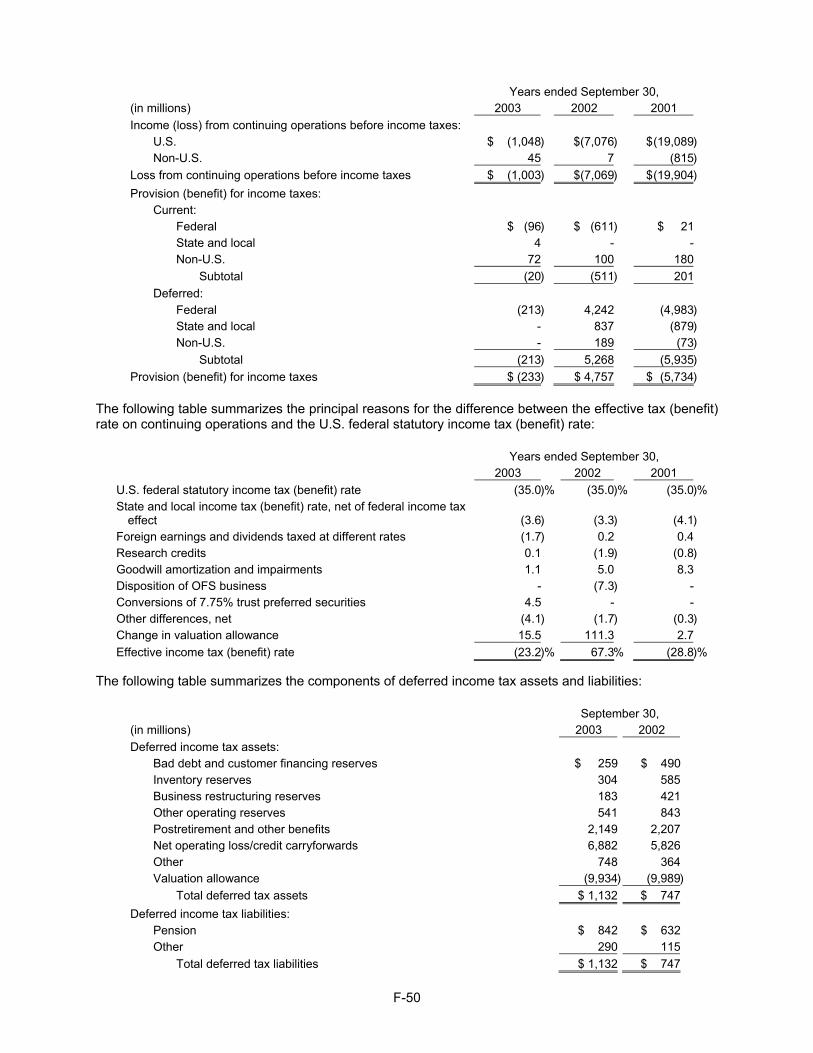
F-50
Years ended September 30,
(in millions) 2003 2002 2001 Income (loss) from continuing operations before income taxes:
U.S. $ (1,048) $(7,076 ) $ (19,089)Non-U.S. 45 7 (815)
Loss from continuing operations before income taxes $ (1,003) $(7,069 ) $ (19,904)Provision (benefit) for income taxes:
Current: Federal $ (96) $ (611) $ 21 State and local 4 - - Non-U.S. 72 100 180
Subtotal (20) (511) 201 Deferred:
Federal (213) 4,242 (4,983 )State and local - 837 (879)Non-U.S. - 189 (73)
Subtotal (213) 5,268 (5,935)Provision (benefit) for income taxes $ (233) $ 4,757 $ (5,734)
The following table summarizes the principal reasons for the difference between the effective tax (benefit) rate on continuing operations and the U.S. federal statutory income tax (benefit) rate:
Years ended September 30, 2003 2002 2001
U.S. federal statutory income tax (benefit) rate (35.0)% (35.0 )% (35.0)%State and local income tax (benefit) rate, net of federal income tax
effect (3.6) (3.3 ) (4.1) Foreign earnings and dividends taxed at different rates (1.7) 0.2 0.4 Research credits 0.1 (1.9 ) (0.8) Goodwill amortization and impairments 1.1 5.0 8.3 Disposition of OFS business - (7.3) - Conversions of 7.75% trust preferred securities 4.5 - - Other differences, net (4.1) (1.7) (0.3) Change in valuation allowance 15.5 111.3 2.7 Effective income tax (benefit) rate (23.2)% 67.3% (28.8)%
The following table summarizes the components of deferred income tax assets and liabilities:
September 30, (in millions) 2003 2002 Deferred income tax assets:
Bad debt and customer financing reserves $ 259 $ 490 Inventory reserves 304 585 Business restructuring reserves 183 421 Other operating reserves 541 843 Postretirement and other benefits 2,149 2,207 Net operating loss/credit carryforwards 6,882 5,826 Other 748 364 Valuation allowance (9,934) (9,989)
Total deferred tax assets $ 1,132 $ 747 Deferred income tax liabilities:
Pension $ 842 $ 632 Other 290 115
Total deferred tax liabilities $ 1,132 $ 747
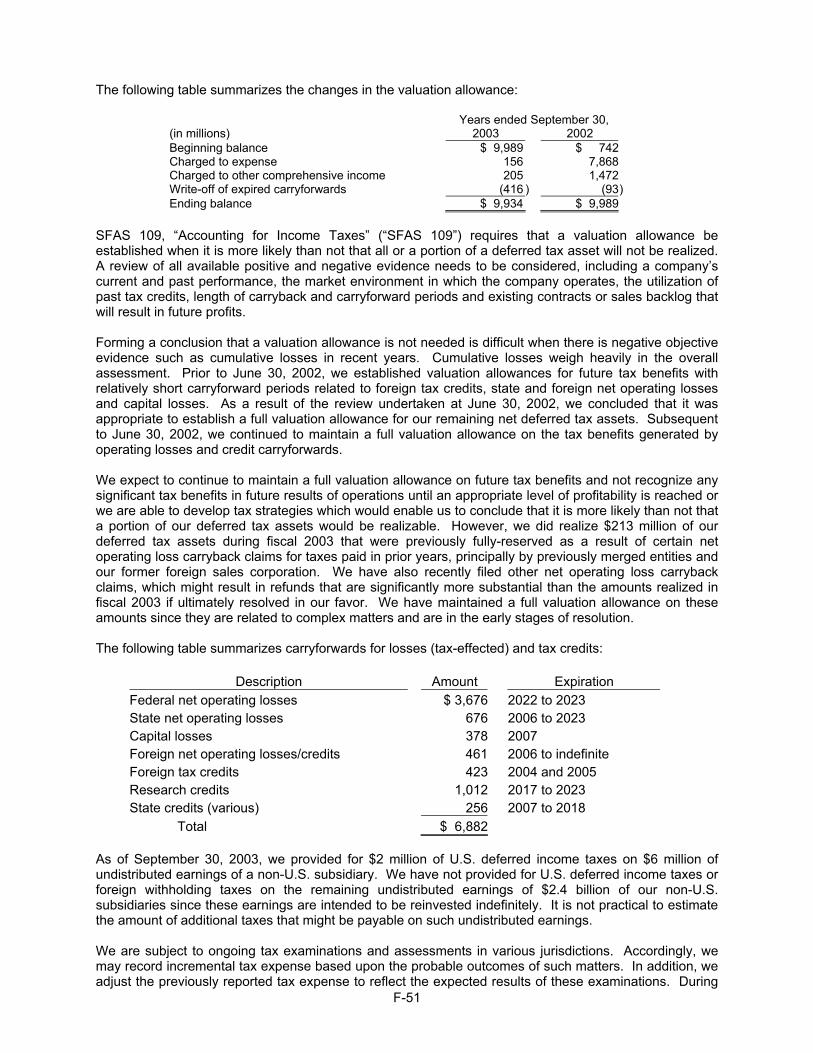
F-51
The following table summarizes the changes in the valuation allowance:
Years ended September 30, (in millions) 2003 2002 Beginning balance $ 9,989 $ 742 Charged to expense 156 7,868 Charged to other comprehensive income 205 1,472 Write-off of expired carryforwards (416 ) (93) Ending balance $ 9,934 $ 9,989
SFAS 109, “Accounting for Income Taxes” (“SFAS 109”) requires that a valuation allowance be established when it is more likely than not that all or a portion of a deferred tax asset will not be realized. A review of all available positive and negative evidence needs to be considered, including a company’s current and past performance, the market environment in which the company operates, the utilization of past tax credits, length of carryback and carryforward periods and existing contracts or sales backlog that will result in future profits. Forming a conclusion that a valuation allowance is not needed is difficult when there is negative objective evidence such as cumulative losses in recent years. Cumulative losses weigh heavily in the overall assessment. Prior to June 30, 2002, we established valuation allowances for future tax benefits with relatively short carryforward periods related to foreign tax credits, state and foreign net operating losses and capital losses. As a result of the review undertaken at June 30, 2002, we concluded that it was appropriate to establish a full valuation allowance for our remaining net deferred tax assets. Subsequent to June 30, 2002, we continued to maintain a full valuation allowance on the tax benefits generated by operating losses and credit carryforwards. We expect to continue to maintain a full valuation allowance on future tax benefits and not recognize any significant tax benefits in future results of operations until an appropriate level of profitability is reached or we are able to develop tax strategies which would enable us to conclude that it is more likely than not that a portion of our deferred tax assets would be realizable. However, we did realize $213 million of our deferred tax assets during fiscal 2003 that were previously fully-reserved as a result of certain net operating loss carryback claims for taxes paid in prior years, principally by previously merged entities and our former foreign sales corporation. We have also recently filed other net operating loss carryback claims, which might result in refunds that are significantly more substantial than the amounts realized in fiscal 2003 if ultimately resolved in our favor. We have maintained a full valuation allowance on these amounts since they are related to complex matters and are in the early stages of resolution. The following table summarizes carryforwards for losses (tax-effected) and tax credits:
Description Amount Expiration Federal net operating losses $ 3,676 2022 to 2023 State net operating losses 676 2006 to 2023 Capital losses 378 2007 Foreign net operating losses/credits 461 2006 to indefinite Foreign tax credits 423 2004 and 2005 Research credits 1,012 2017 to 2023 State credits (various) 256 2007 to 2018
Total $ 6,882 As of September 30, 2003, we provided for $2 million of U.S. deferred income taxes on $6 million of undistributed earnings of a non-U.S. subsidiary. We have not provided for U.S. deferred income taxes or foreign withholding taxes on the remaining undistributed earnings of $2.4 billion of our non-U.S. subsidiaries since these earnings are intended to be reinvested indefinitely. It is not practical to estimate the amount of additional taxes that might be payable on such undistributed earnings. We are subject to ongoing tax examinations and assessments in various jurisdictions. Accordingly, we may record incremental tax expense based upon the probable outcomes of such matters. In addition, we adjust the previously reported tax expense to reflect the expected results of these examinations. During
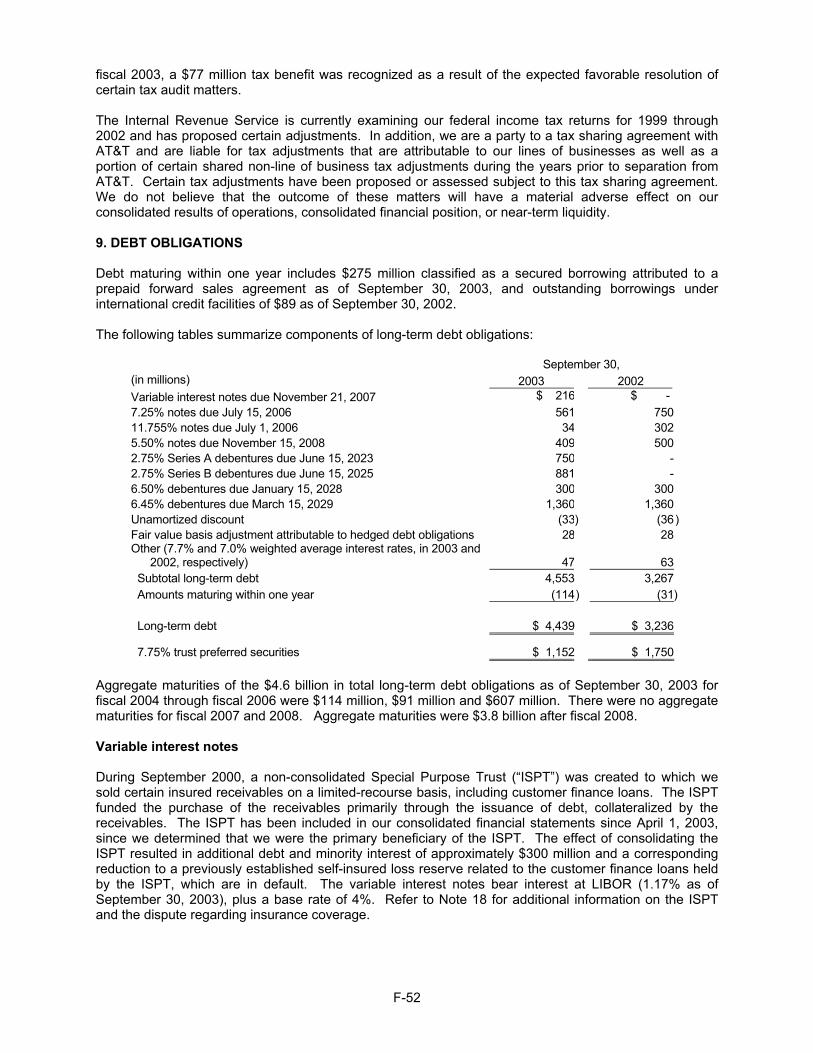
F-52
fiscal 2003, a $77 million tax benefit was recognized as a result of the expected favorable resolution of certain tax audit matters. The Internal Revenue Service is currently examining our federal income tax returns for 1999 through 2002 and has proposed certain adjustments. In addition, we are a party to a tax sharing agreement with AT&T and are liable for tax adjustments that are attributable to our lines of businesses as well as a portion of certain shared non-line of business tax adjustments during the years prior to separation from AT&T. Certain tax adjustments have been proposed or assessed subject to this tax sharing agreement. We do not believe that the outcome of these matters will have a material adverse effect on our consolidated results of operations, consolidated financial position, or near-term liquidity. 9. DEBT OBLIGATIONS Debt maturing within one year includes $275 million classified as a secured borrowing attributed to a prepaid forward sales agreement as of September 30, 2003, and outstanding borrowings under international credit facilities of $89 as of September 30, 2002. The following tables summarize components of long-term debt obligations:
September 30, (in millions) 2003 2002 Variable interest notes due November 21, 2007 $ 216 $ - 7.25% notes due July 15, 2006 561 750 11.755% notes due July 1, 2006 34 302 5.50% notes due November 15, 2008 409 500 2.75% Series A debentures due June 15, 2023 750 - 2.75% Series B debentures due June 15, 2025 881 - 6.50% debentures due January 15, 2028 300 300 6.45% debentures due March 15, 2029 1,360 1,360 Unamortized discount (33) (36) Fair value basis adjustment attributable to hedged debt obligations 28 28 Other (7.7% and 7.0% weighted average interest rates, in 2003 and
2002, respectively) 47 63
Subtotal long-term debt 4,553 3,267 Amounts maturing within one year (114) (31) Long-term debt $ 4,439 $ 3,236
7.75% trust preferred securities $ 1,152 $ 1,750
Aggregate maturities of the $4.6 billion in total long-term debt obligations as of September 30, 2003 for fiscal 2004 through fiscal 2006 were $114 million, $91 million and $607 million. There were no aggregate maturities for fiscal 2007 and 2008. Aggregate maturities were $3.8 billion after fiscal 2008. Variable interest notes During September 2000, a non-consolidated Special Purpose Trust (“ISPT”) was created to which we sold certain insured receivables on a limited-recourse basis, including customer finance loans. The ISPT funded the purchase of the receivables primarily through the issuance of debt, collateralized by the receivables. The ISPT has been included in our consolidated financial statements since April 1, 2003, since we determined that we were the primary beneficiary of the ISPT. The effect of consolidating the ISPT resulted in additional debt and minority interest of approximately $300 million and a corresponding reduction to a previously established self-insured loss reserve related to the customer finance loans held by the ISPT, which are in default. The variable interest notes bear interest at LIBOR (1.17% as of September 30, 2003), plus a base rate of 4%. Refer to Note 18 for additional information on the ISPT and the dispute regarding insurance coverage.
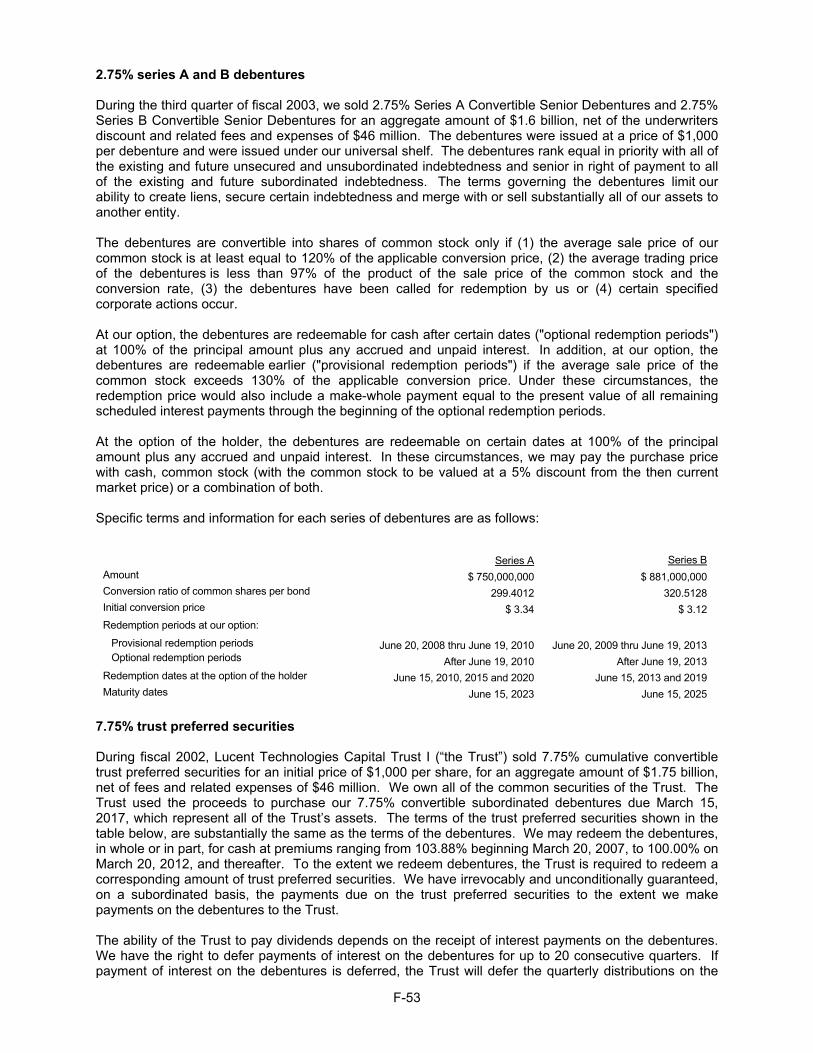
F-53
2.75% series A and B debentures During the third quarter of fiscal 2003, we sold 2.75% Series A Convertible Senior Debentures and 2.75% Series B Convertible Senior Debentures for an aggregate amount of $1.6 billion, net of the underwriters discount and related fees and expenses of $46 million. The debentures were issued at a price of $1,000 per debenture and were issued under our universal shelf. The debentures rank equal in priority with all of the existing and future unsecured and unsubordinated indebtedness and senior in right of payment to all of the existing and future subordinated indebtedness. The terms governing the debentures limit our ability to create liens, secure certain indebtedness and merge with or sell substantially all of our assets to another entity. The debentures are convertible into shares of common stock only if (1) the average sale price of our common stock is at least equal to 120% of the applicable conversion price, (2) the average trading price of the debentures is less than 97% of the product of the sale price of the common stock and the conversion rate, (3) the debentures have been called for redemption by us or (4) certain specified corporate actions occur. At our option, the debentures are redeemable for cash after certain dates ("optional redemption periods") at 100% of the principal amount plus any accrued and unpaid interest. In addition, at our option, the debentures are redeemable earlier ("provisional redemption periods") if the average sale price of the common stock exceeds 130% of the applicable conversion price. Under these circumstances, the redemption price would also include a make-whole payment equal to the present value of all remaining scheduled interest payments through the beginning of the optional redemption periods. At the option of the holder, the debentures are redeemable on certain dates at 100% of the principal amount plus any accrued and unpaid interest. In these circumstances, we may pay the purchase price with cash, common stock (with the common stock to be valued at a 5% discount from the then current market price) or a combination of both. Specific terms and information for each series of debentures are as follows:
Series A
Series B Amount $ 750,000,000 $ 881,000,000 Conversion ratio of common shares per bond 299.4012 320.5128 Initial conversion price $ 3.34 $ 3.12 Redemption periods at our option: Provisional redemption periods June 20, 2008 thru June 19, 2010 June 20, 2009 thru June 19, 2013 Optional redemption periods After June 19, 2010 After June 19, 2013 Redemption dates at the option of the holder June 15, 2010, 2015 and 2020 June 15, 2013 and 2019 Maturity dates June 15, 2023 June 15, 2025
7.75% trust preferred securities During fiscal 2002, Lucent Technologies Capital Trust I (“the Trust”) sold 7.75% cumulative convertible trust preferred securities for an initial price of $1,000 per share, for an aggregate amount of $1.75 billion, net of fees and related expenses of $46 million. We own all of the common securities of the Trust. The Trust used the proceeds to purchase our 7.75% convertible subordinated debentures due March 15, 2017, which represent all of the Trust’s assets. The terms of the trust preferred securities shown in the table below, are substantially the same as the terms of the debentures. We may redeem the debentures, in whole or in part, for cash at premiums ranging from 103.88% beginning March 20, 2007, to 100.00% on March 20, 2012, and thereafter. To the extent we redeem debentures, the Trust is required to redeem a corresponding amount of trust preferred securities. We have irrevocably and unconditionally guaranteed, on a subordinated basis, the payments due on the trust preferred securities to the extent we make payments on the debentures to the Trust. The ability of the Trust to pay dividends depends on the receipt of interest payments on the debentures. We have the right to defer payments of interest on the debentures for up to 20 consecutive quarters. If payment of interest on the debentures is deferred, the Trust will defer the quarterly distributions on the
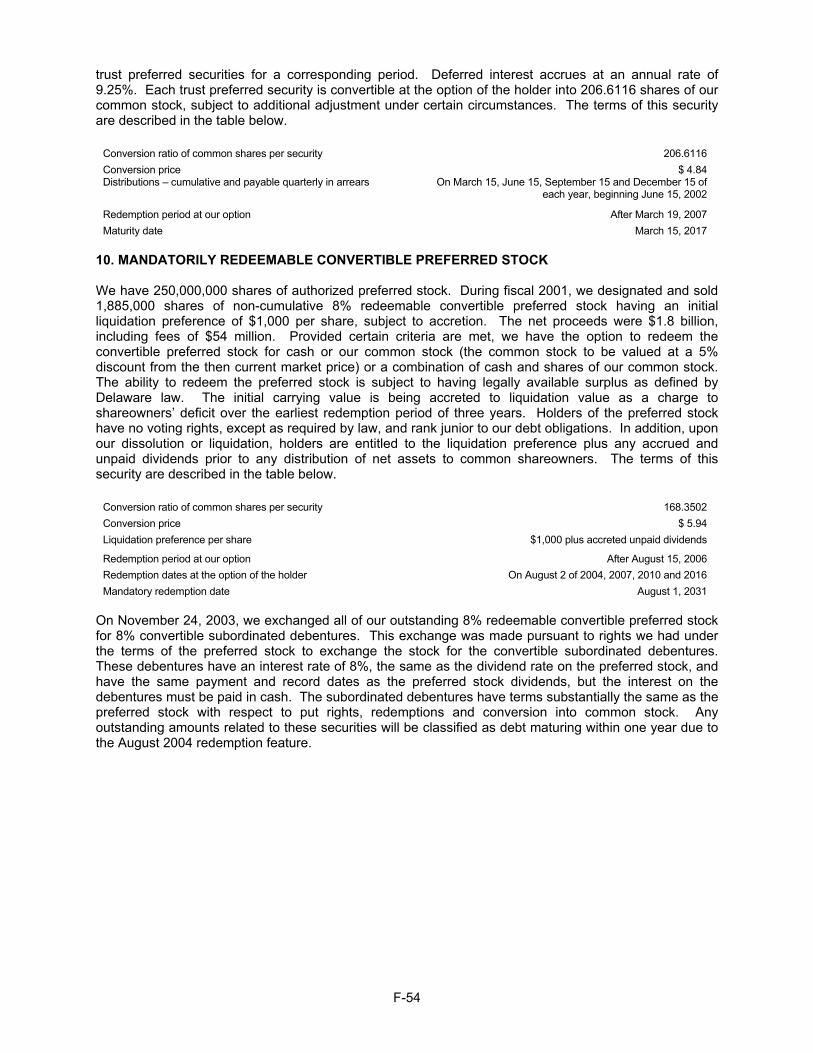
F-54
trust preferred securities for a corresponding period. Deferred interest accrues at an annual rate of 9.25%. Each trust preferred security is convertible at the option of the holder into 206.6116 shares of our common stock, subject to additional adjustment under certain circumstances. The terms of this security are described in the table below.
Conversion ratio of common shares per security 206.6116 Conversion price $ 4.84 Distributions – cumulative and payable quarterly in arrears On March 15, June 15, September 15 and December 15 of
each year, beginning June 15, 2002
Redemption period at our option After March 19, 2007 Maturity date March 15, 2017
10. MANDATORILY REDEEMABLE CONVERTIBLE PREFERRED STOCK We have 250,000,000 shares of authorized preferred stock. During fiscal 2001, we designated and sold 1,885,000 shares of non-cumulative 8% redeemable convertible preferred stock having an initial liquidation preference of $1,000 per share, subject to accretion. The net proceeds were $1.8 billion, including fees of $54 million. Provided certain criteria are met, we have the option to redeem the convertible preferred stock for cash or our common stock (the common stock to be valued at a 5% discount from the then current market price) or a combination of cash and shares of our common stock. The ability to redeem the preferred stock is subject to having legally available surplus as defined by Delaware law. The initial carrying value is being accreted to liquidation value as a charge to shareowners’ deficit over the earliest redemption period of three years. Holders of the preferred stock have no voting rights, except as required by law, and rank junior to our debt obligations. In addition, upon our dissolution or liquidation, holders are entitled to the liquidation preference plus any accrued and unpaid dividends prior to any distribution of net assets to common shareowners. The terms of this security are described in the table below.
Conversion ratio of common shares per security 168.3502 Conversion price $ 5.94 Liquidation preference per share $1,000 plus accreted unpaid dividends
Redemption period at our option After August 15, 2006 Redemption dates at the option of the holder On August 2 of 2004, 2007, 2010 and 2016 Mandatory redemption date August 1, 2031
On November 24, 2003, we exchanged all of our outstanding 8% redeemable convertible preferred stock for 8% convertible subordinated debentures. This exchange was made pursuant to rights we had under the terms of the preferred stock to exchange the stock for the convertible subordinated debentures. These debentures have an interest rate of 8%, the same as the dividend rate on the preferred stock, and have the same payment and record dates as the preferred stock dividends, but the interest on the debentures must be paid in cash. The subordinated debentures have terms substantially the same as the preferred stock with respect to put rights, redemptions and conversion into common stock. Any outstanding amounts related to these securities will be classified as debt maturing within one year due to the August 2004 redemption feature.
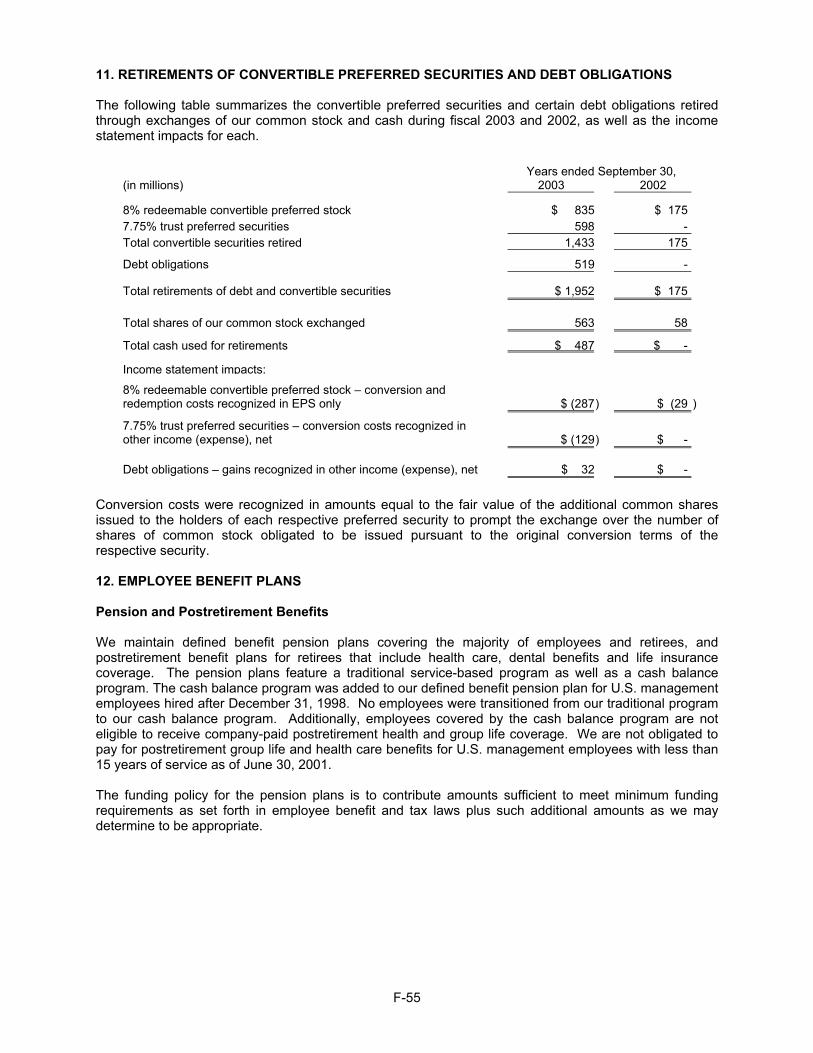
F-55
11. RETIREMENTS OF CONVERTIBLE PREFERRED SECURITIES AND DEBT OBLIGATIONS The following table summarizes the convertible preferred securities and certain debt obligations retired through exchanges of our common stock and cash during fiscal 2003 and 2002, as well as the income statement impacts for each.
Years ended September 30, (in millions) 2003 2002
8% redeemable convertible preferred stock $ 835 $ 1757.75% trust preferred securities 598 - Total convertible securities retired 1,433 175
Debt obligations 519 -
Total retirements of debt and convertible securities $ 1,952 $ 175
Total shares of our common stock exchanged 563 58
Total cash used for retirements $ 487 $ -
Income statement impacts:
8% redeemable convertible preferred stock – conversion and redemption costs recognized in EPS only
$ (287) $ (29 )
7.75% trust preferred securities – conversion costs recognized in other income (expense), net
$ (129) $ -
Debt obligations – gains recognized in other income (expense), net
$ 32 $ -
Conversion costs were recognized in amounts equal to the fair value of the additional common shares issued to the holders of each respective preferred security to prompt the exchange over the number of shares of common stock obligated to be issued pursuant to the original conversion terms of the respective security. 12. EMPLOYEE BENEFIT PLANS Pension and Postretirement Benefits We maintain defined benefit pension plans covering the majority of employees and retirees, and postretirement benefit plans for retirees that include health care, dental benefits and life insurance coverage. The pension plans feature a traditional service-based program as well as a cash balance program. The cash balance program was added to our defined benefit pension plan for U.S. management employees hired after December 31, 1998. No employees were transitioned from our traditional program to our cash balance program. Additionally, employees covered by the cash balance program are not eligible to receive company-paid postretirement health and group life coverage. We are not obligated to pay for postretirement group life and health care benefits for U.S. management employees with less than 15 years of service as of June 30, 2001. The funding policy for the pension plans is to contribute amounts sufficient to meet minimum funding requirements as set forth in employee benefit and tax laws plus such additional amounts as we may determine to be appropriate.
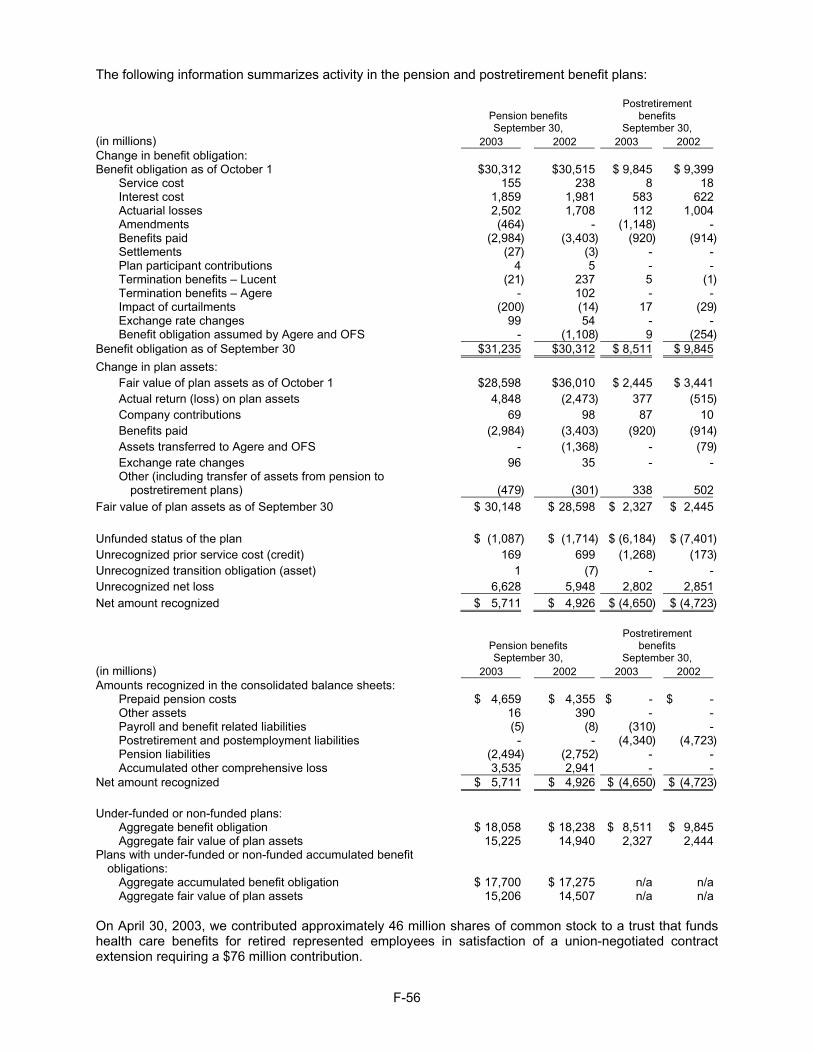
F-56
The following information summarizes activity in the pension and postretirement benefit plans:
Pension benefits September 30,
Postretirement benefits
September 30, (in millions) 2003 2002 2003 2002 Change in benefit obligation: Benefit obligation as of October 1 $30,312 $30,515 $ 9,845 $ 9,399
Service cost 155 238 8 18Interest cost 1,859 1,981 583 622Actuarial losses 2,502 1,708 112 1,004Amendments (464) - (1,148 ) -Benefits paid (2,984) (3,403) (920 ) (914)Settlements (27 ) (3 ) - -Plan participant contributions 4 5 - -Termination benefits – Lucent (21) 237 5 (1)Termination benefits – Agere - 102 - -Impact of curtailments (200) (14) 17 (29)Exchange rate changes 99 54 - -Benefit obligation assumed by Agere and OFS - (1,108) 9 (254)
Benefit obligation as of September 30 $31,235 $30,312 $ 8,511 $ 9,845Change in plan assets:
Fair value of plan assets as of October 1 $28,598 $36,010 $ 2,445 $ 3,441Actual return (loss) on plan assets 4,848 (2,473 ) 377 (515)Company contributions 69 98 87 10Benefits paid (2,984 ) (3,403 ) (920 ) (914)Assets transferred to Agere and OFS - (1,368) - (79)Exchange rate changes 96 35 - -Other (including transfer of assets from pension to
postretirement plans) (479) (301) 338 502Fair value of plan assets as of September 30 $ 30,148 $ 28,598 $ 2,327 $ 2,445 Unfunded status of the plan $ (1,087 ) $ (1,714 ) $ (6,184 ) $ (7,401)Unrecognized prior service cost (credit) 169 699 (1,268 ) (173)Unrecognized transition obligation (asset) 1 (7 ) - -Unrecognized net loss 6,628 5,948 2,802 2,851Net amount recognized $ 5,711 $ 4,926 $ (4,650 ) $ (4,723)
Pension benefits September 30,
Postretirement benefits
September 30, (in millions) 2003 2002 2003 2002 Amounts recognized in the consolidated balance sheets:
Prepaid pension costs $ 4,659 $ 4,355 $ - $ - Other assets 16 390 - - Payroll and benefit related liabilities (5) (8) (310 ) - Postretirement and postemployment liabilities - - (4,340 ) (4,723)Pension liabilities (2,494) (2,752) - - Accumulated other comprehensive loss 3,535 2,941 - -
Net amount recognized $ 5,711 $ 4,926 $ (4,650 ) $ (4,723) Under-funded or non-funded plans:
Aggregate benefit obligation $ 18,058 $ 18,238 $ 8,511 $ 9,845 Aggregate fair value of plan assets 15,225 14,940 2,327 2,444
Plans with under-funded or non-funded accumulated benefit obligations:
Aggregate accumulated benefit obligation $ 17,700 $ 17,275 n/a n/a Aggregate fair value of plan assets 15,206 14,507 n/a n/a
On April 30, 2003, we contributed approximately 46 million shares of common stock to a trust that funds health care benefits for retired represented employees in satisfaction of a union-negotiated contract extension requiring a $76 million contribution.
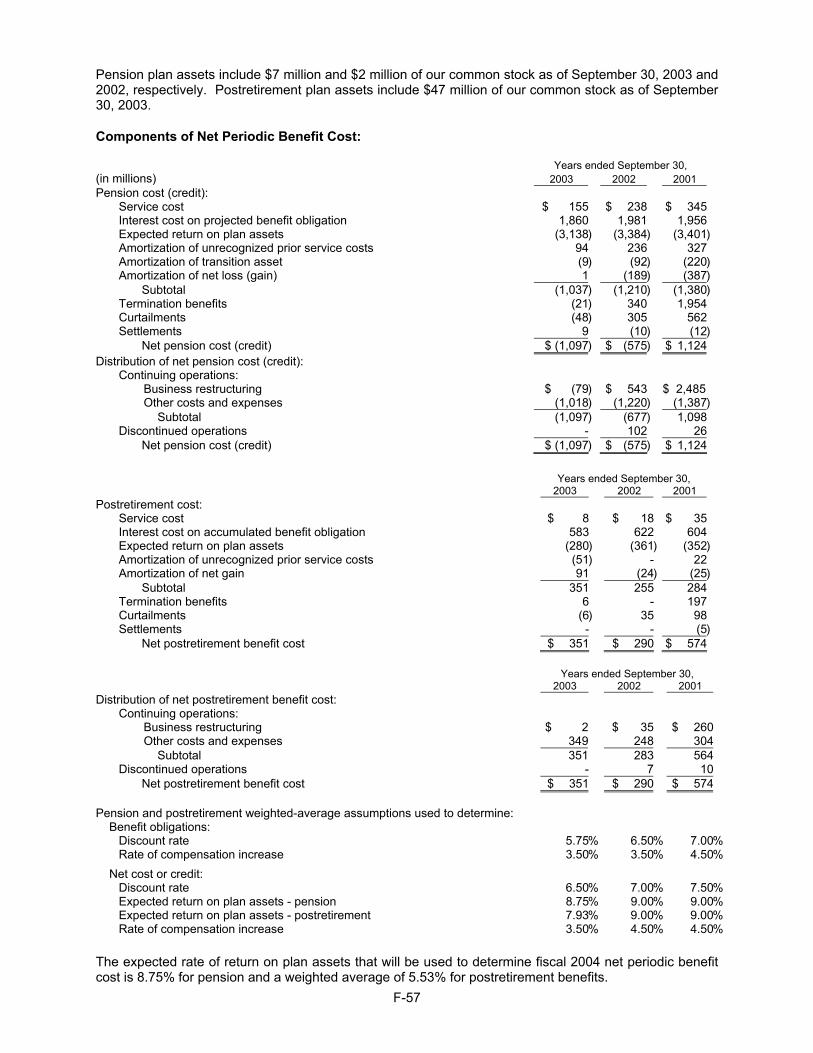
F-57
Pension plan assets include $7 million and $2 million of our common stock as of September 30, 2003 and 2002, respectively. Postretirement plan assets include $47 million of our common stock as of September 30, 2003.
Components of Net Periodic Benefit Cost: Years ended September 30, (in millions) 2003 2002 2001 Pension cost (credit):
Service cost $ 155 $ 238 $ 345 Interest cost on projected benefit obligation 1,860 1,981 1,956 Expected return on plan assets (3,138) (3,384 ) (3,401) Amortization of unrecognized prior service costs 94 236 327 Amortization of transition asset (9) (92 ) (220) Amortization of net loss (gain) 1 (189 ) (387)
Subtotal (1,037) (1,210 ) (1,380) Termination benefits (21) 340 1,954 Curtailments (48) 305 562 Settlements 9 (10 ) (12)
Net pension cost (credit) $ (1,097) $ (575 ) $ 1,124 Distribution of net pension cost (credit):
Continuing operations: Business restructuring $ (79) $ 543 $ 2,485 Other costs and expenses (1,018) (1,220 ) (1,387)
Subtotal (1,097) (677 ) 1,098 Discontinued operations - 102 26
Net pension cost (credit) $ (1,097) $ (575 ) $ 1,124
Years ended September 30, 2003 2002 2001
Postretirement cost: Service cost $ 8 $ 18 $ 35 Interest cost on accumulated benefit obligation 583 622 604 Expected return on plan assets (280 ) (361) (352) Amortization of unrecognized prior service costs (51 ) - 22 Amortization of net gain 91 (24) (25)
Subtotal 351 255 284 Termination benefits 6 - 197 Curtailments (6 ) 35 98 Settlements - - (5)
Net postretirement benefit cost $ 351 $ 290 $ 574
Years ended September 30, 2003 2002 2001
Distribution of net postretirement benefit cost: Continuing operations:
Business restructuring $ 2 $ 35 $ 260 Other costs and expenses 349 248 304
Subtotal 351 283 564 Discontinued operations - 7 10
Net postretirement benefit cost $ 351 $ 290 $ 574 Pension and postretirement weighted-average assumptions used to determine: Benefit obligations:
Discount rate 5.75% 6.50% 7.00%Rate of compensation increase 3.50% 3.50% 4.50%
Net cost or credit: Discount rate 6.50% 7.00% 7.50%Expected return on plan assets - pension 8.75% 9.00% 9.00%Expected return on plan assets - postretirement 7.93% 9.00% 9.00%Rate of compensation increase 3.50% 4.50% 4.50%
The expected rate of return on plan assets that will be used to determine fiscal 2004 net periodic benefit cost is 8.75% for pension and a weighted average of 5.53% for postretirement benefits.
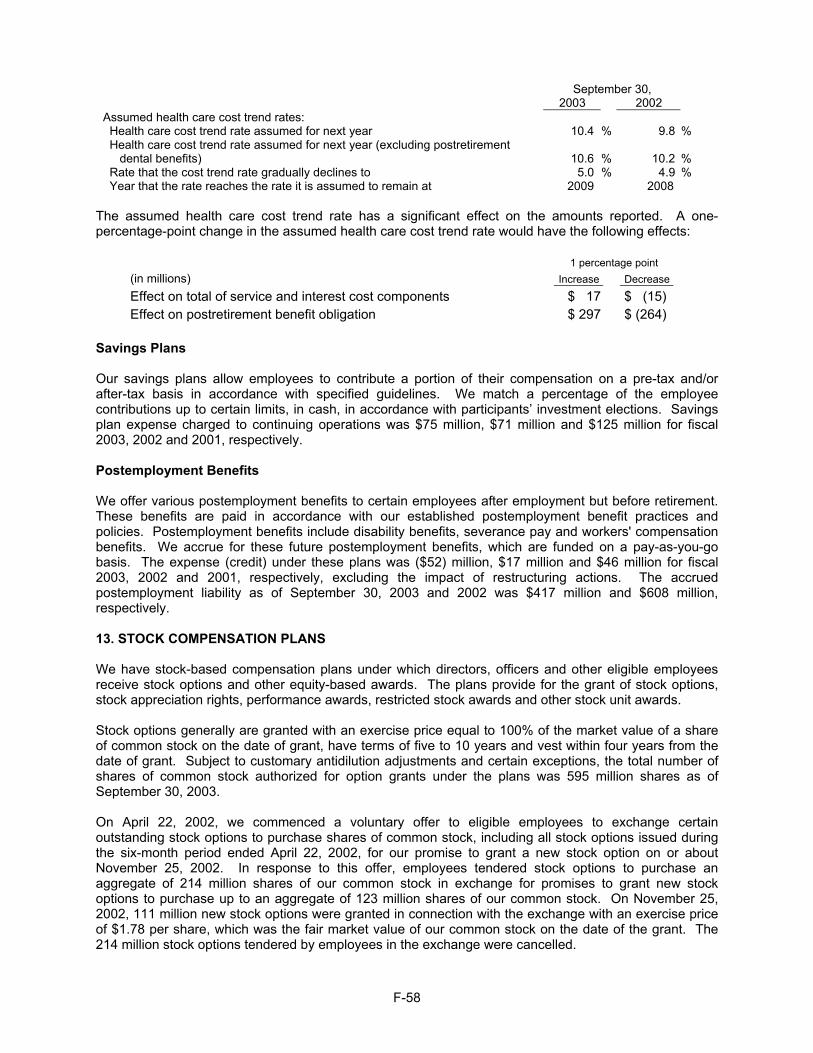
F-58
September 30,
2003 2002 Assumed health care cost trend rates: Health care cost trend rate assumed for next year 10.4 % 9.8 %Health care cost trend rate assumed for next year (excluding postretirement dental benefits)
10.6
% 10.2 %
Rate that the cost trend rate gradually declines to 5.0 % 4.9 %Year that the rate reaches the rate it is assumed to remain at 2009 2008
The assumed health care cost trend rate has a significant effect on the amounts reported. A one-percentage-point change in the assumed health care cost trend rate would have the following effects:
1 percentage point (in millions) Increase Decrease
Effect on total of service and interest cost components $ 17 $ (15) Effect on postretirement benefit obligation $ 297 $ (264)
Savings Plans Our savings plans allow employees to contribute a portion of their compensation on a pre-tax and/or after-tax basis in accordance with specified guidelines. We match a percentage of the employee contributions up to certain limits, in cash, in accordance with participants’ investment elections. Savings plan expense charged to continuing operations was $75 million, $71 million and $125 million for fiscal 2003, 2002 and 2001, respectively. Postemployment Benefits We offer various postemployment benefits to certain employees after employment but before retirement. These benefits are paid in accordance with our established postemployment benefit practices and policies. Postemployment benefits include disability benefits, severance pay and workers' compensation benefits. We accrue for these future postemployment benefits, which are funded on a pay-as-you-go basis. The expense (credit) under these plans was ($52) million, $17 million and $46 million for fiscal 2003, 2002 and 2001, respectively, excluding the impact of restructuring actions. The accrued postemployment liability as of September 30, 2003 and 2002 was $417 million and $608 million, respectively. 13. STOCK COMPENSATION PLANS We have stock-based compensation plans under which directors, officers and other eligible employees receive stock options and other equity-based awards. The plans provide for the grant of stock options, stock appreciation rights, performance awards, restricted stock awards and other stock unit awards. Stock options generally are granted with an exercise price equal to 100% of the market value of a share of common stock on the date of grant, have terms of five to 10 years and vest within four years from the date of grant. Subject to customary antidilution adjustments and certain exceptions, the total number of shares of common stock authorized for option grants under the plans was 595 million shares as of September 30, 2003. On April 22, 2002, we commenced a voluntary offer to eligible employees to exchange certain outstanding stock options to purchase shares of common stock, including all stock options issued during the six-month period ended April 22, 2002, for our promise to grant a new stock option on or about November 25, 2002. In response to this offer, employees tendered stock options to purchase an aggregate of 214 million shares of our common stock in exchange for promises to grant new stock options to purchase up to an aggregate of 123 million shares of our common stock. On November 25, 2002, 111 million new stock options were granted in connection with the exchange with an exercise price of $1.78 per share, which was the fair market value of our common stock on the date of the grant. The 214 million stock options tendered by employees in the exchange were cancelled.
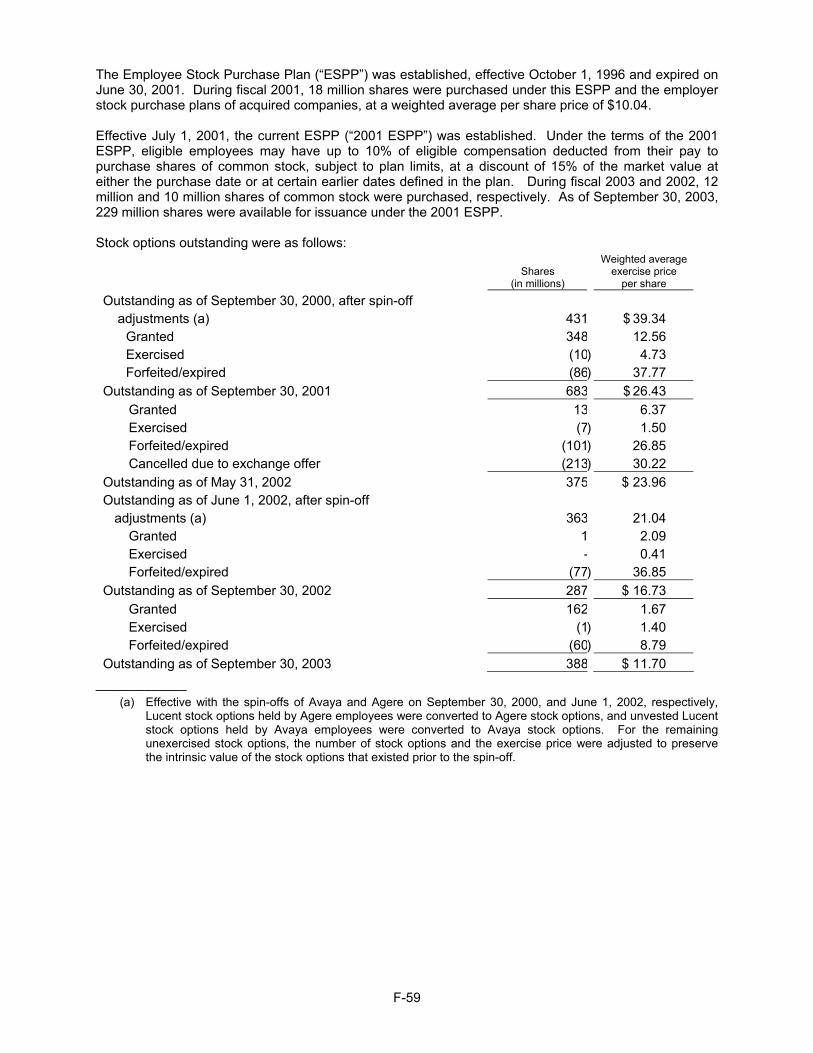
F-59
The Employee Stock Purchase Plan (“ESPP”) was established, effective October 1, 1996 and expired on June 30, 2001. During fiscal 2001, 18 million shares were purchased under this ESPP and the employer stock purchase plans of acquired companies, at a weighted average per share price of $10.04. Effective July 1, 2001, the current ESPP (“2001 ESPP”) was established. Under the terms of the 2001 ESPP, eligible employees may have up to 10% of eligible compensation deducted from their pay to purchase shares of common stock, subject to plan limits, at a discount of 15% of the market value at either the purchase date or at certain earlier dates defined in the plan. During fiscal 2003 and 2002, 12 million and 10 million shares of common stock were purchased, respectively. As of September 30, 2003, 229 million shares were available for issuance under the 2001 ESPP. Stock options outstanding were as follows:
Shares
(in millions)
Weighted averageexercise price
per share
Outstanding as of September 30, 2000, after spin-off adjustments (a) 431 $ 39.34
Granted 348 12.56 Exercised (10) 4.73 Forfeited/expired (86) 37.77
Outstanding as of September 30, 2001 683 $ 26.43 Granted 13 6.37 Exercised (7) 1.50 Forfeited/expired (101) 26.85 Cancelled due to exchange offer (213) 30.22 Outstanding as of May 31, 2002 375 $ 23.96 Outstanding as of June 1, 2002, after spin-off
adjustments (a) 363 21.04 Granted 1 2.09 Exercised - 0.41 Forfeited/expired (77) 36.85 Outstanding as of September 30, 2002 287 $ 16.73 Granted 162 1.67 Exercised (1) 1.40 Forfeited/expired (60) 8.79 Outstanding as of September 30, 2003 388 $ 11.70
_____________ (a) Effective with the spin-offs of Avaya and Agere on September 30, 2000, and June 1, 2002, respectively,
Lucent stock options held by Agere employees were converted to Agere stock options, and unvested Lucent stock options held by Avaya employees were converted to Avaya stock options. For the remaining unexercised stock options, the number of stock options and the exercise price were adjusted to preserve the intrinsic value of the stock options that existed prior to the spin-off.

F-60
Summarized information about stock options outstanding as of September 30, 2003:
Stock options outstanding Stock options exercisable
Range of exercise prices per share Shares
(in millions)
Weightedaverage
remaining contractual
life (years)
Weightedaverageexercise
priceper share
Shares (in millions)
Weightedaverageexercise
price per share
$ 0.00 to $ 2.25 136 4.9 $ 1.66 19 $ 1.76 $ 2.26 to $ 6.26 69 2.9 6.15 50 6.17 $ 6.27 to $ 9.99 38 3.0 9.44 37 9.53 $10.00 to $ 16.03 86 3.1 12.27 84 12.23 $16.04 to $ 89.70 59 5.4 42.13 56 41.93
Total 388 $ 11.70 246 $ 16.54
During fiscal 2002 and 2001, 4 million and 5 million restricted stock units were awarded at weighted average market values of $6.74 and $13.64, respectively. 14. OPERATING SEGMENTS We design and deliver networks for the world’s largest telecommunications service providers. We have two segments, each organized around a separate customer set to which it sells products or services. The INS segment sells to global wireline service providers, including long distance carriers, traditional local telephone companies and Internet service providers. It offers a broad range of software, equipment and services primarily related to voice networking (offerings primarily consisting of switching products, which we sometimes refer to as convergence solutions, and voice messaging products), data and network management (offerings primarily consisting of access and related data networking equipment and operating support software) and optical networking. The Mobility segment sells to global wireless service providers and offers software, equipment and services to support the needs of its customers for radio access and core networks. Our segments are supported by our worldwide services organization. Performance measurement and resource allocation for the reportable segments are based on many factors. The primary financial measure is operating income (loss), which includes the revenues, costs and expenses directly controlled by each reportable segment, including the revenues and costs associated with the services sold to their customers. Operating income (loss) for reportable segments excludes the following:
• Goodwill impairment and other acquired intangibles amortization.
• Business restructuring and asset impairments.
• Acquisition/integration-related costs.
• Revenues and expenses associated with intellectual property.
• Results of the optical fiber business.
• Results from billing and customer care software products and other smaller business units.
• Certain personnel costs and benefits, including most of those related to pension and postretirement benefits and differences between the actual and standard allocated benefit rates.
• Certain other costs related to shared services, such as general corporate functions, which are managed on a common basis in order to realize economies of scale and efficient use of resources.
• Certain other general and miscellaneous costs and expenses not directly used in assessing the performance of the operating segments.
The segment results for the prior periods have been revised to conform to the current year’s performance measure, which now includes the operating results of the Messaging product unit, and excludes the
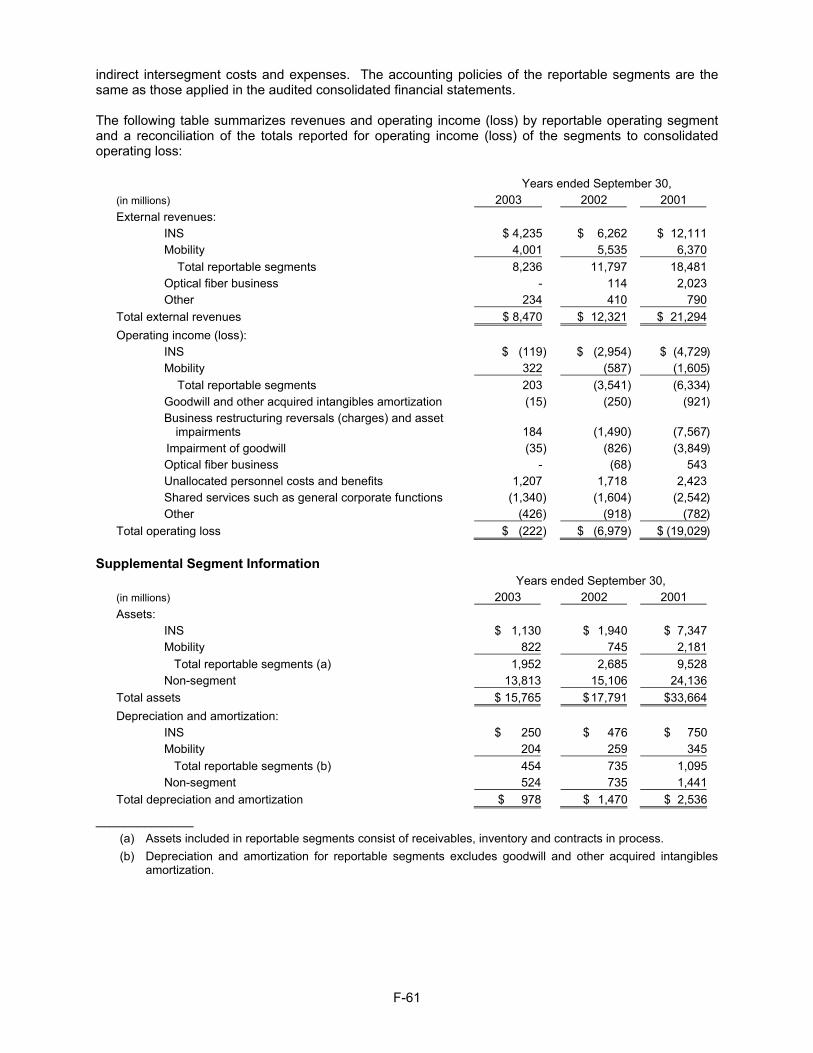
F-61
indirect intersegment costs and expenses. The accounting policies of the reportable segments are the same as those applied in the audited consolidated financial statements. The following table summarizes revenues and operating income (loss) by reportable operating segment and a reconciliation of the totals reported for operating income (loss) of the segments to consolidated operating loss:
Years ended September 30, (in millions) 2003 2002 2001 External revenues:
INS $ 4,235 $ 6,262 $ 12,111 Mobility 4,001 5,535 6,370
Total reportable segments 8,236 11,797 18,481 Optical fiber business - 114 2,023 Other 234 410 790
Total external revenues $ 8,470 $ 12,321 $ 21,294 Operating income (loss):
INS $ (119) $ (2,954) $ (4,729) Mobility 322 (587) (1,605)
Total reportable segments 203 (3,541) (6,334) Goodwill and other acquired intangibles amortization (15) (250) (921) Business restructuring reversals (charges) and asset
impairments 184 (1,490) (7,567) Impairment of goodwill (35) (826) (3,849)
Optical fiber business - (68 ) 543 Unallocated personnel costs and benefits 1,207 1,718 2,423 Shared services such as general corporate functions (1,340) (1,604) (2,542) Other (426) (918) (782)
Total operating loss $ (222) $ (6,979) $ (19,029)
Supplemental Segment Information Years ended September 30, (in millions) 2003 2002 2001 Assets:
INS $ 1,130 $ 1,940 $ 7,347 Mobility 822 745 2,181 Total reportable segments (a) 1,952 2,685 9,528 Non-segment 13,813 15,106 24,136
Total assets $ 15,765 $ 17,791 $33,664 Depreciation and amortization:
INS $ 250 $ 476 $ 750 Mobility 204 259 345 Total reportable segments (b) 454 735 1,095 Non-segment 524 735 1,441
Total depreciation and amortization $ 978 $ 1,470 $ 2,536
______________ (a) Assets included in reportable segments consist of receivables, inventory and contracts in process. (b) Depreciation and amortization for reportable segments excludes goodwill and other acquired intangibles
amortization.
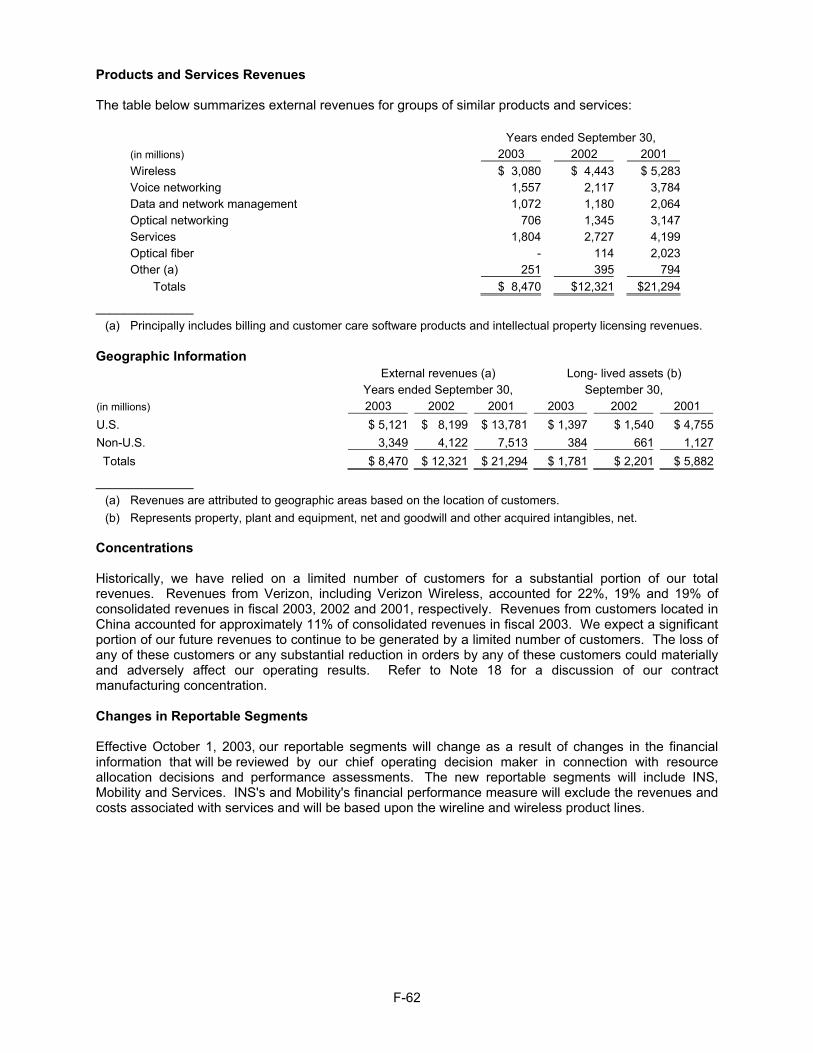
F-62
Products and Services Revenues The table below summarizes external revenues for groups of similar products and services:
Years ended September 30, (in millions) 2003 2002 2001 Wireless $ 3,080 $ 4,443 $ 5,283 Voice networking 1,557 2,117 3,784 Data and network management 1,072 1,180 2,064 Optical networking 706 1,345 3,147 Services 1,804 2,727 4,199 Optical fiber - 114 2,023 Other (a) 251 395 794
Totals $ 8,470 $12,321 $21,294
______________ (a) Principally includes billing and customer care software products and intellectual property licensing revenues.
Geographic Information External revenues (a) Long- lived assets (b)
Years ended September 30, September 30, (in millions) 2003 2002 2001 2003 2002 2001 U.S. $ 5,121 $ 8,199 $ 13,781 $ 1,397 $ 1,540 $ 4,755Non-U.S. 3,349 4,122 7,513 384 661 1,127 Totals $ 8,470 $ 12,321 $ 21,294 $ 1,781 $ 2,201 $ 5,882
______________ (a) Revenues are attributed to geographic areas based on the location of customers. (b) Represents property, plant and equipment, net and goodwill and other acquired intangibles, net. Concentrations Historically, we have relied on a limited number of customers for a substantial portion of our total revenues. Revenues from Verizon, including Verizon Wireless, accounted for 22%, 19% and 19% of consolidated revenues in fiscal 2003, 2002 and 2001, respectively. Revenues from customers located in China accounted for approximately 11% of consolidated revenues in fiscal 2003. We expect a significant portion of our future revenues to continue to be generated by a limited number of customers. The loss of any of these customers or any substantial reduction in orders by any of these customers could materially and adversely affect our operating results. Refer to Note 18 for a discussion of our contract manufacturing concentration. Changes in Reportable Segments Effective October 1, 2003, our reportable segments will change as a result of changes in the financial information that will be reviewed by our chief operating decision maker in connection with resource allocation decisions and performance assessments. The new reportable segments will include INS, Mobility and Services. INS's and Mobility's financial performance measure will exclude the revenues and costs associated with services and will be based upon the wireline and wireless product lines.
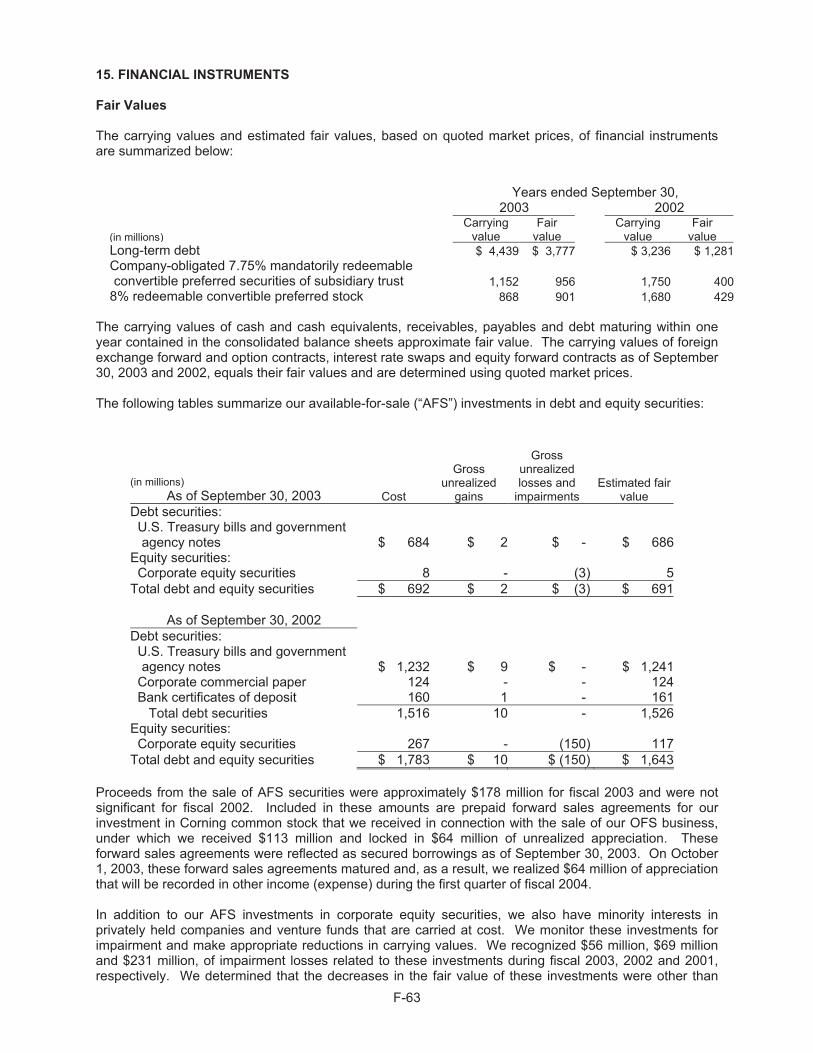
F-63
15. FINANCIAL INSTRUMENTS Fair Values The carrying values and estimated fair values, based on quoted market prices, of financial instruments are summarized below:
Years ended September 30,
2003 2002 (in millions)
Carrying value
Fair value
Carrying value
Fair value
Long-term debt $ 4,439 $ 3,777 $ 3,236 $ 1,281 Company-obligated 7.75% mandatorily redeemable
convertible preferred securities of subsidiary trust 1,152 956 1,750 400 8% redeemable convertible preferred stock 868 901 1,680 429
The carrying values of cash and cash equivalents, receivables, payables and debt maturing within one year contained in the consolidated balance sheets approximate fair value. The carrying values of foreign exchange forward and option contracts, interest rate swaps and equity forward contracts as of September 30, 2003 and 2002, equals their fair values and are determined using quoted market prices. The following tables summarize our available-for-sale (“AFS”) investments in debt and equity securities:
(in millions) As of September 30, 2003 Cost
Gross unrealized
gains
Gross unrealized losses and
impairments
Estimated fair value
Debt securities: U.S. Treasury bills and government
agency notes $ 684 $ 2 $ -
$ 686Equity securities: Corporate equity securities 8 - (3) 5Total debt and equity securities $ 692 $ 2 $ (3) $ 691
As of September 30, 2002 Debt securities: U.S. Treasury bills and government
agency notes $ 1,232 $ 9 $ -
$ 1,241 Corporate commercial paper 124 - - 124 Bank certificates of deposit 160 1 - 161 Total debt securities 1,516 10 - 1,526Equity securities: Corporate equity securities 267 - (150) 117Total debt and equity securities $ 1,783 $ 10 $ (150) $ 1,643
Proceeds from the sale of AFS securities were approximately $178 million for fiscal 2003 and were not significant for fiscal 2002. Included in these amounts are prepaid forward sales agreements for our investment in Corning common stock that we received in connection with the sale of our OFS business, under which we received $113 million and locked in $64 million of unrealized appreciation. These forward sales agreements were reflected as secured borrowings as of September 30, 2003. On October 1, 2003, these forward sales agreements matured and, as a result, we realized $64 million of appreciation that will be recorded in other income (expense) during the first quarter of fiscal 2004. In addition to our AFS investments in corporate equity securities, we also have minority interests in privately held companies and venture funds that are carried at cost. We monitor these investments for impairment and make appropriate reductions in carrying values. We recognized $56 million, $69 million and $231 million, of impairment losses related to these investments during fiscal 2003, 2002 and 2001, respectively. We determined that the decreases in the fair value of these investments were other than

F-64
temporary, based on the financial condition and near-term prospects of the underlying investees, changes in the market demand for technology being sold or developed by the underlying investees and our intent to provide future funding to the underlying investees. The carrying value of our remaining cost-method investments in privately held companies and venture funds as of September 30, 2003 and 2002, was $89 million and $137 million, respectively. The carrying value of our equity-method investments as of September 30, 2003 and 2002 was $42 million and $76 million, respectively. Our share of earnings or losses from equity-method investments is recorded in other income (expense). Credit Risk By their nature, all financial instruments involve risk, including credit risk for non-performance by counterparties. The contract or notional amounts of these instruments reflect the extent of involvement we have in particular classes of financial instruments. The maximum potential loss may exceed any amounts recognized in the consolidated balance sheets. However, our maximum exposure to credit loss in the event of non-performance by the other party to the financial instruments for commitments to extend credit and financial guarantees is limited to the amount drawn and outstanding on those instruments. Exposure to credit risk is controlled through credit approvals, credit limits and continuous monitoring procedures, and reserves for losses are established when deemed necessary. We seek to limit our exposure to credit risks in any single country or region, although our customers are primarily in the telecommunications service provider industry. Derivative Financial Instruments and Market Risk All financial instruments inherently expose the holders to market risk, including changes in currency and interest rates and equity prices. We manage our exposure to these market risks through our regular operating and financing activities and, when appropriate, through the use of derivative financial instruments. Foreign currency risk We conduct our business on a multinational basis in a wide variety of foreign currencies. The objective of our foreign currency risk management policy is to preserve the economic value of cash flows in non-functional currencies. Our policy is to hedge all significant booked and firmly committed cash flows identified as creating foreign currency exposure on a rolling 12-month basis. In addition, we typically hedge a portion of our exposure resulting from identified anticipated cash flows, providing the flexibility to deal with the variability of longer-term forecasts as well as changing market conditions. To manage our foreign currency risk, we enter into various foreign exchange forward and option contracts. In some cases, we may hedge foreign exchange risk in certain sales and purchase contracts by embedding terms in the contracts that affect the ultimate amount of cash flows under the contract. Our primary net foreign currency exposures as of September 30, 2003 and 2002, included the British pound, Chinese yuan, Japanese yen, euro and Indian rupee. The following table provides a summary of the total net notional amounts of foreign exchange forward contracts:
Years ended September 30, (in millions) 2003 2002
Purchase contracts $ 257 $ 361Sale contracts $ 134 $ 146
The fair value of all our hedged contracts and the notional amounts and fair values of embedded derivatives as of September 30, 2003 and 2002 were not material.
F-65
We hedge all types of foreign currency risk to preserve our economic cash flows in accordance with corporate risk management policies but generally do not designate related derivative instruments as hedges under SFAS 133, for cost/benefit reasons. Accordingly, the changes in fair value of these undesignated freestanding foreign currency derivative instruments are recorded in other income (expense) in the period of change and have not been material because of the short maturities of these instruments. Our foreign currency embedded derivatives consist of sales and purchase contracts with cash flows indexed to changes in or denominated in a currency that neither party to the contract uses as its functional currency. Changes in the fair value of these embedded derivatives were not significant during fiscal 2003 and 2002. Interest rate risk We use a combination of financial instruments, including medium-term and short-term financings, variable-rate debt instruments and interest rate swaps to manage our interest rate mix of the total debt portfolio and related overall cost of borrowing. We had interest rate swap agreements designated as fair value hedges that hedge a portion of a long-term, fixed-rate debt obligation due in July 2006. These swap agreements had an aggregate notional amount of $500 million as of September 30, 2003 and 2002, and a fair value of $28 million as of September 30, 2003 and 2002. Under these swaps, we receive a fixed interest rate of 7.25% and pay a weighted average floating rate of LIBOR plus 2.91%. As of September 30, 2003 and 2002, LIBOR was approximately 1.17% and 1.79%, respectively. The objective of maintaining the mix of fixed- and floating-rate debt is to mitigate the variability of cash flows resulting from interest rate fluctuations, as well as to reduce the cash flows attributable to debt instruments. There were no derivative transactions hedging cash equivalents and short-term investments, since their relatively short maturities do not create significant risk. Equity price risk We hold equity investments in publicly held companies, which are classified as available-for-sale, and other strategic equity holdings in privately held companies and venture funds. These equity investments are exposed to price fluctuations and are generally concentrated in the high-technology industries. We generally do not hedge our equity price risk due to hedging restrictions imposed by the issuers, illiquid capital markets or inability to hedge non-marketable equity securities in privately held companies. However, during fiscal 2003, as noted above, we entered into prepaid forward sales agreements for all the Corning stock we owned. As of September 30, 2002, we had no outstanding hedging instruments for our equity price risk. Non-Derivative Instruments and Customer Financing Commitments Requests for providing commitments to extend credit and financial guarantees are reviewed and subject to approval by senior management. Management regularly reviews all outstanding commitments, letters of credit and financial guarantees, and the results of these reviews are considered in assessing the adequacy of our reserves for possible credit and guarantee losses. The following table presents our non-derivative instruments and customer financing commitments for amounts drawn, available but not drawn and not available to be drawn. These instruments may expire without being drawn upon. Therefore, the amounts available but not drawn and not available do not necessarily represent future cash flows. The amounts drawn on these instruments are generally collateralized by substantially all of the assets of the respective creditors.
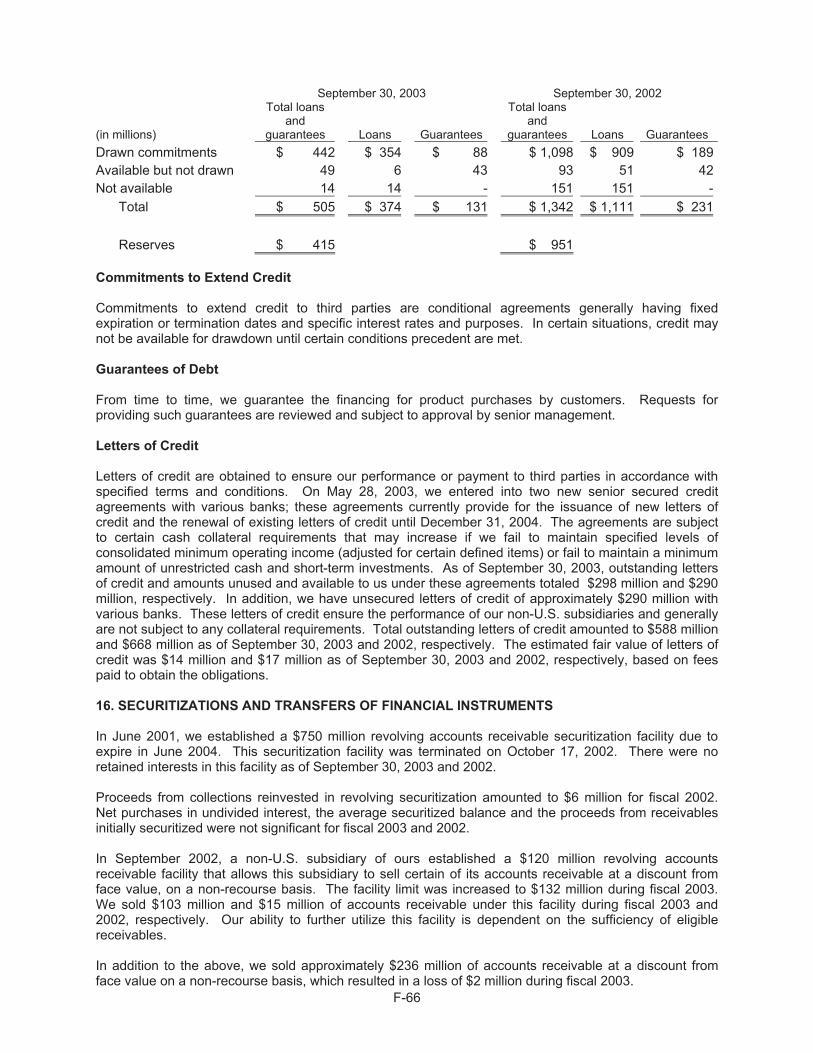
F-66
September 30, 2003 September 30, 2002
(in millions)
Total loans and
guarantees Loans Guarantees
Total loansand
guarantees Loans GuaranteesDrawn commitments $ 442 $ 354 $ 88 $ 1,098 $ 909 $ 189Available but not drawn 49 6 43 93 51 42Not available 14 14 - 151 151 -
Total $ 505 $ 374 $ 131 $ 1,342 $ 1,111 $ 231 Reserves $ 415 $ 951
Commitments to Extend Credit Commitments to extend credit to third parties are conditional agreements generally having fixed expiration or termination dates and specific interest rates and purposes. In certain situations, credit may not be available for drawdown until certain conditions precedent are met. Guarantees of Debt From time to time, we guarantee the financing for product purchases by customers. Requests for providing such guarantees are reviewed and subject to approval by senior management. Letters of Credit Letters of credit are obtained to ensure our performance or payment to third parties in accordance with specified terms and conditions. On May 28, 2003, we entered into two new senior secured credit agreements with various banks; these agreements currently provide for the issuance of new letters of credit and the renewal of existing letters of credit until December 31, 2004. The agreements are subject to certain cash collateral requirements that may increase if we fail to maintain specified levels of consolidated minimum operating income (adjusted for certain defined items) or fail to maintain a minimum amount of unrestricted cash and short-term investments. As of September 30, 2003, outstanding letters of credit and amounts unused and available to us under these agreements totaled $298 million and $290 million, respectively. In addition, we have unsecured letters of credit of approximately $290 million with various banks. These letters of credit ensure the performance of our non-U.S. subsidiaries and generally are not subject to any collateral requirements. Total outstanding letters of credit amounted to $588 million and $668 million as of September 30, 2003 and 2002, respectively. The estimated fair value of letters of credit was $14 million and $17 million as of September 30, 2003 and 2002, respectively, based on fees paid to obtain the obligations. 16. SECURITIZATIONS AND TRANSFERS OF FINANCIAL INSTRUMENTS In June 2001, we established a $750 million revolving accounts receivable securitization facility due to expire in June 2004. This securitization facility was terminated on October 17, 2002. There were no retained interests in this facility as of September 30, 2003 and 2002. Proceeds from collections reinvested in revolving securitization amounted to $6 million for fiscal 2002. Net purchases in undivided interest, the average securitized balance and the proceeds from receivables initially securitized were not significant for fiscal 2003 and 2002. In September 2002, a non-U.S. subsidiary of ours established a $120 million revolving accounts receivable facility that allows this subsidiary to sell certain of its accounts receivable at a discount from face value, on a non-recourse basis. The facility limit was increased to $132 million during fiscal 2003. We sold $103 million and $15 million of accounts receivable under this facility during fiscal 2003 and 2002, respectively. Our ability to further utilize this facility is dependent on the sufficiency of eligible receivables. In addition to the above, we sold approximately $236 million of accounts receivable at a discount from face value on a non-recourse basis, which resulted in a loss of $2 million during fiscal 2003.
F-67
17. ACCOUNTING CHANGES Staff Accounting Bulletin 101, “Revenue Recognition in Financial Statements” (“SAB 101”) In December 1999, the Securities and Exchange Commission issued SAB 101, which provides guidance on the recognition, presentation and disclosure of revenues in financial statements. During the fourth quarter of fiscal 2001, we implemented SAB 101 retroactively to the beginning of fiscal 2001, resulting in a cumulative effect of a change in accounting principle consisting of a $68 million loss (net of a tax benefit of $45 million), or $0.02 loss per basic and diluted share, and a reduction in the fiscal 2001 loss from continuing operations of $11 million, or $0.00 per basic and diluted share. During fiscal 2001, we recognized $116 million in revenue that is included in the cumulative effect adjustment as of October 1, 2000. The cumulative effect adjustment results primarily from the change in revenue recognized on intellectual property license agreements that included settlements for which there was no objective evidence of the fair value of the settlement. Under SAB 101, in the absence of objective evidence of the fair value of the settlement, revenue is recognized prospectively over the remaining term of the intellectual property license agreement. In addition, revenue recognition was deferred for certain products for multiple-element agreements where certain services, primarily installation and integration, were deemed to be essential to the functionality of delivered elements.
SFAS No. 133, “Accounting for Derivative Instruments and Hedging Activities” (“SFAS 133”) Effective October 1, 2000, we adopted SFAS 133, and its corresponding amendments under SFAS 138. SFAS 133 requires us to measure all derivatives, including certain derivatives embedded in other contracts, at fair value and to recognize them in the consolidated balance sheet as an asset or a liability, depending on our rights or obligations under the applicable derivative contract. For derivatives designated as fair value hedges, the changes in the fair value of both the derivative instrument and the hedged item are recorded in other income (expense). For derivatives designated as cash flow hedges, the effective portions of changes in the fair value of the derivative are reported in other comprehensive income (“OCI”) and subsequently are reclassified into other income (expense) when the hedged item affects earnings. Changes in the fair value of derivative instruments not designated as hedging instruments and ineffective portions of hedges are recognized in other income (expense) in the period incurred. The adoption of SFAS 133 as of October 1, 2000, resulted in a cumulative after-tax reduction in net loss of $30 million (net of a $17 million tax provision), or $0.01 per basic and diluted share, and an $11 million credit to OCI. The reduction in net loss is primarily attributable to derivatives not designated as hedging instruments, including foreign currency embedded derivatives, equity warrants and other derivatives. 18. COMMITMENTS AND CONTINGENCIES Legal Proceedings We are subject to legal proceedings, lawsuits, and other claims, including proceedings by government authorities. In addition, we may be subject to liabilities of some of our former affiliates under separation agreements with them. Legal proceedings are subject to uncertainties, and the outcomes are difficult to predict. Consequently, we are unable to estimate the ultimate aggregate amounts of monetary liability or financial impact with respect to these matters as of September 30, 2003. We have reached a preliminary agreement for the settlement of our securities and related litigation, which is described below, and the amount of this settlement is reflected in our financial results. We believe that the remainder of the cases will not have a material financial impact on us after final disposition. However, because of the uncertainties of legal proceedings, one or more of these proceedings could ultimately result in material monetary payments by us.
F-68
Securities and Related Cases On March 27, 2003, we announced that we had reached an agreement to settle assorted securities, ERISA and derivative class action and other related lawsuits against us and certain of our current and former directors, officers and employees. The settlement requires approval from various courts before it becomes final. We did not admit any wrongdoing as part of the settlement. We received preliminary approval of the settlement from the U.S. District Court in Newark, New Jersey, on September 23, 2003. A settlement fairness hearing is scheduled for December 12, 2003. The agreement is a global settlement of what were 53 separate lawsuits, including a consolidated shareowner class action lawsuit in the U.S. District Court of New Jersey, and related ERISA, bondholder, derivative, and other state securities cases. Under the settlement agreement, we will pay $315 million in common stock, cash or a combination of both, at our option. We also will issue warrants to purchase 200 million shares of our common stock at an exercise price of $2.75 per share with an expiration date three years from the date of issuance. As of September 30, 2003, the value of these warrants was approximately $161 million, based upon the Black-Scholes option-pricing model. In connection with the settlement we will pay up to $5 million in cash for the cost of settlement administration and for certain other costs involved in the issuance of securities. The settlement covers all claims generally relating to the purchase of Lucent securities during different class periods. The primary class period is October 26, 1999 through December 20, 2000. We expect that the settlement approval and claims administration process will go on until the latter part of calendar 2004 and do not expect to distribute any proceeds until sometime in the fourth quarter of fiscal 2004 or in fiscal 2005. We have agreed to deposit into escrow $100 million of the settlement amount in cash or securities, or a combination of both, upon final approval of the settlement by the U.S. District Court in New Jersey of the consolidated case In re Lucent Technologies Inc., Securities Litigation and the ERISA cases. In addition to our contribution of cash, stock and warrants, certain of our insurance carriers have agreed to pay their available policy limits of $148 million in cash into the total settlement fund. Our former affiliate, Avaya Inc., is contractually responsible under its agreements with us to contribute an additional $24 million to the settlement. We will seek partial recovery of the settlement amount from our fiduciary insurance carriers under certain insurance policies that provide coverage up to $70 million. The charge for the settlement will be revised in future quarters if we are able to recover a portion of the settlement from our fiduciary insurance carriers, as well as to reflect additional changes in the fair value of the warrants until they are issued. We have the right to terminate the settlement if class members who purchased more than 3% of the total shares purchased by all class members during the class period of any alleged class elect to opt out of the settlement and pursue their claims directly against us. We will need to defend any lawsuits that may be brought by parties opting out of the settlement, regardless of whether we elect to consummate the settlement. We and certain of our current and former officers and directors are defendants in an action in the U.S. District Court in New Jersey, Staro Asset Management, LLC v. Lucent Technologies Inc. et al., alleging violations of federal securities laws. The case was originally part of the global settlement referred to above, however, the plaintiff indicated its desire not to settle and to pursue its claim separately against the defendants. We have moved to dismiss the complaint. Government Investigations In November and December 2000, we identified certain revenue recognition issues that we publicly disclosed and brought to the SEC’s attention. On February 27, 2003, we announced that we had reached an agreement in principle with the staff of the SEC that would resolve their investigation. The agreement is subject to final approval by the SEC. Under this agreement, without admitting or denying any wrongdoing, we would consent to a settlement enjoining us from future violations of the antifraud, reporting, books and records, and internal control provisions of the federal securities laws. Under the agreement in principle, we would pay no fines or penalties and would not be required to restate any of our financial statements. In August 2003, the U.S. Department of Justice and the SEC informed us that they had each commenced an investigation into possible violations of the Foreign Corrupt Practices Act. These investigations follow
F-69
allegations made by National Group for Communications and Computers Ltd. in an action filed against us on August 8, 2003, which is described below. We are cooperating with both agencies. Other Matters In the normal course of business, we are involved in commercial disputes with customers, suppliers, subcontractors and others. These matters generally involve claims for monetary damages for breach of contract or breach of warranty or similar claims. While many of these disputes are settled amicably without litigation, some of these matters will result in lawsuits being filed against us. The recent downturn in the telecommunications market and the insolvency or failure of numerous service providers has led to more claims and disputes resulting in litigation. In addition, our recent restructuring has resulted in the termination of tens of thousands of employees and changes in benefits for current and former employees. These actions have led to additional claims against us. The following is a description of the more significant pending litigation. Sparks, et al. v. AT&T and Lucent Technologies Inc. et al., is a class action lawsuit filed in 1996 in Illinois state court under the name of Crain v. Lucent Technologies. The plaintiffs requested damages on behalf of present and former customers based on a claim that the AT&T Consumer Products business (which became part of Lucent in 1996) and we had defrauded and misled customers who leased telephones, resulting in payments in excess of the cost of purchasing the telephones. Similar consumer class actions pending in various state courts were stayed pending the outcome of the Sparks case, and in July 2001, the Illinois court certified a nationwide class of plaintiffs. This matter was settled in August 2002, and we recognized a $162 million charge in the third fiscal quarter of 2002 as a result. In the first quarter of fiscal 2003, we reversed $80 million of this charge because the final settlement amount was significantly less than the original estimate due to the number of claimants that applied for reimbursement. We are a defendant in an adversary proceeding filed in U.S. Bankruptcy Court in Delaware by Winstar and Winstar Wireless, Inc. in connection with the bankruptcy of Winstar and various related entities. The complaint asserts claims for breach of contract and other claims against us and seeks compensatory damages, as well as costs and expenses associated with litigation. Many of these claims against us have been dismissed. The complaint also seeks recovery of a payment to us of approximately $190 million in December 2000. In September 2000, we and a third party created a non-consolidated ISPT to which we sold, on a limited-recourse basis, customer finance loans and receivables. As of September 30, 2003, the ISPT held customer finance loans, all of which were in default. The ISPT has a credit insurance policy from an unaffiliated insurance company insuring the ISPT against losses on these loans. Through reinsurance treaties, our wholly-owned captive insurance company assumed the risk under this policy for the loans and reinsured a significant amount of the exposure with an unaffiliated insurer. We ultimately expect that our captive insurance company will fund the remaining $50 million of its first-loss obligations, which has been reflected in other current liabilities as a self-insured loss reserve, and that the unaffiliated insurance company will fund $279 million of its reinsurance obligation, which has been reflected as a receivable in other assets as of September 30, 2003. The insurer has denied coverage on all of the loans in the ISPT and has alleged, among other claims, that the loans were not eligible to be sold to the ISPT due to their credit quality at the time of sale. The insurer stated that it would cease paying claims on these loans and requested that it be reimbursed for all claims previously paid and that we repurchase the loans. The amount previously paid to the ISPT under the insurance policy was funded by our captive insurance company. We dispute the assertions by the insurer and are pursuing binding arbitration to resolve the matter. If the insurer prevails on its denial of coverage, we will be required to indemnify the ISPT and its lenders and investors for the amount of coverage denied and the funds returned to the insurer. We will also be required to recognize a charge for the amount of the denied coverage. In the interim, we have agreed to advance funds to the ISPT to cover its principal and interest payments and fees as they become due until resolution of the dispute with the insurer. Absent favorable resolution of the dispute, the remaining funding requirements are approximately $78 million in fiscal 2004 and $208 million thereafter. There are approximately $500 million of gross receivables (primarily retention receivables included in other assets) as of September 30, 2003, from long-term projects that have been winding down in Saudi
F-70
Arabia. We are in the process of resolving various contractual claims and counterclaims with the customer in order to collect these receivables. There were minimal project revenues realized during fiscal 2003, and collections on the related receivables slowed considerably during the past three quarters due to various factors, including the pending resolution of project closeout claims. We believe that the resolution of these project close out issues will not have an adverse effect on our results of operations. On August 8, 2003, National Group for Communications and Computers Ltd. (“NGC”) filed an action in the U.S. District Court for the Southern District of New York against us, our subsidiary Lucent Technologies International Inc. and an unaffiliated company, alleging violations of the Racketeer Influenced Corrupt Organizations Act (“RICO”). These allegations relate to activities in Saudi Arabia in connection with certain telecommunications contracts between us, the Kingdom of Saudi Arabia and other entities. The complaint seeks damages in excess of $63 million, which could be tripled under RICO. The allegations in this complaint appear to arise out of certain contractual disputes between NGC and Lucent, which are the subject of a separate case that NGC previously filed against us in U.S. District Court in New Jersey. This case is in the early stages. In the case of Smith (Trustee) v Lucent Technologies, the trustee for bankrupt Actel Integrated Communications claims that we failed to deliver working products and that this failure caused the demise of Actel. Actel is claiming damages for lost profits and equity value and loss of liquidity. Discovery is continuing and a trial is tentatively scheduled for April 2004. In the case of Pf.NetSupply Corp. v. Lucent Technologies, the plaintiff claims that we breached an alleged $100 million purchase commitment and seeks to compel us to meet this purchase commitment or pay damages. Discovery is continuing, and a trial is tentatively scheduled for February 2004. A purported class action lawsuit, Foss v Lucent Technologies, was filed against us in U.S. District Court in New Jersey during October 2003 in connection with the elimination in early 2003 of the death benefit from our U.S. management pension plan. The elimination of these benefits reduced the future pension obligations by approximately $450 million. The benefit was paid out of the pension plan assets to certain qualified surviving dependents, such as spouses or dependant children, of management retirees who retired before 1998. The case alleges that we wrongfully terminated this death benefit and requests that it be reinstated, along with other remedies. This case is in its early stages, and we are not yet required to file an answer to the complaint. Separation Agreements We are party to various agreements that were entered into in connection with the separation of Lucent and former affiliates, including AT&T, Avaya, Agere Systems and NCR Corporation. Pursuant to these agreements, we and the former affiliates have agreed to allocate certain liabilities related to each other’s business, and have agreed to share liabilities based on certain allocations and thresholds. For example, in the Sparks case discussed above, AT&T, Avaya and NCR each assumed a portion of the liability for the settlement. We are not aware of any material liabilities to our former affiliates as a result of these agreements that are not otherwise reflected in our audited consolidated financial statements. Nevertheless, it is possible that potential liabilities for which the former affiliates bear primary responsibility may lead to contributions by us. Avaya is defending three separate purported class action lawsuits, one pending in state court in West Virginia, one in federal court in the Southern District of New York and another in federal court in the Southern District of California. All three actions are based on claims that we, as predecessor to Avaya’s business, sold products that were not Year 2000 compliant, meaning that the products were designed and developed without considering the possible impact of the change in the calendar from December 31, 1999, to January 1, 2000. The complaints seek, among other remedies, compensatory damages, punitive damages and counsel fees in amounts that have not yet been specified. Under the separation agreement with Avaya, we are responsible for 50% of the liabilities and costs related to these cases that exceed $50 million. Avaya has informed us that it currently cannot determine whether the outcome of these actions will be material or will trigger an obligation for us to make payments under the separation agreement. Our former affiliate, NCR Corporation, has disclosed that it is responsible for remediation costs related to the discharge of contaminants into the Fox River in Wisconsin. NCR has informed us that these costs are
F-71
expected to exceed threshold limits under the separation agreement among NCR, AT&T and us. As a result, we recognized a charge of $5 million for our expected obligation under this agreement during fiscal 2003. Other Commitments We have agreed to purchase 90% of our requirements for products we currently purchase from Agere and 60% of our requirements for other products that Agere can supply through September 30, 2006, provided Agere is competitive with other potential suppliers as to price, lead time and technological merit. We have also agreed to proceed first with Agere on all joint product development projects where Agere meets our criteria.
We are generally not committed to multi-year unconditional purchase obligations, except for a commitment that requires annual purchases of certain wireless components ranging from approximately $320 million to $350 million over the next two years. Generally, differences between the actual annual purchases and the committed levels can be applied to future years through fiscal 2006, at which time we would be required to pay 25% of the unfulfilled aggregate commitment.
We have exited most of our manufacturing operations and have increased our use of contract manufacturers. A sole-source supplier is currently used for a majority of the switching and wireless product lines, and multiple contract manufacturers supply the majority of the other product lines. We are generally not committed to unconditional purchase obligations in these contract-manufacturing relationships. However, there is exposure to short-term purchase commitments when they fall within the contract manufacturers’ lead-time for specific products or raw materials. As a result, any sudden and significant changes in forecast demand requirements within the lead-time of those products or raw materials could adversely affect our results of operations and cash flows. We have approximately $495 million of purchase commitments related to these arrangements as of September 30, 2003. We currently outsource certain information technology services from a supplier under a multiyear agreement that provides for minimum spending levels of approximately $60 million during fiscal 2004 and declines to approximately $10 million during fiscal 2006. The agreement provides for termination charges of approximately $90 million if the agreement is cancelled during fiscal 2004 and lower termination charges if it is cancelled thereafter. We have various other purchase commitments for telecommunications services and other general corporate products and services, which provide for minimum spending levels of approximately $110 million during fiscal 2004, and declines by various amounts to approximately $5 million during fiscal 2008. Guarantees and Indemnification Agreements A description of the Company’s guarantees as of September 30, 2003, is provided below. The Company is unable to reasonably estimate the maximum amount that could be payable under certain of these arrangements because the exposures are not capped and because of the conditional nature of the Company’s obligations and the unique facts and circumstances involved in each agreement. Historically, payments made under these agreements have not had a material effect on the Company’s business, financial condition or results of operations, other than certain guarantee payments made in connection with the customer financing arrangements discussed below. We guarantee the financing of certain product purchases by certain customers. Requests for providing such guarantees are reviewed and subject to approval by senior management and are regularly reviewed by them in assessing the adequacy of reserves. The principal amount of drawn customer financing guarantees and related reserves was $88 million and $81 million, respectively, as of September 30, 2003. The remaining guarantee periods range from three months to seven years. In addition, $43 million of commitments are available to customers from third-party lenders, but these commitments may expire undrawn. We are required to perform under these commitments if a customer defaults for non-payment to the creditor, and we typically retain a first-loss position. We will generally have the right to recover from the defaulting party through subrogation, but usually only after the creditor has been paid in full.
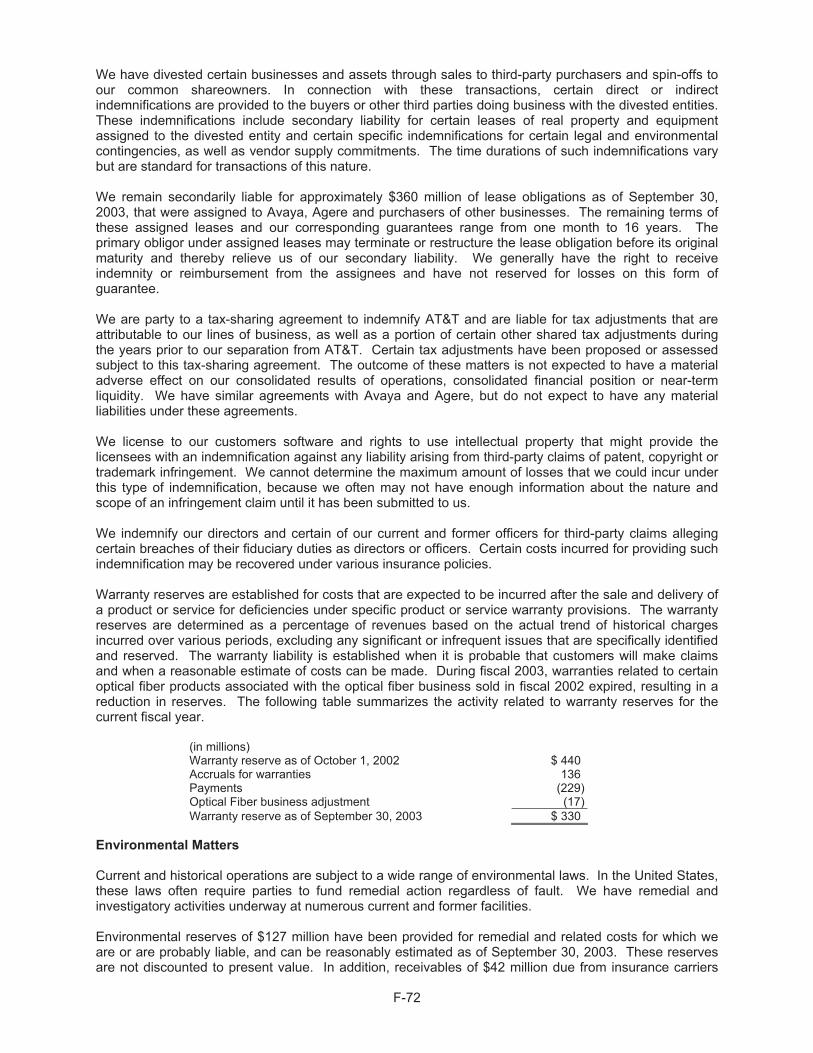
F-72
We have divested certain businesses and assets through sales to third-party purchasers and spin-offs to our common shareowners. In connection with these transactions, certain direct or indirect indemnifications are provided to the buyers or other third parties doing business with the divested entities. These indemnifications include secondary liability for certain leases of real property and equipment assigned to the divested entity and certain specific indemnifications for certain legal and environmental contingencies, as well as vendor supply commitments. The time durations of such indemnifications vary but are standard for transactions of this nature. We remain secondarily liable for approximately $360 million of lease obligations as of September 30, 2003, that were assigned to Avaya, Agere and purchasers of other businesses. The remaining terms of these assigned leases and our corresponding guarantees range from one month to 16 years. The primary obligor under assigned leases may terminate or restructure the lease obligation before its original maturity and thereby relieve us of our secondary liability. We generally have the right to receive indemnity or reimbursement from the assignees and have not reserved for losses on this form of guarantee. We are party to a tax-sharing agreement to indemnify AT&T and are liable for tax adjustments that are attributable to our lines of business, as well as a portion of certain other shared tax adjustments during the years prior to our separation from AT&T. Certain tax adjustments have been proposed or assessed subject to this tax-sharing agreement. The outcome of these matters is not expected to have a material adverse effect on our consolidated results of operations, consolidated financial position or near-term liquidity. We have similar agreements with Avaya and Agere, but do not expect to have any material liabilities under these agreements. We license to our customers software and rights to use intellectual property that might provide the licensees with an indemnification against any liability arising from third-party claims of patent, copyright or trademark infringement. We cannot determine the maximum amount of losses that we could incur under this type of indemnification, because we often may not have enough information about the nature and scope of an infringement claim until it has been submitted to us. We indemnify our directors and certain of our current and former officers for third-party claims alleging certain breaches of their fiduciary duties as directors or officers. Certain costs incurred for providing such indemnification may be recovered under various insurance policies. Warranty reserves are established for costs that are expected to be incurred after the sale and delivery of a product or service for deficiencies under specific product or service warranty provisions. The warranty reserves are determined as a percentage of revenues based on the actual trend of historical charges incurred over various periods, excluding any significant or infrequent issues that are specifically identified and reserved. The warranty liability is established when it is probable that customers will make claims and when a reasonable estimate of costs can be made. During fiscal 2003, warranties related to certain optical fiber products associated with the optical fiber business sold in fiscal 2002 expired, resulting in a reduction in reserves. The following table summarizes the activity related to warranty reserves for the current fiscal year.
(in millions) Warranty reserve as of October 1, 2002 $ 440 Accruals for warranties 136 Payments (229) Optical Fiber business adjustment (17) Warranty reserve as of September 30, 2003 $ 330
Environmental Matters Current and historical operations are subject to a wide range of environmental laws. In the United States, these laws often require parties to fund remedial action regardless of fault. We have remedial and investigatory activities underway at numerous current and former facilities. Environmental reserves of $127 million have been provided for remedial and related costs for which we are or are probably liable, and can be reasonably estimated as of September 30, 2003. These reserves are not discounted to present value. In addition, receivables of $42 million due from insurance carriers
F-73
and other third-party indemnitors have been recognized as of September 30, 2003. We recognize these receivables only if the carriers or other indemnitors have agreed to pay the claims and management believes collection of the receivables is probable. Charges related to environmental matters were $25 million, $26 million and $38 million during fiscal 2003, 2002 and 2001, respectively. Reserves for estimated losses from environmental remediation are, depending on the site, based on analyses of many interrelated factors, including:
• The extent and degree of contamination and the nature of required remedial actions. • The timing and various types of environmental expenditures, such as investigatory, remedial,
capital and operations, and maintenance costs. • Applicable legal requirements defining remedial goals and methods. • Progress and stage of existing remedial programs in achieving remedial goals. • Innovations in remedial technology and expected trends in environmental costs and legal
requirements. • The number, participation level and financial viability of other potentially responsible parties. • The timing and likelihood of potential recoveries or contributions from other third parties. • Historical experience. • The degree of certainty and reliability of all the factors considered.
It is often difficult to estimate the future impact of environmental matters, including potential liabilities, due to the above factors and the lengthy time periods involved in resolving them (which may be up to 30 years or longer). Although we believe that our reserves are currently adequate, there can be no assurance that the amount of capital expenditures and other expenses which will be required relating to remedial actions and compliance with applicable environmental laws will not exceed the amounts reflected in reserves or will not have a material adverse effect on our financial condition, results of operations or cash flows. Any possible loss or range of possible loss that may be incurred in excess of amounts provided for as of September 30, 2003 cannot be reasonably estimated. Lease Commitments We lease land, buildings and equipment under agreements that expire in various years through 2020. Rental expense, net of sublease rentals, under operating leases was $324 million, $421 million and $476 million for fiscal 2003, 2002 and 2001, respectively. Future minimum lease payments due under non-cancelable operating leases (including leases that are part of our restructuring actions) as of September 30, 2003, for fiscal 2004 through fiscal 2008 and thereafter were $243 million in 2004, $174 million in 2005, $131 million in 2006, $109 million in 2007, $99 million in 2008 and $638 million thereafter. These future minimum lease payments do not include future sublease rental income for fiscal 2004 through fiscal 2008 and thereafter of $36 million in 2004, $25 million in 2005, $14 million in 2006, $12 million in 2007, $10 million in 2008 and $122 million thereafter.
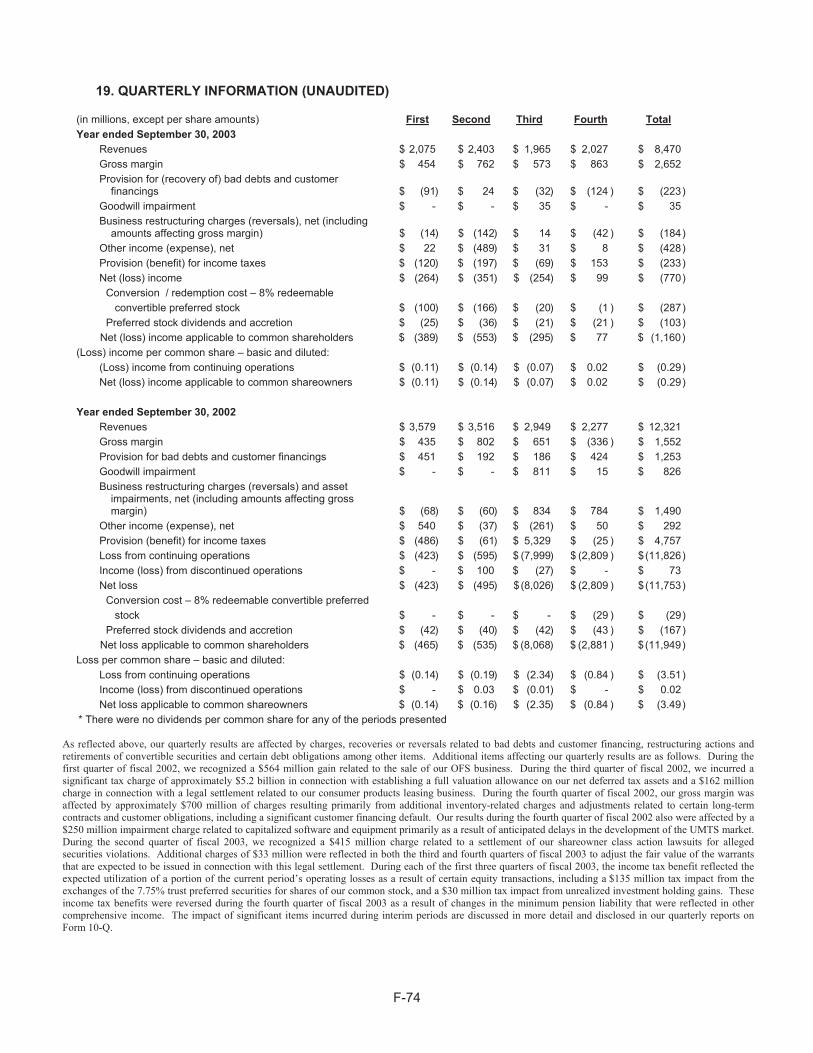
F-74
19. QUARTERLY INFORMATION (UNAUDITED)
(in millions, except per share amounts) First Second Third Fourth Total Year ended September 30, 2003
Revenues $ 2,075 $ 2,403 $ 1,965 $ 2,027 $ 8,470 Gross margin $ 454 $ 762 $ 573 $ 863 $ 2,652 Provision for (recovery of) bad debts and customer
financings $ (91) $ 24 $ (32) $ (124 ) $ (223) Goodwill impairment $ - $ - $ 35 $ - $ 35 Business restructuring charges (reversals), net (including
amounts affecting gross margin) $ (14 ) $ (142 ) $ 14 $ (42 ) $ (184 ) Other income (expense), net $ 22 $ (489) $ 31 $ 8 $ (428) Provision (benefit) for income taxes $ (120) $ (197) $ (69 ) $ 153 $ (233 ) Net (loss) income $ (264 ) $ (351) $ (254 ) $ 99 $ (770 )
Conversion / redemption cost – 8% redeemable convertible preferred stock $ (100) $ (166) $ (20) $ (1 ) $ (287) Preferred stock dividends and accretion $ (25) $ (36) $ (21) $ (21 ) $ (103) Net (loss) income applicable to common shareholders $ (389) $ (553) $ (295) $ 77 $ (1,160) (Loss) income per common share – basic and diluted:
(Loss) income from continuing operations $ (0.11 ) $ (0.14 ) $ (0.07 ) $ 0.02 $ (0.29 ) Net (loss) income applicable to common shareowners $ (0.11 ) $ (0.14 ) $ (0.07 ) $ 0.02 $ (0.29 )
Year ended September 30, 2002
Revenues $ 3,579 $ 3,516 $ 2,949 $ 2,277 $ 12,321 Gross margin $ 435 $ 802 $ 651 $ (336 ) $ 1,552 Provision for bad debts and customer financings $ 451 $ 192 $ 186 $ 424 $ 1,253 Goodwill impairment $ - $ - $ 811 $ 15 $ 826 Business restructuring charges (reversals) and asset
impairments, net (including amounts affecting gross margin) $ (68 ) $ (60) $ 834
$ 784 $ 1,490
Other income (expense), net $ 540 $ (37) $ (261) $ 50 $ 292 Provision (benefit) for income taxes $ (486 ) $ (61) $ 5,329 $ (25 ) $ 4,757 Loss from continuing operations $ (423 ) $ (595 ) $ (7,999) $ (2,809 ) $ (11,826 ) Income (loss) from discontinued operations $ - $ 100 $ (27) $ - $ 73 Net loss $ (423 ) $ (495 ) $ (8,026) $ (2,809 ) $ (11,753 )
Conversion cost – 8% redeemable convertible preferred stock $ - $ - $ - $ (29 ) $ (29) Preferred stock dividends and accretion $ (42) $ (40) $ (42) $ (43 ) $ (167) Net loss applicable to common shareholders $ (465) $ (535) $ (8,068) $ (2,881 ) $ (11,949) Loss per common share – basic and diluted:
Loss from continuing operations $ (0.14 ) $ (0.19 ) $ (2.34) $ (0.84 ) $ (3.51 ) Income (loss) from discontinued operations $ - $ 0.03 $ (0.01) $ - $ 0.02 Net loss applicable to common shareowners $ (0.14) $ (0.16) $ (2.35) $ (0.84 ) $ (3.49 )
* There were no dividends per common share for any of the periods presented
As reflected above, our quarterly results are affected by charges, recoveries or reversals related to bad debts and customer financing, restructuring actions and retirements of convertible securities and certain debt obligations among other items. Additional items affecting our quarterly results are as follows. During the first quarter of fiscal 2002, we recognized a $564 million gain related to the sale of our OFS business. During the third quarter of fiscal 2002, we incurred a significant tax charge of approximately $5.2 billion in connection with establishing a full valuation allowance on our net deferred tax assets and a $162 million charge in connection with a legal settlement related to our consumer products leasing business. During the fourth quarter of fiscal 2002, our gross margin was affected by approximately $700 million of charges resulting primarily from additional inventory-related charges and adjustments related to certain long-term contracts and customer obligations, including a significant customer financing default. Our results during the fourth quarter of fiscal 2002 also were affected by a $250 million impairment charge related to capitalized software and equipment primarily as a result of anticipated delays in the development of the UMTS market. During the second quarter of fiscal 2003, we recognized a $415 million charge related to a settlement of our shareowner class action lawsuits for alleged securities violations. Additional charges of $33 million were reflected in both the third and fourth quarters of fiscal 2003 to adjust the fair value of the warrants that are expected to be issued in connection with this legal settlement. During each of the first three quarters of fiscal 2003, the income tax benefit reflected the expected utilization of a portion of the current period’s operating losses as a result of certain equity transactions, including a $135 million tax impact from the exchanges of the 7.75% trust preferred securities for shares of our common stock, and a $30 million tax impact from unrealized investment holding gains. These income tax benefits were reversed during the fourth quarter of fiscal 2003 as a result of changes in the minimum pension liability that were reflected in other comprehensive income. The impact of significant items incurred during interim periods are discussed in more detail and disclosed in our quarterly reports on Form 10-Q.

[THIS PAGE INTENTIONALLY LEFT BLANK]
SHAREOWNER HOTLINE
If you are a registered shareowner and havea question about your account, or youwould like to report a change in your nameor address, please call Lucent’s shareownerservices and transfer agent, The Bank ofNew York, toll-free at 1 888 LUCENT6(1 888 582-3686). If you are outside theUnited States, call collect at 610 382-7839.If you use a telecommunications device forthe deaf (TDD) or a teletypewriter (TTY),call 1 800 711-7072. Customer service rep-resentatives are available Monday throughFriday from 8 a.m. to 6 p.m. Eastern time.Shareowners also may send questionselectronically to the e-mail address atThe Bank of New York:[email protected] you may write to:Lucent Technologiesc/o The Bank of New YorkP. O. Box 11009Church Street StationNew York, NY 10286-1009
ANNUAL SHAREOWNERS’ MEETING
The 2004 annual meeting of shareownerswill be held Wednesday, Feb. 18, 2004,at 9 a.m. EST in The DuPont Theatre at TheHotel DuPont, 10th and Market streets,Wilmington, Del. 19801.
INTERNET/TELEPHONE VOTING
As a convenience, most Lucent shareownersmay vote their proxies via the Internet athttp://www.proxyvote.com or vote byphone. Instructions are in your proxy cardthat you receive. Registered shareownersmay sign up to access Lucent’s annual reportand proxy statement over the Internet in thefuture. Beneficial owners may contact thebrokers, banks or other holders of record oftheir stock to find out whether electronicdelivery is available. You may also enroll forthis service online at:www.lucent.com/investorIf you choose electronic delivery, you willnot receive the paper form of the annualreport and proxy statement. Instead youwill be notified when the materials areavailable on the Internet.
QUARTERLY RESULTS
Lucent usually reports its results during thelatter part of January, April, July andOctober.
DIRECT STOCK PURCHASE PLAN
The BuyDIRECT* direct stock purchaseplan provides a convenient way to purchaseinitial or additional shares of Lucent stock.Please call The Bank of New York directly at1 888 LUCENT6 (1 888 582-3686) for a planbrochure and enrollment form, or writedirectly to the address above. Also, you canvisit The Bank of New York’s stock transferWeb site to view the plan brochure onlineor to download an enrollment form:www.stockbny.com/lucent
STOCK DATA
Lucent stock is traded in the United Stateson the New York Stock Exchange under theticker symbol LU.
Shares outstanding as of Oct. 1, 2003:4,168,610,567Shareowners of record as of Oct. 1, 2003:1,423,559
HEADQUARTERS
Lucent Technologies600 Mountain Ave.Murray Hill, NJ 07974-0636
COPIES OF REPORTS
If you would like to order additional copiesof this report, please call 1 888 LUCENT6(1 888 582-3686). To view this report online,or to order copies of our latest filings withthe U.S. Securities and ExchangeCommission, visit our Investor RelationsWeb site at: www.lucent.com/investorIf you have more than one account in yourname or the same address as other share-owners of record, you may authorize us todiscontinue mailing of multiple annualreports and proxy statements and certainother mailings. If you would like to setup this process, known as householding,please contact your bank, broker or otherholder of record.
PRODUCTS AND SERVICES
For information, call our special toll-freenumber: 1 888 4LUCENT (1 888 458-2368).
LUCENT ON THE WEB
www.lucent.comInvestor Informationwww.lucent.com/investor
Corporate Informationwww.lucent.com/news/corpinfo
Products, Services and Solutionswww.lucent.com/solutions
Latest Newswww.lucent.com/news
Employmentwww.lucent.com/work
Research/Technologywww.bell-labs.com
*BuyDIRECT is a service mark of The Bank of New York.
E C Printed on recycled paper. This document is recyclable.
©2003 Lucent Technologies. Printed in the USA.
I N F O R M A T I O N F O R O U R I N V E S T O R S

W A T C H O U R W E B S I T E F O R T H E L A T E S T B U S I N E S S D E V E L O P M E N T S
w w w . l u c e n t . c o m