luiz guilherme de mello university of sao paulo, brazil...
TRANSCRIPT

PROCEEDINGS OF THE FOURTH INTERNATIONAL CONGRESS ON ENVIRONMENTALGEOTECHNICS (4th ICEG) / RIO DE JANEIRO / BRAZIL /11-15 AUGUST 2002
Edited by
Luiz Guilherme de MelloUniversity of Sao Paulo, Brazil
Marcio AlmeidaCoppe-UFR.J, Graduate School of Engineering, Federal University of Rio de Janeiro, Brazil
VOLUME 2
LISSE /ABINGDON / EXTON (PA) / TOKYOA.A. BALKEMA PUBLISHERS

Environmental Geotechnics (41' ICEG), de Mello & Almeida (eds)@ 2002 Swets & Zeit/inger, Lisse, ISBN 90 5809 501 0
Containment systems: lessons learned from North American failures
Craig H. BensonUniversity ofWlSconsin-Madison, Madison, Wisconsin, USA
ABSTRACT: Ten case histories are described where containment systems have failed or did not meet theirintended function. Lessons learned from the case histories are presented so as to prevent similar problems inthe future. The failures have been caused by physical instability, environmental incompatibility, inadequateconstruction techniques and specifications, improper testing methods, and insufficient attention to site charac-terization. None of the failures can be attributed to lack of suitable technology or theory. Each of the failurescould have been avoided with more emphasis on attention to detail and basic principles.
storage piles, heap leach systems, and surface im-poundments and lagoons. Hydraulic control is theprimary function of covers, whereas the function oflinerS is hydraulic control and minimization of con-taminant migration. Adequate performance of linerand cover systems requires that the system (i) beproperly designed to meet the fundamental perform-ance criteria (i.e., upper bounds on leakage rate, con-taminant mass discharge, etc.), (ii) be physically sta-ble, (iii) be properly constructed, and (iv) becompatible with the surrounding environment. Thelatter three issues are discussed here through severalcase histories. A discussion of design issues can befound in Benson (200 I).
1 INTRODUCTION
2.1 Physical stability
Physical stability has been an underlying tenet ofgeotechnical and geological engineering since theadvent of the discipline. Constructed facilities willperform their intended function only if they remainphysically stable. While stability analysis should bea fundamental component during design of all con-tainment facilities, it is often ignored or inadequatelyaddressed. The massive slide at the Kettleman Hillshazardous waste landfill in southern California, USAduring the late 1980s is a classic example of the im-portance of stability in the design of containmentsystems (Seed et al. 1990, Stark and Poeppel 1994).Unfortunately, the lessons learned from the Kettle-man Hills failure have not fundamentally changedengineering practice, as evinced by the unacceptablefrequency at which stability failures still occur (e.g.,Koerner and Soong 2000, Stark et al. 2000).
A prime example is the massive slide that oc-curred at a municipal solid waste landfill in the up-
Containment systems designed by geotechnical, geo-logical, and geoenvironmental engineers are used ina variety of environmental applications ranging fromwaste containment to remediation of contaminatedland. In this paper, the terDl .containment system' isused in a broad context to include all geoenviron-mental systems designed to retain contaminantswithin a specified area. Although hydraulic barriersthat retard advective and diffiIsive contaminanttransport are a key element in most containment sys-tems, the broad defmition used here also includessystems such as perDleable reactive barriers (i.e.,barrier systems that contain contaminants via re-moval or destruction rather than hydraulic imped-ance).
This paper describes ten case histories in NorthAmerica where a containment system failed or didnot function as intended. The emphasis is on lessonslearned from these failures that can be incorporatedinto engineering practice. As will become evident,nearly all of the failures were caused by inattentionto detail, inadequate construction methods and speci-fications, improper testing methods, haste, and insuf-ficient site characterization, all of which can be read-ily remedied through more careful practice. None ofthe failures can be attributed to inadequacy in theoryor design procedures.
2 LINER AND COVER SYSTEMS
Liner and cover systems are used as hydraulic barri-ers in a variety of applications, including landfills,
1095

Figwe 1. Cross-section of initial phase of cell where slide occurred.
per midwestern United States in April 2000. Plansfor the cell called for construction in a series ofphases, with a new phase being constructed annu-ally. The first phase consisted of a 4OO-m-long and20-m-deep excavation in glacial clay till (Fig. I),with the base grade being approximately 19 m belowthe ground water table. The base of this phase was tobe 80 m wide, and the side slope was to be at 3: I(length of side slope = 60 m). To reduce construc-tion costs, however, the base was constructed half aswide (40 m) as originally planned. No other changesto the geometry were made. A composite liner sys-tem was constructed consisting of a compacted clayliner 1.2-m thick overlain by a 1.5-mm-thick smoothHDPE geomembrane, a non-woven geotextile cush-ion (550 g/m2), and a 600 mm layer of leachate col-lection stone (nominal size = 50 rom). Smooth ge-omembrane was used in place of the texturedgeomembrane proposed in the design to reduce ma-terial costs.
Filling proceeded in lifts 3 m thick and continuedfor 6.5 mos, at which time the surface of the wastewas approximately 3 m above the original groundsurface. At this point, a crack formed in the waste atthe top of the slope near the center of the cell (Fig.2). Within minutes, the crack propagated north-southalong the extent of the cell. This crack was followedimmediately by translation of 142,000 Mg of wasteas slippage occurred between the clay liner and ge-omembrane. A 15-m wide crevice remained after thewaste stabilized. No injuries or releases occurred,but the cell was closed and waste being delivered tothe facility was diverted, resulting in significant lossof revenue.
Figure 2. Topographic map of cell where slide occurring show-ing as-built outline of as-built cell and location of crevice.
2.1.1 Forensic investigationA forensic investigation began two days after theslide. Sample5 of the clay liner, geosynthetics, andthe leachate collection stone were obtained, and asuite of interface shear tests were conducted using alarge-scale direct shear machine and methods de-scribed in ASTM D 5321. A condition of particularimportance was the presence of groundwater-induced pore water pressures at the interface be-tween the clay liner and geomembrane. This condi-tion required an effective stress analysis. However,the schedule of the forensic investigation did notpermit drained direct shear testing of the clay-geomembrane interface. Preliminary testing showedthat at least 15 days per test would be required. Con-
sequently, undrained tests were conducted with a se-ries of pore water pressure tips located along thelength of the specimen and close to the clay-geomembrane interface.
Tests were conducted at four combinations ofwa-ter content and dry unit weight (A, B, C, and D)(Fig. 3) representing the range of compaction condi-tions during construction of the clay liner. Failureenvelopes from these tests interpreted in terms of ef-fective stresses are shown in Fig. 4 for peak andlarge-displacement (60 mm) conditions. When inter-preted in terms of effective stresses, the data con-verge to form two envelopes (peak and large-displacement). The effective stress envelopes haveno cohesion. The friction angles for peak and large-displacement conditions are 15 ° and 12°.
1096

2.1.2 Two-dimensional analyses struction obtained an exemption from regulationsA two-dimensional effective stress analysis of the requiring interface shear testing by arguing thatslide was conducted using lanbu's method, as im- "shear testing of the base liner components wouldplemented in WinSTABL (www.uwgeosoft.org). A serve no useful purpose" and that "any mass move-two-block analytical solution was also used. The ef- ment would occur exclusively along" the geotextile-fective strength parameters shown in Fig. 4 were geomembrane interface "and not compromise the in-used in the analyses. Pore water pressures at the tegrity of the underlying geomembrane and clayclay-geomembrane interface initially were assumed liner." Clearly the engineer was dead wrong. If test-to be negligible, because design calculations indi- ing had been completed and a stability analysis hadcated that several years would elapse before positive been conducted, the likelihood of failure would havepore water pressures would develop. Four cross- been obvious, and design changes would have beensections along the length of the slide were consid- made.ered. Both lanbu's method and the analytical solu-tion yielded essentially the same results. The factor 20.5of safety ranged from 1.10 - 1.21 using peakstrengths or 0.87 - 0.96 using large-displacement 20.0strengths. That is, a one-dimensional analysis con-ducted during design should have shown that failure ~E 195was likely, even without the effects of pore water ~.pressures. Veneer analyses conducted with the peak iand large-displacement friction angles also showed ~ 19.0
that the geosynthetics should have failed in tension, ~which was later confirmed in test pits excavated ~ 18.5
0along the top of the slope. Note: 9.81 kN/m' = 1 tim'
A review of the project documents was under- 18.0 --e-- Brown Silty Clay B.. . .taken to determine how the design was completed -..c.- Gray Silty Clay .
h . 1 d . . 1 1 . . Field CompactionW en a conventlona two- ImenSIona ana YSIS 175showed that the as-constructed geometry was likely . 6 8 10 12 14 16 18
to be unstable when a smooth geomembrane was Water Content (%)used. This review indicated that stability analyseswere conducted on the 'build-out' geometry of the Figw:e 3. Compaction data and locations of.test conditions A-Dcell (i.e., an analysis of the filled cell, including for direct shear tests on clay-geomembrane Interface.
cover system), but no analysis had been conducted . . .to evaluate the stability of the internal geometry as SenSItlVIt;Y analyses were conducted to con~~the cell was being filled. Additionally, no analyses that the desIgn woul? have been stable had the ongI-were conducted to determine if the design changes nal geometry been Implemented and a textured ge-made prior to construction (i.e., reduction in width omembran~ ha~ been u~ed..Results ofthes~ analysesof the cell, substitution of smooth for textured ge- "!fe shown m FIg. ~, whIch IS a graph shoWIng a ~am-omembrane) affected internal stability, and no inter- Ily o~ curve.s relatIng factor of safe~ to the heIg;ht-face shear testing was conducted to determine suit- ~o-width ra~Io.ofthe cell. Each curve IS for a specIficable shear strength parameters to use in a stability Interface ~ctlon angle. .analysis. In fact the engineer responsible for con- If a wIder (80 m), base was constructed USIng
, smooth geomembrane, the factor of safety would
150--e- Peak
S ' = peak effective interface friction angle ~ Large Displacement~ p~ 100 SLC' = large-displacement effective interface friction angle
.c-0, S'=15°co p 0~
Ci5 S '= 120~ LCm 5.c(J)
00 50 100 150 200 250 300
Effective Stress (kpa)
Figure 4. Effective-stress failure envelopes for the clay-geomembrane interface.
1097
I

have been 1.25 based on large-displacement
strengths. If textured geomembrane had been used
with the original geometry (80 m wide base), the
factor of safety would have 2.3 and the cell would
have been stable. Even with the narrower base (40
m), the factor of safety would have been 1.6 had tex-
tured geomembrane been used.
was filled with sand. A drill rig was then used topush the piezometers through'the sand, leachate col-lection layer, and the surface of the liner. Data werecollected from the piezometers for 14 mos after theslide occurred. Relatively constant pore water pres-sures were obtained from the piezometers, exceptduring periods when the waste being removed for re-location. A complete description of the ground waterflow model and the pressure measurements can befound in Camacho (2002).
The piezeometric surface predicted by the groundwater flow model is shown in Fig. 6, along with themeasurements made with the piezometers. Reason-able agreement between the model and data wereobtained, although the model tended to over-predictthe location of the piezometric surface in the upperportion of the slope. Thus, the piezeometric surfacewas calibrated until it fit the data, and then the dis-tribution of pore water pressures from the calibratedpiezeometric surface was used as input for the slopestability analyses.
The three-dimensional analyses were conductedusing interface friction angles of 9, 12 (large-displacement strength), 15 (peak strength), 18, and21 °. The 9° friction angle is an estimate of the fric-tion angle corresponding to full residual strengths.
Figure S. Factors of safety determined from sensitivity analysesconducted by varying height-to-width ratio and interface fric-tion angle.
Figure 6. Piezometric surface obtained from the ground watermodel and measurements of piezometric surface made usingpush-in piezometers. Elevation measured relative to bedrock.
2.] .3 Three-dimensional analysesThe two-dimensional analyses showed that a con-ventional evaluation of stability would have revealedthat the cell was likely to be unstable. Nevertheless,two key questions still remained unanswered. First,movement occurred near the ends of the cell duringthe slide. Thus, even though the failure occurred in along and narrow cell, different conclusions mighthave been drawn had a three-dimensional analysisbeen conducted. Second, even though calculationsmade during design indicated that the cell would befilled long before Pore water pressures developed atthe interface, no data were available to validate thecalculations. To address these issues, three-dimensional slope stability analyses were conductedusing the program Clara-W (Hungr 2001) with andwithout pore water pressures at the interface between the clay and geomembrane. Two-dimensionaJanalyses were also made using pore water pressuresfor comparison with the other analyses.
An estimate of the distribution of pore waterpressure was made by constructing a two-dimensional ground water flow model using the fi-nite element code FEHT (Klein et al. 200 I). Pres-sures predicted by FEHT were checked againstmeasurements made using Geonor M-600 seriespush-in piezometers. To install the piezometers, bor-ings were advanced through the waste using abucket auger. Once the leachate collection layer wasreached, the auger was removed and the borehole
This estimate was made based on the average ra-tio of residual and peak strengths reported in Stark etal. (1994). The 18 and 210 friction angles correspondto conditions likely to have existed had a texturedgeomembrane been used.
Results of the three-dimensional analyses areshown in Fig. 7. The factors of safety from theanalyses without pore water pressures are about 10%higher than those obtained from the two-dimensionalanalyses. Thus, the two-dimensional analyses wereconservative, as expected, due to the absence of endconstraints. More importantly, the three-dimensional
1098

analyses show that pore water pressures had a sig-nificant effect on stability. When the peak interfacestrength is used with pore water pressures. the factorof safety is slightly higher than I (1.06). indicatingthat peak strengths were probably operative duringthe slide. Two-dimensional analyses using peakstrengths and pore water pressures yielded factors ofsafety between 0.81 to 0.86, which are too small torepresent the failure condition.
Analyses based on full-residual strengths may beoverly conservative.
- Lesson 4 - The effect of pore water pressuresmust be carefully considered when evaluating thestability of containment facilities constructed be-low the ground water table (so called "zone ofsaturation" facilities). Ground water modelingappears to be a reasonable means to predict porewater pressures acting on clay-geomembrane in-terfaces.
2.2 Proper construction
A good design only performs well if it is properlyconstructed. The following example illustrates howlack of construction monitoring led to failure.
The case history involves excessive leakage fromtwo lagoons at a production plant in the southeasternUnited States. The facility employed three lagoonsin series (Q, R. and Z) to store excess make-up waterat the plant. Water entered the first lagoon (Q) via apipeline from the plant, flowed to lagoons R and Zvia spillways, and was retrieved from the last lagoon(Z) via a reclaim pipe. The water depth typically was2-3 m. The water was lightly contaminated, but forpractical purpose was no different from the local tapwater. Inorganic analyses on the lagoon watershowed the following metals concentrations: Na -60.0 mg/L, K - 7.8 mg/L, Ca - 25.4 mg/L,Mg - 17.6mg/L, AI - 0.2 mg/L.
The lagoons were lined with a geosynthetic clayliner (GCL) placed on a prepared sandy subgrade.The GCL consisted of granular bentonite encasedbetween two geotextiles that were needle-punchedtogether. A geomembrane was heat bonded to oneside of the GCL. The GCL was installed with thegeomembrane down, as recommended by the manu-facturer. A layer of gravel )OO-mm thick was placedon top of the GCL to protect it from wave action.Tests conducted on the gravel showed that its cal-cium carbonate content was less than 0.6%.
Shortly after the lagoons were put in service, wa-ter use records at the plant indicated unacceptablylarge losses of water. To determine if the losses weredue to leakage from the lagoons, water level moni-toring was conducted when the plant was shut down.The rust monitoring event consisted simply of ob-serving the location of the water level at the edge ofthe lagoon in the evening and the following morn-ing. A drop in elevation of approximately 300 mmwas observed in Lagoons R and Z. The elevation ofLagoon Q appeared to remain unchanged.
Based on this observation, more rigorous meas-urements were made by installing pressure transduc-ers in the bottom of each lagoon. The measurementsconfirmed that leakage from Lagoon Q was negligi-ble, whereas appreciable leakage was occurring fromLagoons R and Z. Leakage rates computed from thetransducer measurements are summarized in Table 1.
Figure 7. Factor of safety &om three dimensional slope stabil.ity analyses with and without pore water pressures at the clay.geomembrane interface.
2.1.4 Lessons learnedThere are four lessons to be learned from this fail-ure. The first two are practical lessons that apply togeotechnical practice in general. The other two arespecific to waste containment systems.- Lesson I - Careful testing and analysis should
always be conducted before construction to iden-tify deficiencies in a design.
- Lesson 2 - Strategies to accrue cost savings mustbe analyzed carefully to ensure that the construc-tion savings achieved through design changeswill not have unforeseen negative impacts. Theconstruction savings at this site (-US $IO/m2)were very small compared to the cost of reme-diating the failure (-US $250/m2).
- Lesson 3 - Two dimensional slope stabilityanalyses provide conservative factors of safetyfor internal slopes cells that are long and narrow.However, for more complicated geometries, athree-dimensional analysis may be warranted.Analyses based on peak strengths appear to bereasonable, and analyses based on large-displacement strengths should be conservative.
1099

Table I. Summary of Leakage Rates.
Method Leaka~e Rate in L/m~-dLagoon R La~oon Z
Transducer 16.6 11.9Computed from '-
laboratory & field 18.1 16.4data - no bentonitein overl~Computed fromlaboratory & field 10.3 --data - 50% ben-tonite in overlapsComputed fromlaboratory & field 2.6 2.5data - 100% ben-tonite in overlapsAnticipated based 1.4 1.3on literature
2.2.1 Field investigationA forensic investigation was undertaken to deter-mine why Lagoons Rand Z were leaking exces- Figure 8. An overlap uncovered in Lagoon Z.sively. Lagoons Rand Z were drained, and the re-claim line from Lagoon Z was moved to Lagoon Q, GCL panels. Methods described in ASTM D 5093which remained in service. The stone was removed were followed for the SDRI tests. Overlap tests wereby hand over areas 1 m x 1 m so that the GCL could conducted in a GCL flowbox, as described in Danielbe inspected. In some sections only visual observa- et al. (1997). The flowboxes were set-up so that thetions were made, whereas in other sections a square tests resembled the field condition as closely assample of the GCL (approximately 1 m x 1 m) was practical.cut from the panel using a razor knife. The sample Two overlap tests were conducted, one withoutwas slid onto a thick polyethylene sheet (to prevent supplemental bentonite and the other with 100% ofbending) and was sealed with plastic to prevent des- the overlap containing supplemental bentonite, Aftericcation. the flowbox tests were completed, dye was added to
Observations in Lagoon Z showed that none of ' the influent to stain the flow paths. Inspection of the
the overlaps between the GCL panels contained the GCLs during disassembly of the flowboxes showedsupplemental fillet of bentonite recommended by the that dye was present only in the overlapped area ofmanufacturer (Fig. 8). The interface between the the GCL, indicating that flow was primarily passing,panels was clean, free water was present, and the through the overlap.appearance suggested that water was readily flowing Leakage rates for the panels (determined with thethrough the overlaps. Subgrade beneath the GCL SDRIs) ranged from 0.9 to 1.8 Um2-d for the hy-was wet, but not soft. Additionally, bentonite from draulic gradient existing when the ponds were filled.the lower GCL appeared to have piped in the direc- Leakage rates for the overlaps are shown in Fig. 9 astion of seepage (Fig. 8). Small punctures caused by a function of the hydraulic gradient. The leakage raterocks in the sub grade were occasionally evident, but is non-linearly related to the hydraulic gradient. Asthey were filled with swollen bentonite as has been the hydraulic gradient increases, seepage forces tendreported in laboratory studies (i.e., Shan and Daniel to, open the seam'slightly, allowing more water to1991, Estomell and Daniel 1992). pass through the overlap.
Observations of the GCL in Lagoon R were simi- Leakage rates estimated from the field and labo-lar to those in Lagoon Z, except a portion of the ratory tests are summarized in Table 1. The leakageoverlaps contained the recommended supplemental rates measured in the field with the transducer arebentonite. Approximately 25-50% of the overlap comparable to those computed using the laboratorylength in Lagoon R contained supplemental ben- data. The computed leakage rates for Lagoon R, atonite. Much less free water was present in the over- portion of which contained overlaps with supple-laps containing bentonite. mental bentonite, are higher because the total over-
lap length in Lagoon R was more than two times lar-2.2.2 Field and laboratory tests ger than that for Lagoon Z. '
Field and laboratory tests were conducted to deter-mine leakage rates for the GCLs. Field tests were 2.2.3 Source of the problemconducted using sealed double-ring infiltrometers Comparison of the leakage rates in Table 1 leaves no(SDRIs) to determine the in-place leakage rate of the doubt that the absence of bentonite in the seams was
1100

responsible for the higher than anticipated leakagerates. However, the more important question is: Whydid the contractor fail to place supplemental ben-tonite in the overlaps during construction? Thisquestion was answered through review of the con-tractor's records and interviews with constructionpersonnel that were present during the installation.The answer was simple: the contractor ran out ofgranular bentonite for the seams during constructionof Lagoon R, and could not expediently obtain addi-tional bentonite. As a result, the bentonite was leftout. Careful construction monitoring by the engi-neer-of-record or a designee would have preventedthis problem from occurring. In short, the lessonlearned is that construction oversight is essential toensure proper construction of containment facilities.
2.3 Environmental Compatibility
Environmental compatibility means that a design iscompatible with its setting. Issues that need to beconsidered include geological conditions, operatingconditions, climate, and the liquids to be contained.The following case histories illustrate how climaticconditions must be considered when evaluating en-vironmental compatibility.
2.3.1 Wet-drycyclingofGCLsGCLs are often perceived as being more resistant todamage caused by desiccation than compacted clays.However, recent field studies indicate that desicca-tion can have a detrimental impact on the hydraulicconductivity of GCLs. Studies by Melchior (1997),James et al. (1997), and Lin and Benson (2000) indi-cate that exchange of divalent cations present innatural pore waters for sodium in the exchangecomplex of the bentonite ultimately results in thebentonite being unable to swell sufficiently to closecracks that form during desiccation. As a result,
GCLs that are exposed to wet-dry cycling fail in thelong tenn unless cation exchange can be prevented.
Although there are critics who contend that GCLsin covers that are overlain by at least 0.75 m ofoverburden will not be damaged by wet-dry cycling(e.g., EglofIstein 2001), case histories of failures dueto wet-dry cycling continue to accumulate. The fol-lowing is an example where this phenomenon oc-curred in a cover over a fly ash landfill in south-western Wisconsin, USA. A cross-section of thecover is shown in Fig. 10.
Failure of the GCL was detected because theagency regulating the site required the owner to in-stall two lysimeters (BLI and BL2) beneath theGCL to monitor the percolation rate. Percolationcollected in the two lysimeters is shown in Fig. II.Excessive percolation was first noticed during thespring thaws of 1997. The GCL was exhumed inJune 1997, and inspected to determine a cause forthe excessive leakage rates. The inspection sug-gested that thinning of the GCL due to pressure ap-plied by gravel in the lysimeter was the cause for thefailure. The exchange complex of the bentonite wasnot examined. A layer of sand was added to thelysimeter above the gravel as a cushion, a new GCLwas installed, and the surface layers were replaced.
Percolation monitoring continued after thelysimeters were re-built in 1997. Approximately 15months after re-construction, the leakage rate be-came excessive again (Fig. 11). Monitoring contin-ued until October 1999, when one of the lysimeters(BL2) was exhumed to inspect the GCL. Monitoringof the other lysimeter (BLl) has continued to thepresent. The leakage rate for lysimeter BLI has beenrelatively steady since the last quarter of 1998, andhas averaged 211 mm/yr. Under unit gradient condi-tions, this leakage rate corresponds to a hydraulicconductivity of 6. 7x 1 0-9 mls.
Inspection of the GCL exhumed from directlyover lysimeter BL2 revealed that the bentonite wasdry and cracked, as shown in Fig. 12. No thinningdue to uneven pressure applied by the underlyingsoil was observed. GCL samples were also collectedoutside the lysimeter. These samples were moremoist, and cracked less than those inside the lysime-ter. This observation led to concern that the lysime-
.. . .., Protective Layer (600 mm)' .GCL~t; ,t; ;t.,
Silty Base LaYer (600 mm)f.' .' . t !. !-
Figure 10. Cross-section of cover in southwestern Wisconsinwhere GCL failed due to desiccation.Figure 9. Leakage rates measured on overlaps using flowboxes.
1101

--e--Original BL1 average effective confining stress of 12 kPa. No- -. - - Original BL2 backpressure was used to simulate the field condi-- Rebuild ~L 1 tion. The confining stress was selected to replicate
-:= ~~~ ~:~i1dBB~ the stress applied by the overburden ~oil.s. Synthetic800 ,percolate was used as the permeant lIquId. The per-
~ : : : 9: 2000 : 2001 colate was created using meltwater nom snow (the~ 700:: :: predominant source of spring recharge in Wiscon-~ 600: : sin) collected in polyethylene buckets left outdoors~ 500: : during snowfalls. The meltwater was then passed~ 400: : through specimens of overburden soil using flexible-~ : : wall permeameters. Inorganic analyses on the perco-~ 300 : 1st ' late showed the following metals concentrations: Na~ 200 : Re-build : - 8.6 mg/L, K - 4.0 mgiL, Ca - 67.7 m'if/L, Mg -<3 100 : ,.1 : 19.4 mgiL, Al:- 0.02 mg/L. Also shown m Table 1~ .4 ..+ : are free swell measurements made on bentonite nom
500 0 the samples. ASTM D 5890 was followed for theElapsed Time (days) swell tests, using synthetic percolate as the hydrating
liquid.Figure 11. Cumulative perco~ati°n. recor~ed by lysimeters i?- The hydraulic conductivities in Table 2 varystalled beneath GCL test sectIons In cap In southwestern WIS- within a broad range. The new GCL (i.e., never bur-consin, USA. ied) had a hydraulic conductivity of IxIO-IO mls
(specimen 5N in Table 2), which is higher than istypically reported for GCLs, even under modest con-fmement. An additional test on a specimen of newGCL with deionized water as the permeant liquidyielded a hydraulic conductivity of 4x 1 0-11 mis,which is comparable to that reported by others (e.g.,Shackelford et al. 2000, Jo et al. 2001, Egloffstein2001). The higher hydraulic conductivity of the newGCL is likely due to the divalent nature of the syn-thetic percolate.
Table 2. Hydraulic conductivity of GCL samples (new materialand exhumed GCL).
ill Location Hydraulic Free SwellConductivi!.Y...(m/~ (mL/~
SN New GCL IxlO.'v 26Figure 12. Photograph of bentonite in GCL exhumed from in II Inside 2xIO.' 6cap in southwestern Wisconsin, USA. 21 Inside IxIO"v ~ 7
30 Outside IxIO.' 7ter was causing damage that would not normally 40 Outside IxlO - 7have occurred. However, a more detailed analysis ofthe site showed that these differences were caus.ed The two tests on GCL specimens nom within theby differences in the texture of the overburden soils lysimeter yielded hydraulic conductivities that wereinside and outside the lysimeter. Soil inside the as low as that for the new GCL as well as 2000lysimeter was coarser, which promoted better vege- times more permeable than the new GCL. A similartative growth inside t~e lysimeter,.greater root water range of hydraulic conductivities was o~tained f~ruptake, and more .drying of t~e soil and GCL .(Th.or- specimens nom outside the GCL, but neIther specI-stad 2002). DespIte these dIfferences, examInatIon men was as impervious as the new GCL. The geo-of the hydraulic conducti,:,i~ and exchange compl.ex metric mean hydraulic conductivity of all fou~ GCLof the GCL showed that sImilar damage occurred m- samples retrieved nom the field is 6.8xI0- mis,side and outside the boundaries of the lysimeter. which is remarkably similar to the hydraulic conduc-
Hydraulic ,conductivities mea~ured in flexible- tivity computed nom the leakage rate nom lysimeterwall permeameters on specimens (150-mm- BLI. The very small difference between these fielddiameter) prepared nom new GCL .and ?n samples and laboratory-measured hydraulic conductivities isexhumed nom the cap are summarIzed m Table 2. probably coincidence. Nevertheless; their similarityMethods in ASTM D 5084 were followed. ~e hy- suggests that the high leakage rate observed in thedraulic conductivity tests were conducted WIthout field is due to the high hydraulic conductivity of thebackpressure using a hydraulic gradient of 10 and an
1102
I

GCL, and that the leakage rate is likely to be high conductivity of 5xlO-8 cm/s (Albrecht and Bensoninside and outside the lysimeter. 2002).
Composition of the exchange complex of the ben- Water balance data from the test section aretonite is summarized in Table 3. Bentonite from the shown in Fig. 13. Approximately 10 months afternew GCL is dominated by sodium. In contrast, ben- construction (September-October 2000), a periodtonite from the GCL exhumed from the cap is nearly with little precipitation persisted for approximatelydevoid of sodium, and is dominated by calcium and six weeks. puring this period, the cover desiccatedmagnesium. That is, nearly complete exchange oc- as evinced by the monotonic decrease in soil watercuffed within two years of installation. The domi- storage during this period. Prior to this period, thenance of divalent ions is also reflected in the free cover transmitted percolation at rate of approxi-swell measurements (Table 2). Swelling of the ben- mately 50 mm/yr. Afterwards the percolation ratetonite diminished greatly (from 26 to approximately was approximately 500 mm/yr. Inspection of the6- 7 mL/2g), regardless of whether the GCL was in- clay barrier after i~ desiccated showed that the bar-side or outside the lysimeter. These free swell values rier contained desiccation cracks. These cracksin Table 2 are comparable to the free swell of cal- served as preferential flow paths, causing the largecium bentonite (Jo et al. 2001). increases in percolation rate that were measured.
Table 3. Exchange complex ofGCL samples (new material and 1000 250exhumed GCL).
It=:Cations on Exchange § 800 ~ill Location ComDlex (mea/l00~) Ix:- E 200 ~Na K Ca M~ § E ~.-~600 ~
5N New GCL 56.7 0.4 3.6 4.4 ~ § c;,II Inside 1.7 0.8 21.3 12.7 .g-~ 150 Q21 Inside 1.9 0.9 26.4 7.4 £ ~ 400 ~30 Outside 1.8 1.0 22.0 11.5 ~ ~ i40 Outside 1.8 1.7 23.6 14.0 ~ ~ 00 3"S 2 ~
EWhen lysimeter BL2 was exhumed in October 8 .,..'- - ...~ I 1999, it was re-built using a new GCL that contained 0 ..' . 50
a thin (0.5 mm) polyethylene geomembrane heat ~ ~ ~ ~ Q Q., ~ ~ ~ ~ ~ ~
bonded to one sIde. The remamder of the GCL was 1ij C -g- ~ 1ij cidentical to the product that was originally installed. ~.o; (I) 0 ~ .0;
This GCL was installed with the geomembranedown, as recommended by the manufacturer. The ~igure 13. Water balance quantities from instrumented clay capoverburden soils removed during exhumation were In southeastern USA.
replaced after the new GCL was installed. Very little Alb ht d B (2002) 1 d 'b thleakage from the new GCL has been recorded during . .rec an ens?n. . a so escn e .e
the two years of monitoring since installation. The conditIon of.a clay barner.m a nme-year-old cover maverage leakage rate has been 2.4 mm/yr, which cor- t~e upper m1dwestern ~rnted States'. The cover con-responds to a hydraulic conductivity of 1.3xlO-11 m/s slsted of a.600-mm-th1ck la):'er of lean .compactedunder unit gradient conditions. clay overlam by a .150-mm-th1ck sand dramage layer
and a 460-mm-th1ck vegetated surface layer. Nu-2 3 2 TZ}' t dry t . .J" /, b . merous small cracks with fine aperture were ob-
.. 1'1' e - cyc mg OJ c ay arrlers d . h 1 d . . T bl kData from the USEPA's Alternative Cover Assess- serve m t e c ay ~nng an excavatIon. wo ocment Pr gram (ACAP) .d th 1 f samples (150-mm-d1ameter) were collected from the
0 prov1 e ano er examp eo. .'d . .' clay barner. One block, WhICh contamed numerous
amage caused by wet-dry cycl1ng, but m thIS case k h d h d 1. d t . .ty f 2 10-7 m/h 1.d .. crac s, a a y rau 1C con uc 1V1 0 X s.
t e cover re Ie on a compacted clay barner mstead Th th bl k ta . d k d h d hf ., .' e 0 er oc con me no crac s an a a y-o a GCL. A test sectIon contammg a lys1meter, me- . . . -10'"teorological instruments, water content probes, and draul1c conductIvIty ~f lxl0 f?I~' w~lch IS comp~- ,
matn' c potent1' al ens tru t d . th rable to the hydraul1c conductIvIty m the as-bUIlts ors was cons c e m sou - d' t '
t G . t . 1 t h 1 . d con 1 Ion.wes em eorg1a 0 Slmu a e t e c ay cover reqmreby the Georgia Environmental Protection Agency 2 3 3 L /. dc 1 f 1. d h d .t Th t . . esson earneLor c osure 0 un me azar ous waste Sl es. e op Th 1 bid fr th h' t . .deck of the test section is 30 m x 20 m in areal ex- . e esson ~o e eame om .ese c~e IS one~ IStent, and the lysimeter is 20 m x 10 m in areal ex- ~lmpl~; desIgns r.nust be compatIble wIth th.e settmgtent. The cover consists of 460 mm of compacted m WhICh they wIll ~e con~tructed.. T~e desIgn mustclay overlain by a vegetated erosion layer 150-mm n~t only be compatlble wIth. the l1qm~~ to be con-thick. The clay had an as-built saturated h draulic ~med, but also the geo~oglcal con~ltlonS, .ope~-
y tlonal methods, and the cl1mate. Despite the slmpl1c-
1103

ity of this lesson, engineers often fail to ensure that adesign is compatible. Unsatisfactory perfomlanceoften results, and complete failure sometimes oc-curs.
3 GROUND WATER CUT-OFF WALLS
Ground water cut-off walls are used in a variety ofcontainment applications. Their most commongeoenvironmental use in the United States is to pro-vide lateral containment of plumes emanating fromold unlined landfills. This 'prescriptive remedy' isapplied at a majority of old landfill sites undergoingremediation. Cut-off walls are also used to improvethe performance of pump and treat systems, to divertground water around contaminant sources, and tofocus ground water towards a gate in a permeablereactive barrier.
A variety of materials are used for ground watercut-off walls, including soil-bentonite (SB) mixtures,cement-bentonite (CB) mixtures, geomembranes,and grouted sheet piles. SB and CB mixtures are byfar the most common, and are the focus of discus-sion in this section. The case histories to be dis-cussed deal with three key factors affecting the suc-cess of ground water cut-off walls: (i) the key, (ii)p~oper construction methods, and (iii) testing tech-mques.
3.1 Keys
The key is often considered the most critical aspectof ground water cut-off walls. Even the most imper-vious wall material will be ineffective if the wallJ isimproperly keyed into the underlying confining unit.
A modeling study on the importance of keys wasconducted by Tachavises (1998). A schematic of oneof Tachavises' 3-D models is shown in Fig. 14. Ahorizontal wall having a breadth (W SB) of 500 m andthickness of I m was placed in the center of a per-meable 40-m-thick aquifer (hydraulic conductivity,KA = 104 mls) underlain by a tiFt confining unit(hydraulic conductivity, Kc = 10-1 mls) 30-m thick.The regional gradient (iREG) in the aquifer was as-sumed to be 0.001 and the hydraulic conductivity ofthe wall backfill (KsB) was assumed to be 10-9 mls.The domain was made 3000-m wide and 1500-mlong to prevent the boundaries from influencing thesolution.
Tachavises evaluated a scenario where only aportion of the wall was not keyed, forming a gap be-tween the bottom of the wall and the top of the con-f"ming unit. The gap was assumed to be filled withaquifer material. Gaps of different widths (W G) andheights (La) were evaluated. Results for this sce-nario are summarized in Fig. 15 in tenns of wall ef-fectiveness (Ew). Wall Effectiveness (Ew) is definedas the ground water flow rate through the portion ofthe aquifer containing the wall before the wall wasplaced (QAQW) divided by the ground water flow ratepast the wall (QAQW); i.e., Ew = QAQW/Qw. Wallsthat are more effective have higher values of wall ef-fectiveness. Walls that have no impact on groundwater flow have an effectiveness of 1.0. For the sce-nario that was simulated, the effectiveness was 100for a fully keyed wall (no gap). That is, ground wa-ter flow within the breadth of the wall is reduced bya factor of 100.
Wall effectiveness is shown in Fig. 15 as a func-tion of the thickness of the gap (La) and the ratio ofthe width of the gap relative to the width of the wall(w dW SB)' The effectiveness is sensitive to absenceof a key. Even if the bottom of the wall is very close,but not keyed into the confining unit, the wall can bepractically ineffective. For example, a 50-mm gapbetween the bottom of the wall and the top of theconfining unit can reduce the effectiveness from 100to nearly 2. Even narrow zones that are poorly keyedcan reduce the effectiveness of a cut-off wall. In par-ticular, missing keys will reduce effectiveness ap-preciably, unless the un-keyed region comprises lessthan 0.1% of the wall, and the gap between the baseof the wall and the confining unit is very narrow.
Despite analyses such as those reported byTachavises (1998), poor keys are a common problemafflicting ground water cut-off walls. The followingcase history provides an example. A SB cut-off wallwas installed in the western United States to isolate alagoon from surrounding ground water. The lagoonand wall were installed in alluvium consisting ofsands and gravels overlain with a thin fine-grainedsurface layer. The wall, which had a thickness of 0.6m and backfill with a hydraulic conductivity of 5x I 0-9mis, was constructed along the perimeter (1.9 km) of
Groundwater passing throughaquifer and around wall
Groundwater focusing on the wall
Cut-off wall
-- ~/ "'~~:~i1~~::--~ -
--~ ---,t40'f1-30Y
rot .~--'-
Figure 14. Schematic of 3-D model used by Tachavises (1998)to evaluate the effect of keys on the effectiveness of groundwater cut-offwalls.
1104

~
v
1 000 ~ WM -- were conducted, and drilling was perfornled to de-~~~ ..-w.. -0 ~ fine the vertical extent of the wall. Undisturbed
~~-i=JJ~.I8]tI~ I~m samples of the underlying rock were also collected~ ~~~ ~~~J~m for hydraulic c°.n~uctivity testing. Results of the hy-
0 100 --::::' = = - - -;:;::::-- draulic conductIvIty tests showed that the hydraulic) - -1 , ':":::: ~ ~ conductivity of the sandstone was approximately
C; La (m) I .. ,0.225,', "" 2xl0-6 mis, whereas that of the claystone was ap-.Ii 10 - , ,'0:~2~ "'a proximately 3xl0-II mls.
, -'::-::::, 0.05 Results of the forensic investigation pointed at theKA : 10~1r:vs KsB_= 10-9m/s ' ,:::-::;:;:~ key as the source of leakage. A cross-section ob-:<c : ~oo~/S Ko - KA , '-:.:: -:: tained from the drilling program is shown in Fig. 16.
1 REG This cross-section is typical of the condition of the0.01 0.1 1 10 100 wall. Most of the, bottom of the wall rests in the
W~SB (%) pernleable sandstone or alluvium, rather than in the
F. 15 W 11 ffi . fun , f . f th relatively impervious claystone. Analysis of the en-19ure . a e ectlveness as action 0 size 0 e gap. . d obetween the base of the wall and the top of the confining unit tire cr,?ss-sectIon showe that 48 Yo of wall was not
(from Tachavises 1998). keyed mto the claystone. Based on the curves shownin Fig. 15, excessive leakage rates should be antici-
the lagoon. Specifications for the project required that pated for this wall. For l.(. = 1 m and W G/W SB ;:::the bottom of the wall be keyed 1 m into the underly- 50%, the wall effectiveness should be approximatelying bedrock, which is comprised of interbedded 1.3.highly plastic claystone and sandstone. The lagoon Further investigation revealed two reasons for thewas constructed by excavating the alluvium down to absence of a key. First, no borings were made priorthe underlying rock. The thickness of the alluvium to construction to define the depth of the claystone.ranged from 7 to 10 m. The depth was estimated based on previou~ experi-
After the lagoon was completed and the dewater- ence in the region. Second, there was little on-siteing system was removed, excessive le~kage became inspection. The engineer-of-record was only on-sitereadily apparent. A pumping test was conducted to during the first day of construction. During this sitedetermine the rate of seepage past the wall. A vari- visit, the engineer provided the ba,ckhoe operatorable-speed pump was installed in the lagoon and the with a description of the appearance of the bedrock.pumping rate was adjusted until the pump discharge Regular depth measurements were made in thewas sufficient to maintain a constant water level in slurry-filled trench by a technician. However, no on-the lagoon. The leakage rate was deternlined to be site inspection was conducted by an engineer or the1000 m3/d, or approximately 0.06 m3/d/m2-wall. For engineer-of-record after the first day of construction.unit gradient conditions, this flow rate correspondsto a hydraulic conductivity more than 100 times the 3.2 Construction specifications and procedures
hydraulic co.nd~ctivit':f o~ the backfill. Definitive field-scale performance testing of cut-offA. forenSIC mvestIgatIon was. undertaken to .de- walls is challenging,' if not impossible. A variety of
~rnlme the sourc~ of the exce~s~ve leakage: PaIred methods have been tried, but in many cases the ac-pIezometers were mstalled, addItional pumpmg tests curacy of the test is inadequate to establish whether
E EE '
.E 'N":~ ~~<to-1-0",M +
~ 5
60GW, !:
z0;::
555 <>w
;.:
SANDSTON50
CLAYSTONE,SILTY-CLAYSTONE
45
Figure 16. Cross-section showing stratigraphy and location of bottom of trench along the alignment of the cut-off wall.
1105

15% because of the sandy materials in which thewall was being constructed. In some regions, thesand content reached as high as 41 % despite warn-ings by the engineer-of-record that the constructionprocess was unacceptable. Because the sand contentwas excessive, the engineer-of-record was con-cerned that the wall might contain permeable win-dows. Thus, before certifying the wall, a drillingprogram was conducted to characterize conditions inthe as-built wall.
The drilling program indicated that windowswere prevalent in regions where the sand content ex-ceeded 20%. In three of the four borings, windowsmore than I-m deep were found. Some of the win-dows were near the key (indicative of sand settlingto the bottom of the trench), whereas others weredispersed throughout the depth of the wall (indica-tive of sand-rich slurry or material sloughed from asidewall mixing with the backfill). Samples retrievedfrom the windows appeared more like coarse sandand pea gravel soaked with slurry than a well-mixedand well-graded SB backfill. Hydraulic conductivitytests conducted on samples retrieved from the wallshowed that the hydraulic conductivity ranged be-tween 2xl0-IO and 2xl0-6 mls.
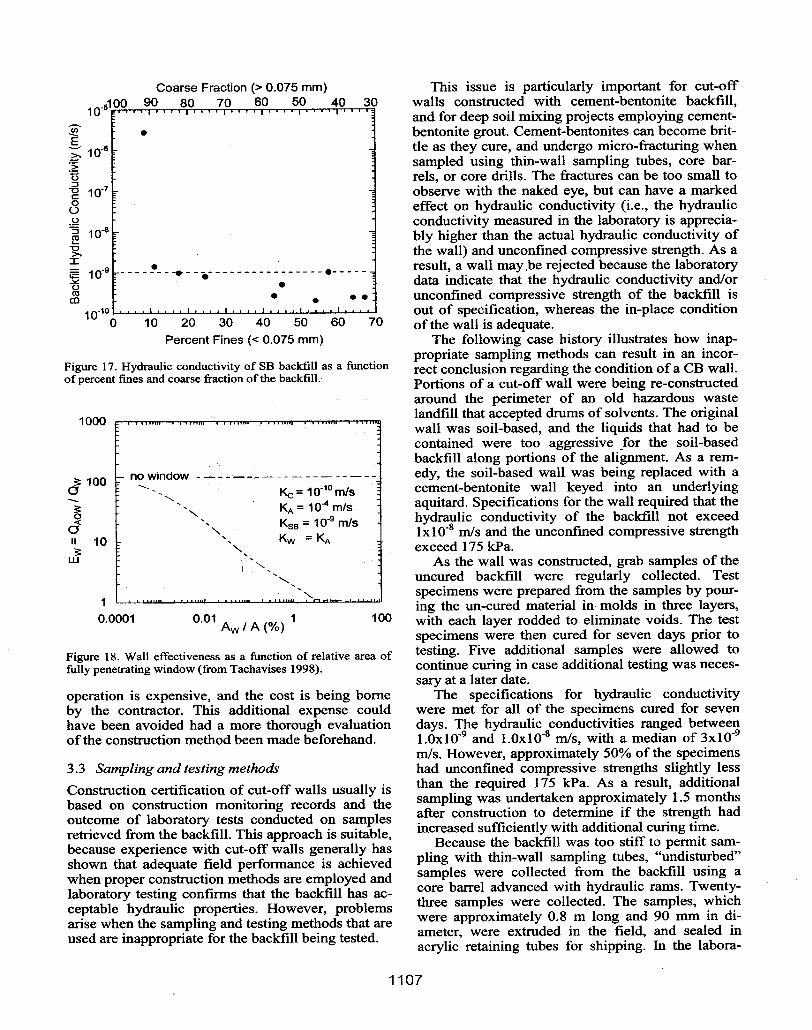
Hydraulic conductivity of the backf"1l1 is shown inFig. 17 as a function of percent fines and percentcoarse fraction. Provided the fines content is greaterthan 20% (or the coarse fraction is less than 80%),the 10-9 mls requirement is met. The ~cimens withhydraulic conductivity exceeding 10. mls were ob-tained from the sections where the sand content washighest. These specimens appeared very coarse, al-though in most cases the bentonite slurry in thepores was adequate to maintain hydraulic conductiv-ity near 10.9 mls. The data in Fig. 17 also confirmthe validity of the common rule-of-thumb that a SBbackfill mixture should contain at least 300/0 fines tomeet a target hydraulic conductivity of 10-9 m/s (Ev-ans 1994). All specimens with fines content> 30%had hydraulic conductivity:::; 1 x 1 0-9 m/s
While the frequency of very permeable windowsmay have been small, even a few permeable win-dows can dominate the hydraulic performance of acut-off wall. In his modeling study, Tachavises(1998) evaluated how windows influence the effec-tiveness of cut-off walls using the same modelingapproach described in Sec. 3.1. Wall effectiveness isshown in Fig. 18 as a function of the area of the win-dow (Aw) relative to the cross-sectional area of thewall (A). Even very small windows can h~ve asignificant impact on wall effectiveness. And, ifwindows comprise more than 1 % of the area of thewall, the cut-off wall is rendered ineffective alto-gether.
Because windows were detected, the engineer hasrefused to certify the wall. The contractor has agreedto repair the wall by blending the backfill in situ us-ing a deep soil mixing procedure (DSM). The DSM
a wall meets a perfonnance criterion. For example,ground water pump tests have been attempted, butill-detmed boundary conditions and hydraulic prop-erties of the underlying aquitard generally result inlarge uncertainty in the field measured hydraulicconductivity or flow rate past the wall. Paired pie-zometers are also used Unfortunately, the likelihoodof placing piezometer tips close enough to detectsuch defects is extremely small (Tachavises 1998).Moreover, even small defects (e.g., small windowscaused by sloughing, entrapped slurry, or depositionof coarse material) can have a dramatic effect on thefield perfonnance of cut-off walls (Tachavises andBenson 1997), and detection becomes more difficultas the size of the defect decreases.
Because of these shortcomings, construction ofsatisfactory cut-off walls depends largely on twofactors: (i) adequacy of the construction specifica-tions and (ii) ensuring the contractor complies withthe specifications during construction. Adequatespecifications are nonnally based on data from amix-design program conducted in the laboratory andindustry experience that has identified those factorshaving a significant effect on the characteristics ofcut-off walls (see Evans 1994). When deviationsfrom specifications occur, significant problems canbe expected. The following case history providessuch an example.
A SB cut-off wall was being constructed in themidwestem United States to isolate a contaminantplume emanating from an old unlined landfill. Thesubsurface consisted of approximately I m of fine-grained top soil, underlain by IS m of coarse-grainedmaterial (sands and silty sands), and a 10-m-thickclay till aquitard. The wall was constructed usingconventional methods; i.e., a slurry-filled trench wasexcavated with a backhoe equipped with a long-stickboom. The bottom of the wall was keyed at least I minto the aquitard. Backfill was mixed adjacent to thetrench using spoils from the excavation. Perfonn-ance criteria required that the SB backfill have hy-draulic conductivity no greater than Ix10-9 m/s.
A mix design was developed in the laboratory forthe slurry and the backfill. Results of the laboratorytests indicated that slurry prepared with local riverwater would require at least 4% bentonite, and that2% additional dry bentonite should be added in themixing area to ensure the backfill had hydraulicconductivity ~ Ix10-9 m/s. In addition, the m~ de-sign required that the fines content (percentage finerthan 75 J.1m) of the backfill be at least 30%, and thatthe sand content of the slurry be maintained less than15%. The intent of the limitation on sand contentwas to minimize settling of sand from the slurry.Sand from the slurry could fonD penneable win-dows, or become mixed with the backfill, renderingthe fines content too low.
Despite use of de-sanding equipment, the contrac-tor was unable to maintain the sand content below
1106
Coarse Fraction (> 0.075 mm) This issue is particularly important for cut-off10-5100 walls constructed with cement-bentonite backfill,
- and for deep soil mixing projects employing cement-~ . bentonite grout. Cement-bentonites can become brit-~ 10.6 tIe as they cure, and undergo micro-fracturing when:~ sampled using thin-wall sampling tubes, core bar--:g rels, or core drills. The fractures can be too small to-g 10-7 observe with the naked eye, but can have a marked<3 effect on hydraulic conductivity (i.e., the hydraulic,g -8 conductivity measured in the laboratory is apprecia-~ 10 bly higher than the actual hydraulic conductivity of~ the wall) and unconfine?compressive strength. As a== 10-9 - - - - --- - -- - - - - -. - - - - - - -. - - - - -.- - - - - result, a wall may,be rejected because the laboratory~ .. data indicate that the hydraulic conductivity and/or~ . . . . unconfined compressive strength of the backfill is
10-10 out of specification, whereas the in-place condition0 10 20 30 40 50 60 70 of the wall is adequate.
Percent Fines « 0.075 mm) The following case history illustrates how inap-. " . . propriate sampling methods can result in an incor-
Figure 17. Hydraulic conductlv~ty of SB backfill as a function rect conclusion regarding the condition of a CB wall.of percent fines and coarse fraction of the backfilL P rt . f ff 11 b . d0 Ions 0 a cut-o wa were emg re-constructe
around the perimeter of an old hazardous waste1000 landfill that accepted drums of solvents. The original
wall was soil-based, and the liquids that had to becontained were too aggressive for the soil-basedbackfill along portions of the alignment. As a rem-
5: 100 no window - - -.- -'- - - - - - - - - - - - - edy, the soil-based wall was being replaced with a0 --- Kc= 10-1om/s cement-bentonite wall keyed into an underlying~ "-', K = 10-4 m/s aquitard. Specifications for the wall required that the~ '" KA = 10-9 m/s hydraulic conductivity of the backfill not exceed~ 10 '-', K:B = KA lxlO-s mls and the unconfined compressive strength5:' exceed 175 kPa.w '
i '" As the wall was constructed, grab samples of the',,- uncured backfill were regularly collected. Test
1 ", specimens were prepared from the samples by pour-ing the un-cured material in molds in three layers,
0.0001 0.01 A / A (%) 1 100 with each layer rodded to eliminate voids. The testW specimens were then cured for seven days prior to
Figure 18. Wall effectiveness as a function of relative area of testing. Five additional samples were allowed tofully penetrating window (from Tachavises 1998). continue curing in case additional testing was neces-
sary at a later date.operation is expensive, and the cost is being borne The specifications for hydraulic conductivityby the contractor. This additional expense could were met for all of the specimens cured for sevenhave been avoided had a more thorough evaluation days. The hydraulic conductivities ranged betweenof the construction method been made beforehand. 1.Ox10-9 and 1.0x10-s mis, with a median of 3x10⁻⁹
mls. However, approximately 50% of the specimens3.3 Sampling and testing methods had unconfined compressive strengths slightly lessConstruction certification of cut-off walls usually is than t~e required 175 kPa. As ~ result, additionalbased on construction monitoring records and the samplIng was undertaken approxImately 1.5 monthsoutcome of laboratory tests conducted on samples ~fter constructi?n to d~termin.e. if the s.tren~h hadretrieved from the backfill. This approach is suitable, Increased sufficIently wIth addlu°n.al cunng u~e.because experience with cut-off walls generally has . Beca';1se th.e backfill wa~ too suff t? pe~It sam;;shown that adequate field performance is achieved plIng wIth thIn-wall samplmg tubes, undls~bedwhen proper construction methods are employed and samples were collected. from the. backfill usmg alaboratory testing conIlnns that the backfill has ac- core barrel advanced wIth hydraulIc rams. Twen~-ceptable hydraulic properties. However, problems three sample.s were collected. The samples, v:'hIC~arise when the sampling and testing methods that are were approxImately 0.8.m long and 90 rom m rl.l-used are inappropriate for the backfill being tested ameter, were extruded m the field, and sealed m. acrylic retaining tubes for shipping. In the labora-
1107
I

ties, and the changes in strength. As the materialcured, it became stronger and more brittle. As a re-sult, more fractures tended to form, causing the hy-draulic conductivity to increase and the unconfinedcompressive strength to decrease.
Testing of the five additional specimens preparedfrom un-cured material 3.5 months after constructionprovided additional evidence supporting this conclu-sion. The hydraulic conductivity of these sfecimensranged between 5.0xlO-IO m/s and 6.OxlO-1 m/s (ap-proximately five times lower than that of the seven-day specimens), and all had unconfined compressivestrength exceeding 175 kPa (the median unconfinedcompressive strength was 730 kPa). The high uncon-fined compressive strength of these specimens alsoexplains the apparent increase in strength observedin the first set of post-construction test specimens,relative to those tested after seven days of curing.The first set of post-construction specimens was col-lected approximately 45 days after construction, andby this time more than 900/0 of the strength gainthrough curing was probably achieved. As a result,the unconfined compressive strength in situ probablyexceeded 650 kPa, but disturbance during samplingprobably caused an appreciable underestimate of thein situ strength (the median unconfined strengthmeasured in the laboratory was 340 kPa).
3.4 Lessonslearned
There are three lessons to be learned from these casehistories.- Lesson I - Adequate geological characterization
is essential prior to construction of ground watercut-off walls. Depth to the aquitard along thealignment should be defined by drilling on 30 mcenters. During construction, depth of the trenchshould be carefully monitored by the engineer-of-record, or the engineer's designee, and comparedwith the depth to the surface of the aquitard re-ported in the drilling logs. Continuous visual in-spection should also be conducted to ensure thatthe excavator is adequately penetrating the aqui-tard.
- Lesson 2 - Construction of SB and CB cut-offwalls is as much an art as it is a science. Satisfac-tory field performance can only be achieved ifmethods consistent with experience known toyield satisfactory walls are followed, and con-structions specifications are closely followed.Particular attention must be placed on usingmethods and following specifications that areknown to minimize the likelihood of permeablewindows. Efforts should be made prior to con-struction to ensure that the methods to be usedwill result in backfill free of permeable defects.
- Lesson 3 - Testing methods must be used thatyield properties representative of field conditions.When laboratory tests are conducted, sampling
tory, unconfined compression and hydraulic conduc-tivity tests were conducted on specimens trimmedfrom the samples. During trimming, the technicianreported that the specimens were brittle, and ap-peared to contain a variety of very rme fractures.
Results of the unconfined compression testsshowed that more than 90% of the specimens metthe 175-kPa requirement, and that 16 of the speci-mens had unconfined compressive strengths between400 and 500 kPa. The median unconfined compres-sive strength was 340 kPa. However, the hydraulicconductivities were found to be much higher thanthose measured on specimens prepared during con-struction from uncured material. The hydraulic con-ductivities were as high as 5.0xl0-7 mis, and had amedian of 1.8xl0-7 mls. This unexpected findinglead to questions regarding the hydraulic conductiv-ity of the in-place backfill, and an additional roundof testing one month later (i.e., 2.5 months after con-struction).
Thirteen "undisturbed" samples were obtainedduring the second round of sampling. As with thefirst round, sampling was conducted using a corebarrel advanced with hydraulic rams, the sampleswere extruded in the field, and hydraulic conductiv-ity and unconfined compression tests were con-ducted in the laboratory. Results of the tests on thesecond round of samples were startling. The hydrau-lic conductivities were nearly an order of magnitudehigher than those measured on the fIrst set of "undis-turbed" post-construction specimens. The maximumhydraulic conductivity was 8.Oxl0-6 mis, and themedian was 3.1xl0-6 mls. Additionally, 70% of theunconrmed compressive strengths did not meet the175-kPa requirement, and only two specimens hadunconfined compressive strengths appreciablyhigher than 175 kPa.
Test pits were excavated in the backfill as a con-sequence of the unexpected rmdings from the secondround of tests. The purpose was to determine if thebackfill had heterogeneities, defects, or other charac-teristics that might explain the excessively high hy-draulic conductivities, and the odd changes instrength.
No unusual conditions were observed in the testpits. Occasional nodules of anomalous material werefound, but all of the backfill appeared nearly identi-cal to the specimens prepared during constructionusing un-cured material. No unmixed or permeable-looking material was found. However, the backfillwas stiff and brittle, and fractured into pieces as theexcavator bucket penetrated. Inspection of the exca-vated bulk material indicated that it contained nu-merous very fine fractures apparently formed by theshear forces exerted during excavation.
Observations made in the test pits combined withthose reported by the laboratory technician sug-gested that disturbance of the specimens was a likelycause of the anomalously high hydraulic conductivi-
1108

methods must be used that minimize disturbanceand do not alter the properties to be measured.
4 PERMEABLE REACTIVE BARRIERS
USA (Laase et al. 2000). The PRB was installed inan alluvial aquifer to intercept a plume containingtrichloroethylene (TCE). Data ftom a hydrogeologi-cal study were used as input to a ground watermodel used to select the orientation and breadth ofthe PRB. The breadth was to be sufficiently large tocapture the entire width of the plume. An extensiveset of monitoring wells (12 upgradient, 16 down-gradient, and 10 adjacent to the ends of the PRB)was installed to monitoring influent and effluentconditions, and to check for bypassing.
Data from the monitoring program showed thatthe wall was not functioning as intended. While thereaction mechanisms appear to have been accountedfor properly, a sandy gravel region towards thesouthern end of wall was not detected during hydro-geological characterization, and caused a portion ofthe plume to bypass the PRB, as shown in Fig. 20. Inaddition, reversals in the hydraulic gradient duringrecharge events have caused the southerly extent ofthe plume to curl northward and, at times, flowbackward through the PRB. Bypassing is occurringalong the northern end of the PRB as well.
Few PRBs have been monitored as closely as thePRB in Kansas City. Thus, the frequency of prob-lems caused by heterogeneity is unknown. However,
Penneable reactive barriers (PRBs) are one of themost innovative and promising remediation tech-nologies for sites with persistent sources of groundwater contaminants. PRBs function using a processthat is simple conceptually. A trench down-gradientof a ground water plume is filled with permeablematerial that reacts with the contaminants as theground water passes through the trench (Fig. 19).The reactive materials and the geometry of thetrench are selected so that residence time within thetrench is sufficient to reduce contaminants to accept-able levels at the effiuent end. Typically the effiuentis required to meet mandated maximum contaminantlevels (MCLs). By treating the water before it is dis-charged, PRBs "contain" the source and plumewithin a defmed region. Consequently, PRBs' are acontainment technology.
A key advantage of PRBs relative to other reme-diation strategies is that no energy is required afterconstruction, and limited maintenance must be per-fonned. In addition, all of the remediation processoccurs underground. Thus, the surfac~ of a site isavailable for re-development. Because of these ad-vantages, numerous field trials have been initiated,and several full-scale walls have been constructed.The potential advantages of PRBs have also resultedin a wealth of research on the te(;hnology. Most ofthe research has focused on reaction mechanismsand by-products. In contrast. little effort has beenplaced on understanding how geological heterogene-ity and fouling by geochemical processes may affectthe field-scale perfonnance of PRBs. These issuesmay ultimately be more important than subtleties inthe reaction mechanisms.
4.1 Geological heterogeneity
The importance of geological heterogeneities andthe need for characterization is illustrated in a recentcase study of a PRB constructed near Kansas City,
Figure 20. Schematic of plume by-passing southern end ofPRB installed near Kansas City, USA (adapted from Laase etaI. 2000).
Figure 19. Schematic of penneable reactive barrier for in situ passive remediation of contaminated ground water.
1109
T

The heterogeneous aquifers developed by Elder(2000) were used. Typical results from Mergener'sstudy are shown in Fig. 22. The fouled porosity (nr)in Fig. 22 is defined as the volume of void spacefilled with precipitates per unit volume of PRB. Theinitial porosity of the PRB was 0.6.
The fouled porosity is non-uniform. Fouling islargest near the influent face of the PRB, but variesfrom a very small fraction of the pore space (essen-tially zero) to more than 20% of the pore space (i.e.,nr = 0.13). The greatest degree of fouling occurs inregions where the flow rates are highest. These re-gions correspond to preferential flow paths causedby heterogeneities in the aquifer. The impacts offouling on flow and effectiveness of PRBs are cur-rently being studied by Lin Li at the University ofWisconsin-Madison.
4.3 Lessons learned
Many lessons are likely to be learned about field-scale performance of PRBs in the next decade.However. current studies indicate that site charac-terization and fouling are equally as important as re-action mechanisms in terms of their effects on fieldscale performance of PRBs.
a recent modeling study by Elder et al. (200 1, 2002)suggests that geological heterogeneity may be hav-ing a much larger impact on the effectiveness ofPRBs than previously thought. Elder et al. (2001,2002) constructed a series of heterogeneous aquiferscontaining PRBs, and simulated flow and transportthrough the aquifer and PRB. Because a model wasused, effluent concentrations were characterized infar greater detail than is possible in the field, evenwith a dense network of monitoring wells.
Typical results reported by Elder et al. (2001,2002) are shown in Fig. 21. The simulation con-sisted of a source of TCE having a uniform concen-tration of 1 000 ~g/L located 20 m upgradient of thePRB (i.e., the PRB was used to isolate or contain asource). By the time the plume reaches the PRB,dispersion induced by aquifer heterogeneities causesthe TCE concentration to range from 0.1 to 1000~g/L. As ground water flows through the wall, theTCE concentration decreases, but not always belowthe target level (5 ~g/L). In fact, the effluent concen-tration is as high as 500 ~g/L in some locations.These high concentrations are due to preferentialflow through the wall as a result of heterogeneity inthe adjacent aquifer materials.
Elder et al. (2001) assessed whether the range ineffluent concentrations, as well as the peak effluentconcentrations, could be detected using typicalmonitoring schemes used for PRBs. Most monitor-jng schemes were found to be too sparse to capturemost of the variabiljty, and effluent concentratjonsdetected by typical systems were found to under-estimate peak effluent concentratjons by an order ofmagnitude of more.
5 SUMMARY
This paper has reviewed ten case histories wherecontainment systems did not perform satisfactorily,or failed completely. Ten lessons from these casehistories are presented so as to prevent similar prob-lems in the future. The problems encountered ineach of the case histories could have been avoidedby greater attention to detail and basic principles.None were caused by inadequate technology or the-ory.
ACKNOWLEDGMENTS
Support for Dr. Benson's research on environmentalgeotechnics has been provided by a number of spon-sors including the US National Science Foundation,the US Environmental Protection Agency, the Statesof Colorado and Wisconsin, Waste Management,Inc., Browning-Ferris Industries, Inc., Republic Ser-vices, Inc., EQ, Inc., and the National Council of thePulp and Paper Industry for Air and Stream Im-provement. This support is gratefully acknowledged.A number of people provided information or assistedin preparation of this paper. Special thanks go toTuncer Edil, Ho Young Jo, Tarek Abichou, TanitChalermyanont, and Lin Li. Some of the individualswho provided information preferred to remainanonymous. You know who you are, and I appreci-ate your assistance.
4.2 Fouling
Fouling by precipitates has significant potential toaffect the field perfonnance of PRBs. Fouling maycause blockage of pores, and corresponding changesin the hydraulic conductivity of the PRB and the dis-tribution of residence times. As a result, fouling hasbecome an important issue in PRB research.
Only limited infonnation is available on foulingprocesses occurring at field scale. McMahon et at.(1999) report porosity losses on the order of 0.03 peryear for a PRB installed at the Denver Federal Cen-ter in Denver, Colorado, USA and Gu et al. (2002)report that the pore space in some regions of a PRBat the Oak Ridge National Laboratory (Tennessee,USA) have become completely filled with precipi-tates. However, a detailed field assessment of the ef-fects of fouling has yet to be conducted.
Mergener (2002) conducted a modeling study toassess the potential long-tenD effects of clogging byprecipitates. A three-dimensional model of flow,transport, and geochemical reactions was developed.The model was then used to evaluate the spatial dis-tribution of fouling in PRBs set in realistic aquifers.
1110

a) Source Concentrotions
10
I 8
c 6
..g 4>Q) 2W
05 10 15 25 30 35 40 45
Lateral Distance (m)
b) Influent Concentrations10
I 8
c 60
:,:; 40>Q)
W
Lateral Distance (m);
c) Effluent Concen ations10
I .c:
.9;
0 ;> Boundory-,,"
.!? of PRB ;w
35 40 45
Lateral Distance (m)
TCE Concentration (lJog!L)
0 -0 '=' a ~ '='a a a a .- ({) - - ({) ~ 0 a
Figure 21. Schematic of permeable reactive barrier for in situ passive remediation of contaminated ground water (adapted fromElder 2000).
0
:§:c
.210>II>
W
.j'
Fouled Porosity After 1 0 Yeaffi
,;dcl~-0.00 0.03 0.07 0.10 0.13
Figure 22. Spatial distribution of fouled porosity in a PRB after 10 years of service (adapted from Mergener 2002).
1111
I

REFERENCES Jo, H., Katsumi, T., Benson, C., and Edil, T. (2001), Hydraulicconductivity and swelling of non-prehydrated GCLs per-meated with single species salt solutions, J. of Geotechnicaland Geoenvironmental Engineering, 127(7), 557-567.
Koerner, R and Soong. T. (2000), Stability assessment of tenlarge landfill failures, Advances in Transportation andGeoenvironmental Systems Using Geosynthetics, J. Zom-berg and B. Christopher, eds., GSP No. 103, ASCE, Reston,VA. USA. 1-38.
Laase, A., Korte, N., Baker, J., Dieckmann, P., Vogan, J., andFocht, R (2000), Evaluation of the Kansas City plant ironwall, Chemical Oxidation and Reactive Barriers, Remedia-tion of Chlorinated and Recalcitrant Compounds, G. Wick-ramanayake et al., eds., BatteUe Press, Columbus, OH,USA. 417-424.
LiD, L. and Benson, C. (2000), Effect of wet-dry cycling onswelling and hydraulic conductivity of geosynthetic clayliners. J. of Geotechnical and Geoenvironmental Engineer-ing, 126(1),40-49.
McMahon, P., Dennehy, K., Sandstrom, M. (1999), Hydraulicconductivity and geochemical performance of a permeablereactive barrier containing zero-valent iron, Denver FederalCenter, Ground Water, 37, 396-404.
Melchior, S. (1997), In situ studies on the performance of land-fill caps, Proc. Inti Containment Technology Con/, USDept. of Energy, Germantown, Maryland, USA, 365-373.
Mergener, E. (2002), Assessing geochemical fouling ofperme-able reactive barriers in heterogeneous aquifers, MS Thesis,University of Wisconsin-Madison.
Seed, R, Mitchell, J., and Seek, H. (1990). Kettleman Hillswaste landfill slope failure. II: stability analysis, J. Geo-technical Engineering, 116(4),669-689.
Shackelford, C., Benson, C., Katsumi, T., Edil, T., and Lin, L.(2000), Evaluating the hydraulic conductivity of GCLspermeated with non-standard liquids, Geotextiles and Ge-omembranes, 18(2-3), 133-161.
Stark, T., Eid, H., Evans, W., and Sherry, P. (2000), Municipalsolid waste slope failure. II: stability analyses, J. of Geo-technical and Geoenvironmental Engineering, 126(5),408-419
Stark, T. and Poeppel, A. (1994). Landfill liner interface shearstrengths from torsional ring shear tests. J. GeotechnicalEngineering, 120(3),597-615.
Tachavises, C. (1998), Flow rates past vertical cut-off walls:influential factors and their impact on wan selection, PbDdissertation, University of Wisconsin-Madison.
Tachavises, C. and Benson, C. (1997), Hydraulic importance ofdefects in vertical groundwater cutoff walls, In Situ Reme-diation of the Geoenvironment, GSP No. 71, J. Evans, ed.,ASCE, Reston, VA. USA. 168-180.
Thorstad, P. (2002), Failure of a geosynthetic clay liner in alandfill cap, MS Thesis, University of Wisconsin-Madison.
Albrecht, B. and Benson, C. (2002), Closure to discussions of"Effect of Desiccation on Compacted Natural Clays," J. ofGeotechnical and Geoenvironmental Engineering, 128(4),356-360.
Benson, C. (2001), Waste containment: strategies and perform-ance, Australian Geomechanics, 36(4), 1-25.
Camacho, L. (2002), Stability analysis of the Metro Landfillfailure using three-dimensional slope stability methods, MSThesis, University of Wisconsin-Madison.
Daniel, D., Trautwein, S., and Goswami, P. (1997), Measure-ment of hydraulic properties of GCLs usmg a flow box,Testing and Acceptance Criteria for Geosynthetic Clay Lin-ers, STP 1308, L. Well, Ed., ASTM, 196-207.
Egloffstein, T. (2001), Natural bentonites-influence of the ionexchange and partial desiccation on permeability and self-healing capacity of bentonites used in GCLs, Geotextilesand Geomembranes, 19,427-444.
Elder, C. (2000), Evaluation and design of permeable reactivebarriers amidst heterogeneity, Pill Dissertation, Universityof Wisconsin - Madison.
Elder, C., Benson, C., and Eykholt, G. (2001), Economic andperformance based design of monitoring systems for PRBs,Proc. 2001 International Containment and RemediationTechnology Conference and Exhibition, Institute for Inter-national Cooperative Environmental Research, FloridaState University, Tallahassee, FL, USA, 1-5.
Elder, C., Benson, C., and Eykholt, G. (2002), Effects of het-erogeneity on influent and effluent concentrations fromhorizontal permeable reactive barriers, Water ResourcesResearch, in press.
Evans, J. (1994), Hydraulic conductivity of vertical cutoffwalls, Hydraulic Conductivity and Waste ContaminantTransport in Soils, STP 1142, D. Daniel and S. Trautwein,eds., ASTM, 79-94.
Gu, B., Watson, D., Phillips, D., and Liang, L. (2002), Biogeo-chemical, mineralogical, and hydrological characteristics ofan iron reactive barrier used for treatment of uranium andnitrate, Groundwater Remediation of Trace Metals, Ra-dionuclides, and Nutrients with Permeable Reactive Barri-ers, D. Naftz et al., eds., Academic Press, New York, inpress.
Hungr, O. (2001), User's manual, Clara-W slope stabilityanalysis in two and three dimensions for microcomputers,O. Hungr Geotechnical Research Inc., Vancouver, BC,Canada.
James, A., Fullerton, D., and Drake, R. (1997), Field perform-ance of geosynthetic clay liner under ion exchange condi-tions, J. of Geotechnical and Geoenvironmental Engineer-ing, 123(10),897-901.
Klein, S., Beckman, W., and Meyers, G. (2001), FEHT Version7.155, F-Chart Software, Middleton, WI. USA.
1112