lulc solution nie 2011
DESCRIPTION
solution_2TRANSCRIPT

Journal of Hydrology 407 (2011) 105–114
Contents lists available at ScienceDirect
Journal of Hydrology
journal homepage: www.elsevier .com/ locate / jhydrol
Assessing impacts of Landuse and Landcover changes on hydrologyfor the upper San Pedro watershed
Wenming Nie ⇑, Yongping Yuan, William Kepner, Maliha S. Nash, Michael Jackson, Caroline EricksonUSEPA NERL, Landscape Ecology Branch, Environmental Sciences Division, 944 East Harmon Avenue, Las Vegas, Nevada 89119, USA
a r t i c l e i n f o
Article history:Received 3 September 2010Received in revised form 4 May 2011Accepted 13 July 2011Available online 23 July 2011This manuscript was handled by PhilippeBaveye, Editor-in-Chief
Keywords:Landuse and LandcoverSWATMultiple regression analysisUrbanizationMesquiteSan Pedro River
0022-1694/$ - see front matter � 2011 Elsevier B.V. Adoi:10.1016/j.jhydrol.2011.07.012
⇑ Corresponding author. Tel.: +1 702 622 1245.E-mail address: [email protected] (W. Nie).
s u m m a r y
The assessment of Landuse and Landcover (LULC) changes on hydrology is essential for the developmentof sustainable water resource strategies. Specifically, understanding how change in each LULC class influ-ences hydrological components will greatly improve predictability of hydrological consequences to LULCchanges and thus can help stakeholders make better decisions. However, given the limited availability ofdigital LULC maps and simultaneous changes of multiple LULC classes, it is difficult to quantify impacts ofchange in individual LULC class on hydrology. In this study, an integrated approach of hydrological mod-eling and multiple regression analysis was applied to quantify contributions of changes for individualLULC classes on changes in hydrological components. As a case study, hydrological modeling was con-ducted for each of the LULC map in four time periods (1973, 1986, 1992, and 1997) in the upper San Pedrowatershed using the Soil and Water Assessment Tool (SWAT). Changes in hydrological componentsbetween two simulations using LULC maps in 1997 and 1973, respectively, were related to changes ofLULC in a multiple regression to quantify the effect of changes in LULC to that of hydrological componentsat the subbasinal scale. While urbanization was the strongest contributor to the increase of surface runoffand water yield from 1973 to 1997, replacement of desertscrub/grassland by mesquite was the strongestcontributor to the decreased baseflow/percolation and contributed to the increased ET. Increased runoff,declined percolation, and increased ET have a negative impact on water resources in the upper San PedroRiver Basin, thus urbanization and mesquite invasion seems to be major environmental stressors affect-ing local water resources. Our approach in quantifying the contributions of changes for individual LULC tohydrological components will provide quantitative information for stakeholders in planning and makingdecisions for land and water resource management. The approach to assess changes in surface hydrologycould widely be applied to a variety of other watersheds, where time-sequenced digital LULC is available.
� 2011 Elsevier B.V. All rights reserved.
1. Introduction
Assessing impacts of Landuse and Landcover (LULC) changes onhydrology is the basis for watershed management and ecologicalrestoration. The assessment usually includes evaluation of spatialpatterns of hydrological consequences to different LULC maps,comparison of basinal values of simulated hydrological compo-nents to LULC changes at the basinal scale, and examination oftemporal responses in channel discharge with changes in LULC(e.g. Miller et al., 2002; Liu et al., 2008a,b; Hernandez et al.,2000; Ghaffari et al., 2009; Franczyk and Changk, 2009; Moham-med et al., 2009). However, most studies do not quantify contribu-tions of change for individual LULC to different hydrologicalresponses. Without accurate quantification, the impacts of changesfor some LULC classes on hydrologic components may be exagger-ated or understated, or even misinterpreted. In this study, an inte-
ll rights reserved.
gration approach of hydrological modeling and multiple regressionanalysis was applied in the upper San Pedro watershed (US/Mex-ico) to quantify contribution of changes for individual LULC onchanges in hydrological components.
In the upper San Pedro watershed, major LULC changes in theperiod from 1973 to 1997 include declines of grassland and desert-scrub, and major increases in mesquite woodland and urban area(Kepner et al., 2002). An increase of annual runoff, flashier flood re-sponse, and decreased water quality due to sediment loading sim-ulated in the watershed was attributed to simultaneous changes ofseveral LULC classes as described above (Miller et al., 2002). How-ever, how changes in each LULC class influence changes of eachhydrological component is still unknown. The answer to this ques-tion will improve predictability of hydrological consequences toLULC changes and thus is crucial for future LULC and/or water re-source planning and management.
Objectives of this study include: (1) calibrate and validate theSWAT model in terms of streamflow for three USGS gages in theupper San Pedro watershed; (2) evaluate impacts of LULC changes

106 W. Nie et al. / Journal of Hydrology 407 (2011) 105–114
on hydrology at the basinal scale; (3) quantify the contribution ofchanges in LULCs to changes of major hydrological components atthe subbasinal scale.
2. Study site
The upper San Pedro Watershed originates in Sonora, Mexicoand flows north into southeastern Arizona, USA (Fig. 1). In thisstudy, the investigation area is composed of the upper San PedroBasin and a part of the lower San Pedro Basin to the RedingtonUSGS gage (Fig. 1). For convenience, the entire study area is re-ferred as ‘‘upper San Pedro’’ in the text.
The upper San Pedro Watershed has an area of about 7400 km2,and lies between latitude 30�540 and 32�300N and longitude�110�480 to �109�450W. Elevations in the basin range from 900to 2900 m, and annual rainfall from 300 to 750 mm. The LULC clas-ses include woodland (oak and mesquite), desertscrub, grassland,forest, riparian, agriculture crops, urban, water, and barren (Kepneret al., 2000). Most soils in the San Pedro watershed are gravelly,medium and moderately coarse-textured (USDA). They are nearlylevel to very steep soils on dissected alluvial fan surfaces. Majorsoil series include Sierravista (Loamy-skeletal, mixed, superactive,thermic Petronodic Calciargids), Diaspar (Coarse–loamy, mixed,superactive, thermic Ustic Haplargids), Libby (Fine, mixed, super-active, thermic Petronodic Ustic Paleargids), and Forrest (Fine,mixed, superactive, thermic Ustic Calciargids). These soils are char-
Fig. 1. Locations of municipal areas, USGS monitoring gages, and weather stations a
acterized as well-drained soils with moderately high to high per-meability. Major municipal areas along the San Pedro River fromsouth to north are Cananea (Mexico), Hereford, Sierra Vista, Ft.Huachuca, Charleston, Tombstone, St. David, Benson, and Reding-ton (Fig. 1).
3. Methods
The method we used is divided into two parts: (1) hydrologicalmodeling to simulate hydrological components for each of theLULC map in four time periods (1973, 1986, 1992, and 1997); (2)performing multiple regression analysis to determine the contribu-tion of changes in LULC classes on change of hydrologicalcomponents.
3.1. Hydrological modeling
3.1.1. Model descriptionThe Soil and Water Assessment Tool (SWAT) 2005 (Neitsch
et al., 2005) was applied in the upper San Pedro watershed to as-sess impacts of LULC changes on hydrological components. TheSWAT model is a continuous, long-term, physically based distrib-uted model developed to assess impacts of climate and land man-agement on hydrological components, sediment loading, andpollution transport in watersheds (Arnold et al., 1998). In theSWAT model, a watershed is divided into subwatersheds or subba-
nd cities in the upper San Pedro watershed (modified from Kepner et al., 2002).

W. Nie et al. / Journal of Hydrology 407 (2011) 105–114 107
sins. Subbasins are further divided into a series of uniform hydro-logical response units (HRUs) based on soil and LULC. Hydrologicalcomponents, sediment yield, and nutrient cycles are simulated foreach HRU and then aggregated for the subbasins.
Hydrological components simulated in the SWAT model includeevapotranspiration (ET), surface runoff, percolation, lateral flow,groundwater flow (return flow), transmission losses, and ponds(Arnold et al., 1998). Evaporation and transpiration are simulatedseparately: evaporation is computed using exponential functionsof soil depth and water content and transpiration is estimatedusing a linear function of potential evapotranspiration (PET) andleaf area index. Three methods used to estimate PET include: Har-greaves et al. (1985), Priestlr and Taylor (1972), and Monteith(1965). The Pennman–Monteith method was used to calculatePET in this study. The surface runoff is estimated using a modifica-tion of the SCS (Soil Conservation Service, now the Natural Re-sources Conservation Resource) curve number method (USDA,1972) with daily rainfall amounts. The curve number values arebased on soil type, LULC, and land management conditions (Ralli-son and Miller, 1981) and are adjusted according to soil moistureconditions (Arnold et al., 1993). Percolation is calculated usingthe combination of a storage routing technique and a crack-flowmodel (Arnold et al., 1998). The lateral flow is estimated simulta-neously with percolation using a kinematic storage model (Solanet al., 1983). The groundwater flow (baseflow) into the channel iscalculated based on hydraulic conductivity of shallow aquifer, dis-tance from subbasin to main channel, and water table height (Hoo-ghoudt, 1940).
3.1.2. Model inputsThe input data used in the SWAT model includes a digital eleva-
tion model (DEM), soil data, digital Landuse and Landcover (LULC)maps, and climate data. The DEM was derived from the USGS Na-tional Elevation Dataset (NED, Gesch et al., 2002; Gesch, 2007)with a resolution of 1 arc-second (about 30 m), and the soil datawas from the State Soil Geographic (STATSGO) Database (NRCS).The LULC data for four time periods (1973, 1986, 1992, and1997) used to assess the impact of LULC change on hydrology,was from the North American Landscape Characterization (NALC)project (Landsat Multi-Spectral Scanner) and Landsat ThematicMapper (USEPA, 1993; Kepner et al., 2003; Skirvin et al., 2004).The LULC maps in years1992 and 1997 were covered by 1.4% and2.2% clouds, respectively (Kepner et al., 2002). Clouds in of 1992LULC map were overlain by LULC in 1986, and clouds in 1997 werereplaced by 1992. The impact of this replacement on hydrologicalsimulation could be ignored because clouds were mainly distrib-uted in non-urban areas where vegetation changes were not signif-icant from 1986 to 1997. The climate data, including daily values ofprecipitation and minimum–maximum temperature in the periodfrom January 1960 to April 2008, were derived from 12 meteoro-logical stations located in the upper San Pedro watershed. The
Table 1Description, default and optimal values that used in the model calibration/validation (⁄, thfollowing the ‘‘⁄’’).
Parameter Default Description
Adjf_latq 1 Adjust factor for lateral flowCN2 30–92 SCS runoff curve number for mESCO 0.950 Soil evaporation compensationSOL_AWC 0.01–0.19 Available water capacity of thAlpha_BF 0.048 Baseflow recession constantGW_Revap 0.02 Revaporation coefficientRevapmn 1.0 Threshold water level in shallGWQMN 0.0 Threshold water level in shall
missing records of precipitation and temperature were interpo-lated by the method proposed by Di Luzio et al. (2008).
3.1.3. Model calibration and validationSimulations set up using 1992 LULC map were used to calibrate
annual streamflow from 1991 to 1995 at two USGS gages (Reding-ton and Charleston, Fig. 1). After model calibration, simulations setup using 1997 LULC map were used to validate annual streamflowfrom 1996 to 2000 at two stations (Charleston and Tombstone,Fig. 1).The model was calibrated manually and three criteria wereused to evaluate performance of model calibration/validation.
3.1.3.1. Manual calibration processes. Surface runoff and baseflowwere calibrated separately. The simulated and observed stream-flow in three observation gages was separated into surface runoffand baseflow by Baseflow Filter (Arnold and Allen, 1999). Simula-tions were calibrated to match with observations for: (1) propor-tional extent of baseflow, and (2) annual streamflow.
Different parameter values were applied for the upper- anddown-stream reaches of the San Pedro watershed in model calibra-tion and validation, because the proportional extent of baseflow inupperstream (i.e. Gages Charleston and Tombstone) was muchhigher than that of downstream (i.e. Gage Redington). The upper-stream (subbasin 48–116) is from Mexico to Tombstone and thedownstream (subbasin 1–47) is from Tombstone to Redington.The areas for the upper and lower streams are 4311 and3093 km2, respectively.
The model was calibrated by manually editing sensitive param-eters for hydrological components (surface runoff, baseflow, lateralflow, and ET). In this study, we assume that lateral flow is equal tozero, because no obviously impervious layers in soil profiles (pre-requirement for the generation of lateral flow, such as shales) wereidentified in the upper San Pedro watershed. The lateral flow waserased by setting the adjust factor for later flow into 0.02 in SWATsource code. The surface runoff was calibrated by editing CN2 (SCSrunoff curve number for moisture condition II). The baseflow wascalibrated by enhancing ET and Revap, the water removed fromcapillary fringe by evaporation or from shallow aquifer by deep-root uptake (Neitsch et al., 2005). The sensitive parameters for ETwere ESCO (soil evaporation compensation factor) and SOL_AWC(available water capacity of the soil layer) and sensitive parametersfor Revap and baseflow were GW_REVAP (re-evaporation coeffi-cient), REVAPMN (threshold water level in shallow aquifer for re-vap), GWQMN (threshold water level in shallow aquifer forbaseflow) and ALPHA_BF (baseflow recession constant). The AL-PHA_BF values were estimated by Baseflow Filter for the upperand down streams (Arnold and Allen 1999). The rest of parameterswere manually estimated. The optimal values for SWAT calibrationwere listed in Table 1.
3.1.3.2. Performance evaluation criteria. Three criteria were used toevaluate the model’s performance on calibration and validation:
e multiple sign, means the default values of parameter are multiplied by the number
Optimal value
Subbasin 1–47 48–116
0.02 0.02oisture condition II ⁄0.87 ⁄0.83factor 0.050 0.050
e soil layer ⁄1.4 ⁄1.40.0852 0.01670.20 0.20
ow aquifer for revap 0.0 0.0ow aquifer for baseflow 20.0 25.0
108 W. Nie et al. / Journal of Hydrology 407 (2011) 105–114
Nash-Sutcliff (NS) coefficient, coefficient of determination (R2), andpercent bias (PBIAS). The R2 was estimated as:
R2 ¼Pn
i¼1ðQ obsi � Q obsaveÞðQ simi � Q simaveÞ½Pn
i¼1ðQ obsi � Q obsaveÞ2Pn
i¼1ðQ simi � QsimaveÞ2�0:5
( )2
ð1Þ
where n is the number of number of events, Qsimi and Qobsi the sim-ulated and observed runoff at event i, Qsimavg and Qobsavg the averagesimulated and observed runoff over the validation period. The NScoefficient was calculated following Nash and Sutcliffe, (1970) andGupta et al., (1999) as:
NS ¼ 1�
PniðQsimi � Q obsiÞ2
PniðQ obsi � QavgÞ2
2664
3775 ð2Þ
where n is the number of time steps, Qsimi and Qobsi the simulatedand observed streamflow at time step i, and Qavg the average ob-served streamflow over the simulation period. PBIAS was calculatedbased on equation 3:
PBIAS ¼
Pni¼1ðYobs
i � Ysimi Þ � ð100Þ
Pni¼1ðYobs
i Þ
2664
3775 ð3Þ
where Yobsi and Ysim
i are observed and simulated streamflow at timestep i.
The calibration/validation performance for SWAT model is con-sidered acceptable when R2 and NS are greater than 0.5 (Moriasiet al., 2007). The SWAT model performance is satisfied when NSis larger than 0.5, adequate when NS ranges from 0.54 to 0.65,and very good when NS is larger than 0.65 (Moriasi et al., 2007).When the absolute value of PBIAS ranges from 15 to 25, the SWATmodel is rated as satisfactory, rated good when from 10 to 15, andvery good when smaller than 10 (Moriasi et al., 2007).
3.1.4. Model applicationTo assess the impacts of LULC changes on surface water avail-
ability, the calibrated model was run for each of the LULC maps(1973, 1986, 1992, and 1997) with constant DEM and soil datafrom January 1960 to April 2008 (48.3 years). The simulated resultswere used to evaluate impacts of LULC changes on change in sur-face water hydrology at the basinal scale and to quantify contribu-tion of changes for individual LULC classes on changes ofhydrological components at the subbasinal scale.
3.2. Multiple regression analysis
Before regression analyses, pair-wise correlations between vari-ables were computed (Proc Corr, SAS� 9.2) to assess the relation-ship between variables. Changes in hydrological componentsbetween two simulations using LULC maps in 1997 and 1973,respectively, were related to changes of LULC in a multiple regres-sion to quantify the effect of changes in LULC to that of hydrolog-ical components at the subbasinal scale. Independent variables arethe changes for five LULC classes (i.e. Urban, Mesquite, Grassland,Desertscrub, and Agriculture). Dependent variables (responses)are changes for five hydrological components (i.e. Surface Runoff,Baseflow, Water Yield, Percolation, and Evapotranspiration). Multi-ple regression analyses with stepwise selection (Proc Reg, SAS�
9.2) were carried on. Initially one global regression line was fit tothe data where all sites (subbasins) are included. Diagnostic check-ing of the residuals using the qq plot indicated that the model wasnot linear and two regression lines seem to fit the data better than
one global regression line. Hence, sites were grouped into two anda regression model was fit to each group. Diagnostic checking ofresiduals was carried on each of ten models to observe normality,outliers, clustering and trend before finalizing models. Residualswere randomly fluctuated around the horizontal ‘‘0’’ value andwith Shapiro–Wilk normality test larger than 0.974 and p largerthan 0.052. Pair-wise correlation values for the retained variablesin the stepwise regression model were all below the cutoff value(<0.5) based on sample size (Nash and Bradford, 2001, pg 8). Thisgrouping stems from the combined effects of many LULC classeson hydrological components, which are explained in the followingresults section.
4. Results and discussion
The calibration/validation and simulation results are presentedin this section. Impacts of LULC changes on change of surface waterhydrology at the basinal scale are discussed and quantification re-sults of contributions of changes in five LULCs on change of hydro-logical components at the subbasinal scale are reported.
4.1. Calibration results
The proportional extent of baseflow (ratio of total base flowover total streamflow) for the simulated and observed streamfloware 26% and 25% at the Charleston gage, and are 17% and 18% at theRedington gage in the period from 1991 to 1995 (estimated in thesecond pass by Baseflow Filter, Arnold and Allen, 1999). The goodmatch indicates that the partitioning between surface runoff andbaseflow can be represented by the calibrated model.
The comparison between simulated and observed annualstreamflow values in the periods of calibration (1991/01–1995/12) and validation (1996/01–2000/12) is shown in Fig. 2. A goodmatch can be seen between simulated and observed values. TheNS and R2 values for the annual calibration and validation arelisted in Table 2. All NS and R2 values are above 0.5, and PBIASare in the range of �15% (most PBIAS are in the range of ±10%),suggesting satisfactory model performance (Moriasi et al., 2007).Although the overall performance of the model is satisfactory asshown in Table 2, a large difference was observed for the year of1992 at Redington and 1999 at both Redington and Charleston.Intuitively, the simulated values seem more reasonable for theyear of 1992 at Redington and 1999 at both Redington andCharleston because of the rainfall patterns as shown in Fig. 2. Otherpossible reasons are due to the limitation of curve number method.For example, the SCS-curve number method used in SWAT modeldoes not consider the duration and intensity of precipitation. Inthe upper San Pedro Watershed, rainfall events were mainly com-posed of high-intensity, short-duration, limited-areal extent sum-mer thunderstorms (Simanton et al., 1996). Using averaged dailyrainfall depths as SWAT inputs will lead to uncertainty in stream-flow simulation. In addition, study shows that curve numbermethod overestimates runoff for large rainfall events and underes-timates runoff small rainfall events for watersheds with retentionbeing a large fraction of the rainfall, such as arid and semiaridwatersheds in Arizona (Hjelmfelt, 1980). The limitation of curvenumber method in this area is addressed more by another ongoingstudy, results of which are going to be submitted to a journalarticle. Overall, the good match between simulation and observa-tion, as well as high NS, R2, and low absolute values for PBIASindicates that yearly streamflow can be described by the calibratedmodel. Thus, the SWAT models set up by the optimal parameterswere applied to evaluate hydrological consequences to LULCchanges.

0
100
200
300
400
500
600
700
8000
5
10
15
20
25
30
1991 1992 1993 1994 1995 1996 1997 1998 1999 2000
Ann
ual P
reci
pita
tion
mm
Ann
ual S
trea
mfl
ow m
m
Prec Observation Simulation
0
100
200
300
400
500
600
700
8000
5
10
15
20
25
30
35
40
1991 1992 1993 1994 1995 1996 1997 1998 1999 2000
Ann
ual P
reci
pita
tion
mm
Ann
ual S
trea
mfl
ow m
m
Precipitation Observation Simulation
Fig. 2. Annual precipitation and simulated and observed streamflow in the upper San Pedro watershed. Upper: Redington (1991–1995) and Tombstone (1996–2000) gages;Lower: Charleston gage (1991–2000).
Table 2Criteria for examing the accuracy of the model calibration and validation.
Index Calibration (1991–1995) Validation (1996–2001)Redington Charleston Tombstone Charleston
NS Coefficient 0.63 0.58 0.81 0.70R2 0.66 0.82 0.90 0.93PBIAS �5.1 9.6 10.7 7.9
0.00
5.00
10.00
15.00
20.00
25.00
30.00
35.00
40.00
45.00
1973 1986 1992 1997
%
Grassland Desertscrub Mesquite Urban Agriculture
Fig. 3. Changes in proportional extent for four LULC classes in the upper San Pedrowatershed (1973–1997).
W. Nie et al. / Journal of Hydrology 407 (2011) 105–114 109
4.2. Impacts of LULC changes on hydrology at the basinal scale
A comparison of LULC maps for the years 1973, 1986, 1992, and1997 indicates that the most significant changes occurred in fiveLULC classes: Mesquite, Grassland, Desertscrub, Urban, and Agri-culture during 1973–1986 (Table 3 and Fig. 3). The proportionalextent of mesquite increased from 2.8% to 14.3%, (relative expan-sion is 410%) from 1973 to 1986, and mesquite invasion stoppedafter 1986 (14.0–14.3%). Conversely, from 1973 to 1986, the pro-portional extent of grassland and desertscrub decreased from41.1% to 35.0%, and from 39.7% to 32.7%, respectively. After 1986,
Table 3Proportional LULC extent, changes of LULCs (from Kepner et al., 2002), average annual basinupper San Pedro watershed in the period from 1973 to 1997.
Timeperiod
Mesquite(%)
Grassland(%)
Desertscrub(%)
Agriculture(%)
Urban(%)
1973 2.8 41.1 39.7 1.2 0.41986 14.3 35.0 32.7 1.8 1.41992 14.2 34.6 32.2 2.5 1.71997 14.0 34.9 31.8 2.0 2.21986–
197311.5 �6.1 �7.0 0.7 0.9
1992–1986
�0.1 �0.4 �0.5 0.6 0.3
1997–1992
�0.2 0.4 �0.5 �0.5 0.6
1997–1973
11.2 �6.1 �8.0 0.8 1.8
the grassland extent was relatively stable (34.6–35.0%) and thedesertscrub decreased from 32.7% to 31.8%. The urban region was
al values of hydrological components, and changes in hydrological components, for the
Water yield(mm)
Surface runoff(mm)
Baseflow(mm)
Percolation(mm)
ET(mm)
3.67 2.61 1.13 13.14 385.303.74 2.74 1.09 12.85 385.103.80 2.80 1.08 12.84 385.503.92 2.93 1.09 12.86 385.700.07 0.13 �0.04 �0.29 �0.20
0.06 0.06 �0.01 �0.01 0.40
0.12 0.13 0.01 0.02 0.20
0.25 0.32 �0.04 �0.28 0.40

0.0
0.5
1.0
1.5
2.0
2.5
3.0
3.5
4.0
nalc1973 nalc1986 nalc1992 nalc1997
Ave
rage
Ann
ual V
alue
s m
m
Total Water Yield Surface Runoff Baseflow
Fig. 4. Average annual basin values of water yield (total flow), surface runoff, andbaseflow for four past LULC maps in the upper San Pedro watershed.
110 W. Nie et al. / Journal of Hydrology 407 (2011) 105–114
gradually expanded from 0.4% to 2.2% (relative expansion is over400%) between 1973 and 1997. The agriculture region gradually in-creased from 1.2% to 2.5% from 1973 to 1992 and then decreased to2.0% in 1997.
The average annual basin values of total water yield, surfacerunoff, and baseflow simulated from each LULC maps are shownin Table 3 and Fig. 4. Compared to the LULC baseline in year1973, the average annual water yield over the watershed is0.07 mm higher in 1986, 0.13 mm higher in 1992, and 0.25 mmhigher in 1997(increasing 1.9%, 3.5%, and 6.8%, respectively). Sim-ilar to water yield, average annual surface runoff with LULC in 1973was 2.61 mm; it gradually increased to 2.93 mm with LULC in 1997(increasing 12.3%). On the contrary, the average annual baseflowfor LULC in 1986 was 0.04 mm lower than that in 1973(decreased3.5%); but baseflow for LULC in 1992 or 1997 was similar with thatin 1986. Similar to baseflow, average annual basin percolation de-creased from 13.14 mm for LULC in year 1973 to 12.85 mm forLULC in 1986 and percolation values for the other two LULC mapswere similar to that in 1986. Consequences of ET to LULC changes,however, are more complicated than other hydrological compo-nents. The average annual basin ET decreased from 385.3 mm forLULC in 1973 to 385.1 mm for LULC in 1986 and then increasedto 385.7 mm for LULC in 1997.
The comparison of variations of surface runoff and changes inLULCs suggests that the increase of average annual basin surfacerunoff could be mainly attributed to the urban expansion from1973 to 1997. As shown in Table 3, the gradual increase of surfacerunoff from 1973 to 1997 matches the trend of urban expansion. Inaddition, a very strong positive correlation was observed betweensurface runoff and proportional urban area (R2 is 0.9825). Increasedaverage annual basin runoff associated with urbanization shouldbe due to the increase of impervious surfaces (Franczyk andChangk, 2009).
An association between the decrease of baseflow/percolationand mesquite invasion from 1973 to 1986 can be indicated fromthe comparison between variations of average annual basinal base-flow/percolation and changes in LULC from 1973 to 1997. Asshown in Table 3, baseflow and percolation decreased from 1973to 1986 and then approximately remain unchanged until 1997.An opposite change of mesquite extent was observed from 1973to 1997, indicating negative correlation between variation of base-flow/percolation and invasion of mesquite woodland. In the upperSan Pedro watershed, the invasion of mesquite woodland occurredby replacing grassland or desertscrub.. Invasion of mesquite byreplacing grassland destroyed the complete grassland canopy cov-er, which was a favored landscape for infiltration through loweringthe effective energy of raindrops (Schlesinger et al., 1990). Deple-tion of canopy cover results in declines of percolation and base-
flow. Invasion of mesquite by replacing grassland can alsochange local water balance and reduce percolation/baseflowthrough increasing ET. The quantification of ET for different ripar-ian species in the upper San Pedro River Basin suggested that mes-quite woodlands have much higher annual ET rates thangrasslands (Scott et al., 2006). Unlike the shallow rooted grassland,mesquite has a shallow lateral root system and a deep vertical rootsystem, which enables it to use water in the shallow and deep soil,as well as in the groundwater system (Heitschmidt et al., 1988;Scott et al., 2006). This ability enhances the capacity of mesquiteto compete for water with grassland and other shallow-rooted veg-etations, especially during dry periods. Consequently, less waterwill be infiltrated into deep soil and percolation/baseflow will bereduced with invasion of mesquite into grassland.
Further comparison between changes in water yield andchanges of LULCs (Table 3) indicated that increase of water yieldfrom 1973 to 1997 is due to gradual increase of urban and this ef-fect is reduced by invasion of mesquite woodland. Table 3 showsthat the increases of water yield are comparable with those of sur-face runoff from 1986 to 1992 or from 1992 to 1997, but the in-creased water yield is smaller than the increased surface runofffrom 1973 to 1986. Water yield is mainly composed of surface run-off and baseflow. Thus, the decrease of baseflow from 1973 to 1986due to invasion of mesquite woodland reduced the total increase ofwater yield resulted from urban expansion.
One may argue that the changes in average basinal hydrologicalcomponents could be caused by simulation errors. As an example,the changes in average basinal hydrological components from1992 to 1997, as shown in Table 3 (some less than 1%), could beless than the simulation error because the percent of bias in modelcalibration are from �5.1% to 9.6% and from 7.9% to 10.7% in thevalidation period (Table 2). However, much higher variations inhydrological components at subbasin scale exist. The increase ofurban area at subbasinal scale is up to 9.0%, much higher thanthe average increase of 0.6% in the watershed scale (Table 3). Sim-ilarly, increases of surface runoff in subbasins are up to 1.48 mm,much higher than 0.13 mm increase in the whole watershed (Ta-ble 3). The relative changes of 1997 in surface runoff with respectto 1992 values of each subbasin are from �52.7% to 527.0%. Thehigh coefficient of determination between deviation of urban areaand surface runoff at subbasinal scale (R2 = 0.975) indicated thatthe increases of runoff in subbasins are mainly derived from in-crease of urban area, rather than from simulation errors. In addi-tion, relative changes of ET, Percolation, Baseflow, and WaterYield in 1997 with respect to 1992 values range from �6.1% to29.7%, �73.3% to 6.8%, �40.4% to 40.5%, and �52.7% to 527.0%,respectively. The high variations of hydrological components on lo-cal scale (subbasins) indicate that changes in hydrological compo-nents with respect to LULC changes are much higher than the levelof model accuracy, even for very small LULC changes during 1992and 1997. Thus, simulation results from the calibrated model wereused to evaluate impacts of LULC changes on hydrologicalcomponents.
4.3. Contribution of changes for individual LULCs on hydrologicalcomponents
The spatial distribution of changes for five LULCs (i.e. urban,mesquite, grassland, desertscrub, and agriculture) and five simu-lated hydrological components (i.e. surface runoff, baseflow, wateryield, percolation, and evapotranspiration) between LULC maps in1973 and 1997 are shown in Fig. 5. Urban expansion mainly oc-curred at the middle-stream reaches along the upper San PedroRiver Basin, near Hereford, Sierra Vista, Tombstone, and Benson,and also occurred for the city of Cananea (Mexico) in the upper-stream. Mesquite invasion occurred across almost the entire
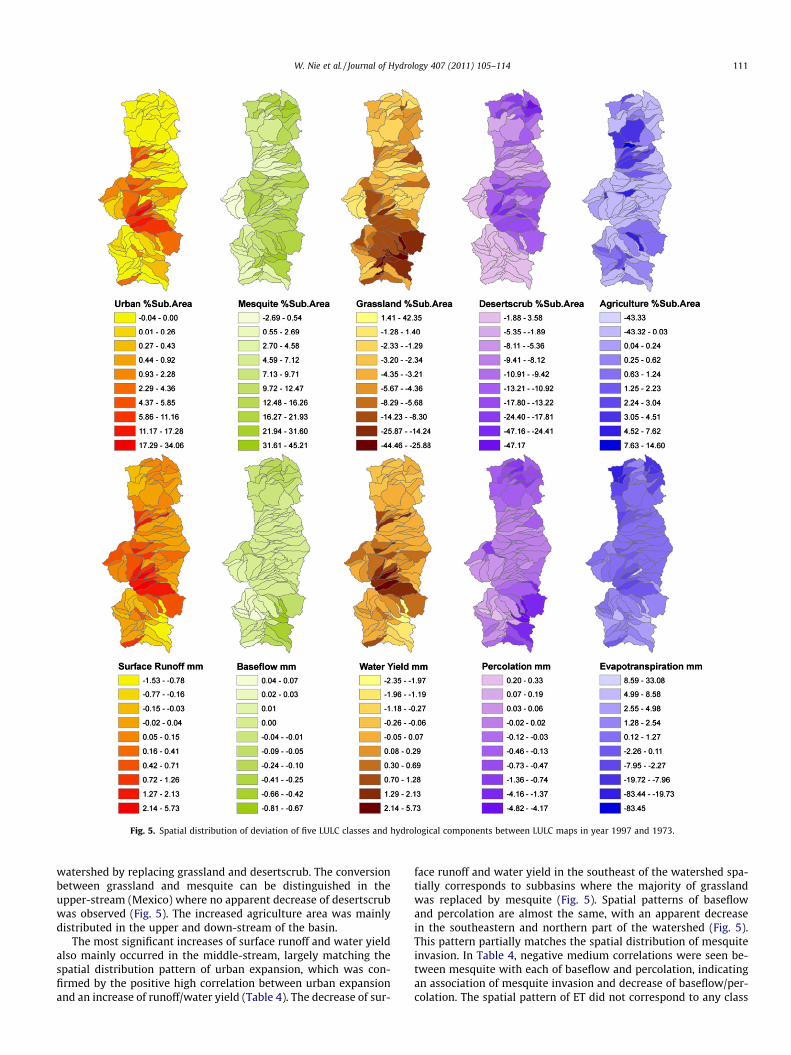
Fig. 5. Spatial distribution of deviation of five LULC classes and hydrological components between LULC maps in year 1997 and 1973.
W. Nie et al. / Journal of Hydrology 407 (2011) 105–114 111
watershed by replacing grassland and desertscrub. The conversionbetween grassland and mesquite can be distinguished in theupper-stream (Mexico) where no apparent decrease of desertscrubwas observed (Fig. 5). The increased agriculture area was mainlydistributed in the upper and down-stream of the basin.
The most significant increases of surface runoff and water yieldalso mainly occurred in the middle-stream, largely matching thespatial distribution pattern of urban expansion, which was con-firmed by the positive high correlation between urban expansionand an increase of runoff/water yield (Table 4). The decrease of sur-
face runoff and water yield in the southeast of the watershed spa-tially corresponds to subbasins where the majority of grasslandwas replaced by mesquite (Fig. 5). Spatial patterns of baseflowand percolation are almost the same, with an apparent decreasein the southeastern and northern part of the watershed (Fig. 5).This pattern partially matches the spatial distribution of mesquiteinvasion. In Table 4, negative medium correlations were seen be-tween mesquite with each of baseflow and percolation, indicatingan association of mesquite invasion and decrease of baseflow/per-colation. The spatial pattern of ET did not correspond to any class

Table 4Pair-wise Pearson correlation for the changes of five LULC classes and five hydrological components between LULC maps in 1997 and 1973; ET: evapotranspiration.
Surface runoff Baseflow Water yield ET Percolation Urban Mesquite Agriculture Grassland Desertscrub
Surface Runoff 1.00Baseflow 0.35 1.00Water Yield 0.99 0.48 1.00ET �0.04 �0.13 �0.06 1.00Percolation 0.34 0.98 0.47 �0.13 1.00Urban 0.95 0.09 0.90 0.01 0.09 1.00Mesquite �0.12 �0.47 �0.18 0.08 �0.48 �0.01 1.00Agriculture 0.03 0.03 0.03 0.01 0.03 0.01 0.01 1.00Grassland 0.04 0.50 0.11 �0.18 0.47 �0.13 �0.54 �0.09 1.00Desertscrub �0.38 0.00 �0.35 0.08 0.04 �0.36 �0.54 �0.07 �0.23 1.00
n = 116, bold numbers are for p < 0.05.
Table 5Summary of multiple regression analyses of five LULC (predictors) with each hydrological component (responses), partial R2 are listed with direction of influence (negative orpositive). Bold numbers are for the strongest predictor.
Responses Group Number of Subbasins Predictors R2
Urban Mesquite Agriculture Grassland Desertscrub
Surface runoff 1 85 0.9991(+) 0.0001(+) 0.99922 31 0.7928(+) 0.1251(+) 0.9179
Baseflow 1 89 0.1477(+) 0.3793(+) 0.52712 26 0.0388(+) 0.1641(+) 0.6791(+) 0.8820
Water yield 1 91 0.9973(+) 0.0006(�) 0.99782 25 0.6944(+) 0.0274(+) 0.1505(+) 0.8724
Percolation 1 96 0.0841(+) 0.3184(+) 0.40252 20 0.3053(+) 0.5074(+) 0.8127
ET 1 82 0.9098(�) 0.020(+) 0.0136(+) 0.94842 30 0.4436(�) 0.1674(+) 0.6110
p < 0.05 for all F tests.
Fig. 6. Two groups divided for multiple regression analyses (Group 3 is outliers).
112 W. Nie et al. / Journal of Hydrology 407 (2011) 105–114
of LULC change and no significant correlation between ET andother variables were examined (Table 4), suggesting a more com-plicated mechanism controlling the change of ET.
Results of multiple regression analyses are given in Table 5. The116 subbasins were divided into two groups (Fig. 6) to meet nor-mality of residuals (Group 3 are outliers). Changes in surface runoffin both groups were highly influenced by urban changes from 1973to 1997. While change in the urban area was the highest contribu-tor (partial R2 > 0.79, positive) in both groups, the second contrib-utor was changes in desertscrub (partial R2 = 0.0001, positive) inGroup 1 and grassland (partial R2 = 0.1251, positive) in Group 2.Similar to the surface runoff, the highest contributor for wateryield in both groups is change of urban (positive) and the second
highest contributor for Group 2 is change of grassland (positive).In addition, the change of mesquite (negative) and change of agri-culture (positive) are also contributors to the changes of wateryield (Table 5). For percolation and baseflow, the highest contribu-tor for Group 1 is change of desertscrub (positive) followed by ur-ban (positive) and the highest contributor for Group 2 is change ofgrassland (positive) followed by change of agriculture (positive).Both desertscrub and grassland were predominantly replaced bymesquite woodland in the upper San Pedro watershed from 1973to 1997 (Kepner et al., 2002), indicating that any decrease of perco-lation/baseflow can be attributed to mesquite invasion. For the ET,the highest contributor in Group 1 is change of urban area (partialR2 = 0.9098, negative) followed by change of mesquite (positive)

W. Nie et al. / Journal of Hydrology 407 (2011) 105–114 113
and change of desertscrub (positive); and the highest contributorin Group 2 is grassland (partial R2 = 0.4436, negative) followed bydesertscrub (partial R2 = 0.1674, positive).
The overall increase of runoff simulated in the Sierra Vista sub-basin of the upper San Pedro Watershed from LULC in 1973 to 1997reported by Miller et al. (2002) was attributed to the simultaneousincrease of urban, agriculture and woody mesquite, and decrease ofgrassland and desertscrub. In our current study, urbanization wasidentified as the strongest contributor of change in surface runoff,suggesting that the simulated increase of runoff from 1973 to 1997can be mainly attributed to the expansion of urban area, althoughmesquite invasion was the dominant LULC changes from 1973 to1997. Surface runoff is the most significant component of wateryield (more than 70%), thus the most significant contributor forchanges of water yield is also the urbanization. Changes of desert-scrub and grassland were the strongest contributor (positive) tothe changes of percolation and baseflow, suggesting the primarydecrease of percolation/baseflow was attributed to the decreaseof grassland/desertscrub from 1973 to 1997. In the upper San Ped-ro watershed, the decreased grassland and desertscrub was re-placed by mesquite. The decline of percolation and baseflow aftermesquite invasion can be attributed to the decrease of availablewater due to increasing ET (Schlesinger et al., 1990).
Changes of urban and grassland were identified as the strongestcontributors (negative) for the change of ET from 1973 to 1997. Thenegative influence of urbanization on ET can be attributed to theincrease of impervious area, less of vegetation cover implies lesswater that recycle to the atmosphere by plant transpiration. Thenegative impact of grassland on ET is due to its relatively low tran-spiration demand compared to that of shrubs and woodland(desertscrub and mesquite). Mesquite and desertscrub have a shal-low lateral root system and a deep vertical root system, which en-ables them to use water in the shallow and deep soil, as well as inthe groundwater system (Heitschmidt et al., 1988; Scott et al.,2006). In the upper San Pedro watershed, the replacement of grass-land by mesquite from 1973 to 1997 enhanced the transpirationdemand, and thus resulted in the increase of ET.
5. Summary and conclusions
Contributions of changes of LULCs to that of major hydrologicalcomponents in the upper San Pedro watershed were evaluatedusing a combination of hydrological modeling and multiple regres-sion analyses. The impacts of LULC change on changes in hydrologywere evaluated; associations and contributions of LULC changes tochanges in hydrological components were identified and quanti-fied. We summarize our conclusions as follows:
1 Although mesquite invasion (2.8–14.3% from 1973 to 1986) wasthe most significant LULC change in the upper San Pedrowatershed from 1973 to 1997, increased surface runoff andtotal water yield were mainly attributed to urban expansion(0.4–2.2% from 1973 to 1997).
2 The replacement of grassland by mesquite also contributed tothe decrease of surface runoff and water yield.
3 The replacement of desertscrub or grassland by mesquite from1973 to 1997 was identified as the strongest contributor for thedeclines of baseflow and percolation and contributed to theincrease of ET in the upper San Pedro watershed.
Increase in surface runoff was considered as a negative impacton the upper San Pedro River Basin (Kepner et al., 2004). It may fur-ther strengthen environmental stress through generating moresediment yield and erosion that were usually directly related torunoff volume and velocity. Thus, urbanization, the strongest con-
tributor for surface runoff and water yield, can be considered as amajor environmental stressor controlling hydrological compo-nents, including runoff, water yield, and ET, for the upper San Ped-ro River Basin. A decline in percolation would directly decreaserecharge for the shallow and/or deeper aquifers and thus be con-sidered a negative impact for watersheds (Kepner et al., 2004).Hence, replacement of grassland/desertscrub by mesquite wood-land was another important environmental stressor affectingwater resources in the upper San Pedro River Basin.
The approach used in this study simply determined contribu-tions of changes for LULCs to hydrological components, providingquantitative information for stakeholders and decision makers tomake better choices for land and water resource planning andmanagement. Lastly, this approach provides a solid example ofintegrating hydrologic modeling (using remotely sensed digitalLULCs) with a multiple regression analysis to understand the po-tential impact of landscape change on water provisioning, a vitalecosystem service in the western US. It can be widely applied toa variety of watersheds, where time-sequenced digital Landcoveris available, to predict hydrological consequences to LULC changes.
References
Arnold, J.G., Allen, P.M., Bernhardt, G., 1993. A comprehensive surface-groundwaterflow model. Journal of Hydrology 142 (1–4), 47–69.
Arnold, J.G., Allen, P.M., 1999. Automated methods for estimating baseflow andground water recharge from streamflow records. Journal of the American WaterResources Association 35 (2), 411–424.
Arnold, J.G., Srinivasan, R., Muttiah, R.S., Williams, J.R., 1998. Large area hydrologicmodeling and assessment – Part 1: model development. Journal of AmericanWater Resource Association 34 (1), 73–89.
Di Luzio, M., Johnson, G.L., Daly, C., Eischeid, J.K., Arnold, J.G., 2008. Constructingretrospective gridded daily precipitation and temperature datasets for theconterminous United States. Journal of Applied Meteorology and Climatology47 (2), 475–497.
Franczyk, J., Changk, H., 2009. The effects of climate change and urbanization on therunoff of the rock creek basin in the Portland metropolitan area, Oregon, USA.Hydrological Processes 23, 805–815.
Gesch, D.B., 2007. The National Elevation Dataset. In: Maune, D. (Ed.), DigitalElevation Model Technologies and Applications: The DEM Users Manual, 2nded.: Bethesda. American Society for Photogrammetry and Remote Sensing,Maryland, pp. 99–118.
Gesch, D., Oimoen, M., Greenlee, S., Nelson, C., Steuck, M., Tyler, D., 2002. Thenational elevation dataset. Photogrammetric Engineering and Remote Sensing68 (1), 5–11.
Ghaffari, G., Keesstra, S., Ghodousi, J., Ahmadi, H., 2009. SWAT-simulatedhydrological impact of land-use change in the Zanjanrood Basin, NorthwestIran. Hydrological Processes, doi:10.1002/hyp.7530.
Gupta, H.V., Sorooshian, S., Yapo, P.O., 1999. Status of automatic calibration forhydrologic models: comparison with multilevel expert calibration. Journal ofHydrologic Engineering 4 (2), 135–143.
Hargreaves, G.L., Hargreaves, G.H., Riley, J.P., 1985. Agricultural Benefits for SenegalRiver Basin. Journal of Irrigation and Drainage Engineering-ASCE 111 (2), 113–124.
Heitschmidt, R.K., Ansley, R.J., Dowhower, S.L., Jacoby, P.W., Price, D.L., 1988. Someobservations from the excavation of honey mesquite root systems. Journal ofRange Management 41 (3), 227–231.
Hernandez, M., Miller, S.N., Goodrich, D.C., Goff, B.F., Kepner, W.G., Edmonds, C.M.,Jones, K.G., 2000. Modeling runoff response to Land Cover and rainfall spatialvariability in semi-arid watersheds. Environmental Monitoring and Assessment64, 285–298.
Hjelmfelt, A.T., 1980. Empirical-investigation of curve number technique. Journal ofthe Hydraulics and Engineering Division-ASCE 106 (9), 1471–1476.
Hooghoudt, S.B., 1940. Bijdrage tot de kennis van enige natuurkundige groothedenvan de grond. Versl Landbouwkd Onderz 46, 515–707.
Kepner, W.G., Semmens, D.J., Bassett, S.D., Mouat, D.A., Goodrich, D.C., 2004.Scenario analysis for the San Pedro River, analyzing hydrological consequencesof a future environment. Environmental Monitoring and Assessment 94, 115–125.
Kepner, W.G., Edmonds, C.M., Watts, C. J., 2002. Remote Sensing and GeographicInformation Systems for Decision Analysis in Public Resource Administration: ACase Study of 25 Years of Landscape Change in a Southwestern Watershed. EPA/600/R-02/039. 31pp.
Kepner, W.G., Semmens, D.J., Heggem, D.T., Evanson, E.J., Edmonds, C.M., Scott, S.N.,Ebert, D.W., 2003. The San Pedro River Geo-Data Browser and Assessment Tools.CD-ROM (EPA/600/C-03/008 and ARS/152432), US Environmental ProtectionAgency, Office of Research and Development, Las Vegas, NV, USA; USDepartment of Agriculture, Agricultural Research Service, Tucson, AZ, USA.
114 W. Nie et al. / Journal of Hydrology 407 (2011) 105–114
Kepner, W.G., Watts, G.J., Edmonds, C.M., Maingi, J.K., Marsh, S.E., Luna, G., 2000. Alandscape approach for detecting and evaluating change in a semi-aridenvironment. Environmental Monitoring and Assessment 64, 179–195.
Liu, Y., Gupta, H., Springer, E., Wagener, T., 2008a. Linking science withenvironmental decision making: experiences from an integrated modelingapproach to supporting sustainable water resources management.Environmental Modelling and Software 23 (7), 846–858.
Liu, Y., M. Mahmoud, H. Hartmann, S. Stewart, T. Wagener, D. Semmens, R. Stewart,H. Gupta, D. Dominguez, D. Hulse, R. Letcher, B. Rashleigh, C. Smith, R. Street, J.Ticehurst, M. Twery, H. van Delden, and D. White. 2008b. Formal ScenarioDevelopment for Environmental Impact Assessment Studies. In A. Jakeman, A.Voinov, A. Rizzoli, and S. Chen, eds., Environmental Modeling, Software andDecision Support: Developments in Integrated Environmental Assessment, vol.3, Elsevier, Amsterdam, pp. 145–162.
Miller, S.N., Kepner, W.G., Mehaffey, M.H., Hernandez, M., Miller, R.C., Goodrich,D.C., Devonhold, K.K., Heggem, D.T., Miller, W.P., 2002. Integrating landscapeassessment and hydrologic modeling for land cover change analysis. Journal ofthe American Water Resources Association 38 (4), 915–929.
Mohammed, M., Liu, Y., Hartman, H., Stewart, S., Wagener, T., Semmens, D., Stewart,R., Gupta, H., Dominguez, D., Dominguez, F., Hulse, D., Letcher, R., Rashleigh, B.,Smith, C., Street, R., Ticehurst, J., Twery, M., van Delden, H., Waldick, R., White,D., Winter, L., 2009. A formal framework for scenario development in support ofenvironmental decision-making. Environmental Modelling and Software 24 (7),798–808.
Monteith, J.L., 1965. Evaporation and environment, 19th Symposia of theSociety for Experimental Biology. Cambridge University, London, UK, pp.205–234.
Nash Maliha S. and David Bradford. 2001. Parametric and NonParametric (MARS;Multivariate Additive Regression Splines) Logistic Regressions for Prediction ofPresence of Amphibians. EPA/600/R-01/081.
Nash, J.E., Sutcliffe, J.V., 1970. River flow forecasting through conceptual models,Part I - A discussion of principles. Journal of Hydrology 10, 282–290.
Neitsch, S.L., Arnold, J.G., Kiniry, J.R., Williams, J.R., 2005. Soil and Water AssessmentTool. Theoretical Documentation. Version 2005, USDA-ARS, Temple, TX, USA.494 pp.
NRCS. Soil Survey Staff, Natural Resources Conservation Service, United StatesDepartment of Agriculture. US General Soil Map (STATSGO2). http://soildatamart.nrcs.usda.gov.
Priestlr, Ch., Taylor, R.J., 1972. Assessment of surface heat-flux and evaporationusing large-scale parameters. Monthly Weather Review 100 (2), 81–82.
Rallison, R.E., Miller, N., 1981. Past, Present and future SCS runoff procedure. Rainfallrunoff relationship. Water Resources Publication, Littleton, CO.
Schlesinger, W.H., Reynolds, J.F., Cunningham, G.L., Huenneke, L.F., Jarrell, W.M.,Cirginla, R.A., Whitford, W.G., 1990. Biological feedbacks in globaldesertification. Science 247, 1043–1048.
Scott, R.L., Goodrich, D., Levick, L., 2006. Determining the riparian groundwater usewithin the San Pedro Riparian National Conservation Area and the Sierra VistaSubwatershed, Arizona. In Hydrologic Requirements of and ConsumptiveGround-Water Use by Riparian Vegetation along the San Pedro River, Arizona.
Simanton, J.R., Hawkins, R.H., MohseniSaravi, M., Renard, K.G., 1996. Runoff curvenumber variation with drainage area, Walnut Gulch, Arizona. T Asae 39 (4),1391–1394.
Solan, P.G., Morre, I.D., Coltharp, G.B., Eigel, J.D., 1983. Modeling surface andsubsurface stormflow on steeply-sloping forested watersheds. Water ResourceInst. Report 142. University of Kentucky, Lexington.
Skirvin, S.M., Kepner, W.G., Marsh, S.E., Drake, S.E., Maingi, J.K., Edmonds, C.M.,Watts, C.J., Williams, D.R., 2004. Assessing the accuracy of satellite-derivedland-cover classification using historical aerial photography, digital orthophotoquadrangles, and airborne video data. Remote Sensing and GIS AccuracyAssessment 9, 115–131.
USDA. <http://soils.usda.gov/survey/online_surveys/arizona/index.html>.USDA, S.C.S., 1972. National Engineering Handbook Section 4 Hydrology.USEPA. 1993. North American Landscape Characterization (NALC) Research Brief.
EPA/600/S-93/0005, Office of Research and Development, Washington, DC, 8pp.