luna (simulating the demand for long-distance … · luna guidebook date: 30/04/2013 luna guidebook...
TRANSCRIPT

Optimal Regulation and Infrastructure for Ground, Air and Maritime Interfaces
LUNA (SIMULATING THE DEMAND FOR LONG-DISTANCE TRAVEL USING A NON-OD-MATRIX BASED APPROACH) - GUIDEBOOK Submitted: 30 April 2013 Main Author: TUW Dissemination: Public Project co-funded by the European Commission within the Seventh Framework Programme, Theme 7 Transport Contract number 265600 Project Start Date: 1 February 2011, Project Duration: 27 months

LUNA GUIDEBOOK
Date: 30/04/2013 LUNA Guidebook Page i
Document Control Sheet
Project Number: 019746
Project Acronym: ORIGAMI
Workpackage: WP3 Travel behaviour
Version: V0.1
Document History: Version Issue Date Distribution
V0.0 29 April 2013 Task partners
V0.1 30 April 2013 Consortium
Classification – This report is:
Draft Final X Confidential Restricted Public X
Partners Owning: All
Main Editor: Paul Pfaffenbichler (TUW)
Partners Contributed: Simon Shepherd (ITS)
Made Available To: All ORIGAMI Partners / Project Officer / Advisory Board / Public
This document should be referenced as:
Pfaffenbichler P, “LUNA (SIMULATING THE DEMAND FOR LONG-DISTANCE TRAVEL USING A NON-OD-MATRIX BASED APPROACH) - GUIDEBOOK”, Porject ORIGAMI, Co-funded by FP7. TRI, Edinburgh Napier University, Edinburgh, January 2012
This document was created as part of the ORIGAMI project.
Copyright (c) 2012
ORIGAMI Project Office
Transport Research Institute Edinburgh Napier University Edinburgh, UK Tel: + 44 131 455 2635 e-mail: [email protected] Web: www.origami-project.eu

LUNA GUIDEBOOK
TABLE OF CONTENTS
Date: 30/04/2013 LUNA Guidebook Page ii
1 INTRODUCTION .............................................................................................................................. 1
2 INSTALLATION OF LUNA .............................................................................................................. 2
2.1 SOFTWARE REQUIREMENTS ......................................................................................................... 2 2.2 LUNA FILES ................................................................................................................................ 2
3 RUN LUNA ....................................................................................................................................... 3
3.1 VENSIM(R) MODEL....................................................................................................................... 3 3.1.1 Main user interface ............................................................................................................ 3 3.1.2 Analysing the model structure ........................................................................................... 3 3.1.3 Analysing the model output ............................................................................................... 8 3.1.4 Run a simulation .............................................................................................................. 11
3.2 DEFINE SCENARIOS ................................................................................................................... 12
4 REFERENCES ............................................................................................................................... 15
LIST OF FIGURES
FIGURE 3-1 VIEW USER INTERFACE LUNA .................................................................................................. 3 FIGURE 3-2 VIEW OF THE POPULATION COHORT-MODEL ............................................................................... 4 FIGURE 3-3 TOOLS TO ANALYSE MODEL STRUCTURE AND OUTPUT ................................................................ 5 FIGURE 3-4 CAUSES TREE POPULATION BY AGE COHORT K .......................................................................... 6 FIGURE 3-5 USES TREE VARIABLE POPULATION BY AGE COHORT K ............................................................... 7 FIGURE 3-6 EQUATIONS BEHIND THE VARIABLE POPULATION BY AGE COHORT K ............................................ 8 FIGURE 3-7 GRAPH MODAL SHARE TRIPS .................................................................................................... 9 FIGURE 3-8 TABLE MODAL SHARE TRIPS ...................................................................................................... 9 FIGURE 3-9 CONTROL PANEL AND SUBSCRIPT CONTROL ............................................................................. 9 FIGURE 3-10 DEFINING THE START AND END TIME OF A SIMULATION ............................................................ 10 FIGURE 3-11 LOADING/UNLOADING OF DATASETS ...................................................................................... 10 FIGURE 3-12 SUBSCRIPT CONTROL – COUNTRIES ..................................................................................... 11 FIGURE 3-13 SET UP A SIMULATION .......................................................................................................... 11 FIGURE 3-14 RUN A SIMULATION............................................................................................................... 12 FIGURE 3-15 USER INTERFACE SUB-SYSTEM SCENARIOS FOR LUNA .......................................................... 12 FIGURE 3-16 DROP DOWN MENU SUB-SYSTEM FERTILITY ........................................................................... 13 FIGURE 3-17 DISPLAY OF THE LOADED SCENARIO DEFINITIONS ................................................................... 14
LIST OF TABLES
TABLE 3-1 SUMMARY TOOLS TO INVESTIGATE AND ANALYSE THE MODEL STRUCTURE .................................... 5 TABLE 3-2 SUMMARY TOOLS TO INVESTIGATE AND ANALYSE THE MODEL OUTPUT .......................................... 8 TABLE 3-3 SCENARIO CODING .................................................................................................................. 13
LUNA GUIDEBOOK
Date: 30/04/2013 LUNA Guidebook Page 1
1 INTRODUCTION The aim of this Guidebook is to explain the use of the published version of the System Dynamics model LUNA (Simulating the demand for Long-distance travel Using a Non-OD-matrix based Approach) which was developed in the framework of the project ORIGAMI. Details about the rationale and the mathematical details can be found in Deliverable 3.1 of ORIGAMI (Lemmerer and Pfaffenbichler, 2012). LUNA results for the ORIGAMI 2050 scenario can be found in Deliverable 7.1 (Bielefeldt et al., 2013). Deliverable 3.1 and 7.1 are or will be made available from the ORIGAMI webpage (http://www.origami-project.eu/deliverables/).

LUNA GUIDEBOOK
Date: 30/04/2013 LUNA Guidebook Page 2
2 INSTALLATION OF LUNA
2.1 SOFTWARE REQUIREMENTS The model LUNA was written using the System Dynamics software Vensim(r) (www.vensim.com). The model was converted into the file format “vpm” which stands for Vensim Packaged Model. This type of models can be run with the software “Vensim Model Reader” which can be downloaded from the Vensim(r) homepage for free (http://vensim.com/vensim-model-reader/). In order to be able to run LUNA the user has to install the “Vensim Model Reader”. The explanations and screenshots in the following sections are based on version 6.0a-1 of the “Vensim Model Reader”. Base year input and scenario definition data are stored in Microsoft Excel(r).
2.2 LUNA FILES To install LUNA the user has to unpack all files from the file “LUNA_V30.zip” into one directory. The name and location of the directory can be selected freely. Nevertheless the internal order of the unpacked files and directory has to be kept as it is. The file “LUNA_V30.vpm” is the core model. The directory “data” contains eight xls-files. One of this files (“origami_data.xls”) contains the base year input data. The other seven files provide scenario definition data. The details concerning scenario definition are explained in more detail below. The directory “guidebook” contains this Guidebook.

LUNA GUIDEBOOK
Date: 30/04/2013 LUNA Guidebook Page 3
3 RUN LUNA
3.1 VENSIM(R) MODEL
3.1.1 Main user interface
The first step is to open the file “LUNA_V30.vpm” using the Vensim(r) Model Reader software. For the sake of readability complex Vensim(r) models can be organised in different views containing sub-models. Figure 3-1 shows “Navigation” view of LUNA which is the main user interface. Different coloured push buttons navigate the user to different sub-systems of the model. Yellow indicates socio-demographic and economic sub-models, blue indicates transport related sub-models and green the calculation of output indicators. Pushing e.g. the button “Population >” leads the user to the population cohort-model (Figure 3-2).
Figure 3-1 View user interface LUNA
3.1.2 Analysing the model structure
The push buttons in the lower left corner allow the user to navigate to the next view, the previous view or back to the main navigation view. Elements written in red colour indicate base year input data which are read in from the data file “origami_data.xls”. Elements written in blue colour indicate time series scenario definition data which are read in from the file “origami_scenario.xls”. Elements written in green colour indicate constants which are defined directly in Vensim(r). Elements written in black

LUNA GUIDEBOOK
Date: 30/04/2013 LUNA Guidebook Page 4
colour are model internal variables. The tools in the upper left corner can be used to analyse the model structure and the model output1 (Figure 3-3).
Figure 3-2 View of the population cohort-model
1 A comprehensive description of the Vensim® Model Reader can be found at
http://www.vensim.com/documentation/index.html.

LUNA GUIDEBOOK
Date: 30/04/2013 LUNA Guidebook Page 5
Figure 3-3 Tools to analyse model structure and output
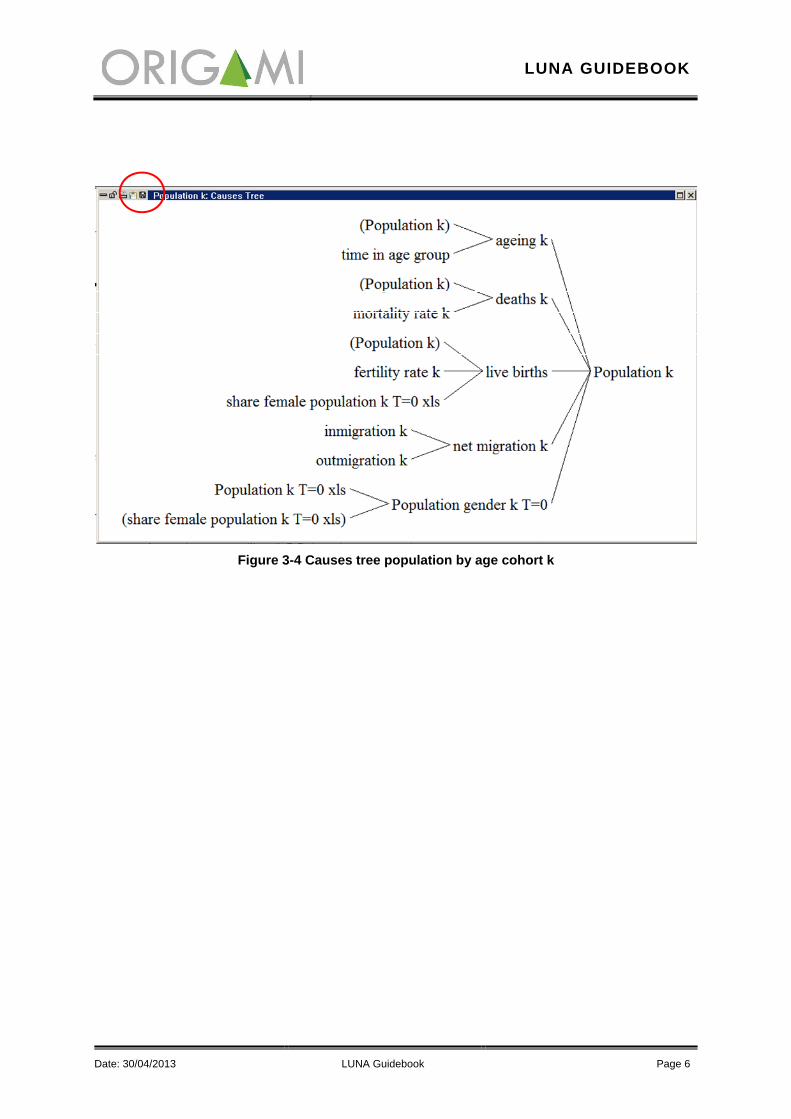
The most important tools to investigate and analyse the LUNA model structure are summarised in Table 3-1. Figure 3-4 shows the causes tree for the variable population by age cohort. The tools in the upper left corner allow the user to print, copy to the clip board or save the result. Figure 3-5 shows the uses tree for the variable population by age cohort. Figure 3-6 shows the equations underlying the variable population by age cohort. As the user is able to investigate all relationships of the model in a qualitative and quantitative way LUNA qualifies as a white box model.
Table 3-1 Summary tools to investigate and analyse the model structure
Symbol Name Explanation
Causes tree
Shows which variables are influencing a selected variable. The depth of the causes tree is two levels backwards.
Uses tree
Shows which variables are influenced by a selected variable. The depth of the causes tree is two levels forward.
Document Shows the equation behind a selected variable.
LUNA GUIDEBOOK
Date: 30/04/2013 LUNA Guidebook Page 6
Figure 3-4 Causes tree population by age cohort k

LUNA GUIDEBOOK
Date: 30/04/2013 LUNA Guidebook Page 7
Figure 3-5 Uses tree variable population by age cohort k

LUNA GUIDEBOOK
Date: 30/04/2013 LUNA Guidebook Page 8
Figure 3-6 Equations behind the variable population by age cohort k
3.1.3 Analysing the model output
The model output and the value of every element, variable or constant can be shown the Graph or Table tool (Table 3-2). Figure 3-7 shows the graph of the variable share of trips by mode. Figure 3-8 shows the table of the variable share of trips by mode. Again the tools in the upper left corner allow the user to print, copy to the clip board or save the results.
Table 3-2 Summary tools to investigate and analyse the model output
Symbol Name Explanation
Graph Shows the value of a selected variable in each iteration in form of a diagram.
Table Shows the value of a selected variable in each iteration in form of a table.

LUNA GUIDEBOOK
Date: 30/04/2013 LUNA Guidebook Page 9
Figure 3-7 Graph modal share trips
Figure 3-8 Table modal share trips
The Control Panel (Figure 3-9) can be used to change the start and end time of simulation (Figure 3-10) and load/unload data from previously calculated scenarios (Figure 3-11).
Figure 3-9 Control Panel and Subscript Control

LUNA GUIDEBOOK
Date: 30/04/2013 LUNA Guidebook Page 10
Figure 3-10 Defining the start and end time of a simulation
Figure 3-11 Loading/unloading of datasets
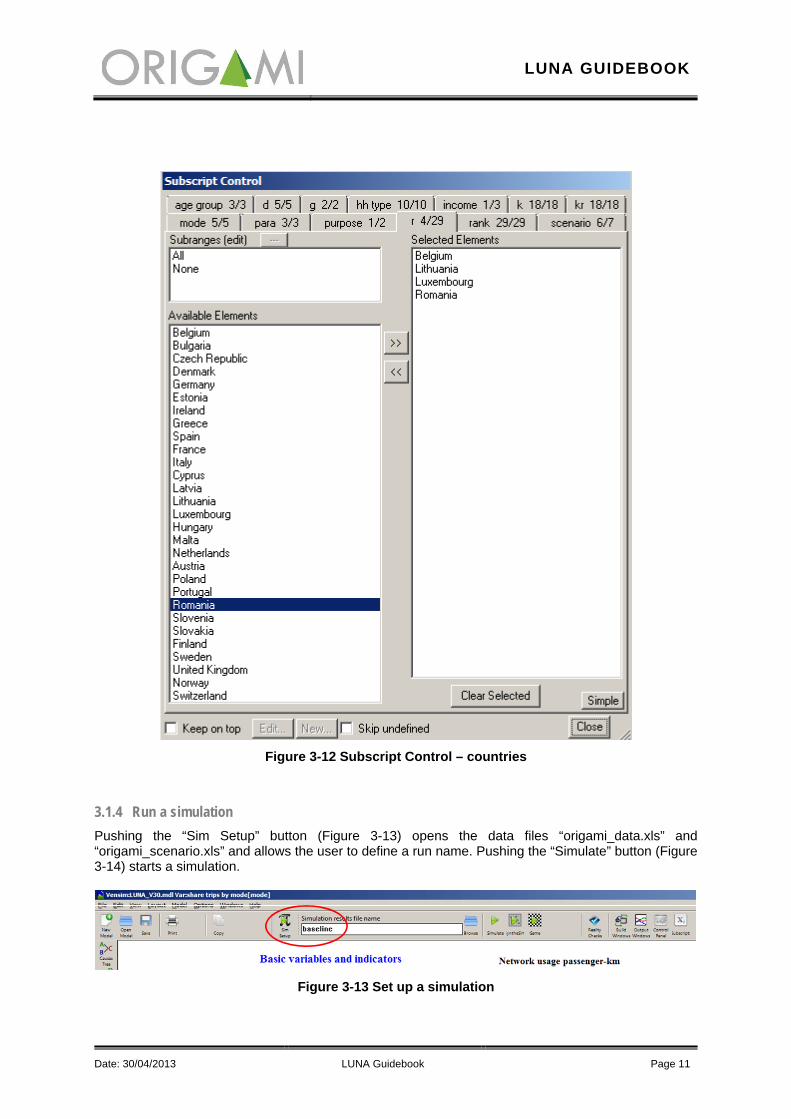
The Subscript Control (Figure 3-9) allows to define a selection from the range of available subscripts, e.g. to view only the values for the countries Belgium, Lithuania, Luxembourg and Romania from the list of the EU27 countries plus Switzerland and Norway (Figure 3-12).
LUNA GUIDEBOOK
Date: 30/04/2013 LUNA Guidebook Page 11
Figure 3-12 Subscript Control – countries
3.1.4 Run a simulation
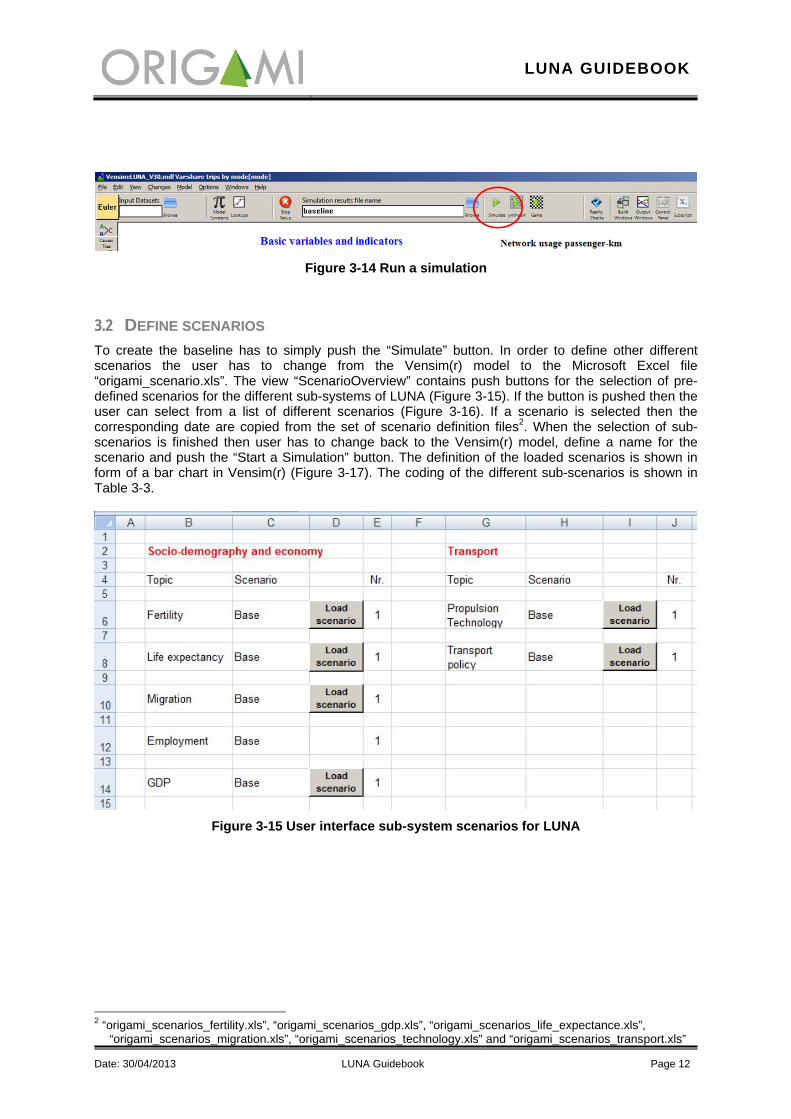
Pushing the “Sim Setup” button (Figure 3-13) opens the data files “origami_data.xls” and “origami_scenario.xls” and allows the user to define a run name. Pushing the “Simulate” button (Figure 3-14) starts a simulation.
Figure 3-13 Set up a simulation
LUNA GUIDEBOOK
Date: 30/04/2013 LUNA Guidebook Page 12
Figure 3-14 Run a simulation
3.2 DEFINE SCENARIOS To create the baseline has to simply push the “Simulate” button. In order to define other different scenarios the user has to change from the Vensim(r) model to the Microsoft Excel file “origami_scenario.xls”. The view “ScenarioOverview” contains push buttons for the selection of pre-defined scenarios for the different sub-systems of LUNA (Figure 3-15). If the button is pushed then the user can select from a list of different scenarios (Figure 3-16). If a scenario is selected then the corresponding date are copied from the set of scenario definition files2. When the selection of sub-scenarios is finished then user has to change back to the Vensim(r) model, define a name for the scenario and push the “Start a Simulation” button. The definition of the loaded scenarios is shown in form of a bar chart in Vensim(r) (Figure 3-17). The coding of the different sub-scenarios is shown in Table 3-3.
Figure 3-15 User interface sub-system scenarios for LUNA
2 “origami_scenarios_fertility.xls”, “origami_scenarios_gdp.xls”, “origami_scenarios_life_expectance.xls”,
“origami_scenarios_migration.xls”, “origami_scenarios_technology.xls” and “origami_scenarios_transport.xls”

LUNA GUIDEBOOK
Date: 30/04/2013 LUNA Guidebook Page 13
Figure 3-16 Drop down menu sub-system fertility
Table 3-3 Scenario coding
Sub-model Scenario Number Fertility Base 1
Low 2 High 3
Life expectancy Base 1 Low 2 High 3
Migration Base 1 Center 2
Employment Base 1 GDP Base 1
Concentrate 2 Disperse 3 UniHigh 4 UniLow 5
Propulsion Technology Base 1 Normative 2
LowEmission 3 Transport Policy Base 1
Normative 2 RegHighInfra 3 RegLowInfra 4 LibLowInfra 5 LibHighInfra 6

LUNA GUIDEBOOK
Date: 30/04/2013 LUNA Guidebook Page 14
Figure 3-17 Display of the loaded scenario definitions

LUNA GUIDEBOOK
Date: 30/04/2013 LUNA Guidebook Page 15
4 REFERENCES BIELEFELDT, C., SHEPHERD, S., BIOSCA, O., ULIED, A., PFAFFENBICHLER, P. & LEMMERER,
H. 2013. Scenarios for Future Co- and Intermodality in Long- Distance Passenger Travel. Deliverable 7.1 of ORIGAMI, Co-funded by FP7. TRI, Edinburgh Napier University, Edinburgh.
LEMMERER, H. & PFAFFENBICHLER, P. 2012. Current Travel Behaviour, Future Trends and their Likely Impact. Deliverable 3.1 of ORIGAMI, Cofunded by FP7. TRI, Edinburgh Napier University, Edinburgh.