lynn k. shay 1, j. martinez-pedraja 1, m. powell 2, b. haus 1, and j. brewster 1 1 division of...
TRANSCRIPT

Lynn K. Shay1, J. Martinez-Pedraja1, M. Powell2, B. Haus1, and J. Brewster1
1Division of Meteorology and Physical Oceanography, RSMAS2Hurricane Research Division, AOML-NOAA
ONR/ State of Florida/ NOAA Sea Grant
To improve our understanding of surface processes and their linkages to atmospheric and oceanic boundary layer processes in the coastal ocean.
http://isotherm.rsmas.miami.edu/~nick
Lucy Wyatt, Mei Wang, Klaus-Werner Gurgel
Coastal Ocean Observing Systems: Oceanic Current and Wave Response to Hurricane Jeanne Detected by Wellen Radars

SEA-COOS (SECOORA): HF Radar
• WERA deployed 28 July-4 Oct 2003 in Venice Beach FL, and Bradenton Beach FL in support of SEA-COOS.
• Transmit frequency of 16.045 MHz, bandwidth of 200 KHz (` 1 km resolution).
• Tested different sample intervals-since WERA is FMCW system (512, 1024, 2048…) represented 2.2, 4.4, 9 min... samples.
• Ranges approached 100 km about 50% of the time.• Comparisons to moored ADCP (COMPS), drifters and
DBI Radar flights from NOAA P-3.

Introduction:
During 2004/2005 hurricane seasons, several (intense) hurricane landfalls in Florida.
Most intense (cat 3 or above) hurricanes in the Atlantic basin occur in Gulf and Southeastern US (i.e. GCOOS and SECOORA).
An Ocean Observing System could provide valuable current, wave and wind data in improving and evaluating predictive models for landfalling hurricane scenarios.
HF radar provide one such tool in real-time mapping currents, winds and waves.
WEllen RAdars (WERA) in phased array mode with cells of about 1 km over a range of ~80 to 90 km (Research Phase). Monitoring Phase provides hourly currents at 2 km intervals. These radar are (will be) deployed at Key Largo, Key Biscayne, (Ft. Lauderdale, Virgina Key).
Mapping currents, waves and wind directions during Hurricane Jeanne (04).

Radar Power (Doppler) Spectrum: Bragg Backscatter (Neptune Radar Ltd, Pisces)
Wind (short wave) direction measured from magnitude difference between the two blue peaks. Here wind is blowing towards the radar.
Hs can be derived from scaled ratio of 2nd -order to 1st-
order peaks from a single
radar site.
Full directional spectra obtained from Iterative inversion
of Doppler spectra to match surface
Wave spectrum. Doppler spectra must be
observed from two overlapping stations (Wyatt 1990)

Surface Current Response to Hurricane Jeanne:
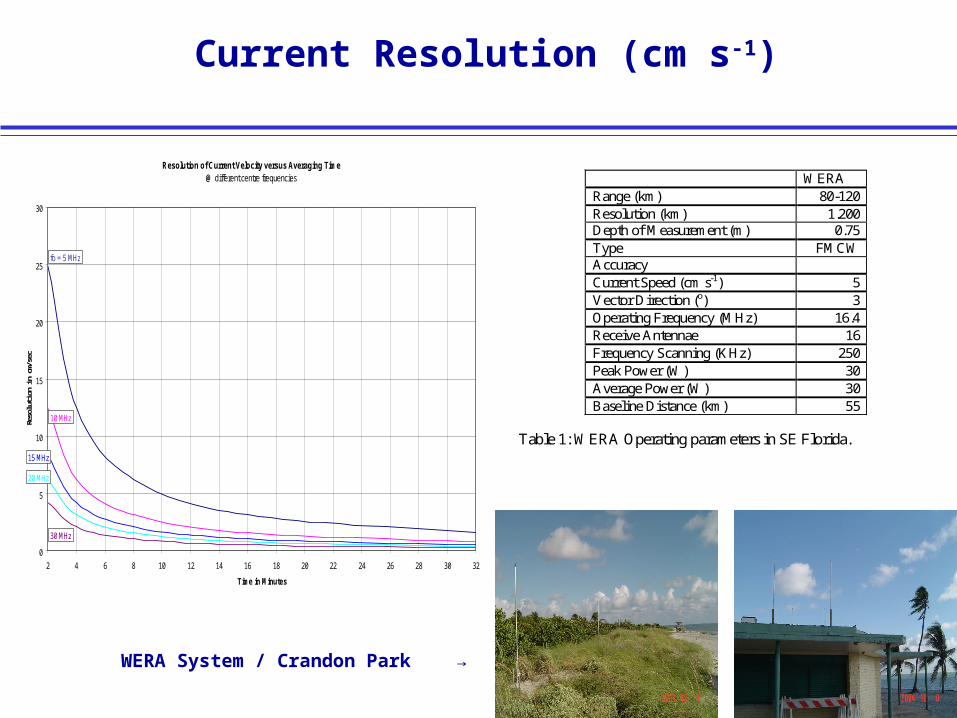
Current Resolution (cm s-1)
Resolution of Current Velocity versus Averaging Time@ different centre frequencies
0
5
10
15
20
25
30
2 4 6 8 10 12 14 16 18 20 22 24 26 28 30 32
Time in Minutes
Reso
lutio
n in
cm
/sec
fo = 5 MHz
10 MHz
15 MHz
20 MHz
30 MHz
WERA Range (km) 80-120 Resolution (km) 1.200 Depth of Measurement (m) 0.75 Type FMCW Accuracy Current Speed (cm s-1) 5 Vector Direction (o) 3 Operating Frequency (MHz) 16.4 Receive Antennae 16 Frequency Scanning (KHz) 250 Peak Power (W) 30 Average Power (W) 30 Baseline Distance (km) 55
Table 1: WERA Operating parameters in SE Florida.
WERA System / Crandon Park →
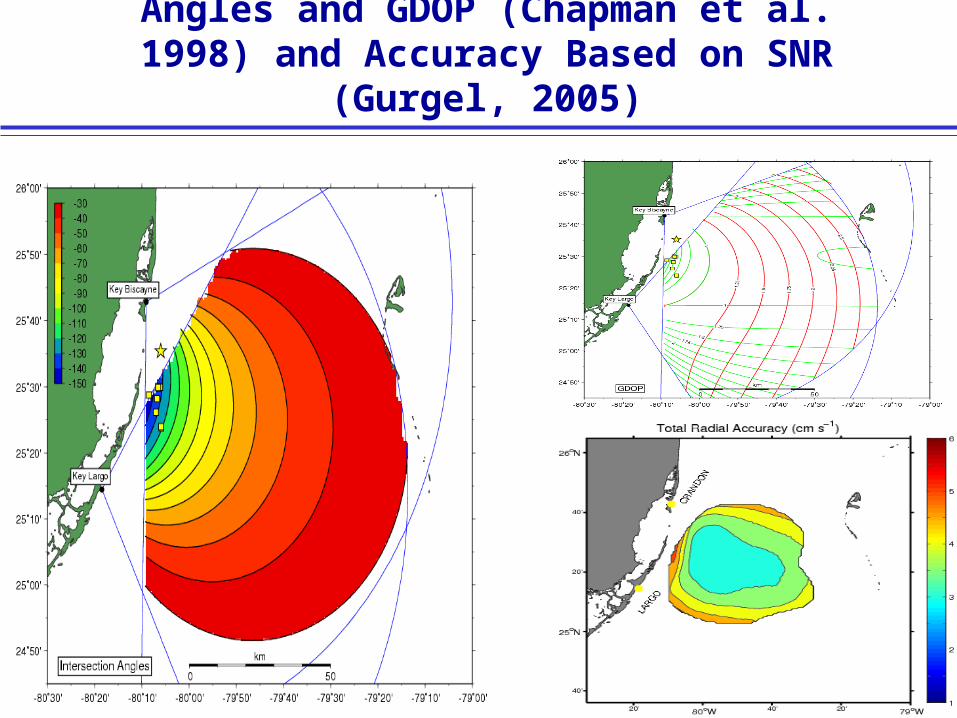
Angles and GDOP (Chapman et al. 1998) and Accuracy Based on SNR (Gurgel, 2005)

Performance and Measurement Grid
Frances and Wilma-Longest Down Time - Domain and Distribution of Good Data
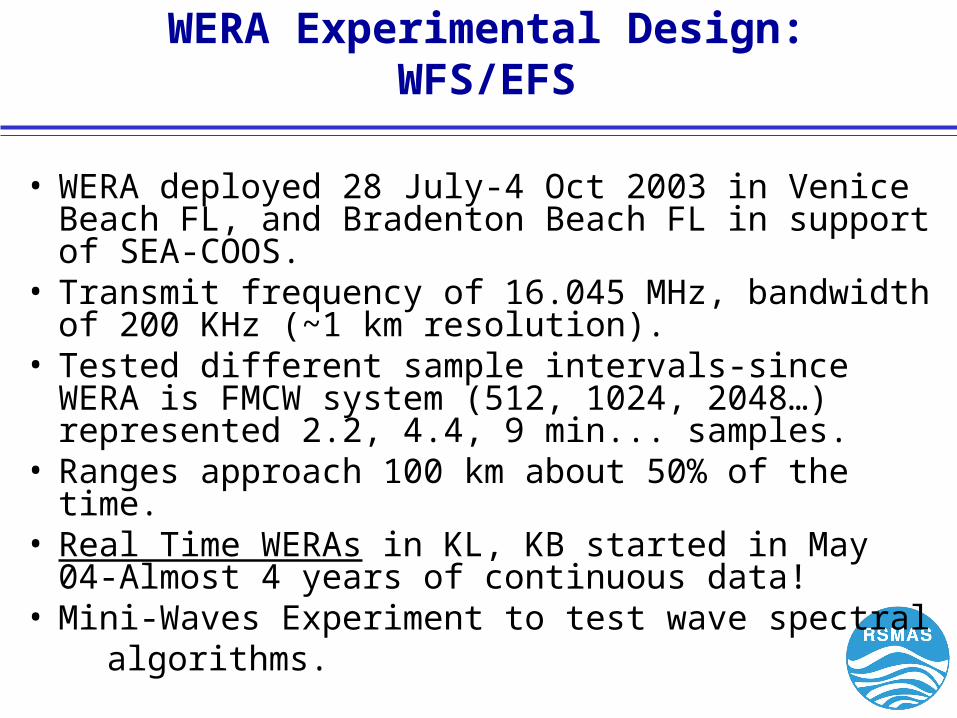
WERA Experimental Design: WFS/EFS
• WERA deployed 28 July-4 Oct 2003 in Venice Beach FL, and Bradenton Beach FL in support of SEA-COOS.
• Transmit frequency of 16.045 MHz, bandwidth of 200 KHz (~1 km resolution).
• Tested different sample intervals-since WERA is FMCW system (512, 1024, 2048…) represented 2.2, 4.4, 9 min... samples.
• Ranges approach 100 km about 50% of the time.• Real Time WERAs in KL, KB started in May 04-Almost
4 years of continuous data! • Mini-Waves Experiment to test wave spectral algorithms.

WERA (blue) and 14-m (black)ADCP Record: Submesoscale Event 2
Dec 04 – Feb 05

Current &Current Acceleration (x 104 cm s-2).

Mini-Waves Experiment, Spring 2005.
Fowey CMAN

Directional Wave Spectra During Jeanne (04)

Wind Directions and Wind Speed Comparisons at Fowey Rocks During Jeanne:24-25 Sept 2004
Wind Speeds Wind Directions

Estimation of Cd at Fowey Rocks CMAN Stations
Following Jarosz (Science, 2007)
)1(H
rU
HfV
t
U sx
)2(.
H
rUfV
t
U
WW
HC
xair
D
where ρ is a reference density (1025 kg m), f is the Coriolis
parameter, U and V are the depth-integrated along-shelf and
cross-shelf velocity components, H is the water depth, r is a
constant resistance coefficient at the sea floor, and τsx is the
cross-shelf wind stress.
Note the wind stress (τsx in (1)) is defined as :
xDairsx WWC
where Wx is the cross-shelf wind velocity component following
Jarosz et al. (2006) using the Ivan data.

Summary of Progress from ~4 Years of Measurements:
EFS Deployment sensing ~100 km about 50% of the time, 80 km more than 80% of the time.
Radar sites must be hardened to withstand severe hurricane conditions (i.e. GCOOS and SECOORA) with its power (generators) and built-in redundancy (Stakeholders!).
State funding extends the footprint northward using 12.5 MHz transmit frequency system would yield 120 km-past Bimini:
• Provide high-res surface current and wave data for the US Navy’s Acoustic Observatory;• Assess interoperability issues by sensing a domain with a 25 MHz Sea Sonde.
Central to the design/implementation of a National Network of HF Radars and an IOOS. Improve Hs and directional wave spectra algorithms (compare to wave buoy measurements).
Linkages to marine surface winds and waves (momentum fluxes).
Wind-driven current response forces water toward the coast during hurricane landfall which causes the water to rise (i.e. surge). Opportunity to assess surge models.