lyra calibration drb meeting estec 15 june 2007 lyra the lyman-alpha radiometer onboard proba-2
TRANSCRIPT
LYRA CalibrationLYRA Calibration
DRB Meeting ESTEC 15 June 2007
LYRAthe Lyman-alpha Radiometer onboard PROBA-2

Contents
1. Radiometric Model 2. Calibration Software 3. Flatfields 4. Off-Pointing 5. LEDs, Dark Currents 6. Integration Time 7. Stability Conclusions

1. Radiometric Model: Calibration Procedure
Telemetry from spacecraft:LUMPSunpacking, decompression => [cnt]exposure time => [Hz] fixed---------------------------------------------------------------------------------------------------Instrumental effects: variableVoltage-Frequency-Converter (VFC) => [V]resistance => [A]off-pointing, degradation, drift, dark current, dead time (+/- %) => [A]Conversion to (solar) physical units:absolute radiometric calibration => [Wm-2]

1. Radiometric Model: Selected Configurations
filter detector nominal FWHM measured
1-11-1 Ly XN + MSM12 121.5 +/- nm 116-126 nm1-21-2 Herzberg + PIN10 200-220 nm 197-218 nm1-31-3 Aluminium + MSM11 17-80 nm (1)-2.4, 17-35 nm1-41-4 Zr (300nm) + AXUV20D 1-20 nm (1)-1.3, 6-15 nm
2-12-1 Ly XN + MSM21 121.5 +/- nm 116-126 nm2-22-2 Herzberg + PIN11 200-220 nm 199-219 nm2-32-3 Aluminium + MSM15 17-80 nm (1)-1.4, 17-27 nm2-42-4 Zr (150nm) + MSM19 1-20 nm (1)-1.3, 6-12 nm
3-13-1 Ly N+XN + AXUV20A 121.5 +/- nm 116-126 nm3-23-2 Herzberg + PIN12 200-220 nm 198-219 nm3-33-3 Aluminium + AXUV20B 17-80 nm (1)-2.4, 17-35 nm3-43-4 Zr (300nm) + AXUV20C 1-20 nm (1)-1.3, 6-15 nm

1. Radiometric Model: Measured Responsivity

1. Radiometric Model: Simulation of Sample Spectra

[LYRA 1-1 rest signal / nA] = 0.015 * [LYRA 1-2 total signal / nA]
[LYRA 1-1 pure signal / nA] = [LYRA 1-1 total signal / nA] - [LYRA 1-1 rest signal / nA]
["Lyman-alpha" solar signal / (W m-2)] = 0.0975 * [LYRA 1-1 pure signal / nA]
2. Calibration Software: Example Lyman-alpha Channel 1-1

[LYRA 1-4 pure signal / nA] = [LYRA 1-4 total signal / nA]
["Zirconium" solar signal / (W m-2)] = interp[LYRA 1-4 pure signal / nA]
2. Calibration Software: Example Zirconium Channel 1-4

3. Flatfields: Orientation
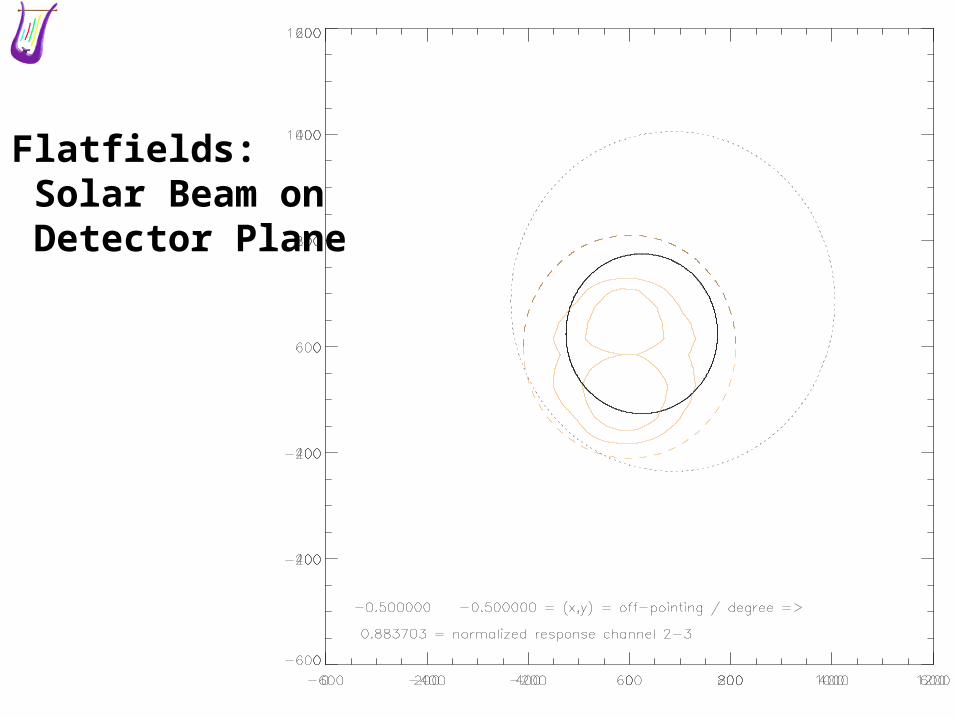
3. Flatfields: Solar Beam on Detector Plane

4. Off-Pointing: Simulation
e.g. spatial responsivity channel 1-3:

4. Off-Pointing: Consequences
Simulation of off-pointing effects -25% with 1 degree off-pointing -1% with 5 arcmin off-pointing (jitter?) Negligible with 10 or 20 arcsec off-pointing Generalize for possible roll TBD Details TBD
Commissioning phase Confirm simulation results with off-pointing tests Establish nominal pointing together with SWAP Determine functional relationship between off-pointing and
necessary deduction for calibration (fixed table)

from test with heads 1 and 2.
Visual LEDs commanded approx. every 270 ms,data sampled with 20 msintegration time
5. LEDs, Dark Currents: Sample Pulses

Averaged pulses, and fits of their decay phase, from test with heads 1 and 2
MSM and AXUV detectorscan all be fitted well;time constants are similar.PIN detectors cannot befitted this way.
Final averages or fittedplateau values can be usedto estimate dark currentor LED response, resp.
5. LEDs, Dark Currents: Estimates

6. Integration Time: Fluctuations
Long integration times (> 0.2 s): (Ir)regular fluctuations,0.05% - 0.1%around trend
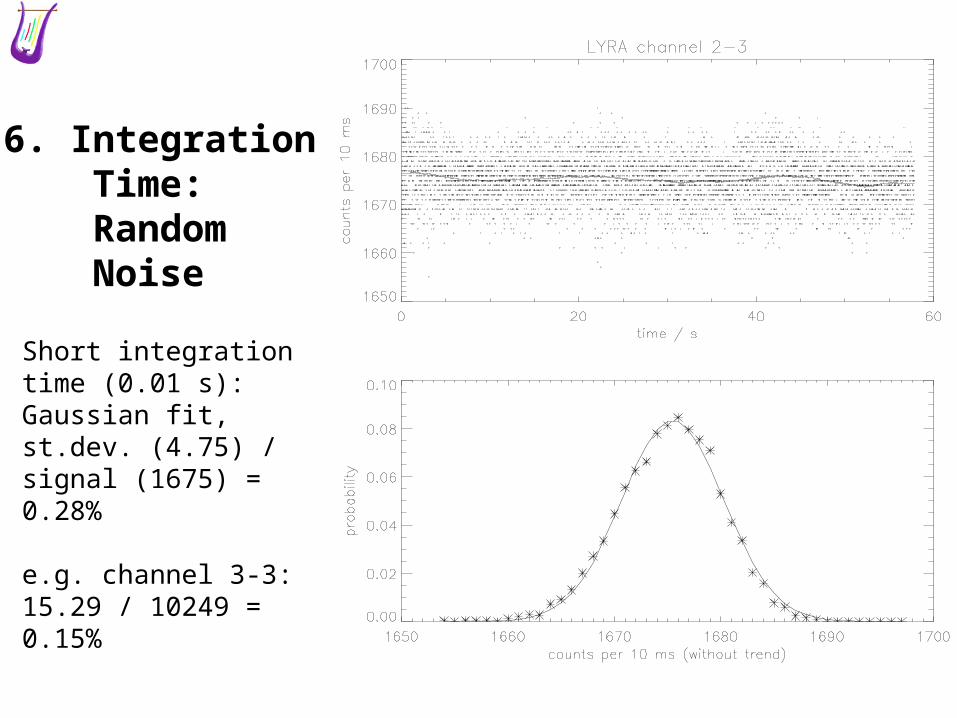
6. Integration Time: Random Noise
Short integrationtime (0.01 s):Gaussian fit,st.dev. (4.75) /signal (1675) =0.28%
e.g. channel 3-3:15.29 / 10249 =0.15%

6. Integration Time: Dead Time Correction
dead time: 10.5807 microsecondsmax. correction (at 0.01 s integration time): 0.1%
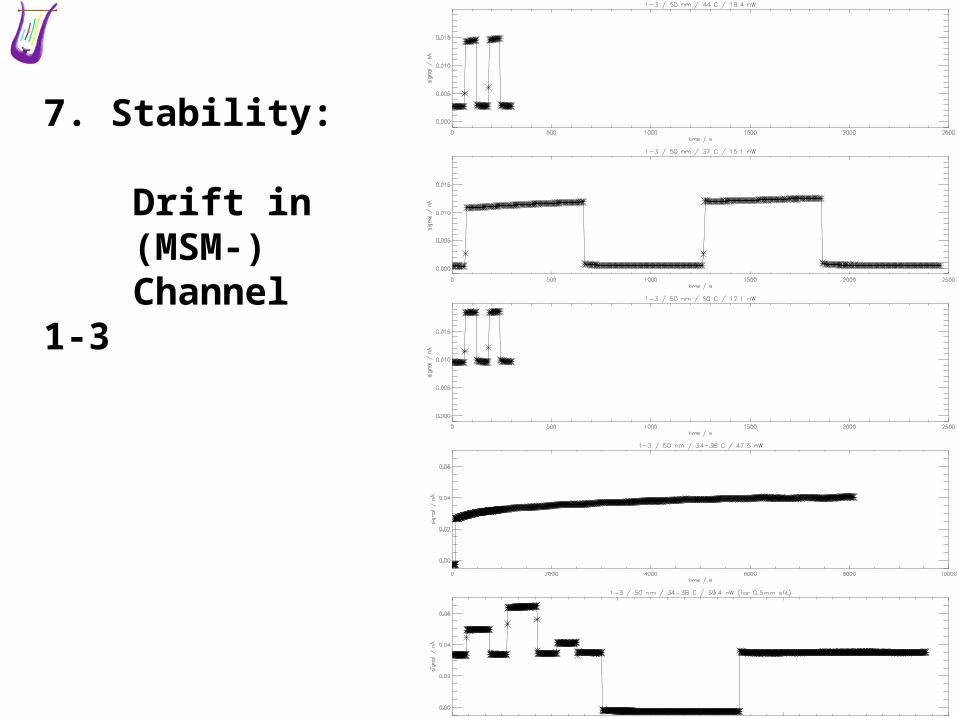
7. Stability: Drift in (MSM-) Channel 1-3
Conclusions
Calibration concept, software: basically ready
Updates: latest test results, new sample spectra, details
Cross-calibration during commissioning phase, degradation?