m. a. de avillez and d. breitschwerdt- global dynamical evolution of the ism in star forming...
TRANSCRIPT
8/3/2019 M. A. de Avillez and D. Breitschwerdt- Global dynamical evolution of the ISM in star forming galaxies I. High resolution 3D simulations: Effect of the magnetic field
http://slidepdf.com/reader/full/m-a-de-avillez-and-d-breitschwerdt-global-dynamical-evolution-of-the-ism 1/16
A&A 436, 585–600 (2005)DOI: 10.1051 / 0004-6361:20042146c ESO 2005
Astronomy&
Astrophysics
Global dynamical evolution of the ISM in star forming galaxies
I. High resolution 3D simulations: Effect of the magnetic field
M. A. de Avillez1 and D. Breitschwerdt2
1 Department of Mathematics, University of Évora, R. Romão Ramalho 59, 7000 Évora, Portugale-mail: [email protected]
2 Institut für Astronomie, Universität Wien, Türkenschanzstr. 17, 1180 Wien, Austriae-mail: [email protected]
Received 8 October 2004 / Accepted 31 January 2005
Abstract. In star forming disk galaxies, matter circulation between stars and the interstellar gas, and, in particular the energyinput by random and clustered supernova explosions, determine the dynamical and chemical evolution of the ISM, and hence of the galaxy as a whole. Using a 3D MHD code with adaptive mesh refinement developed for this purpose, we have investigatedthe rôle of magnetized matter circulation between the gaseous disk and the surrounding galactic halo. Special emphasis hasbeen put on the eff ect of the magnetic field with respect to the volume and mass fractions of the diff erent ISM “phases”, therelative importance of ram, thermal and magnetic pressures, and whether the field can prevent matter transport from the diskinto the halo. The simulations were performed on a grid with an area of 1 kpc2, centered on the solar circle, extending ±10 kpcperpendicular to the galactic disk with a resolution as high as 1.25 pc. The simulations were run for a time scale of 400 Myr,sufficiently long to avoid memory eff ects of the initial setup, and to allow for a global dynamical equilibrium to be reached incase of a constant energy input rate. The main results of our simulations are: (i) The T ≤ 103 K gas is mainly concentrated
in shock compressed layers, exhibiting the presence of high density clouds with sizes of a few parsecs and T ≤ 200 K. Thesestructures are formed in regions where several large scale streams of convergent flow (driven by SNe) occur. They have lifetimesof a few free-fall times, are filamentary in structure, tend to be aligned with the local field and are associated with the highestfield strengths; (ii) the magnetic field has a high variability and it is largely uncorrelated with the density, suggesting that it isdriven by superalfvenic inertial motions; (iii) ram pressure controls the flow for 200 < T ≤ 105.5 K. For T ≤ 200 K magneticpressure dominates, while the hot gas (T > 105.5 K) in contrast is controlled by the thermal pressure, since magnetic field linesare swept towards the dense compressed walls; (iv) up to 49% of the mass in the disk is concentrated in the classical thermallyunstable regime 200 < T ≤ 103.9 K with ∼65% of the warm neutral medium (WNM) mass enclosed in the 500 ≤ T ≤ 5000 Kgas, consistent with recent observations; (v) the volume filling factors of the diff erent temperature regimes depend sensitivelyon the existence of the duty cycle between the disk and halo, acting as a pressure release mechanism for the hot phase in thedisk. We find that in general gas transport into the halo in 3D is not prevented by an initial disk parallel magnetic field, butonly delayed initially, for as long as it is needed to punch holes into the thick magnetized gas disk. The mean volume fillingfactor of the hot phase in the disk is similar in HD and MHD (the latter with a total field strength of 4.4 µG) runs, amounting to
∼17
−21% for the Galactic supernova rate.
Key words. magnetohydrodynamics (MHD) – galaxies: ISM – ISM: evolution – ISM: bubbles – ISM: supernova remnants –ISM: structure
1. Introduction
The evolution of galaxies is largely dependent on the physi-cal and chemical state of the interstellar medium and thus onthe rate at which they can form stars. This immediately raisesthe question of the structure of the ISM, i.e. the distributionof gas in so-called phases, thought to be stable regions in the
p−V -diagram, with respect to entropy perturbations.A detailedinventory and estimate of timescales of heating and coolingprocesses suggested the presence of a two (Field et al. 1969)– and after the widespread interstellar O had been
discovered – a three phase ISM (e.g. McKee & Ostriker 1977),consisting of a cold, warm and hot component in pressure equi-librium. Since the hot intercloud medium is pervasive, it wasdeemed possible that it could fill a galactic corona as had beensuggested by Spitzer (1956) in order to confine high velocityclouds. Observationally it was difficult to determine reliablyvolume filling factors for these phases in our Galaxy due to theobservational vantage point. However, it became evident thatthe small surface coverage of H holes in external galaxies (e.g.Brinks & Bajaja 1986) argues for a much lower volume fill-ing factor of the hot phase there. Since at the same time the
A r t i c l e p u b l i s h e d b y E D P S c i e n c e s a n d a v a i l a b l e a t h t t p : / / w w w . e d p s c i e n c e s . o r g / a a o r h t t p : / / d x . d o i . o r g / 1 0 . 1 0 5 1 / 0 0 0 4 - 6 3 6 1 : 2 0 0 4 2 1 4 6
8/3/2019 M. A. de Avillez and D. Breitschwerdt- Global dynamical evolution of the ISM in star forming galaxies I. High resolution 3D simulations: Effect of the magnetic field
http://slidepdf.com/reader/full/m-a-de-avillez-and-d-breitschwerdt-global-dynamical-evolution-of-the-ism 2/16
586 M. A. de Avillez and D. Breitschwerdt: High resolution 3D simulations of the ISM. I.
extended H (Lockman 1984) and H (Reynolds 1985) layersof the Milky Way were discovered, it seemed plausible thatbreak-out of supernova remnants (SNRs) was inhibited (unlessthey occurred at a significant height above the disk) and onlythe most energetic superbubbles (SBs) with at least 800 SNe inconcert (see Koo & McKee 1992) would achieve blow-out of the disk. Things might even become worse, once a disk parallelmagnetic field is considered, which according to observationsshould have a regular component of the order of 3 µG or evenhigher (s. Beck 2004). If the scale height of the field is infinite,then bubbles should stall accordingto Tomisaka (1998) alreadyfor a moderate stellar OB association of about 50 members.
On the other hand, owing to the high sensitivity andlarge throughput of the ROSAT XRT (Trümper 1983) and itsPSPC instrument, a number of normal spiral galaxies with softX-ray halos were detected, e.g. NGC 891 (Bregman & Pildis1994) and NGC 4631 (Wang et al. 1995; Vogler & Pietsch
1996). In some cases, even local correlations between Hα, ra-dio continuum and soft X-rays were found (see Dettmar 1992),arguing for local outflows as it had been suggested in theGalactic fountain (Kahn 1981), chimney (Norman & Ikeuchi1989) and the Galactic wind model (Breitschwerdt et al. 1991;Breitschwerdt & Schmutzler 1994). However, until a few yearsago it was not possible to undertake an extended 3D numer-ical study in order to follow the evolution of ISM structureson small and large scales simultaneously, as was done for thefountain by Avillez (1998). Recently, Korpi et al. (1999) havenumerically studied the evolution of superbubbles in a magne-tized disk and found that blow-out is much more likely thanpreviously thought, mainly because bubbles evolve in an in-homogeneous background medium. Their 3D simulations arehowever limited by the usage of a small grid (1 kpc perpendicu-lar to the disk), so that theywere able to followonly the onset of a supernova disturbed ISM for a short timescale of ≤100 Myr.As a consequence, these results still bear the imprint of the ini-tial conditions, and the development of a disk-halo cycle couldnot be followed.
It is a fortunate coincidence that exactly 100 years afterthe discovery of the ISM by stationary Ca lines (Hartmann1904), we are now for the first time in the position to give adetailed picture of the structure and evolution of the ISM onthe scale of parsecs and below, that seems to converge (i.e.,
does not change substantially by merely increasing the numer-ical resolution). Our contribution here is to have carried outlarge scale high resolution 3D simulations of the ISM that in-clude the Galactic magnetic field, background heating due tostarlight and allow for the establishment of the duty-cycle be-tween the disk and halo (commonly known as galactic foun-tain) by using a grid that extends up to 10 kpc on either side of the midplane. Our simulations capture both the largest struc-tures (e.g., superbubbles) together with the smaller ones (e.g.,filaments and eddies) down to 1.25 pc. We investigate, amongother things, the variability of the magneticfield in the Galacticdisk and its correlation with the density, the rôle of ram pres-
sure in the dynamics of disk gas and the relative weight of theram, thermal and magnetic pressures, the mass distribution andthe volume filling factors of the diff erent temperature regimesin the ISM. Other important issues like the variation of the
volume filling factors of the ISM “phases” with energy injec-tion rate by SNe, the dynamics of the galactic fountain, theconditions for dynamical equilibrium and the importanceof convergence of these results with increasing grid reso-lution have been treated in Avillez (2000) and Avillez &Breitschwerdt (2004, hereafter Paper I).
The outline of the present paper is as follows: in Sect. 2 themodel andnumerical setup used in the simulations is presented;Sect. 3 deals with the most important results obtained in theseMHD simulations, their interpretation, and comparison withthose in corresponding HD runs described in Paper I. In Sect. 4a discussion of the results and comparison with other models iscarried out. Section 5 closes the paper with a summary of themain results and some final remarks on future work.
2. Model and simulations
We have run high resolution kpc-scale MHD simulations of the ISM, driven by SNe (with a canonical explosion energyof 1051 erg) at the Galactic rate, on a Cartesian grid of 0 ≤( x, y) ≤ 1 kpc size in the Galactic plane and extending −10 ≤
z ≤ 10 kpc into the halo. These runs use a modified versionof the model described in Avillez (2000) coupled to a three-dimensional numerical AMR scheme that uses the MHD ex-tension of the Piecewise Parabolic Method (Dai & Woodward1994, 1998) and the grid refinement procedure discussed inBalsara (2001) assuring that B is divergence-free during therefinement process and simulation time. The complete set of MHD equations that are solved numerically can be written inthe conservative form∂ρ
∂t + ∇·Π = S ρ (conservation of mass), (1)
∂Π
∂t + ∇·T = S Π (conservation of momentum), (2)
∂ E
∂t + ∇·U = S E (conservation of energy), (3)
∂ B
∂t + ∇·Y = 0 (conservation of magnetic flux), (4)
whereΠ = ρu is the mass flux, T = ρuu +
Pth + 12 B2
I − BB
is the stress tensor, E = 12 ρu2 + ρΦ + 1
γ −1 Pth + 12 B2 is the total
energy flux density, U = 12 ρu2 + ρΦ +
γ
γ
−1 Pthu+ B2u
−u
· BB
is the energy flux density and Y = uB − Bu. In these equations B, u, Φ and Pth represent the magnetic field vector, velocityvector, Galactic gravitational field and the thermal pressure, re-spectively. The latter is related to the gas internal energy den-sity (eth) by Pth = (γ −1)eth, with γ = 5/3. S ρ, S Π and S E are themass, momentum and energy sources, respectively: S ρ =
∆ M SN∆t
reproduces the injection of mass per unit volume, ∆ M SN, bysupernovae at instant time ∆t ; S Π = − ρ∇Φ +
∆ΠSN
∆t describes
the motion of the gas in the gravitational field and the momen-tum injection per unit volume, ∆ΠSN, by SNe at instant ∆t ; andS E = Γ( z) − Λ +
∆ E SN∆t
describes the energy gains due to back-ground heating, Γ( z), due to starlight varying with z (Wolfire
et al. 1995) and SNe energy injection per unit volume, ∆ E SN, atinstant time ∆t and the loss of energy by radiative cooling, Λ,assuming that the gas is optically thin and in collisional ion-ization equilibrium. The presence of background heating leads
A r t i c l e p u b l i s h e d b y E D P S c i e n c e s a n d a v a i l a b l e a t h t t p : / / w w w . e d p s c i e n c e s . o r g / a a o r h t t p : / / d x . d o i . o r g / 1 0 . 1 0 5 1 / 0 0 0 4 - 6 3 6 1 : 2 0 0 4 2 1 4 6

8/3/2019 M. A. de Avillez and D. Breitschwerdt- Global dynamical evolution of the ISM in star forming galaxies I. High resolution 3D simulations: Effect of the magnetic field
http://slidepdf.com/reader/full/m-a-de-avillez-and-d-breitschwerdt-global-dynamical-evolution-of-the-ism 3/16
M. A. de Avillez and D. Breitschwerdt: High resolution 3D simulations of the ISM. I. 587
here to the formation in the ISM of thermally stable regimes atT ≤ 200 K and 103.9 < T ≤ 104.2 K.
The model includes supernovae types Ia (randomly dis-tributed in the space and having a scale height of 325 pc)and II (randomly distributed or clustered in OB associationsformed in regions with density and temperature thresholds of n ≥ 10 cm−3 and T ≤ 100 K, respectively). The number andmasses of the OB stars are determined by an appropriate IMFfollowing Massey et al. (1995); each star explodes after itsmain sequence lifetime has elapsed, using a time estimate byStothers (1972). The trajectories of all O and B stars are fol-lowed kinematically by attributing to each a random velocityat time of formation so that the location of each exploding staris known at any time. For further details we refer to Paper I.The initial conditions comprise the setup of (i) the fixed verti-cal gravitational field Φ provided by the stars in the disk; of (ii)the interstellar gas having a density stratification distribution
that includes the cold, cool, warm, ionized and hot “phases” inthe Galaxy; and (iii) a magnetic field with uniform and randomcomponents given by Bu = ( Bu,0(n( z)/n0)1/2, 0, 0) and δ B = 0,respectively; here Bu,0 = 3 µG is the uniform component fieldstrength at the Galactic midplane, n( z) is the number density of the gas as a function of distance from the Galactic midplane,where it has a value of n0 = 1 cm−3. Periodic boundary con-ditions are applied along the boundaries perpendicular to theGalactic plane (i.e., the z-direction), while outflow boundaryconditions are imposed at the top ( z = 10 kpc) and bottom( z = −10 kpc) surfaces (parallel to the galactic plane). The res-olution in the grid varies on the fly according to density and / orpressure gradients thresholds with 1.25 pc being the highestresolution of three levels of refinements, achieved in the region| z| ≤ 1 kpc, while on the rest of the domain the finest resolu-tion is 2.5 pc (two levels of refinement). The resolution of thecoarse grid is 10 pc.
3. Results
3.1. Global evolution
The initial evolution of the disk and halo gases is characterizedby the build-up of the random component of the magnetic fieldin addition to the establishment of the duty disk-halo-diskcycle
(see Paper I). The random field component is generated duringthe first 15 Myr as a result of turbulent motions mainly inducedby shear flows due to SN explosions. For the remainder of theevolution time the random field component and the mean fieldoscillate around their mean values of 3.2 and 3.1 µG (Fig. 1),respectively, and the average total field strength amounts to Btot =
B2
u + (δ B)2 4.45 µG. The build-up of the disk pres-sure by supernovae and the establishment of the duty cycle, issimilar to that seen in the HD runs discussed in Paper I (seealso Avillez 2000), that is, the initially stratified distributiondoes not hold for long as a result of the lack of equilibriumbetween gravity and (thermal, kinetic and turbulent) pressure
during the “switch-on phase” of SN activity. As a consequencethe gas in the upper and lower parts of the grid collapses ontothe midplane, leaving low density material behind. However, inthe MHD run it takes a longer time for the gas to descend
0 100 200 300 400t [Myr]
2.5
3
3.5
4
4.5
5
B ,
B m e a n
, B
t o t
[ µ G ]
δBB
mean
Btot
Fig. 1. Time evolution of the random field component (red), the mean
field (green) and total field strength (black).
towards the disk. The complete collapse onto the midplane, likein the hydrodynamical (HD) case, is prevented as a result of the opposing magnetic pressure and tension forces. As soon asenough SNe have gone off in the disk building up the requiredpressure support, transport into the halo is not prevented, al-though the escape of the gas takes a few tens of Myr to occur– somewhat longer than in the pure HD case. The crucial pointis that a huge thermal overpressure due to combined SN ex-plosions can sweep the magnetic field into dense filaments andpunch holes into the extended warm and ionized H layers asseen in Fig. 2, which shows the density and magnetic field dis-tribution in a plane perpendicular to the Galactic midplane attime t = 221.9 Myr (the warm neutral and ionized H gases arethe light blue and greenish regions seen in the density distribu-tion). Once such pressure release valves have been set up, thereis no way from keeping the hot overpressured plasma to followthe pressure gradient into the halo. As a consequence, trans-port into the halo is not prevented and the duty disk-halo-diskcycle of the hot gas is fully established, in which the compe-tition of energy input and losses into the ISM by SNe, diff useheating, radiative cooling and magnetic pressure leads the sys-tem to evolve into a dynamical equilibrium state within a few
hundred Myr (for an analytical estimate see Paper I). This timescale is considerably longer than that quoted in other papers(e.g., Korpi et al. 1999; Kim et al. 2001), because these au-thors do not take the galactic fountain into account. The ver-tical structure of the thick disk and halo is addressed in moredetail in a forthcoming paper.
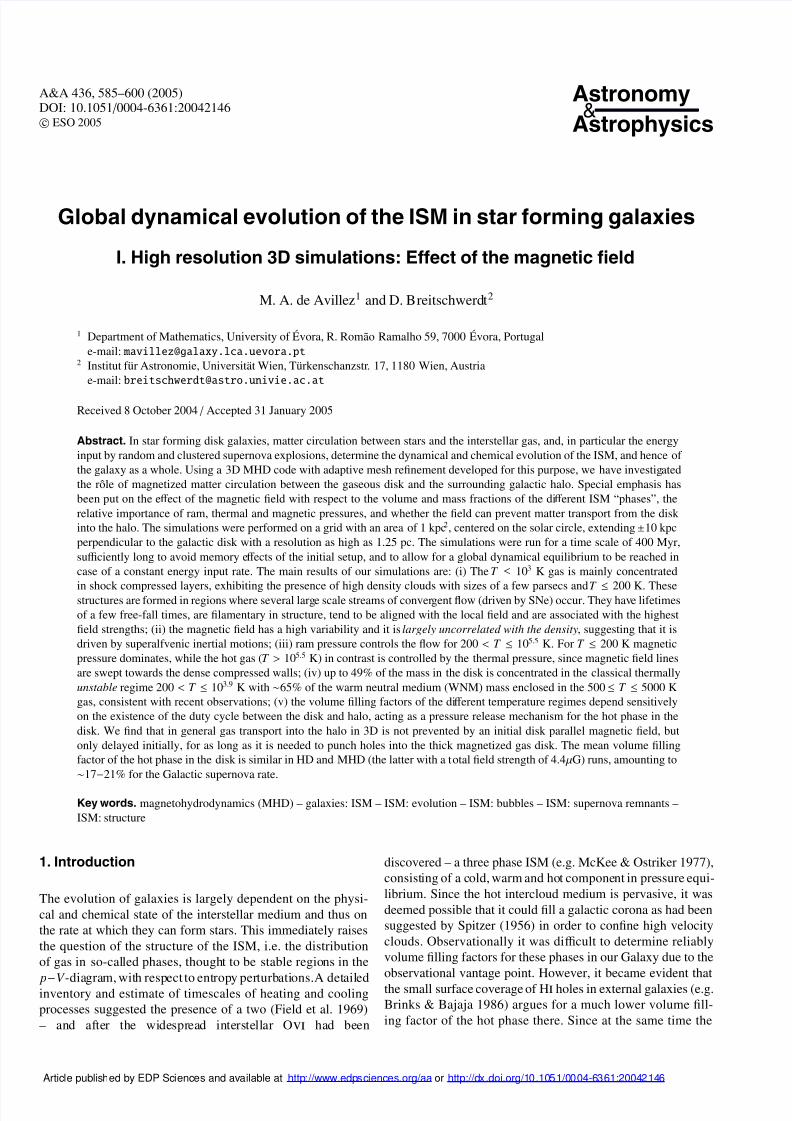
Figure 3 shows slices of the three-dimensional data cubeof the density, temperature, pressure P/k , and magnetic fielddistributions in the Galactic midplane at 358 Myr of evolutionwith a resolution of 1.25 pc. We can directly compare the mor-phology of the ISM between this run and the similar HD rundiscussed in Paper I. In both cases the highest density (and
lowest temperature, if the gas had enough time to cool) gastends to be confined into sheet-like structures (filaments in 2D)which constitute shock compressed layers (SCLs) as a resultof the compression by shocks mainly driven by SNe in their
A r t i c l e p u b l i s h e d b y E D P S c i e n c e s a n d a v a i l a b l e a t h t t p : / / w w w . e d p s c i e n c e s . o r g / a a o r h t t p : / / d x . d o i . o r g / 1 0 . 1 0 5 1 / 0 0 0 4 - 6 3 6 1 : 2 0 0 4 2 1 4 6
8/3/2019 M. A. de Avillez and D. Breitschwerdt- Global dynamical evolution of the ISM in star forming galaxies I. High resolution 3D simulations: Effect of the magnetic field
http://slidepdf.com/reader/full/m-a-de-avillez-and-d-breitschwerdt-global-dynamical-evolution-of-the-ism 4/16
588 M. A. de Avillez and D. Breitschwerdt: High resolution 3D simulations of the ISM. I.
Fig. 2. Two-dimensional slices through the three-dimensional data cube showing the vertical (perpendicular to the midplane) distribution of thedensity (left panel) and magnetic field (right panel) at time t = 221.9 Myr. The mean field in the midplane is 3 .1 µG. The z-scale above 0.5and below −0.5 kpc is shrunk (in order to fit the paper size) and thus, the distribution of the labels is not uniform. Red in the density maprefers to lowest density (and thus highest temperature if in pressure equilibrium), while dark blue refers to the highest density (and thus lowesttemperature). In the magnetic field image red / blue correspond to the highest / lowest strength. The left panel shows the presence of a wiggly andthin disk of cold gas overlayed by a frothy thick diskcomposed of neutral (light blue) and ionized (greenish) gas. The expansion of superbubblescan be nicely seen, especially in the southern hemisphere. The magnetic field map shows the thin magnetized disk overlayed by loops of fieldlines, magnetic islands, and clouds wrapped in field lines moving downwards. From these maps it can be immediately seen that the simulationsmust take into account large heights on either side of the midplane, allowing for the setup of the disk-halo-disk circulation.
neighbourhood.The SCL structures are thicker in the MHD runthan in the HD run, because the compression of a shock wave
at given Mach number is less as energy has now to be sharedbetween gas and magnetic field. The T < 103 K gas in theMHD run tends to be aligned with the magnetic field, while in
the HD run there is no preferred orientation. The highest den-sities up to 800 cm−3, observed in both runs occur in regions
where several streams of convergent flow meet. The orientationof these streams is random. We note in passing, that if cloudsare hit by SCLs from random directions, turbulence in the
A r t i c l e p u b l i s h e d b y E D P S c i e n c e s a n d a v a i l a b l e a t h t t p : / / w w w . e d p s c i e n c e s . o r g / a a o r h t t p : / / d x . d o i . o r g / 1 0 . 1 0 5 1 / 0 0 0 4 - 6 3 6 1 : 2 0 0 4 2 1 4 6

8/3/2019 M. A. de Avillez and D. Breitschwerdt- Global dynamical evolution of the ISM in star forming galaxies I. High resolution 3D simulations: Effect of the magnetic field
http://slidepdf.com/reader/full/m-a-de-avillez-and-d-breitschwerdt-global-dynamical-evolution-of-the-ism 5/16
M. A. de Avillez and D. Breitschwerdt: High resolution 3D simulations of the ISM. I. 589
Fig. 3. Two-dimensional slices through the three-dimensional data set at z = 0 (Galactic midplane), showing density (top left panel), temperature(top right panel), pressure P/k (bottom left panel), and magnetic field (bottom right panel) after 358 Myr of evolution. Colour bars indicate thelogarithmic scale of each quantity. Red refers to lowest density, highest temperature and pressure, while dark blue refers to the highest densityand lowest temperature and pressure. In the magnetic field image red / blue correspond to the highest / lowest strength. Direct visual inspectionshows a strong inverse spatial correlation between gas density and temperature (although the pressure diagram is still far from uniform), whereas
the correlation between magnetic field strength and gas density is only present for the cold dense regions. For higher temperature regions thiscorrelation becomes rather poor and vanishes completely for the hot gas (s. Fig. 4).
interior is generated. Tapping the turbulent ISM energy reser-voir, which is huge, represents a neat way of sustaining super-sonic turbulence inside molecular clouds, which as it is known,dissipates very efficiently. We will explore this idea in moredetail in a forthcoming paper.
In the MHD run cold denser regions are dominated by themagnetic field and are more filamentary in structure than lowdensity regions (which have low field strengths, although, as
seen in Fig. 4, a wide range of B-field strengths is spanned)due to the anisotropy introduced by the strong field, which ismuch better correlated with the gas density for lower than forhigher temperature gas.
3.2. Evolution of supernova remnants
and superbubbles in the magnetized ISM
The evolution of magnetized SNRs and SBs has been exten-sively studied in the literature (see e.g. Kulsrud et al. 1965;Summers 1975; Guiliani 1982). In particular the question of break-out has been addressed in numerical studies by Tomisaka
(1990) and Mineshige et al. (1993), who both come to the con-clusions that bubbles could be confined to the gaseous disk.Since this is in disagreement with our simulations we will dis-cuss the subject of SB evolution (which includes SNRs as a
A r t i c l e p u b l i s h e d b y E D P S c i e n c e s a n d a v a i l a b l e a t h t t p : / / w w w . e d p s c i e n c e s . o r g / a a o r h t t p : / / d x . d o i . o r g / 1 0 . 1 0 5 1 / 0 0 0 4 - 6 3 6 1 : 2 0 0 4 2 1 4 6
8/3/2019 M. A. de Avillez and D. Breitschwerdt- Global dynamical evolution of the ISM in star forming galaxies I. High resolution 3D simulations: Effect of the magnetic field
http://slidepdf.com/reader/full/m-a-de-avillez-and-d-breitschwerdt-global-dynamical-evolution-of-the-ism 6/16
590 M. A. de Avillez and D. Breitschwerdt: High resolution 3D simulations of the ISM. I.
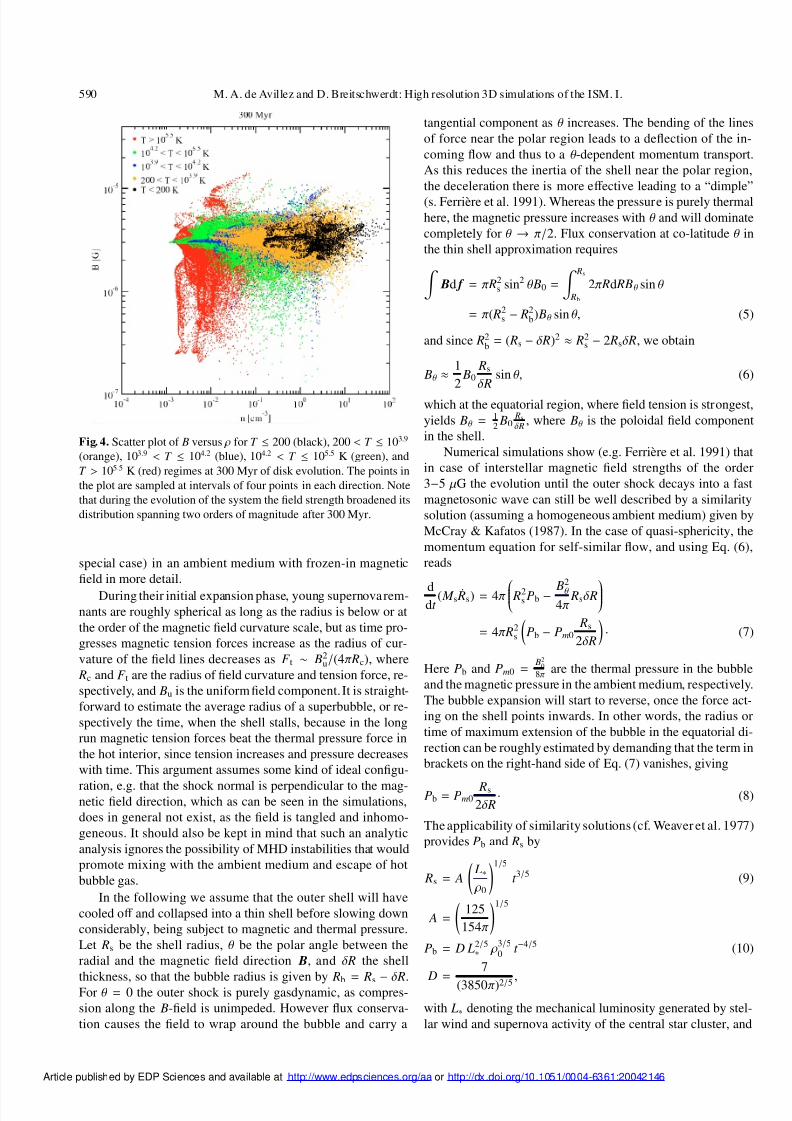
Fig. 4. Scatter plot of B versus ρ for T ≤ 200 (black), 200 < T ≤ 103.9
(orange), 103.9 < T ≤ 104.2 (blue), 104.2 < T ≤ 105.5 K (green), andT > 105.5 K (red) regimes at 300 Myr of disk evolution. The points inthe plot are sampled at intervals of four points in each direction. Notethat during the evolution of the system the field strength broadened itsdistribution spanning two orders of magnitude after 300 Myr.
special case) in an ambient medium with frozen-in magneticfield in more detail.
During their initial expansion phase, young supernovarem-nants are roughly spherical as long as the radius is below or atthe order of the magnetic field curvature scale, but as time pro-gresses magnetic tension forces increase as the radius of cur-vature of the field lines decreases as F t ∼ B2
u/(4π Rc), where Rc and F t are the radius of field curvature and tension force, re-spectively, and Bu is the uniformfield component. It is straight-forward to estimate the average radius of a superbubble, or re-spectively the time, when the shell stalls, because in the longrun magnetic tension forces beat the thermal pressure force inthe hot interior, since tension increases and pressure decreaseswith time. This argument assumes some kind of ideal configu-
ration, e.g. that the shock normal is perpendicular to the mag-netic field direction, which as can be seen in the simulations,does in general not exist, as the field is tangled and inhomo-geneous. It should also be kept in mind that such an analyticanalysis ignores the possibility of MHD instabilities that wouldpromote mixing with the ambient medium and escape of hotbubble gas.
In the following we assume that the outer shell will havecooled off and collapsed into a thin shell before slowing downconsiderably, being subject to magnetic and thermal pressure.Let Rs be the shell radius, θ be the polar angle between theradial and the magnetic field direction B, and δ R the shell
thickness, so that the bubble radius is given by Rb = Rs − δ R.For θ = 0 the outer shock is purely gasdynamic, as compres-sion along the B-field is unimpeded. However flux conserva-tion causes the field to wrap around the bubble and carry a
tangential component as θ increases. The bending of the linesof force near the polar region leads to a deflection of the in-coming flow and thus to a θ -dependent momentum transport.As this reduces the inertia of the shell near the polar region,the deceleration there is more eff ective leading to a “dimple”(s. Ferrière et al. 1991). Whereas the pressure is purely thermalhere, the magnetic pressure increases with θ and will dominatecompletely for θ → π/2. Flux conservation at co-latitude θ inthe thin shell approximation requires
Bd f = π R2s sin2 θ B0 =
Rs
Rb
2π Rd RBθ sin θ
= π( R2s − R2
b) Bθ sin θ, (5)
and since R2b = ( Rs − δ R)2 ≈ R2
s − 2 Rsδ R, we obtain
Bθ ≈12
B0 Rs
δ Rsin θ, (6)
which at the equatorial region, where field tension is strongest,yields Bθ = 1
2 B0Rsδ R
, where Bθ is the poloidal field componentin the shell.
Numerical simulations show (e.g. Ferrière et al. 1991) thatin case of interstellar magnetic field strengths of the order3−5 µG the evolution until the outer shock decays into a fastmagnetosonic wave can still be well described by a similaritysolution (assuming a homogeneous ambient medium) given byMcCray & Kafatos (1987). In the case of quasi-sphericity, themomentum equation for self-similar flow, and using Eq. (6),reads
ddt
( M s ˙ Rs) = 4π R2
s Pb − B2θ
4π Rsδ R
= 4π R2
s
Pb − Pm0
Rs
2δ R
· (7)
Here Pb and Pm0 =B2
08π
are the thermal pressure in the bubbleand the magnetic pressure in the ambient medium, respectively.The bubble expansion will start to reverse, once the force act-ing on the shell points inwards. In other words, the radius ortime of maximum extension of the bubble in the equatorial di-rection can be roughly estimated by demanding that the term inbrackets on the right-hand side of Eq. (7) vanishes, giving
Pb = Pm0 Rs
2δ R· (8)
The applicability of similarity solutions (cf. Weaver et al. 1977)provides Pb and Rs by
Rs = A
L∗ ρ0
1/5
t 3/5 (9)
A =
125
154π
1/5
Pb = D L2/5∗ ρ
3/50 t −4/5 (10)
D=
7
(3850π)2/5 ,
with L∗ denoting the mechanical luminosity generated by stel-lar wind and supernova activity of the central star cluster, and
A r t i c l e p u b l i s h e d b y E D P S c i e n c e s a n d a v a i l a b l e a t h t t p : / / w w w . e d p s c i e n c e s . o r g / a a o r h t t p : / / d x . d o i . o r g / 1 0 . 1 0 5 1 / 0 0 0 4 - 6 3 6 1 : 2 0 0 4 2 1 4 6
8/3/2019 M. A. de Avillez and D. Breitschwerdt- Global dynamical evolution of the ISM in star forming galaxies I. High resolution 3D simulations: Effect of the magnetic field
http://slidepdf.com/reader/full/m-a-de-avillez-and-d-breitschwerdt-global-dynamical-evolution-of-the-ism 7/16
M. A. de Avillez and D. Breitschwerdt: High resolution 3D simulations of the ISM. I. 591
ρ0 = const. is the ambient mass density. Since SNe are thedominant source for rich clusters one can use for a simple esti-mate, L∗ = N ∗ E SN/τMS = 3.17 N ∗ E 51/τ7 × 1036 ergs−1, where N ∗ is the number of supernovae, E SN and E 51, τMS and t 7 arethe supernova energy, also measured in 1051 erg, respectively,and the main sequence life time of the least massive star, alsoin units of 10 Myr, respectively.
To solve Eq. (8) we need an expression for the relative shellthickness, δ R. In the equatorial region, the pressure in the shellat later times will be dominated by magnetic pressure so thatmomentum conservation across the shock requires
ρ0 ˙ R2s B2
θ
8π, (11)
and using Eq. (6)
˙ R2s =
B20
32πρ0
Rs
δ R
2
sin2 θ
⇒ δ R
Rs=
1
2√
2
V A0
˙ Rssin θ, (12)
implicitlyassuming that the shock propagatesin an undisturbedambient medium, with V A0 =
B0√ 4πρ0
being the Alfvén speed
there. Equation (12) shows the thickening of the shell with timeas it decelerates, like δ R ∝ Rs/ ˙ Rs ∝ t :
δ R =5
6√
2V A0 t sin θ (13)
⇔ δ R = 1.2B−6 t 6√
n0sin θ pc, (14)
where n0, B−6 and t 6 denote the ambient number density inunits of cm−3, the ambient magnetic field strength in unitsof µG, and the time in Myr, respectively.
As long as the ambient thermal pressure is small comparedto the pressure inside the bubble and the magnetic pressure inthe shell, and combining Eqs. (10)−(12), and inserting theminto Eq. (8), we obtain for the time t max of maximum bubbleexpansion (for θ = π/2, where tension forces are strongest)
t max = κ
L∗ ρ3/20
B50
1/2
(15)
κ =53
D A
5/2
(8π)5/4 (16)
= 4.255 (17)
⇒ t max = 718.39 L1/237 n
3/40 B
−5/2−6 Myr; (18)
here L37 denotes the mechanical luminosity in units of 1037 ergs−1. Note, that this is also roughly the time scaleon which the outer shock decays into a fast magnetosonicwave, which is disturbing the ambient medium with a char-
acteristic speed of af =
k BT 0 µ m̄
+B2
04πρ0
, with k B, µ, m̄ and T 0denoting Boltzmann’s constant, the mean molecular weight,the mean particle mass of the gas and the ambient temper-
ature, respectively. Equating this to the shock speed travel-ling outwards at ˙ Rs, results in a typical decay time of t f 285 L
1/237 n
3/40 B
−5/2−6
0.58 +
T 3n0
µ B2−6
−5/4Myr. Here T 3 denotes the
ambient temperature in units of 103 K. For example, taking afield strength of B−6 = 5, an ambient density of n0 = 0.3 and L37 = 3, corresponding to a cluster with about 50 SNe, we ob-tain t f 6.2 Myr. Since the dependence on B0, n0, and L∗ isexactly the same as in Eq. (18), the outer shock in the equato-rial region will always have decayed just about before the bub-ble will stall. Although several of the assumptions made abovewill break down, the qualitative picture will be approximatelycorrect. In particular, the shell will be still small compared tothe bubble radius, i.e. δ R
Rs= 1
2√
2V A0
af = 1
2 (2 + β)−1/2, where
β = 8πn0k BT 0/ B20 is the plasma beta in the ambient medium.
Thus even for β → 0, δ R ≤ 0.35 Rs.
The radius of maximum expansion (perpendicular to the B-field direction) is therefore given by
⇒ Rmax =125κ 3
154π1/5
L1/2∗ ρ
1/40 B−
3/20 (19)
= 2217 L1/237 n
1/40 B
−3/2−6 pc. (20)
The maximum extension therefore depends most sensitively onthe magnetic field strength, and only weakly on the ambientdensity. Using the above values for B0, n0 and L37, we obtain
Rmax ≈ 254 pc and t max ≈ 9 Myr, well within our grid sizeand simulation timescale, respectively. With density inhomo-geneities and stratification perpendicular to the disk left aside,the bubble is still not too aspherical. In the following how-ever, the contraction in the equatorial region will make it more
elongated towards the poles, i.e. along the magnetic field. Inaddition, contraction will increase the pressure in the interiorthus acting against the tension forces, but also enhance expan-
sion predominantly along the field. We therefore conclude thatelongated features in our simulations correspond to old super-bubbles, unless large density gradients in the ambient mediumhave been present before. If the latter is the case, then the bub-bles continue early on to expand into the neighbouring regionswhere the field lines have been moved aside by other bubbles.In any case, the evolved bubbles lose their spherical form ac-quiring an oval-like appearance (see Fig. 3). After 358 Myrof evolution there are still a large number of regions were the
mean field maintains its initial orientation, although locally itis heavily distorted by SNe (Fig. 3). Interestingly, the averageP/k value is higher in the MHD case due to the magnetic fieldcontribution, which in the absence of dissipative processes andloss of flux always is present.
Perpendicular to the galactic plane the expansion of bub-bles will be alleviated due to the density stratification of theextended disk and Rayleigh-Taylor instabilities can occur oncethe shell accelerates over a few density scale heights. The ef-fect of the magnetic field then will be similar to surface tensionin an ordinary fluid, limiting the growth of the most unstablemodes to a maximum wave number. It is therefore expected
that shell fragments or cloudlets should have a minimum size.A number of shells will stall before that happens, and these willappear in simulations and observations, like e.g. NGC 4631(Wang et al. 2001) as extended loops.
A r t i c l e p u b l i s h e d b y E D P S c i e n c e s a n d a v a i l a b l e a t h t t p : / / w w w . e d p s c i e n c e s . o r g / a a o r h t t p : / / d x . d o i . o r g / 1 0 . 1 0 5 1 / 0 0 0 4 - 6 3 6 1 : 2 0 0 4 2 1 4 6
8/3/2019 M. A. de Avillez and D. Breitschwerdt- Global dynamical evolution of the ISM in star forming galaxies I. High resolution 3D simulations: Effect of the magnetic field
http://slidepdf.com/reader/full/m-a-de-avillez-and-d-breitschwerdt-global-dynamical-evolution-of-the-ism 8/16
592 M. A. de Avillez and D. Breitschwerdt: High resolution 3D simulations of the ISM. I.
3.3. Field dependence with density
During the evolution of the system, thermaland dynamicalpro-cesses broaden the distribution of the field strength with den-sity so that after the global dynamical equilibrium has been set
up, the field strength in the disk spans two orders of magni-tude from 0.1 to 15 µG (see Fig. 4). The spreading in the fieldstrength increases with temperature, being largest for the hot(T > 105.5 K) and smallest (between 2 and 6 µG) for the cold(T ≤ 200 K) gas. The lowest (0.1 µG) and higher (larger than10 µG) field strengths are associated with T > 104.2 gas anddensities of 0.1−1 cm−3. The intermediate temperature regimeshave the bulk of their scatter points similarly distributed be-tween 2 and 6 µG, although there is a clear distinction betweenthe diff erent temperature regimes with respect to the densitycoverage. It can be seen that the 104.2 < T ≤ 105.5 K gas cov-ers a large fraction of the scatter points overlapping with the
coolest and partially with the hot regimes, and there, mainlywith those of low densities and high field strengths. It almostcompletely covers points located in the 103.9 < T ≤ 104.2 Kboth in the field strength and in the density distribution. Thethermally unstable gas (200 < T ≤ 103.9 K) completely over-laps the T ≤ 200 K scatter points, although the latter cov-ers smaller field strength intervals than the unstable gas. The104.2 < T ≤ 105.5 gas coverage with other (stable) regimes isan indication that it is in a transient state trying to move towardsthermally stable regions at T ≤ 104.2 K or to the T > 105.5 Krange. Whether this gas becomes part of a classically stableregion, however, depends if it has enough time to cool down(or to be heated up) with respect to dynamical time scales,
which change its location on the p − V -diagram. The higherfield strengths at the intermediate temperature regimes are re-lated to the increase in compression of the field lines in newlyformed shells and SCLs.
The large scatter in the field strength for the same density,seen in Fig. 4, suggests that the field is being driven by the in-ertial motions, rather than it being the agent determining themotions. In the latter case the field would not be strongly dis-torted, and it would direct the motions predominantly along thefield lines. In ideal MHD field diff usion is negligible, and thecoupling between matter and field should be perfect (we are of course aware of numerical diff usion, which weakens the argu-
ment at sufficiently small scales). Therefore gas compressionis correlated with field compression, except for strictly par-allel flow. The high field variability is also seen in the rightbottom panel of Fig. 3, which shows a highly turbulent field,that seems to be uncorrelated with the density, and thus, theclassical scaling law B ∼ ρα, with α = 1/2, according tothe Chandrasekhar-Fermi (CF) model (1953) will not hold. Itshould be kept in mind that in CF it was assumed that thefield is distorted by turbulent motions that were subalfvénic,whereas in our simulations in addition both supersonic and su-peralfvénic motions can occur, leading to strong MHD shocks.In other words, according to the CF model, the turbulent ve-
locity is directly proportional to the Alfvén speed, which in aSN driven ISM need not be the case. If ram pressure fluctua-tions in the ISM are dominant as our simulations suggest, wewould indeed not expect a perfect correlation with α = 1/2
100
101
102
103
104
105
106
107
108
T [K]
10-16
10-15
10-14
10-13
10-12
10-11
10-10
< P
m a g
> ,
< P
t h > ,
< P
r a m >
<Pram
>
<Pth
>
<Pmag
>
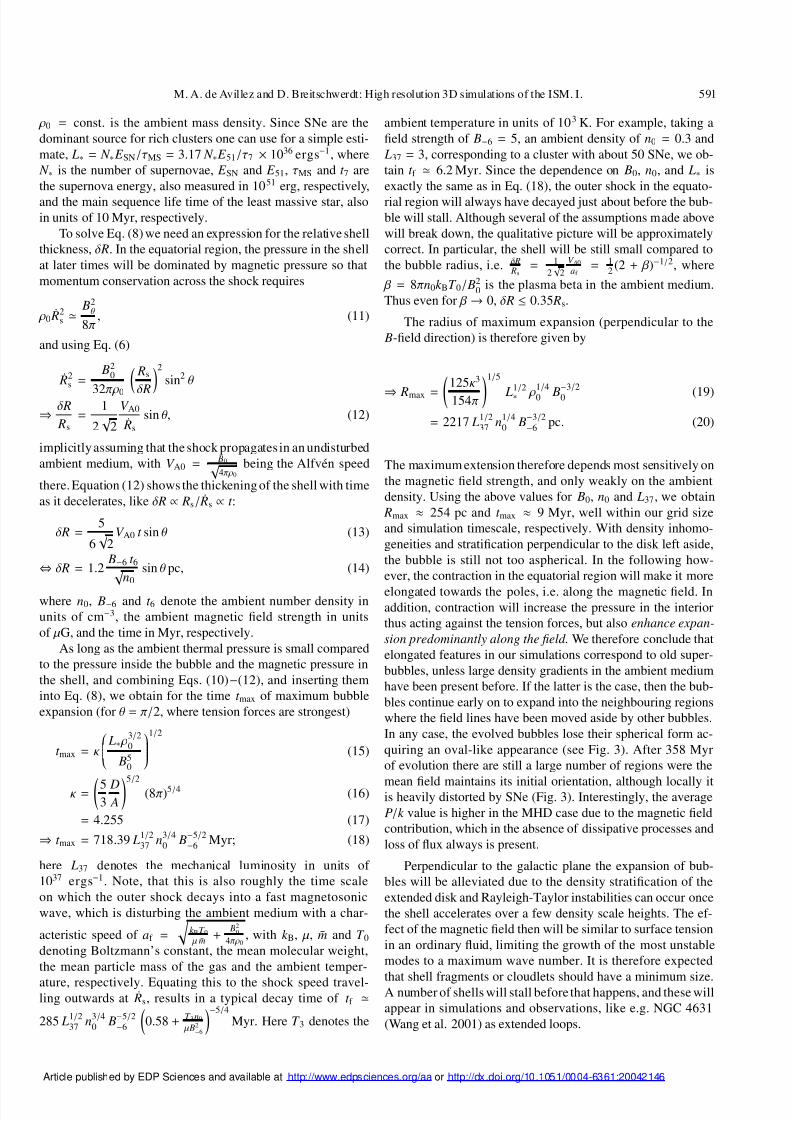
Fig. 5. Comparison of the averages Pram (green), Pth (black), andPmag (red) as function of the temperature (in the simulated disk | z| ≤250 pc) averaged over temperature bins of ∆ log T = 0.1 K.
but a broad distribution of B versus ρ. Although in general0 ≤ α ≤ 1 would be expected, it should be noted that in re-ality heating and cooling processes, and even magnetic recon-nection could induce further changes, making the correlationrather complex.
3.4. Weight of thermal, magnetic and ram pressures
In order to gain insight into the driving forces in the simulateddisk (| z| ≤ 250 pc) we turn now to the relative weight of theram, thermal and magnetic pressures as function of the tem-perature averaged over bins of ∆ log T = 0.1 K (Fig. 5). Theaverage distributions shown in the figure have been calculatedby using 51 snapshots with a time interval of 1 Myr during thetime evolution of 350 and 400 Myr.
The relative importance of thermal pressure over ram andmagnetic pressures increases with temperature. The gas withT ≥ 105.5 K is mainly thermally driven, while at lower tem-peratures thermal pressure has no influence on the dynamics of the flow. For T
≤150 K, Pth < Pram < Pmag indicating that
the gas is dominated by the Lorentz j × B forces, and the mag-netic field determines the motion of the fluid. At the interme-diate temperatures ram pressure dominates, and therefore, themagnetic pressure does not act as a significant restoring force(see Passot & Vázquez-Semadeni 2003) as it was already sug-gested by the lack of correlation between the field strength andthe density. It is also noteworthy that in this temperature range(150−7.4 × 10⁵ K) the weighted magnetic pressure is roughlyconstant, suggesting that the magnetic and thermal pressuresare largely independent, whereas both thermal and ram pres-sures undergo large variations in this temperature interval.
We therefore conclude that in galactic disk environments
the magnetic field will have a strong influence on the cold gas,particularly by controlling cloud and star formation processes.On the other hand, the warm and hot phases of the ISM, whichare dominating by volume but not by mass, are aff ected
A r t i c l e p u b l i s h e d b y E D P S c i e n c e s a n d a v a i l a b l e a t h t t p : / / w w w . e d p s c i e n c e s . o r g / a a o r h t t p : / / d x . d o i . o r g / 1 0 . 1 0 5 1 / 0 0 0 4 - 6 3 6 1 : 2 0 0 4 2 1 4 6

8/3/2019 M. A. de Avillez and D. Breitschwerdt- Global dynamical evolution of the ISM in star forming galaxies I. High resolution 3D simulations: Effect of the magnetic field
http://slidepdf.com/reader/full/m-a-de-avillez-and-d-breitschwerdt-global-dynamical-evolution-of-the-ism 9/16
M. A. de Avillez and D. Breitschwerdt: High resolution 3D simulations of the ISM. I. 593
dynamically only to a minor extent by magnetic pressureforces. However, it should be kept in mind, that microscopicprocesses, like heat conduction, will be strongly modified bythe presence of a magnetic field.
3.5. Thermal and magnetic pressures
The averaged (over the period350−400 Myr) volume weightedhistograms of the thermal, magnetic and total (Ptot = Pth+Pmag,which is calculated at each grid cell, and then used in the con-struction of the corresponding histogram) pressures of the dif-ferent temperature regimes in the magnetized ISM (see Fig. 6)show that for volume fractions d N / N ≥ 10−4 the full distri-butions (shown by the dashed lines) have a pressure coveragerunning from three (for Ptot) to more than five (for Pth) ordersof magnitude and having smooth (for Pth) and steep (for Pmag
and Ptot) peaks located in the [2×
10−13, 2×
10−12] dyne cm−2
interval. These peaks are determined by the contributions of the 200 < T ≤ 103.9 K and 104.2 < T ≤ 105.5 K regimesfollowed by the hot gas. The thermally stable regimes 103.9 <
T ≤ 104.2 K and T ≤ 200 K, by this order, have the smallestcontribution to the peaks.
In the thermal and magnetic pressure histograms it is pos-sible to distinguish two regions (Pth < 10−13 and Pth >
10−12 dyne cm−2), which are determined by the gas withT ≤ 103.9 and T > 104.2 K (with the hot gas being themain contributor for the high pressure region), respectively. Inthe Pmag histogram (that has a conical structure covering the[10−15, 5
×10−12] dyne cm−2 region for d N / N
≥10−4) all
regimes contribute to these two regions, although the hot gasis the main contributor to the low pressure region and the coldgas contributes mainly to the high pressure range.
A comparison between the top and middle panels of thefigure indicates that the highest values of the total pressure,i.e., Ptot ≥ 10−12 dyne cm−2, are mainly of thermal origin.Contributions come from the gas with T > 104.2 K and in par-ticular from the hot gas (whose histogram has a central peaklocated around 2 × 10⁻¹² dyne cm−2 and two smaller peaks inthe right wing of the histogram at Pth > 10−11 dyne cm−2, re-sulting from SN events). The gas with 200 < T ≤ 104.2 has avery small contribution and the cold gas practically none. For
the remaining pressure range (Ptot < 10−12
dyne cm−2
) bothmagnetic and thermal pressures contribute, with the magneticcontributions having a larger weight than the thermal ones.
3.6. Volume weighted histograms
In order to gain insight into the distribution of the disk gas asa function of density or temperature, it is useful to constructvolume weighted histograms. They give us information aboutthe occupation fraction of a certain “gas phase” with respect tovolume averaged density and temperature. Therefore a peak inthe histogram tells us, at which density / temperature a particular
phase is concentrated, because here the occupation fraction ishighest. A comparison between the averaged(over the time 350through 400 Myr) volume weighted histograms of the densityand temperature of the magnetized and unmagnetized disk gas
10-18
10-17
10-16
10-15
10-14
10-13
10-12
10-11
10-10
10-9
Pth
[dyne cm-2
]
10-6
10-5
10-4
10-3
10-2
10-1
100
< d N / N >
T < 200 K
200 < T < 103.9
K
103.9
< T < 104.2
K
104.2
< T < 105.5
K
T > 105.5
KFull distribution
MHD
10-18
10-17
10-16
10-15
10-14
10-13
10-12
10-11
10-10
10-9
Pmag
[dyne cm-2
]
10-6
10-5
10-4
10-3
10-2
10-1
100
d N / N
T < 200 K
200 < T < 103.9
K
103.9
< T < 104.2
K
104.2
< T < 105.5
K
T > 105.5
KFull distribution
10-18
10-17
10-16
10-15
10-14
10-13
10-12
10-11
10-10
10-9
Ptot
[dyne cm-2
]
10-6
10-5
10-4
10-3
10-2
10-1
100
d N / N
T < 200 K
200 < T < 103.9
K
103.9
< T < 104.2
K
104.2
< T < 105.5
K
T > 105.5
KFull distribution
Fig. 6. Averaged volume weighted histograms of the thermal (top
panel), magnetic (middle panel) and total (bottom panel) pressures for
the diff
erent temperature regimes in the ISM. The total distributionof each pressure is shown by the dashed black line. The histogramshave been calculated using 51 snapshots with a time interval of 1 Myrbetween 350 and 400 Myr.
A r t i c l e p u b l i s h e d b y E D P S c i e n c e s a n d a v a i l a b l e a t h t t p : / / w w w . e d p s c i e n c e s . o r g / a a o r h t t p : / / d x . d o i . o r g / 1 0 . 1 0 5 1 / 0 0 0 4 - 6 3 6 1 : 2 0 0 4 2 1 4 6
8/3/2019 M. A. de Avillez and D. Breitschwerdt- Global dynamical evolution of the ISM in star forming galaxies I. High resolution 3D simulations: Effect of the magnetic field
http://slidepdf.com/reader/full/m-a-de-avillez-and-d-breitschwerdt-global-dynamical-evolution-of-the-ism 10/16
594 M. A. de Avillez and D. Breitschwerdt: High resolution 3D simulations of the ISM. I.
10-6
10-5
10-4
10-3
10-2
10-1
100
101
102
103
n [cm-3
]
10-6
10-5
10-4
10-3
10-2
10-1
100
< d N / N >
T < 200 K
200 < T < 103.9
K
103.9
< T < 104.2
K
104.2
< T < 105.5
K
T > 105.5
KFull distribution
MHD
10-6
10-5
10-4
10-3
10-2
10-1
100
101
102
103
n [cm-3
]
10-6
10-5
10-4
10-3
10-2
10-1
100
< d N / N >
T < 200 K
200 < T < 103.9
K
103.9
< T < 104.2
K
104.2
< T < 105.5
K
T > 105.5
KFull distribution
HD
100
101
102
103
104
105
106
107
108
109
T [K]
10-6
10-5
10-4
10-3
10-2
10-1
100
< d N / N >
MHD
100
101
102
103
104
105
106
107
108
109
T [K]
10-6
10-5
10-4
10-3
10-2
10-1
100
< d N / N >
HD
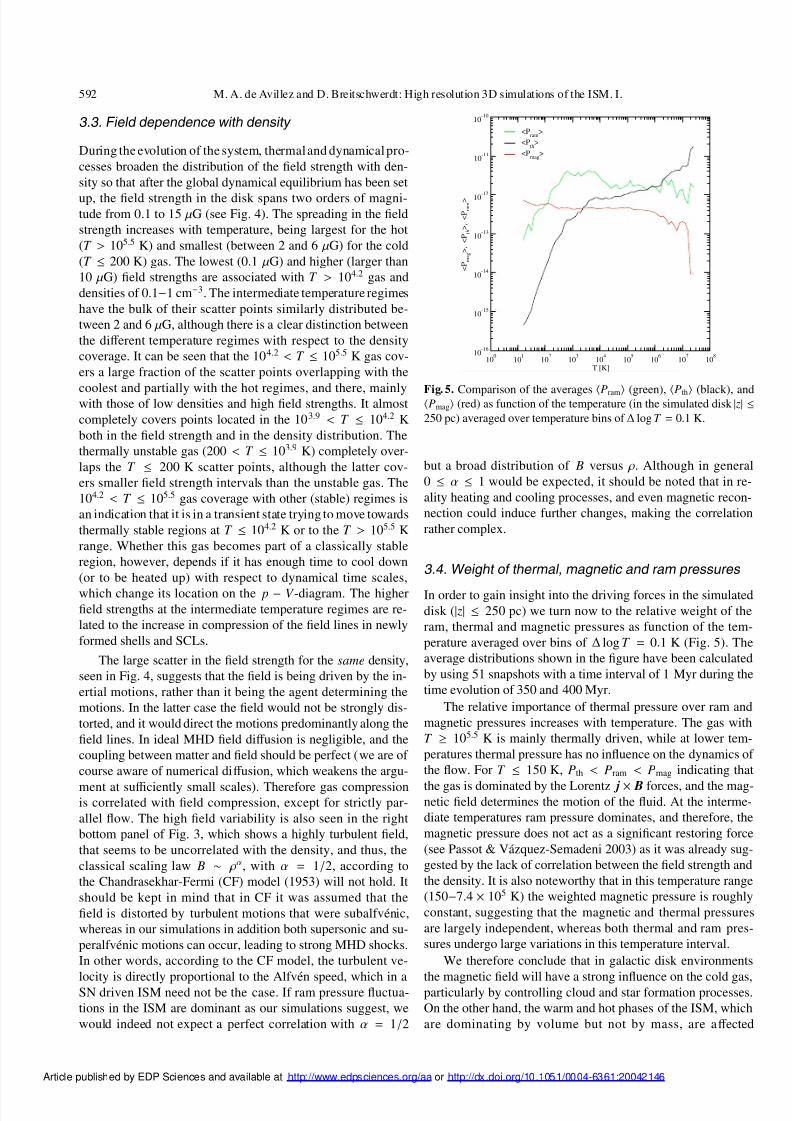
Fig. 7. Averaged volume weighted histograms of the density for the diff erent temperature regimes of the disk gas (the full distribution is shownby the dashed line) in the top panels and averaged temperature histograms in the bottom panels for the MHD run (left column) and the HD run(right column). The histograms have been calculated using 51 snapshots with a time interval of 1 Myr between 350 and 400 Myr.
(Fig. 7) shows noticeable diff erences that include the (i) de-crease / increase by an almost order of magnitude in the his-tograms density / temperature coverage; (ii) change in the rela-tive weight of the dominant temperature regimes (in the density
histograms) and consequently; (iii) changes in the pronouncedbimodality of the total density and temperature histograms.The density histograms in both HD and MHD runs are
dominated by the T > 105.5 K (less important), 104.2 < T ≤105.5 K and 200 < T ≤ 103.9 K regimes. The latter regimeis the most important in the HD run contributing to the pro-nounced peak around n ∼ 1 cm−3 in the total density distri-bution, whereas in the magnetized ISM the latter two regimesinterchange in importance (there is a strong reduction in thepeak of the 200 < T ≤ 103.9 K gas). This leads to a shift of thepeak in the total density histogram to n ∼ 0.2 cm−3, where it ismainly dominated by the 104.2 < T ≤ 105.5 K gas contribution.
The hot gas averaged PDFs have a similar shape but di ff erentdensity coverage, being larger in the HD run by an order of magnitude and peak location (being a factor of two higher inthe MHD run). This suggests that the areas underneath the
histograms, that is, the volume filling factors of the hot gas, arenot much diff erent in the two runs. The smallest peaks seen inthe density histograms belong to the thermally stable regimesT ≤ 200 K (which has the smallest occupation fraction), fol-
lowed by the 103.9 < T ≤ 104.2 K regime. With the inclusion of the magnetic field, there is an increase in the density coverageby the cold gas histogram and thus of its occupation fraction inthe disk.
The variations seen in the density weighted histograms arealso seen in temperature PDFs having diff erent structures. Ineff ect, while the temperature PDF of the HD run has a bimodalstructure (as it has two peaks: one at 2000 K and another around106 K), in the MHD run the decrease / increase in importance of the 103.9 < T ≤ 104.2 K / 104.2 < T ≤ 105.5 K leads to thereduction / increase of the occupation fraction of these regimesand therefore to a change of the histogram structure appear-
ing it to be unimodal. This variation of the intermediate regionappears to be an eff ect of the presence of the magnetic field,with the smoothing eff ect being less pronounced for lower fieldstrengths in the disk.
A r t i c l e p u b l i s h e d b y E D P S c i e n c e s a n d a v a i l a b l e a t h t t p : / / w w w . e d p s c i e n c e s . o r g / a a o r h t t p : / / d x . d o i . o r g / 1 0 . 1 0 5 1 / 0 0 0 4 - 6 3 6 1 : 2 0 0 4 2 1 4 6
8/3/2019 M. A. de Avillez and D. Breitschwerdt- Global dynamical evolution of the ISM in star forming galaxies I. High resolution 3D simulations: Effect of the magnetic field
http://slidepdf.com/reader/full/m-a-de-avillez-and-d-breitschwerdt-global-dynamical-evolution-of-the-ism 11/16
M. A. de Avillez and D. Breitschwerdt: High resolution 3D simulations of the ISM. I. 595
0 100 200 300 400t [Myr]
10-4
10-3
10-2
10-1
100
d N / N
T < 200 K
200 < T < 103.9
K
103.9
< T < 104.2
K
104.2
< T < 105.5
K
T > 105.5
K
MHD
0 100 200 300 400t [Myr]
10-4
10-3
10-2
10-1
100
d N / N
T < 200 K
200 < T < 103.9 K
103.9
< T < 104.2
K
104.2
< T < 105.5
K
T > 105.5
K
HD
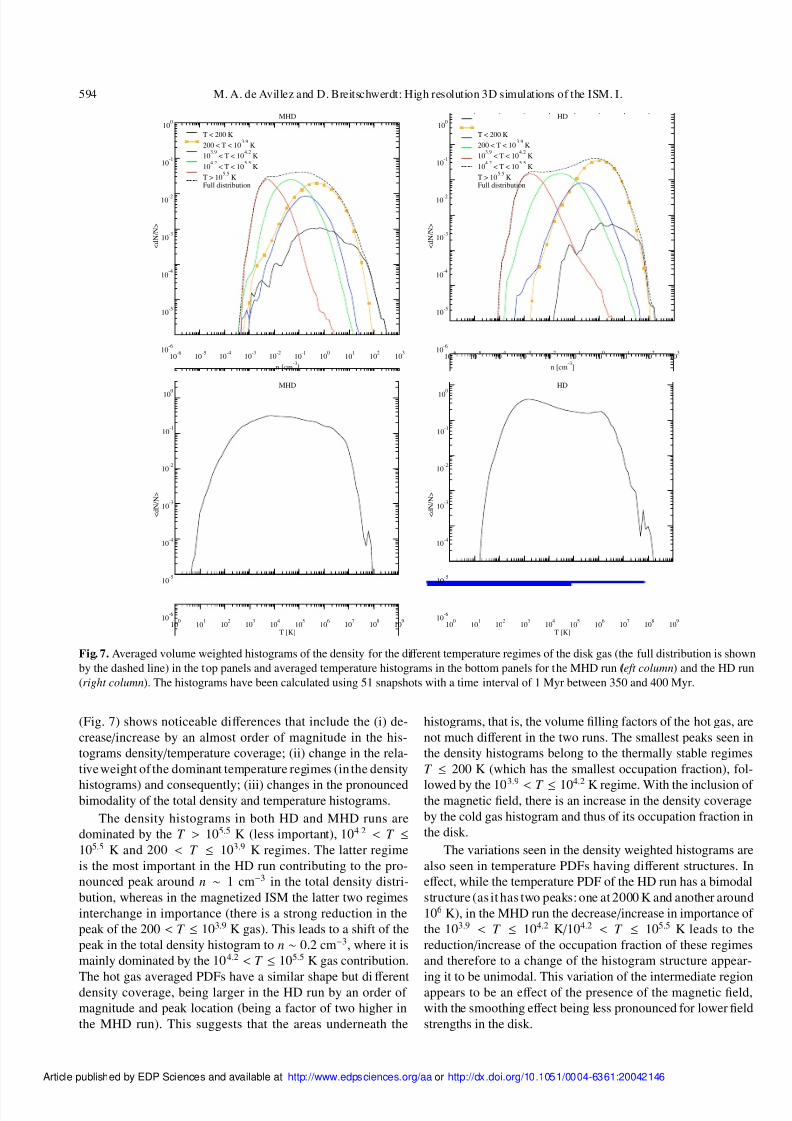
Fig. 8. Time history of the volume occupation fractions of the diff erenttemperature regimes for the MHD (top panel) and HD (bottom panel)runs.
3.7. Volume and mass fractions
During most of thehistory(t > 100 Myr) of ISM simulation the
occupation ( f v) and mass ( f M) fractions of the diff erent ther-mal regimes (Figs. 8 and 9 – top and middle panels) have analmost constant distribution, varying around their mean values(cf. Table 1). The thermally stable regimes with T ≤ 200 Kand 103.9 < T ≤ 104.2 K have similar occupation fractionsof ∼5% and ∼10%, respectively, in both runs, while the hotgas has an increase from ∼17% in the HD run to ∼20% inthe MHD case. By far most of the disk volume is occupied bygas in the thermally unstable regimes at 200 < T ≤ 103.9 and104.2 < T ≤ 105.5 K with similar occupation fractions ∼30% inthe MHD run, while in the HD run these regimes occupy 46%and 22%, respectively, of the disk volume.
The major fraction of the disk mass (∼93% and ∼80% inthe HD and MHD runs, respectively) is occupied by the gaswith T ≤ 103.9 and transferred between the cold and the ther-mally unstable regimes with the corresponding mass changes.
0 100 200 300 400t [Myr]
10-4
10-3
10-2
10-1
100
T < 200 K
200 < T < 103.9
K
103.9
< T < 104.2
K
104.2
< T < 105.5
K
T > 105.5
K
MHD
0 100 200 300 400t [Myr]
10-4
10
-3
10-2
10-1
100
T < 200 K200 < T < 10
3.9K
103.9
< T < 104.2
K
104.2
< T < 105.5
K
T > 105.5
K
HD
0 100 200 300 400t [Myr]
0
0.2
0.4
0.6
0.8
1
M 5 0 0 < T < 5 0 0 0 K
/ M W
N M
HD runMHD run
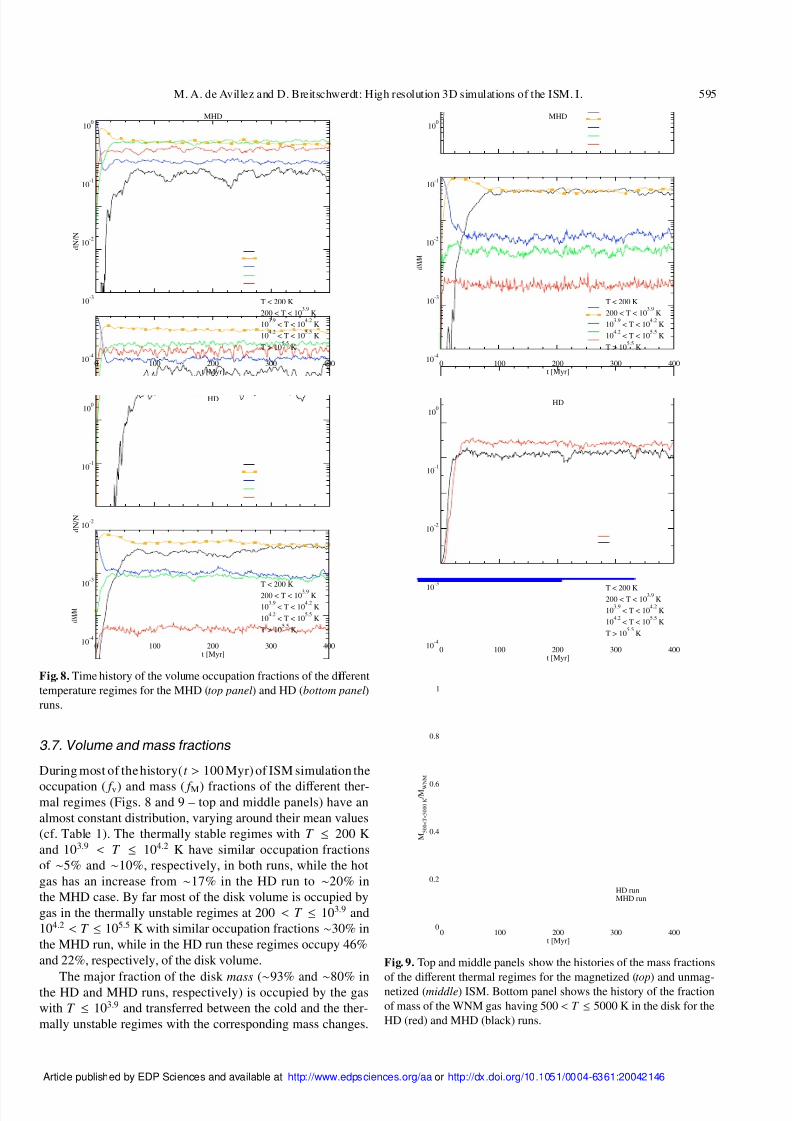
Fig. 9. Top and middle panels show the histories of the mass fractions
of the diff erent thermal regimes for the magnetized (top) and unmag-netized (middle) ISM. Bottom panel shows the history of the fractionof mass of the WNM gas having 500 < T ≤ 5000 K in the disk for theHD (red) and MHD (black) runs.
A r t i c l e p u b l i s h e d b y E D P S c i e n c e s a n d a v a i l a b l e a t h t t p : / / w w w . e d p s c i e n c e s . o r g / a a o r h t t p : / / d x . d o i . o r g / 1 0 . 1 0 5 1 / 0 0 0 4 - 6 3 6 1 : 2 0 0 4 2 1 4 6
8/3/2019 M. A. de Avillez and D. Breitschwerdt- Global dynamical evolution of the ISM in star forming galaxies I. High resolution 3D simulations: Effect of the magnetic field
http://slidepdf.com/reader/full/m-a-de-avillez-and-d-breitschwerdt-global-dynamical-evolution-of-the-ism 12/16
596 M. A. de Avillez and D. Breitschwerdt: High resolution 3D simulations of the ISM. I.
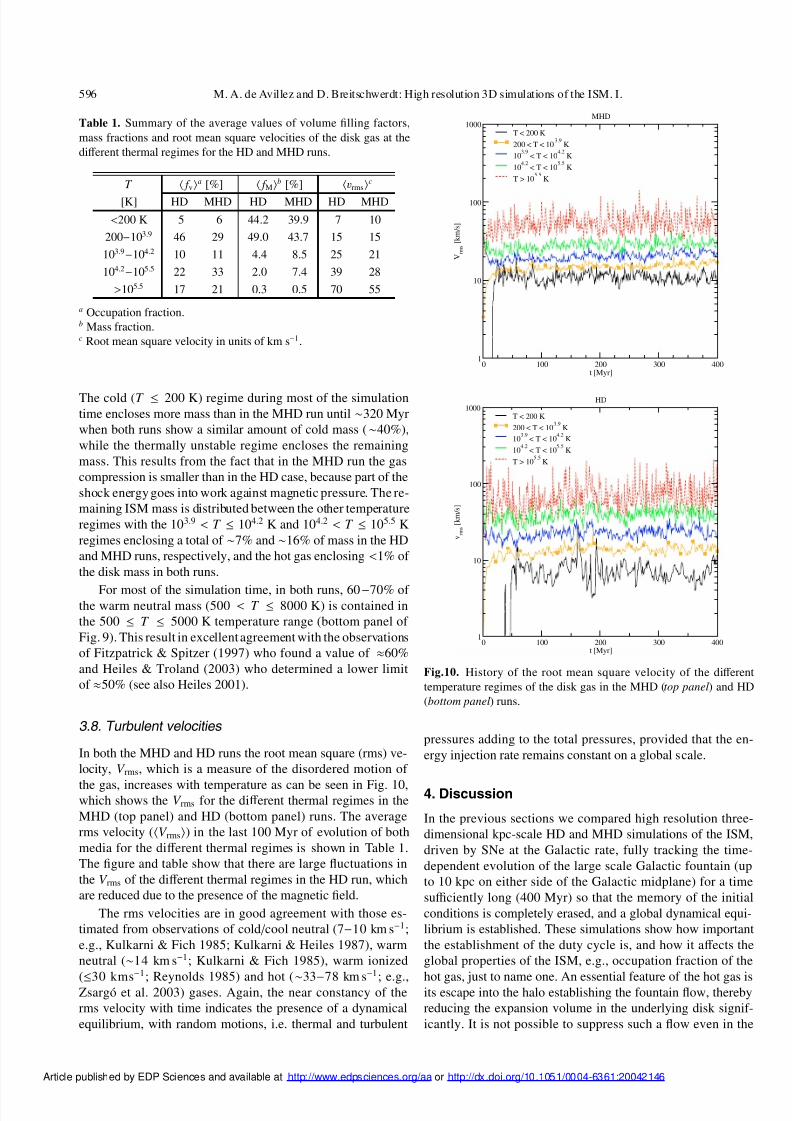
Table 1. Summary of the average values of volume filling factors,mass fractions and root mean square velocities of the disk gas at thediff erent thermal regimes for the HD and MHD runs.
T
f v
a [%]
f M
b [%]
vrms
c
[K] HD MHD HD MHD HD MHD
<200 K 5 6 44.2 39.9 7 10
200−103.9 46 29 49.0 43.7 15 15
103.9−104.2 10 11 4.4 8.5 25 21
104.2−105.5 22 33 2.0 7.4 39 28
>105.5 17 21 0.3 0.5 70 55
a Occupation fraction.b Mass fraction.c Root mean square velocity in units of km s−1.
The cold (T ≤ 200 K) regime during most of the simulationtime encloses more mass than in the MHD run until ∼320 Myrwhen both runs show a similar amount of cold mass (∼40%),while the thermally unstable regime encloses the remainingmass. This results from the fact that in the MHD run the gascompression is smaller than in the HD case, because part of theshock energygoes into work against magnetic pressure. The re-maining ISM mass is distributed between the other temperatureregimes with the 103.9 < T ≤ 104.2 K and 104.2 < T ≤ 105.5 Kregimes enclosing a total of ∼7% and ∼16% of mass in the HDand MHD runs, respectively, and the hot gas enclosing <1% of the disk mass in both runs.
For most of the simulation time, in both runs, 60−70% of the warm neutral mass (500 < T ≤ 8000 K) is contained inthe 500 ≤ T ≤ 5000 K temperature range (bottom panel of Fig. 9). This result in excellentagreement with the observationsof Fitzpatrick & Spitzer (1997) who found a value of ≈60%and Heiles & Troland (2003) who determined a lower limitof ≈50% (see also Heiles 2001).
3.8. Turbulent velocities
In both the MHD and HD runs the root mean square (rms) ve-locity, V rms, which is a measure of the disordered motion of
the gas, increases with temperature as can be seen in Fig. 10,which shows the V rms for the diff erent thermal regimes in theMHD (top panel) and HD (bottom panel) runs. The averagerms velocity (V rms) in the last 100 Myr of evolution of bothmedia for the diff erent thermal regimes is shown in Table 1.The figure and table show that there are large fluctuations inthe V rms of the diff erent thermal regimes in the HD run, whichare reduced due to the presence of the magnetic field.
The rms velocities are in good agreement with those es-timated from observations of cold / cool neutral (7−10 km s−1;e.g., Kulkarni & Fich 1985; Kulkarni & Heiles 1987), warmneutral (∼14 km s−1; Kulkarni & Fich 1985), warm ionized
(≤30 kms−1
; Reynolds 1985) and hot (∼33−78 km s−1
; e.g.,Zsargó et al. 2003) gases. Again, the near constancy of therms velocity with time indicates the presence of a dynamicalequilibrium, with random motions, i.e. thermal and turbulent
0 100 200 300 400t [Myr]
1
10
100
1000
V r m s
[ k m / s ]
T < 200 K
200 < T < 103.9
K
103.9
< T < 104.2
K
104.2
< T < 105.5
K
T > 105.5
K
MHD
0 100 200 300 400t [Myr]
1
10
100
1000
v r m s
[ k m / s ]
T < 200 K
200 < T < 103.9
K
103.9
< T < 104.2
K
104.2
< T < 105.5
K
T > 105.5
K
HD
Fig.10. History of the root mean square velocity of the diff erenttemperature regimes of the disk gas in the MHD (top panel) and HD(bottom panel) runs.
pressures adding to the total pressures, provided that the en-ergy injection rate remains constant on a global scale.
4. Discussion
In the previous sections we compared high resolution three-dimensional kpc-scale HD and MHD simulations of the ISM,driven by SNe at the Galactic rate, fully tracking the time-dependent evolution of the large scale Galactic fountain (upto 10 kpc on either side of the Galactic midplane) for a timesufficiently long (400 Myr) so that the memory of the initialconditions is completely erased, and a global dynamical equi-librium is established. These simulations show how importantthe establishment of the duty cycle is, and how it aff ects theglobal properties of the ISM, e.g., occupation fraction of the
hot gas, just to name one. An essential feature of the hot gas isits escape into the halo establishing the fountain flow, therebyreducing the expansion volume in the underlying disk signif-icantly. It is not possible to suppress such a flow even in the
A r t i c l e p u b l i s h e d b y E D P S c i e n c e s a n d a v a i l a b l e a t h t t p : / / w w w . e d p s c i e n c e s . o r g / a a o r h t t p : / / d x . d o i . o r g / 1 0 . 1 0 5 1 / 0 0 0 4 - 6 3 6 1 : 2 0 0 4 2 1 4 6
8/3/2019 M. A. de Avillez and D. Breitschwerdt- Global dynamical evolution of the ISM in star forming galaxies I. High resolution 3D simulations: Effect of the magnetic field
http://slidepdf.com/reader/full/m-a-de-avillez-and-d-breitschwerdt-global-dynamical-evolution-of-the-ism 13/16
M. A. de Avillez and D. Breitschwerdt: High resolution 3D simulations of the ISM. I. 597
presence of an obstructing disk parallel magnetic field. All thatis needed for break-out of the gas into the halo is a sufficientoverpressure in the superbubbles with respect to the ambientmedium. The eff ect of the magnetic field is just adding anotherpressure component. Its topology is almost irrelevantunless thegalactic magnetic field is extremely high and / or the SN rate isvery low. The field may inhibit the break-out of an individ-ual remnant, but certainly not the high-pressure flow resultingfrom supernova explosions in concert within an OB associa-tion. Thus, the occupation fractions of the hot gas in the diskin the HD and MHD simulations are not too much diff erent,although there is a slight increase in the MHD run as a resultof the magnetic tension forces aiding to confine bubbles andLorentz forces obstructing mixing with cooler gas. In Paper Iwe have shown that the volume filling factor of the hot regimestrongly correlates with the supernova (and therefore star for-mation) rate. Although we have not carried out MHD simula-
tions for higher supernova rates, it seems very plausible thatthis correlation will persist in the MHD case, since higher rateswill produce more hot plasma which, as we have shown here,is not magnetically controlled.
We also emphasize the importance of carrying out three-
dimensional simulations in order to describe the evolution of a magnetized ISM adequately. The idea that a disk parallelmagnetic field could suppress break-out and outflow into thehalo was mainly based on 2D simulations carried out in thelast 15 years, owing to computing power limitations. It is obvi-ous, that in 2D-MHD, the flow perpendicular to the magneticfield lines (and hence to the galactic plane) is subject to oppos-ing and ever increasing magnetic tension and pressure forces.In 3D however, field lines can be pushed aside and holes andchannels can be punched into the decreasing gas and field with
z-height, allowing pressurized flow to circumvent increasing
tension and pressure forces in z-direction. It is exactly this be-haviour that we see in our simulations. This is less surprising if we think of similar problems of terrestrial plasma confinement,although here plasma instabilities prevail.
The lack of correlation between the field strength and den-sity found in the present simulations is supported observation-ally from measurements of the magnetic field strength in thecold neutral medium (Troland & Heiles 2001). A similar resultis shown in the simulation described in Kim et al. (2001), al-
though these authors claim that the magnetic field scales as ρ0.4at densities n > 1 cm−3. Their Fig. 2 shows an almost order of magnitude variation of the field with the density for the coolestgas. However, the distribution of the scatter points is somewhatdiff erent than that seen in Fig. 4 of the present paper. This dis-crepancy can be explained by the (200 pc)3 box that Kim et al.have used, centered in the Galactic midplane having no densitystratification and with periodic boundary conditions in all thebox faces, driven by SNe at a rate of 12 times the Galactic valueand using an uniform field strength of 5.8 µG orientated alongthe x-direction; thus they were unable to describe thedisk-halo-disk circulation and did not allow for a global dynamical equi-
librium to be established (see also Mac Low et al. 2004).The distribution of the disk mass in the warm neutralmedium (WNM), in particular in the WNM fraction within theclassical thermally unstable regime seen in the simulations is
strongly supported by interferometric (Kalberla et al. 1985).Moreover optical / UV absorption-line measurements (Spitzer &Fitzpatrick 1995; Fitzpatrick & Spitzer 1997) indicate that alarge fraction (∼63%) of the warm neutral medium (WNM) isin the unstable range 500 < T < 5000 K, whereas 21 cm lineobservations (Heiles 2001; Heiles & Troland 2003) provide alower limit of 48% for the WNM gas in this unstable regime.Direct numerical simulations of the nonlinear developmentof the thermal instability under ISM conditions with radia-tive cooling and background heating discussed in Gazol et al.(2001) and Kritsuk & Norman (2002) show that about 60% of the system mass is in the thermally unstable regime. However,it is unclear from their simulations what is the time evolutionof this mass fraction and what is explicitly the origin of theunstable gas, although these authors suggest that ensuing tur-bulence is capableof replenishing gas in the thermally unstableregime by constantly stirring up the ISM. We have carried out
detailed numerical studies of the stability of the ISM gas phases(Avillez & Breitschwerdt 2005), and could verify the hypoth-esis that SN driven turbulence is capable of replenishing fastcooling gas in classically unstable regimes.
Nonetheless, it is interesting to ask why such a largeamount of gas can exist in a thermally unstable regime.Obviously the simple Field (1965) criterion, according towhich instability is expected to set in, viz.
∂L∂T
P
< 0, whereL is the heat loss function per unit mass, and T and P are thetemperature and thermal pressure of the fluid element, respec-tively, is not adequate. It is the turbulence that can have a stabi-lizing eff ect thereby inhibiting local condensation modes. The
situation is reminiscent to the existence of the solar chromo-sphere, which consists of gas at around 105 K, again in the ther-mally unstable regime. The reason is because heat conductioncan prevent thermal runaway on small scales. In other words,diff usion processes have a stabilizing eff ect. In our case it isturbulent diff usion that replaces the rôle of conduction, again,most efficient for large wavenumbers. The turbulent viscosityνturb ∼ Re νmol can be orders of magnitude above the molecu-lar viscosity, with Re being the Reynolds number of the flow.What happens physically then, is that with increasing eddywavenumber k = 2π/λ, the eddy crossing time τeddy ∼ λ/∆u
(with ∆u being the turbulent velocity fluctuation amplitude)becomes shorter than the cooling time τcool
∼3k BT /(nΛ(T )),
where Λ(T ) is the interstellar cooling function. Although notreally applicable here, it is instructive to see that in case of in-compressible turbulence following a Kolmogoroff scaling law,where the energy dissipation rate is given by ε ∼ ρ∆u3/λ, weobtain a lower cut-off in wavelength, where thermal instabilitybecomes inhibited, if
λ <
3k Bm̄
Λ0
3/2
ε1/2 T 3/4
ρ2(21)
≈ 1.42 × 1019 cm,
taking ε ∼ 10−26 ergcm−3 s−1 for SN energy injection; a simple
cooling law for the warm neutral medium of Λ(T ) = Λ0T
1/2
has been adopted, with Λ0 ≈ 1.9 × 10⁻²⁷ ergcm3 s−1 K−1/2
(taken from the cooling curve of Dalgarno & McCray 1972)for a WNM of a density of n = 0.3 cm−3, a temperature of
A r t i c l e p u b l i s h e d b y E D P S c i e n c e s a n d a v a i l a b l e a t h t t p : / / w w w . e d p s c i e n c e s . o r g / a a o r h t t p : / / d x . d o i . o r g / 1 0 . 1 0 5 1 / 0 0 0 4 - 6 3 6 1 : 2 0 0 4 2 1 4 6

8/3/2019 M. A. de Avillez and D. Breitschwerdt- Global dynamical evolution of the ISM in star forming galaxies I. High resolution 3D simulations: Effect of the magnetic field
http://slidepdf.com/reader/full/m-a-de-avillez-and-d-breitschwerdt-global-dynamical-evolution-of-the-ism 14/16
8/3/2019 M. A. de Avillez and D. Breitschwerdt- Global dynamical evolution of the ISM in star forming galaxies I. High resolution 3D simulations: Effect of the magnetic field
http://slidepdf.com/reader/full/m-a-de-avillez-and-d-breitschwerdt-global-dynamical-evolution-of-the-ism 15/16
M. A. de Avillez and D. Breitschwerdt: High resolution 3D simulations of the ISM. I. 599
distorted, and it would direct the motions predominantlyalong the field lines.
– T ≤ 200 K gas has PB > Pram Pth, demonstrating thatmagnetically dominated regions do exist. For 200 < T ≤105.5 K ram pressure determines the dynamics of the flow,and therefore, the magnetic pressure does not act as a sig-nificant restoring force. Near supernovae thermal and rampressures determine the dynamics of the flow. The hot gasin contrast is controlled by the thermal pressure, since mag-netic field lines are swept towards the dense compressedwalls.
– The existence of ram pressure dominated flows leads in-evitably to shear flows, thus driving strong superalfvenicand supersonic turbulence in the ISM.
– The volume filling factors of the diff erent ISM tempera-ture regimes depend sensitively on the existence of a dutycycle between the disk and halo acting as a pressure re-
lease valve for the hot (T > 105
.5
K) gas in the disk.The mean occupation fraction of the hot phase in both
HD and MHD runs is ∼17−21%. The T ≤ 200 K and103.9 < T ≤ 104.2 K regimes occupy 5−6% and 10−11% of the disk volume, respectively, while the thermally unstableregimes (200 < T ≤ 103.9 and 104.2 < T ≤ 105.5 K) fill intotal up to 70% of the disk volume in both runs.
– Most of the disk mass is found in the T ≤ 103.9 K gas,with the cold (T ≤ 200 K) and thermally unstable gases(200 < T ≤ 103.9 K) harbouring on average 83 and 93% of the disk mass in the MHD and HD runs. About 64−67% of the WNM gas has temperatures in the range 500−5000 Kin both runs.
– With the magnetic field present and initially orientated par-allel to the disk varying as ρ1/2, transport into the halo is in-hibited butnot prevented. On larger scales magnetic tensionforces are weaker than on the smallest scales and thereforevertical expansion still takes place efficiently and the occu-pation fraction of the hot gas becomes comparable to thevalues observed in the hydrodynamical simulations. Thus,hot gas is fed into the Galactic fountain at almost a similarrate than without the field.
In the dynamical picture of the ISM emerging from our3D high-resolution simulations, turbulence generated by shearflows of expanding bubbles seems to be a key element of struc-ture formation in both HD and MHD runs. Starting from hereand following a bottom-upscheme we feel encouraged to studyin the future other physical processes and ingredients in moredetail, such as non-equilibrium cooling, self-gravity, heat con-duction and cosmic rays, respectively, to name the most impor-tant ones.
Acknowledgements. M.A. and D.B. are partially supportedby the ESO / FCT (Portuguese Science foundation) grantPESO / P / PRO / 40149 / 2000. D.B. thanks G. Hensler for usefuldiscussions on the subject. M.A. benifited from discussions withE. Vazquez-Semadeni and M.-M. Mac Low.
References
Audit, E., & Hennebelle, P. 2005, A&A, in press[arXiv:astro-ph/0410062 ]
Avillez, M. A. 1998, The Evolution of Galactic Fountains, Ph.D.Thesis, University of Évora, Portugal
Avillez, M. A. 2000, MNRAS, 315, 479Avillez, M. A., & Breitschwerdt, D. 2004, A&A, 425, 899 (Paper I)Avillez, M. A., & Breitschwerdt, D. 2005, ApJ, in preparation
Axford, W. I., Leer, E., & Skadron, G. 1977, in Proc. 15th Int. CosmicRay Conf. (Plodiv) 11, 132
Ballesteros-Paredes, J. 2004, Ap&SS, 289, 243Balsara, D. S. 2001, J. Comput. Phys., 174, 614Bell, A. R. 1978, MNRAS, 182, 147Beck, R. 2004, Ap&SS, 289, 293Berezhko, E. G. 1996, APh, 5, 367Blandford, R. D., & Ostriker, J. P. 1978, ApJ, 221, 29Bregman, J. N., & Pildis, R. A. 1994, ApJ, 420, 570Breitschwerdt, D., McKenzie, J. F., & Völk, H. J. 1991, A&A, 245, 79Breitschwerdt, D., McKenzie, J. F., & Völk, H. J. 1993, A&A, 269, 54Breitschwerdt, D., & Schmutzler, T. 1994, Nature, 371, 774Brinks, E., & Bajaja, E. 1986, A&A, 169, 14Chandrasekhar, S., & Fermi, E. 1953, ApJ, 118, 113Dai, W., & Woodward, P. R. 1994, J. Comput. Phys., 115, 485Dai, W., & Woodward, P. R. 1998, J. Comput. Phys., 142, 331Dettmar, R.-J. 1992, Fund. Cosm. Phys., 15, 143Dorfi, E. A., & Breitschwerdt, D. 2005, A&A, in preparationDrury, L. Oc. 1983, Rep. Prog. Phys., 46, 973Ferrière, K. M., Mac Low, M.-M., & Zweibel, E. G. 1991, ApJ, 375,
239Field, G. B. 1965, ApJ, 142, 531Field, G. B., Goldsmith, D. W., & Habing, H. J. 1969, ApJ, 155, L149Fitzpatrick, E. L., & Spitzer, L., Jr. 1997, ApJ, 475, 623Gazol, A., Vázquez-Semadeni, E., Sanchez-Salcedo, J., & Scalo, J.
2001, ApJ, 557, 121Guiliani, J. L., Jr. 1982, ApJ, 256, 624
Hanasz, M., Otmianowska-Mazur, K., & Lesch, H. 2002, A&A, 386,347
Hartmann, J. 1904, ApJ, 19, 268Heiles, C. 2001, ApJ, 551, L105Heiles, C., & Troland, T. H. 2003, ApJ, 586, 1067Kahn, F. D. 1981, in Investigating the Universe, ed. F. D. Kahn
(Dordrecht: Reidel), 1Kamaya, H., Mineshige, S., Shibata, K., & Matsumoto, R. 1996, ApJ,
458, L25Kalberla, P. M. W., Schwarz, U. J., & Goss, W. M. 1985, A&A, 144,
27Kim, J., Balsara, D., & Mac Low, M.-M. 2001, JKAS, 34, S333Koo, B.-C., & McKee, C. F. 1992, ApJ, 388, 93Korpi, M. J., Brandenburg, A., Shukurov, A., Tuominen, I., &
Nordlund, A. 1999, ApJ, 514, L99Koyama, H., & Inutsuka, S. 2002, 564, L97Krymsky, G. F. 1977, Dokl. Nauk. SSR, 234, 1306 (Engl. Trans.
Sov. Phys. Dokl., 23, 327)Kritsuk, A., & Norman, M. L. 2002, ApJ, 569, L127Kulkarni, S. R., & Fich, M. 1985, ApJ, 289, 792Kulkarni, S. R., & Heiles, C. 1987, in Interstellar Processes, ed. D. J.
Hollenbach, & H. A. Thronson (Dordrecht: Reidel), 87Kulsrud, R. M., Bernstein, I. B., & Kruskal, M. 1965, ApJ, 142, 491Kulsrud, R. M., & Pearce, W. D. 1969, ApJ, 156, 445Lockman, F. J. 1984, ApJ, 283, 90Mac Low, M.-M., Balsara, D., Kim, J., & Avillez, M. A. 2004, ApJ,
in revision [arXiv:astro-ph/0410734 ]
Malyshkin, L., & Kulsrud, R. 2001, ApJ, 549, 402Massey, P., Johnson, K. E., & Degioia-Eastwood, K. 1995, ApJ, 454,ApJ, 454, 151
McCray, R., & Kafatos, M. 1987, ApJ, 317, 190
A r t i c l e p u b l i s h e d b y E D P S c i e n c e s a n d a v a i l a b l e a t h t t p : / / w w w . e d p s c i e n c e s . o r g / a a o r h t t p : / / d x . d o i . o r g / 1 0 . 1 0 5 1 / 0 0 0 4 - 6 3 6 1 : 2 0 0 4 2 1 4 6
8/3/2019 M. A. de Avillez and D. Breitschwerdt- Global dynamical evolution of the ISM in star forming galaxies I. High resolution 3D simulations: Effect of the magnetic field
http://slidepdf.com/reader/full/m-a-de-avillez-and-d-breitschwerdt-global-dynamical-evolution-of-the-ism 16/16
600 M. A. de Avillez and D. Breitschwerdt: High resolution 3D simulations of the ISM. I.
McKee, C. F., & Ostriker, J. P. 1977, ApJ, 218, 148Mineshige, S., Shibata, K., & Shapiro, P. R. 1993, ApJ, 409, 663Norman, C. A., & Ikeuchi, S. 1989, ApJ, 345, 372Parker, E. N. 1992, ApJ, 401, 137Passot, T., & Vázquez-Semadeni, E. 2003, A&A, 398, 845
Reynolds, R. J. 1985, ApJ, 294, 256Spitzer, L., Jr. 1956, ApJ, 124, 20Spitzer, L., Jr., & Fitzpatrick, E. L. 1995, ApJ, 445, 196Stothers, R. 1972, ApJ, 175, 431Summers, D. 1975, A&A, 45, 151Tanuma, S., Yokoyama, T., Kudoh, T., & Shibata, K. 2003, ApJ, 582,
215Tomisaka, K. 1990, ApJ, 361, L5Tomisaka, K. 1998, MNRAS, 298, 797
Troland, T. H., & Heiles, C. 2001, BAAS, 33, 918Trümper, J. 1983, Adv. Sp. Res., 2(4), 241Vogler, A., & Pietsch, W. 1996, A&A, 311, 35Wang, Q. D., Walterbos, R. A. M., Steakley, M. F., Norman, C. A., &
Braun, R. 1995, ApJ, 439, 176
Wang, Q. D., Immler, S., Walterbos, R., Lauroesch, J. T., &Breitschwerdt, D. 2001, ApJ, 555, L99
Weaver, R., McCray, R., Castor, J., Shapiro, P., & Moore, R. 1977,ApJ, 218, 377
Wolfire, M. G., McKee, C. F., Hollenbach, D., Tielens, A. G. G. M.,& Bakes, E. L. O. 1995, ApJ, 443, 152
Zsargó, J., Sembach, K. R., Howk, J. C., & Savage, B. D. 2003, ApJ,586, 1019