m-h. fillion lassonde institute of mining, university of ... · pdf filemechanics (isrm)...
TRANSCRIPT

Slope Stability 2013 – P.M. Dight (ed) © 2013 Australian Centre for Geomechanics, Perth, ISBN 978-0-9870937-5-2
Slope Stability 2013, Brisbane, Australia 1
M-H. Fillion Lassonde Institute of Mining, University of Toronto, Canada
J. Hadjigeorgiou Lassonde Institute of Mining, University of Toronto, Canada
In an open pit mine operation, the quality and quantity of collected geomechanical data can have significant implications in the design of safe and economically viable slope designs. The selection of representative values of the rock mass properties is not straightforward, given the inherent geological and structural variability within an orebody. Under these circumstances the design of a comprehensive geomechanical sampling program is critical. Such a program, however, has to comply with practical and financial constraints while developing a degree of confidence in the quality of the geomechanical data.
A common target level of confidence in the rock mass properties used in slope design is higher than 80% for an open pit mine at the operations stage. This requires an ongoing maintenance of the geomechanical database and model. In practice, given the perceived high costs of laboratory testing, quite often only a relatively small number of samples are selected for laboratory testing. This leads to a series of questions pertaining to the confidence level that can be assigned to values obtained by testing only a few samples.
This paper investigates the potential of small-sampling theory to provide practical recommendations on the adequacy of a testing program. The geomechanical database of an Anglo American operating open pit mine was reviewed with respect to the strength properties obtained through a series of ISRM suggested testing methods. For the purposes of this investigation the focus was on uniaxial compressive strength (UCS) results but the methodology can be applied to other material properties. In this case study, the mine geological model identified six distinct rock types. Strength values for six different rock domains were analysed using the confidence interval approach. In order to investigate the sequence of testing on the interpretation of results, statistical analyses were also performed by randomly interchanging the order of test results for each rock domain. The results showed that even if the number of specimens tested is higher than the minimum proposed by the International Society for Rock Mechanics (ISRM) suggested methods, the sample size was too small to obtain a reliable strength value for most of the rock domains. Furthermore, the results showed that the minimum sample size obtained using the confidence interval approach is significantly influenced by the test results sequence used for the analyses. Based on the results of this study, there is a demonstrated need for a method to determine the minimum sample size while minimising the influence of the testing sequence.
Geotechnical stability analysis and design in open pit mines requires access to representative geological, structural and rock mass models. These models are continuously updated throughout the life of a project from the early stage conceptual study through feasibility, design and construction. It is also recognised that there are always issues related to data uncertainty that have significant consequences. A major contribution in slope design has been the work by Read (2009) whereby he proposed the levels of effort required in data collection that can be assigned to every stage in a project from conceptual to operations. At the same time it was recognised that there must be a target level of data confidence associated with each level.
https://papers.acg.uwa.edu.au/p/1308_05_Hadjigeorgiou/

Reliability of strength estimates based on limited laboratory data M-H. Fillion and J. Hadjigeorgiou
2 Slope Stability 2013, Brisbane, Australia
A useful template for identifying the salient geotechnical information includes: geological model, structural models (major features and fabric), hydrogeological model, intact rock strength, strength of structural defects and geotechnical characterisation (Read, 2009). It is a challenge, however, to quantify what level of information will result in the required level of data confidence.
This paper discusses what constitutes representative information for a particular rock type, in an open pit. The uniaxial compressive strength (UCS) of the rock is one of the parameters used in the process of slope design. If sufficient and good quality data are not available then it is difficult to predict with a degree of confidence the rock mass behaviour (Hadjigeorgiou, 2012). The selection of an adequate value for the UCS is not straightforward because the strength of the rock can vary significantly within the same rock domain in a rock mass. Given that sample collection and specimen testing are highly expensive, engineers must make an important decision concerning the minimum number of samples to test at an acceptable level of confidence. This paper investigates the practical implications of current practice in defining ‘a priori’ the number of tests necessary to determine the UCS of a rock type for a particular project.
Read (2009) proposed that, for an open pit mine at the operations stage, the target level of confidence in the intact rock strength data should be higher than 80%. These guidelines, however, are qualitative and no specific quantitative method is suggested to reach the targeted level of confidence in the data. Gill et al. (2005a) demonstrated that the minimum sample size proposed in generally accepted standards in the mining industry, like the International Society of Rock Mechanics (ISRM) suggested methods, can be inadequate. They demonstrated that it is not possible to determine ‘a priori’ the number of required tests for a given rock type and a targeted precision index. They used small-sampling theory to establish the number of tests required and demonstrated that, for a given rock and test type, the minimum sample size to reach a targeted precision index and confidence interval varies from one case to the other. Ruffolo and Shakoor (2009) arrived at the same conclusion using the confidence interval approach. Gill et al. (2005a) used Monte Carlo simulations to simulate test results according to the population mean and standard deviation obtained from laboratory data sets taken from the literature. To determine the minimum sample size, Ruffolo and Shakoor (2009) used data from a large sample size, generally around 50 specimens coming from large blocks of rocks obtained from quarries, road cuts and monument-stone distributors.
This paper investigates the implications of using the small sampling theory in analysing UCS data from an Anglo American open pit mine at the operation stage. This case study provided access to a comprehensive database that met all standard practice criteria and complied with ISRM guidelines.
The ISRM has suggested a method for the determination of the UCS of rock materials (Bieniawski and Bernede, 1979). ISRM provides guidelines on the apparatus to be used, procedures and reporting of results. It also specified that the number of specimens tested should be determined from practical considerations, but at least five are preferred. There are no guidelines, however, in what constitutes representative test results. This can result in conflicting interpretations of the adequacy of a testing program to provide the required target level of data confidence.
Gill et al. (2005a) and Ruffolo and Shakoor (2009) made a strong case that it is not possible to determine ‘a priori’ the number of required tests for a given rock type and targeted precision index. They suggested that small-sampling theory provides the quantitative tools to establish the number of test required and demonstrated that for a given rock and test type, the minimum sample size to reach a targeted precision index and confidence interval varies from one case to the other.
This paper investigates the impact in interpretation of applying small sampling theory in reanalysing the results of a testing program. The choice of data was based on the availability of quality laboratory data

Geotechnical models
Slope Stability 2013, Brisbane, Australia 3
collected based on standard industry practice and complying with the ISRM guidelines. Analyses were performed using UCS data from six different rock domains in an Anglo American open pit mine at the operations stage. To assess the influence of the realisation sequence of the laboratory tests, analyses were also performed by randomly interchanging the test results order for each rock domain.
Sampling theory allows estimation of unknown population quantities such as the population mean and variance. The estimation of the population mean and variance is made from the knowledge of the corresponding sample mean and variance. The determination of the confidence interval for the population mean requires the population standard deviation which is often unknown. The use of the sample standard deviation is recognised as an acceptable approximation when the number of observations is greater than 30 (Spiegel, 1961). Other authors proposed that this approximation is adequate for a sample size higher than 40 (Montgomery and Runger, 2003). However, for a rock property like the UCS, this condition is often not satisfied which gives less and less acceptable results as the number of observations decreases. In such situations, the small-sampling theory can be used.
Small-sampling theory is an accepted statistical technique but somehow has not received adequate attention and implementation in rock engineering. For consistency purposes, the small sample methodology and equations used in this paper follow Hines et al. (2003).
According to the small-sampling theory, the interval into which a population arithmetic mean (μ) lies is defined by Equation (1):
(1)
Where:
X = the arithmetic sample mean and is defined by Equation (2):
1
ni
i
XX
n
(2)
s = the sample standard deviation which is defined by Equation (3):
2
1
( )
1
n
i
i
X X
sn
(3)
μ = the population arithmetic mean.
/ 2,t = the confidence coefficient obtained from the Student t distribution for a two-sided confidence on μ.
α = a parameter determined by the required confidence level.
ν = the number of degrees of freedom.
iX = the values observed on each of the n elements in the sample.
n = the number of elements in the sample.
/ 2, / 2,
s sX t X t
n n

Reliability of strength estimates based on limited laboratory data M-H. Fillion and J. Hadjigeorgiou
4 Slope Stability 2013, Brisbane, Australia
The confidence interval for the population variance σ2 can be estimated in terms of the sample variance s2 and is defined by Equation (4):
(4)
Where:
σ2 = the population variance.
2
/ 2, = the right side confidence coefficient obtained from the Chi-squared distribution.
2
1 / 2, = the left side confidence coefficient obtained from the Chi-squared distribution.
To use the Student t or the Chi-squared tables, the number of degrees of freedom ν must be determined by Equation (5):
n k (5)
Where:
k = the number of population parameters estimated by either Equation (1) or (4) for which k = 1 and then .
To use the Student t or the Chi-squared tables, the confidence interval (CI) must also be selected. CI is expressed as a percentage. The expression of 1-α/2 is defined by Equation (6):
1 0.5 1.0
2 100
CI
(6)
To use the small-sampling theory, the assumption that the underlying distribution is normal must be reasonable and the sampling procedure should allow for all population elements to have the same probability of being selected. The use of a normal distribution for the UCS of a rock domain is widely accepted (Hoek, 1998; Kostak and Bielenstein, 1971; Sari and Karpuz, 2006).
According to small-sampling theory, the minimum number of specimens in a group (minimum sample size) can be expressed in terms of the precision index, the t student statistic and the coefficient of variation. The minimum sample size n is defined by Equation (7):
2
/ 2,
1
1 100
p cvn t
p
(7)
2 22
2 2
/ 2, (1 / 2, )
( 1) ( 1)s n s n
1n

Geotechnical models
Slope Stability 2013, Brisbane, Australia 5
Where:
p = the precision index (i.e. the ratio of the upper and lower limits of the population mean interval) and is determined by Equation (8):
(8)
cv = the coefficient of variation and is defined by Equation (9):
100%
scv
X
(9)
The parameters presented in Equations (7), (8) and (9) are the same as described in section 2.3.1.
It is not straightforward to solve Equation (7) because the confidence coefficient / 2,t
is a
function of the number of degrees of freedom, which is a function of the sample size n. Consequently, the required n must be determined through trial and error. A simple solution to solve this problem, using the Microsoft Excel© solver tool, was provided by Gill et al. (2005a).
It should be noted that Gill et al. (2005a) used the equations proposed by Spiegel (1961) to derive the equation for the minimum sample size n. The equations proposed by Spiegel (1961) must be used in conjunction with the sample standard deviation (s) but Gill et al. (2005a) used the equation for the better estimate of the standard deviation represented by ŝ in Spiegel (1961). Although the omission by Gill et al. (2005a) did not have a significant impact on the final results it was incorrect. For the purposes of the present work the methodology was modified to derive an adequate equation for the minimum sample size represented by Equation (7). This modification fully respects small sampling theory.
To determine the CI characterising the mean value when the number of tests is known, the confidence coefficient ( ) must first be determined. The confidence coefficient can be obtained by rewriting
Equation (7) as follows:
/ 2,
1
1
p Xt n
p s
(10)
Note that the equation is different from the one presented in Gill et al. (2005b) to fully respect small sampling theory. The value of is obtained from interpolation in the student’s t table or by calculating its value from the probability density function. Equation (6) can be modified as follows to determine the CI:
100(1 )CI (11)
The following section presents results from analyses using the small sampling theory and the CI approach on the strength data for 6 rock domains of an Anglo American operating open pit mine.
The implications of using small sampling theory to interpret the results of a UCS testing program were investigated by reviewing the geomechanical database of an Anglo American operating mine. This case study provided access to a comprehensive database that met all standard practice criteria and complied with ISRM guidelines.
/ 2,
/ 2,
, 1
sX t
np where p
sX t
n

Reliability of strength estimates based on limited laboratory data M-H. Fillion and J. Hadjigeorgiou
6 Slope Stability 2013, Brisbane, Australia
UCS test results were available for six different rock domains at Mine A. A summary of the available data (UCS laboratory testing results) for the six rock domains is shown in Table 1. It is of interest to note that all laboratory tests met the ISRM guidelines regarding the acceptable sample size.
Rock Domain
Sample Size n
Data Range Min–Max
(MPa)
Sample Mean ( )
(MPa)
Sample Std. Deviation (s)
(MPa)
(1) 13 29.9–156.7 91.2 37.3
(2) 8 26.4–313.4 167.4 103.8
(3) 47 22.1–103.1 62.2 20.6
(4) 14 2.6–33.5 15.5 9.6
(5) 24 9.9–112.3 37.6 25.0
(6) 11 18.1–48.9 28.9 10.5
As shown in Table 1, the number of laboratory tests performed on rock core samples at Mine A was considerably higher than the minimum of five in the ISRM suggested method for the determination of the uniaxial compressive strength.
In order to determine, in retrospect, if the number of UCS tests performed were sufficient to obtain reliable strength data estimates for each rock domains, statistical analyses were conducted on the
available data at Mine A to determine the level of confidence in the strength data.
Based on the UCS tests results given in Table 1, the coefficient of variation and the precision index were calculated for each rock domain. The precision index was calculated for a confidence interval of 80% to be consistent with the minimum level of confidence in the rock mass model (which includes the rock strength) of 80% for an open pit mine at the operations stage proposed by Read (2009). The results are presented in Table 2. It is recognised that tests were undertaken at earlier stages in the mine life (feasibility stage).
The results presented in Table 2 show that the coefficient of variation is quite high (between 33.1 and 66.5%). High value of coefficient of variation indicates a higher variability and consequently, a higher number of samples must be tested. The precision index was also high for most of the rock domains presented in Table 2. Gill et al. (2005a) suggested that for permanent mine openings, the precision index p should be ≤ 1.35 while keeping the confidence interval at 95%. This condition ensures a maximum relative error on the true mean of approximately 15%, the maximum relative error being defined by (1 - p)/(1 + p). Given that condition, the confidence intervals on the available data for each rock domain were calculated using the method proposed in Gill et al. (2005b) for a precision index of 1.35. The results are presented in Table 3.
Note that the following calculations were performed considering an 80% confidence interval instead of the 95% confidence interval proposed by Gill et al. (2005a) when using p ≤ 1.35 for permanent mine openings. Given that as p decreases towards 1 (p= 1 meaning that the relative error is 0%), the smaller is the true mean interval but this requires that N→∞. To increase the confidence interval while maintaining a given precision index p, the sample size must increase. Given those considerations, a

Geotechnical models
Slope Stability 2013, Brisbane, Australia 7
maximum relative error of about 15% (p = 1.35) with CI = 80% were considered acceptable for the purpose of this study.
Rock Domain
Sample Size
n
Sample Mean
X (MPa)
Sample Std. Deviation s (MPa)
Coefficient of Variation
cv (%)
Student Statistic
Precision Index
p
(1) 13 91.2 37.3 40.9 1.356 1.38
(2) 8 167.4 103.8 62.0 1.415 1.99
(3) 47 62.2 20.6 33.1 1.300 1.14
(4) 14 15.5 9.6 62.1 1.350 1.61
(5) 24 37.6 25.0 66.5 1.319 1.45
(6) 11 28.9 10.5 36.2 1.372 1.37
Rock Domain
Sample Size
n
Sample Mean
(MPa)
Sample Std. Deviation s (MPa)
/ 2, 1nt
/ 2 True Mean Range (MPa)
Confidence Interval CI (%)
(1) 13 91.2 37.3 1.313 0.107 77.6–104.8 78.6
(2) 8 167.4 103.8 0.679 0.259 142.5–192.3 48.1
(3) 47 62.2 20.6 3.083 0.002 52.9–71.5 99.7
(4) 14 15.5 9.6 0.898 0.193 13.2–17.8 61.4
(5) 24 37.6 25.0 1.097 0.142 32.0–43.2 71.6
(6) 11 28.9 10.5 1.360 0.102 24.6–33.2 79.6
The results presented in Table 3 show that, for a precision index of 1.35, the CI is higher than 80% only for domain (3). This implies that the sample size is insufficient for the other rock domains to obtain reliable strength data given the selected CI and p.
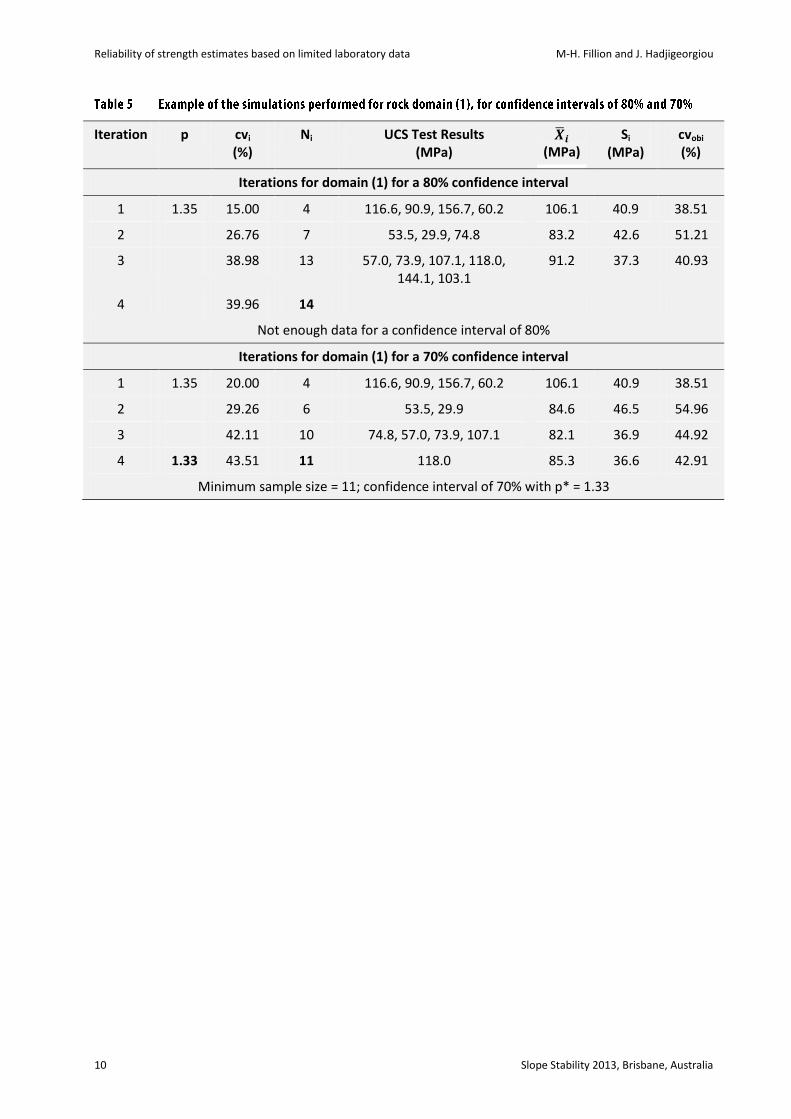
Small-sampling theory and the algorithm proposed in Gill et al. (2005a) were used to determine the minimum number of specimens required to estimate the population mean and variance at various levels of confidence. The results are presented in Table 4. An example of the simulations performed for rock domain (1) is presented in Table 5. The analyses were first performed for a CI of 80%. When the minimum sample size required for CI = 80% was larger than the available number of specimens, confidence intervals <80% were analysed to estimate the level of confidence in the strength data according to the number of available test results. Read (2009) suggested that confidence levels <80% are acceptable only for earlier project stages than the operation stage (e.g. conceptual, pre-feasibility, feasibility and design and construction). When the minimum sample size required for a confidence interval of 80% was smaller than the available number of specimens, confidence intervals >80% were analysed. The laboratory test results were used in the same testing sequence for each simulation conducted by varying CI. Table 5 shows an example of the fixed testing sequence used. For example, in the ‘UCS test results’ column of Table 5, the first 4 results are the same when analysing the 80% CI and

Reliability of strength estimates based on limited laboratory data M-H. Fillion and J. Hadjigeorgiou
8 Slope Stability 2013, Brisbane, Australia
the 70% CI, i.e. 116.6, 90.9, 156.7 and 60.2 MPa. This is also valid when the number of test results increases.
As expected, the sample size is sufficient to obtain >80% confidence in the strength data for rock domain (3) and the sample size is too small for rock domains (1), (2) and (4). However, according to the results presented in Table 4, the sample size is sufficient to reach >80% confidence in the strength data for rock domains (5) and (6). This was not expected given the high coefficient of variation and precision index of the strength data for these rock domains (Table 2).
Furthermore, the results presented in Tables 1 and 4 show that for the rock domains (3), (5) and (6), the 80% confidence interval determined using the small-sampling theory (Table 4) do not include the mean value of the total available strength data at Mine A (Table 1). For example, the 80% confidence interval (considering a small sample size of 13 specimens) of the mean UCS value for rock domain (3) is 43.3 – 57.8 MPa (Table 4) which do not include the mean UCS (62.2 MPa) of the 47 available specimens at Mine A (Table 1). The same trend is observed for the 80% confidence interval on the standard deviation, except for domain (3) for which the 80% CI (15.6 – 26.7 MPa) includes the standard deviation (20.6 MPa) of the 47 available strength data. For domains (5) and (6), the upper limit of the 80% CI on the standard deviation is significantly lower than the standard deviation obtained for the total available data. For example, the 80% CI (considering a small sample size of 6 specimens) of the standard deviation for rock domain (5) is 3.5 – 8.5 MPa (Table 4) which do not include the standard deviation (25.0 MPa) of the 24 available specimens at Mine A (Table 1). This suggests that some existing extreme values were not included in the analyses because of the order in which the test results were added in the iterations performed to determine the minimum sample size. The results for the true mean interval of domain (3) also show the influence of the test results sequence. As shown in Table 4, the range of values is shifting towards larger numbers when CI increases and at 99% CI, the range is almost beyond the range obtained at 80% CI. These results can be explained by the introduction of higher UCS values as the sample size increases. For this particular case (domain (3)), the 99% CI includes the maximum and minimum UCS values of all available data (22.1 and 103.1 MPa, respectively), but the 80% CI only includes the minimum UCS value. This can also explain why the mean value of all available data at Mine A for rock domain (3) (62.2 MPa) is outside the true mean interval at 80% and 90% CI (see Table 4).
To evaluate the impact of the test results sequence on the minimum sample size found using Gill et al. (2005a) algorithm for an 80% CI, five to six simulations were conducted per rock domains by randomly interchanging the order of the test results (Table 6). An example of the simulations performed for rock domain (1) is presented in Table 7. As shown in the ‘UCS test results’ column of Table 7, the first four results are not the same for simulation ‘a’ (i.e. 116.6, 90.9, 156.7 and 60.2 MPa) than for simulation ‘b’ (i.e. 73.9, 156.7, 103.1 and 107.1 MPa). The test result sequences for each different simulation in Table 6 were obtained using the random number generation function in Excel to assign a random number to each test result and by sorting the random numbers to interchange the test results.

Geotechnical models
Slope Stability 2013, Brisbane, Australia 9
Rock Domain
CI (%)
n p* Mean UCS
(MPa)
Standard deviations
(MPa)
Coefficient of variation
cv (%)
True mean interval
Lower–Upper (MPa)
True std. dev. Interval
Lower–Upper (MPa)
(1)
80
70
≥14
11
–
1.33
–
85.3
–
36.6
–
42.9
–
73.3–97.4
–
30.2–49.3
(2) 80
70
60
55
≥18
≥10
≥11
6
–
–
–
1.33
–
–
–
206.3
–
–
–
86.9
–
–
–
42.1
–
–
–
177.3–235.4
–
–
–
73.7–122.6
(3) 80
90
95
99
13
18
23
37
1.34
1.33
1.34
1.35
50.5
53.3
58.3
62.7
19.4
18.6
19.5
20.8
38.3
34.9
33.4
33.2
43.3–57.8
45.6–60.9
49.9–66.8
53.5–72.1
15.6–26.7
14.6–26.0
15.1–27.6
15.9–29.5
(4) 80
75
70
≥20
≥18
8
–
–
1.32
–
–
14.3
–
–
4.9
–
–
34.5
–
–
12.3–16.2
–
–
4.0–7.1
(5) 80
90
95
99
6
7
9
≥60
1.30
1.33
1.32
22.6
22.6
22.4
4.8
4.4
4.0
21.4
19.5
17.8
19.6–25.5
19.4–25.8
19.3–25.4
3.5–8.5
3.0–8.4
2.7–7.6
(6) 80
90
95
5
7
≥12
1.35
1.31
–
22.9
22.5
–
4.9
4.1
–
21.6
18.4
–
19.5–26.3
19.4–25.5
–
3.5–9.6
2.9–7.9
–
Reliability of strength estimates based on limited laboratory data M-H. Fillion and J. Hadjigeorgiou
10 Slope Stability 2013, Brisbane, Australia
Iteration p cvi
(%)
Ni UCS Test Results (MPa)
(MPa)
Si
(MPa) cvobi (%)
Iterations for domain (1) for a 80% confidence interval
1 1.35 15.00 4 116.6, 90.9, 156.7, 60.2 106.1 40.9 38.51
2 26.76 7 53.5, 29.9, 74.8 83.2 42.6 51.21
3 38.98 13 57.0, 73.9, 107.1, 118.0, 144.1, 103.1
91.2 37.3 40.93
4 39.96 14
Not enough data for a confidence interval of 80%
Iterations for domain (1) for a 70% confidence interval
1 1.35 20.00 4 116.6, 90.9, 156.7, 60.2 106.1 40.9 38.51
2 29.26 6 53.5, 29.9 84.6 46.5 54.96
3 42.11 10 74.8, 57.0, 73.9, 107.1 82.1 36.9 44.92
4 1.33 43.51 11 118.0 85.3 36.6 42.91
Minimum sample size = 11; confidence interval of 70% with p* = 1.33

Geotechnical models
Slope Stability 2013, Brisbane, Australia 11
Rock Domain
SimID
n p* Mean UCS
(MPa)
Standard Deviations
(MPa)
Coefficient of Variation
cv (%)
True Mean Interval
Lower–Upper (MPa)
True Std. Dev. Interval
Lower–Upper (MPa)
(1)
a
b
c
d
e
≥14
12
10
≥14
≥14
–
1.32
1.34
–
–
–
96.3
92.5
–
–
–
33.9
30.5
–
–
–
35.2
30.5
–
–
–
83.0 – 109.6
79.3 – 105.8
–
–
–
26.1 – 44.8
22.9 – 41.4
–
–
Rock Domain
SimID
n p* Mean UCS
(MPa)
Standard Deviations
(MPa)
Coefficient of Variation
cv (%)
True Mean Interval
Lower–Upper (MPa)
True Std. Dev. Interval
Lower–Upper (MPa)
(2) a
b
c
d
e
≥9
≥20
≥20
≥20
≥15
–
–
–
–
–
–
–
–
–
–
–
–
–
–
–
–
–
–
–
–
–
–
–
–
–
–
–
–
–
–
(3) a
b
c
d
e
13
12
12
4
8
1.34
1.34
1.32
1.26
1.33
50.5
58.0
65.0
76.1
59.2
19.4
21.5
22.9
10.9
16.9
38.3
37.0
35.3
14.3
28.5
43.3–57.8
49.6–66.4
56.0–73.9
67.8–84.4
50.8–67.5
15.1–25.3
16.5–28.4
17.6–30.3
6.7–18.3
12.2–23.9
(4) a
b
c
d
e
f
≥20
≥16
≥18
≥17
≥22
5
–
–
–
–
–
1.34
–
–
–
–
–
17.2
–
–
–
–
–
3.7
–
–
–
–
–
21.4
–
–
–
–
–
14.8–19.6
–
–
–
–
–
2.4–5.8
(5) a
b
c
d
e
6
≥29
≥30
5
≥28
1.30
–
–
1.28
–
22.6
–
–
22.3
–
4.8
–
–
4.0
–
21.4
–
–
17.8
–
19.7–25.4
–
–
19.7–24.9
–
3.3–7.3
–
–
2.6–6.2
–
(6) a
b
c
d
e
5
≥12
≥12
10
4
1.35
–
–
1.32
1.10
22.9
–
–
26.9
22.3
5.0
–
–
8.6
1.3
21.6
–
–
31.8
5.9
19.7–26.2
–
–
23.2–30.6
21.3–23.3
3.3–7.8
–
–
6.4–11.6
0.8–2.2

Reliability of strength estimates based on limited laboratory data M-H. Fillion and J. Hadjigeorgiou
12 Slope Stability 2013, Brisbane, Australia
Iteration p cvi
(%)
Ni UCS Test Results (MPa)
(MPa)
Si
(MPa) cvobi
(%)
Iterations For Domain (1) For Simulation a (Table 6)
1 1.35 15.00 4 116.6, 90.9, 156.7, 60.2 106.1 40.9 38.51
2 26.76 7 53.5, 29.9, 74.8 83.2 42.6 51.21
3 38.98 13 57.0, 73.9, 107.1, 118.0, 144.1, 103.1
91.2 37.3 40.93
4 39.96 14
Not enough data for a confidence interval of 80%
Iterations For Domain (1) For Simulation b (Table 6)
1 1.35 15.00 4 73.9, 156.7, 103.1, 107.1 110.2 34.4 31.17
2 23.09 6 144.1, 53.5 106.4 39.5 37.16
3 30.12 9 90.9, 60.2, 57.0 94.1 37.5 39.89
4 35.01 11 74.8, 116.6 94.4 34.8 36.93
5
6
1.36
1.32
35.97 11
12
118.0
96.3
33.9
35.21
Minimum sample size = 12; confidence interval of 80% with p* = 1.32
The results presented in Table 6 show that the minimum sample size is significantly influenced by the test results sequence. This is particularly evident when reviewing the obtained results for rock domain (4) which shows that for simulations a, b, c, d and e, the minimum sample size should be greater than 16. However, simulation ‘f’, performed for the same rock domain showed that 5 specimens were sufficient to reach the 80% confidence interval. The difference between simulation ‘f’ and the other simulations is that the extreme values are not included in the small sample of five specimens and consequently, the coefficient of variation is quite low (21.4%). Fewer specimens are then required to reach the 80% CI. The results indicated in bold and italics in Table 6 represent the simulations for which the 80% CI on the mean and the standard deviation includes the mean and the standard deviation calculated for all available data at Mine A (Tables 1). As shown in Table 6, small sample sizes with around 8 to 12 specimens usually include the mean and standard deviation of the larger sample. However, the results of simulation ‘a’ performed for rock domain (3), show that it is not always the case.
The results of this study are in general agreement with the results presented by Gill et al. (2005a) and Ruffolo and Shakoor (2009), i.e. that the minimum sample size varies from one case to another and that a rigorous approach must be used when dealing with the minimum sample size required. Furthermore, the results showed that the minimum number of specimens of five suggested by the ISRM is clearly not enough to obtain a reliable estimate of confidence limits on the true mean of the measured parameter. Based on the number of specimens tested at Mine A, the results of this study also showed that, for a given precision index of 1.35, more strength data are required for most of the rock domains to reach an 80% confidence level as suggested by Read (2009). The very high coefficient of correlation may be an indicator of the potential presence of sub-domains with more similar strength values. For example, it is

Geotechnical models
Slope Stability 2013, Brisbane, Australia 13
expected that two different rock sills (magma intrusions) will have different strengths so a distinct rock domain should be assigned to each rock sill. The same suggestion is valid for similar rocks from different formation events. For example, in this case study rock domain (4) included sedimentary rocks from two different formation events. It is recognised that different formation events may generate rocks with distinct characteristics depending on the formation environment so domain (4) should be divided in two distinct rock domains. Note that, subsequent to the feasibility study, domain (4) was divided in two distinct rock domains at Mine A.
The low confidence (<80%) in the estimated limits of the true mean for most of the rock domains at Mine A may contribute to the explanation of some unexpected slope failures that occurred. Indeed, many rock mass related slope failures occurred in rock domain (4) in the past years but no important failure occurred in the other domains. It is interesting to note that, in the feasibility study, the design strength parameters were scaled down based on the consultant engineering judgement except for domain (4) in which most of the slope failures have occurred.
Furthermore, the results showed that the minimum sample size obtained using the confidence interval approach is significantly influenced by the sequence of test results used for the analyses. This suggests that if the testing sequence is realised in such a way that some extreme values are not included in the sample tested (e.g. the first specimens are from the same drill hole or drill holes close to each other at similar depths), the coefficient of variation for the few first results is quite low so an acceptable level of confidence may be obtained and it may be decided to not test more specimens. However, if some more specimens are tested, extreme values may be included in the sample and, based on the results (cv and p), more specimens may be required to reach an acceptable level of confidence in the data. When rock properties show characteristics of regionalised random variables, the testing program should ensure that the distance between sampling points is sufficient to avoid a spatial correlation between the test results. Indeed, if such a correlation exists, the standard deviation is underestimated. Geostatistics could be used to provide the minimum distance between sampling points which gives the highest variance and allows the sample values to be uncorrelated. This distance is called ‘range’ and is obtained from a variogram (Matheron, 1963). However, a large number of data (>30) is required to estimate a variogram which is typically unrealistic for geotechnical data collection because of the high costs of laboratory testing. Finally, it has clearly been demonstrated that there is a need for a method to determine the minimum sample size while minimising the influence of the testing sequence.
This paper provided a quantitative assessment of the results of a testing program in an open pit mine to determine uniaxial strength of intact rock in different domains. In this particular case study the mine had a comprehensive database that met all standard practice criteria and complied with ISRM guidelines regarding testing procedures. This is in fact the industry standard.
Of interest in this work was to explore the potential small sampling theory as an alternate means in guiding an operation in planning and interpreting the results of a testing program. In this case study the use of small sampling theory identified the limitations and difficulties in deciding ‘a priori’ the number of tests required for planning purposes. The proposed approach allows a clearer understanding of the uncertainty in the available data and consequently can aid in the interpretation of subsequent slope stability analysis. The effort in collecting good and sufficient input data is justified given the increased access to sophisticated and powerful computational tools for pit slope stability.
The authors gratefully acknowledge Anglo American for allowing access to their geotechnical database. The financial support of the Natural Science and Engineering Research Council of Canada is greatly appreciated.

Reliability of strength estimates based on limited laboratory data M-H. Fillion and J. Hadjigeorgiou
14 Slope Stability 2013, Brisbane, Australia
Bieniawski, Z.T. and Bernede, M.J. (1979) Suggested methods for determining the uniaxial compressive strength and deformability of rock materials, International Journal of Rock Mechanics and Mining Sciences, Vol. 16, No. 2, pp. 137−140.
Gill, D.E., Corthésy, R. and Leite, M.H. (2005a) Determining the minimal number of specimens for laboratory testing of rock properties, Engineering Geology, Vol. 78, pp. 29–51.
Gill, D.E., Corthésy, R. and Leite, M.H. (2005b) A statistical approach for determining practical rock strength and deformability values from laboratory tests, Engineering Geology, Vol. 78, pp. 53–67.
Hadjigeorgiou, J. (2012) Where do the data come from? In Proceedings Sixth International Seminar on Deep and High Stress Mining (Deep Mining 2012), Y. Potvin (ed), 28–30 March 2012, Perth, Australia, Australian Centre for Geomechanics, Perth, pp. 259–278.
Hines, W.W., Montgomery, D.C., Goldsman, D.M. and Borror, C.M. (2003) Probability and statistics in engineering, Fourth Edition, John Wiley & Sons, p. 655.
Hoek, E. (1998) Reliability of the Hoek-Brown estimates of rock mass properties and their impact on design, International Journal of Rock Mechanics and Mining Sciences, Vol. 35, No. 1, pp. 63–68.
Kostak, B., Bielenstein, H.U. (1971) Strength distribution in hard rock, International Journal of Rock Mechanics and Mining Sciences, Vol. 8, pp. 501–521.
Matheron, G. (1963) Principles of geostatistics, Economic Geology, Vol. 58, pp. 1246–1266. Montgomery, D.C. and Runger, G.C. (2003) Applied Statistics and Probability for Engineers, Third Edition, John Wiley & Sons. Read, J. (2009) Data Uncertainty, Guidelines for Open Pit Slope Design, J. Read and P. Stacey (eds), CRC Press/Balkema.
pp. 213–220. Ruffolo, R.M. and Shakoor, A. (2009) Variability of unconfined compressive strength in relation to number of test samples,
Engineering Geology, Vol. 108, pp. 16–23. Sari, M. and Karpuz, C. (2006) Rock variability and establishing confining pressure levels for triaxial tests on rocks, International
Journal of Rock Mechanics and Mining Sciences, Vol. 43, pp. 328–335. Spiegel, M.R. (1961) Theory and problems of statistics, Schaum’s Outline Series, McGraw-Hill, p. 359.