m-ncppc research & technology center annual update 2004 economic forces that shape montgomery...
TRANSCRIPT

M-NCPPC Research & Technology Center
Annual Update 2004Annual Update 2004
Economic Forces That Shape Montgomery County

M-NCPPC Research & Technology Center
2004 Conclusions• National downturn felt in local job market
between 2nd quarters of 2002 and 2003.• Jobs: private sector up slightly, but mostly
low- and mid-wage industries.• Federal impact: leasing & employment
outlook still strong• Commercial market: “short, mild” recession
longer than expected.• Housing market: price increases accelerate
as affordability suffers.

M-NCPPC Research & Technology Center
Pluses & Minuses
+ Jobs: private sector adds some jobs during depth of recession, second half of 2003 looks better, unemployment rate still low
+ Federal government retains strong role as employer and tenant
+ County still in good position to weather commercial space recession
+ Housing market still extremely strong

M-NCPPC Research & Technology Center
Pluses & Minuses
- Jobs declined in second quarter. Losses felt disproportionately in technology and other high-wage industries
- Commercial construction: exiting short, mild recession phase; vacancy rates are up
- Housing affordability worsens.
M-NCPPC Research & Technology Center
Job Growth Job Growth PerformancePerformance
2nd Quarter 2002 to 2nd Quarter 2003

M-NCPPC Research & Technology Center
Job growth themes• The number of jobs increased by 1,921 to
452,169
• Biotech bright spot among tech sectors.– Aerospace: down 17%– Biotechnology: up 5%– Infotech & telecom (infocom): down 3%– High tech manufacturing: down 11%
• Higher wage industries lost jobs.
• Third quarter preview: jobs up 384 over previous year.

M-NCPPC Research & Technology Center
Total jobs grew by about 1,900
-20,000
-15,000
-10,000
-5,000
0
5,000
10,000
15,000
20,000
25,00019
91
1992
1993
1994
1995
1996
1997
1998
1999
2000
2001
2002
2003
Between the second quarters of 2002 and 2003, Montgomery County added 1,921 jobs, or 0.4 percent.
Second quarter figures (change from previous year)
Source: RESI compilation of DLLR data

M-NCPPC Research & Technology Center
Tech jobs losses continue locally and nationally
90
95
100
105
110
115
120
125
130
135
1988
Q1
1988
Q4
1989
Q3
1990
Q2
1991
Q1
1991
Q4
1992
Q3
1993
Q2
1994
Q1
1994
Q4
1995
Q3
1996
Q2
1997
Q1
1997
Q4
1998
Q3
1999
Q2
2000
Q1
2000
Q4
2001
Q3
2002
Q2
2003
Q1
There are 51,000 high tech jobs in Montgomery County.
United States
Maryland
Montgomery Co.
Ind
e x:
1 99 0
Q1 =
1 00
Source: RESI compilation of DLLR data (2003Q2)

M-NCPPC Research & Technology Center
Aerospace jobs drop sharply
707580859095
100105110115
1988
Q119
88Q4
1989
Q319
90Q2
1991
Q119
91Q4
1992
Q319
93Q2
1994
Q119
94Q4
1995
Q319
96Q2
1997
Q119
97Q4
1998
Q319
99Q2
2000
Q120
00Q4
2001
Q320
02Q2
2003
Q1There are 15,000 aerospace industry jobs in Montgomery County.
United StatesMaryland
Montgomery Co.Ind
e x:
1 99 0
Q1 =
1 00
Source: RESI compilation of DLLR data (2003Q2)

M-NCPPC Research & Technology Center
Biotech grows 5%
100110120130140150160170180190200
1988
Q119
88Q4
1989
Q319
90Q2
1991
Q119
91Q4
1992
Q319
93Q2
1994
Q119
94Q4
1995
Q319
96Q2
1997
Q119
97Q4
1998
Q319
99Q2
2000
Q120
00Q4
2001
Q320
02Q2
2003
Q1There are 8,500 biotech industry jobs in Montgomery County.
Ind
e x:
1 99 0
Q1 =
1 00
United States
Maryland
Montgomery Co.Source: RESI compilation of DLLR data (2003Q2)

M-NCPPC Research & Technology Center
County infocom jobs down 3%
80
90
100
110
120
130
140
150
160
1988
Q119
88Q4
1989
Q319
90Q2
1991
Q119
91Q4
1992
Q319
93Q2
1994
Q119
94Q4
1995
Q319
96Q2
1997
Q119
97Q4
1998
Q319
99Q2
2000
Q120
00Q4
2001
Q320
02Q2
2003
Q1
There are 19,500 information technology and telecommunications industry jobs in Montgomery County.
United StatesMarylandMontgomery Co.In
de x
: 1 9
9 0Q
1 =1 0
0
Source: RESI compilation of DLLR data (2003Q2)

M-NCPPC Research & Technology Center
County has 1,100 fewer high tech manufacturing jobs
60
70
80
90
100
110
120
1988
Q119
88Q4
1989
Q319
90Q2
1991
Q119
91Q4
1992
Q319
93Q2
1994
Q119
94Q4
1995
Q319
96Q2
1997
Q119
97Q4
1998
Q319
99Q2
2000
Q120
00Q4
2001
Q320
02Q2
2003
Q1There are 8,700 high tech manufacturing jobs in Montgomery County.
Ind
e x:
1 99 0
Q1 =
1 00
United StatesMaryland
Montgomery Co.
Source: RESI compilation of DLLR data (2003Q2)

M-NCPPC Research & Technology Center
Construction jobs hold steady
60
70
80
90
100
110
120
130
140
1988
Q119
88Q4
1989
Q319
90Q2
1991
Q119
91Q4
1992
Q319
93Q2
1994
Q119
94Q4
1995
Q319
96Q2
1997
Q119
97Q4
1998
Q319
99Q2
2000
Q120
00Q4
2001
Q320
02Q2
2003
Q1There are 28,700 construction jobs in Montgomery County.
United States
MarylandMontgomery Co.
Ind
e x:
1 99 0
Q1 =
1 00
Source: RESI compilation of DLLR data (2003Q2)

M-NCPPC Research & Technology Center
Wholesale trade: slight decline
60
70
80
90
100
110
120
1988
Q119
88Q4
1989
Q319
90Q2
1991
Q119
91Q4
1992
Q319
93Q2
1994
Q119
94Q4
1995
Q319
96Q2
1997
Q119
97Q4
1998
Q319
99Q2
2000
Q120
00Q4
2001
Q320
02Q2
2003
Q1There are 10,600 wholesale trade jobs in Montgomery County.
Ind
e x:
1 99 0
Q1 =
1 00 United States
Maryland
Montgomery Co.
Source: RESI compilation of DLLR data (2003Q2)

M-NCPPC Research & Technology Center
Retail trade drops 1%
80859095
100105110115120125130
1988
Q119
88Q4
1989
Q319
90Q2
1991
Q119
91Q4
1992
Q319
93Q2
1994
Q119
94Q4
1995
Q319
96Q2
1997
Q119
97Q4
1998
Q319
99Q2
2000
Q120
00Q4
2001
Q320
02Q2
2003
Q1There are 49,500 retail trade jobs in Montgomery County.
United States
Maryland
Montgomery Co.
Ind
e x:
1 99 0
Q1 =
1 00
Source: RESI compilation of DLLR data (2003Q2)

M-NCPPC Research & Technology Center
Business services unchanged
80
100
120
140
160
180
200
220
1988
Q119
88Q4
1989
Q319
90Q2
1991
Q119
91Q4
1992
Q319
93Q2
1994
Q119
94Q4
1995
Q319
96Q2
1997
Q119
97Q4
1998
Q319
99Q2
2000
Q120
00Q4
2001
Q320
02Q2
2003
Q1
There are 94,800 business services jobs in Montgomery County.
United States
MarylandMontgomery Co.
Ind
e x:
1 99 0
Q1 =
1 00
Source: RESI compilation of DLLR data (2003Q2)
M-NCPPC Research & Technology Center
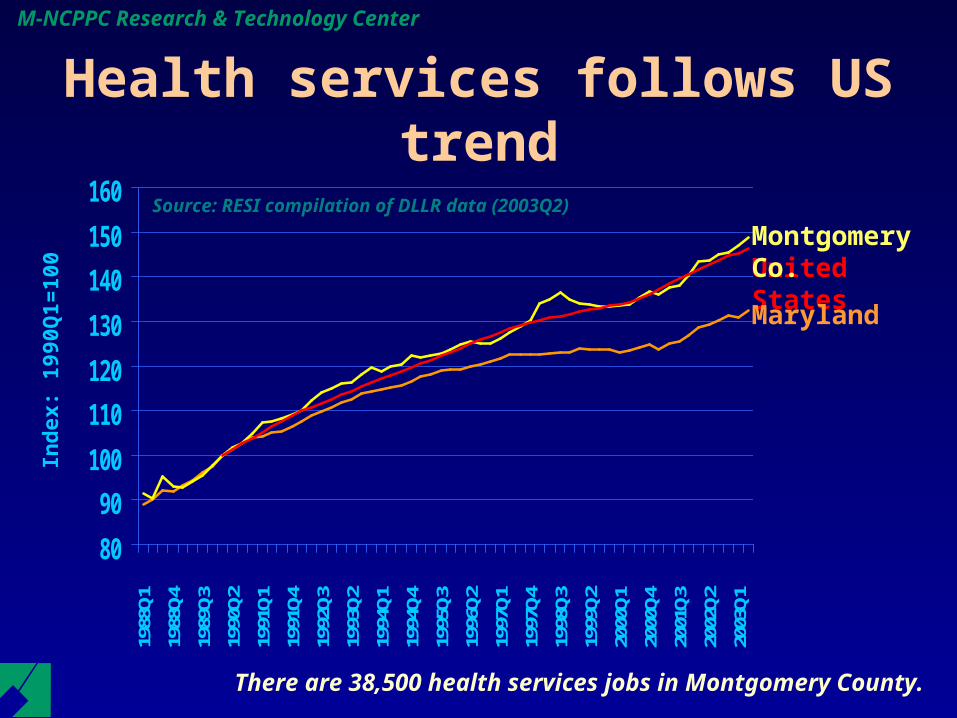
Health services follows US trend
80
90
100
110
120
130
140
150
160
1988
Q119
88Q4
1989
Q319
90Q2
1991
Q119
91Q4
1992
Q319
93Q2
1994
Q119
94Q4
1995
Q319
96Q2
1997
Q119
97Q4
1998
Q319
99Q2
2000
Q120
00Q4
2001
Q320
02Q2
2003
Q1
There are 38,500 health services jobs in Montgomery County.
United States
Maryland
Montgomery Co.
Ind
e x:
1 99 0
Q1 =
1 00
Source: RESI compilation of DLLR data (2003Q2)

M-NCPPC Research & Technology Center
90
100
110
120
130
140
150
160
170
1988
Q119
88Q4
1989
Q319
90Q2
1991
Q119
91Q4
1992
Q319
93Q2
1994
Q119
94Q4
1995
Q319
96Q2
1997
Q119
97Q4
1998
Q319
99Q2
2000
Q120
00Q4
2001
Q320
02Q2
2003
Q1
There are 21,900 engineering & management services jobs in Montgomery County.
United States
Maryland
Montgomery Co.
Engineering & management services down 7.4%
Ind
e x:
1 99 0
Q1 =
1 00
Source: RESI compilation of DLLR data (2003Q2)

M-NCPPC Research & Technology Center
95
100
105
110
115
120
125
130
1988
Q1
1988
Q4
1989
Q3
1990
Q2
1993
Q3
1994
Q2
1995
Q1
1995
Q4
1996
Q3
1997
Q2
1998
Q1
1998
Q4
1999
Q3
2000
Q2
2001
Q1
2001
Q4
2002
Q3
2003
Q2
There are 11,700 real estate jobs in Montgomery County.
United States
Maryland
Montgomery Co.
Real estate jobs climb 3%
Ind
e x:
1 98 8
Q1 =
1 00
Source: RESI compilation of DLLR data (2002Q2)

M-NCPPC Research & Technology Center
How well do the new jobs pay?
• High: Industries with jobs that pay an average of $50,000
• Medium: Industries with jobs that pay an average of $30,000 to $49,999
• Low: Industries with jobs that pay an average of less than $30,000
We track job growth by average salary to show how well new jobs are paying:

M-NCPPC Research & Technology Center
80
85
90
95
100
105
110
115
120
125
130
There are 77,200 jobs in high-wage industries, 195,800 jobs in medium-wage industries, and 133,000 jobs in low-wage industries in Montgomery County.
High: -1.4%
Middle: 2.1%
Low: 1.1%
Middle-wage industries are adding more jobs
Source: RESI compilation of DLLR data (2003Q2)
Ind
e x:
1 98 8
Q1 =
1 00

M-NCPPC Research & Technology Center
Regional statistics show growth in second half of 2003
-40
-20
0
20
40
60
80
100At-place employment (change from previous year)
Source: BLS, DLLR
20022001 2003
Washington MSA
Montgomery Co.

M-NCPPC Research & Technology Center
Jobless rate back under 3%
0.0%
0.5%
1.0%
1.5%
2.0%
2.5%
3.0%
3.5%
4.0%
4.5%
There are 13,000 unemployed persons in Montgomery County.
Jan 1988: 2.6%
June 1992: 3.9%
Jan 2003: 2.6%
Source: MD DLLR

M-NCPPC Research & Technology Center
TCA caseload rises slightly
0
2,000
4,000
6,000
8,000
10,000
12,000
14,000
There are 2,693 recipients of temporary cash assistance in Montgomery County.
Jan 1986: 7,783
April 1995: 13,004
Jan 2004: 2,693
Source: MD DLLR

M-NCPPC Research & Technology Center
Federal Government Federal Government RoleRole

M-NCPPC Research & Technology Center
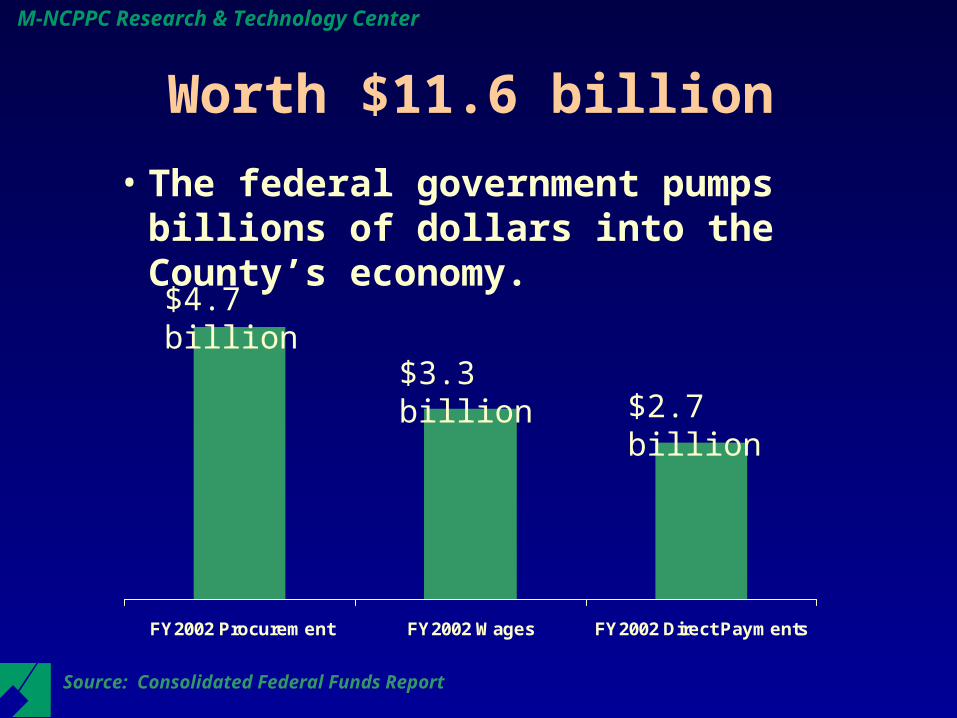
The federal government is a major component of
Montgomery County’s economy As an employer,
– Almost 60,000 workers are in federal space,– In FY2002, the federal government paid $3.3
billion in wages to jobs in Montgomery County
As a tenant,– The General Services Administration leases 6.9
million square feet of commercial space in the County,
As a purchaser of goods and services,– FY02’s federal procurement was $4.7 billion the
County’s all-time high.
M-NCPPC Research & Technology Center
Worth $11.6 billion
FY2002 Procurement FY2002 Wages FY2002 Direct Payments
$4.7 billion
$3.3 billion$2.7 billion
Source: Consolidated Federal Funds Report
• The federal government pumps billions of dollars into the County’s economy.
M-NCPPC Research & Technology Center
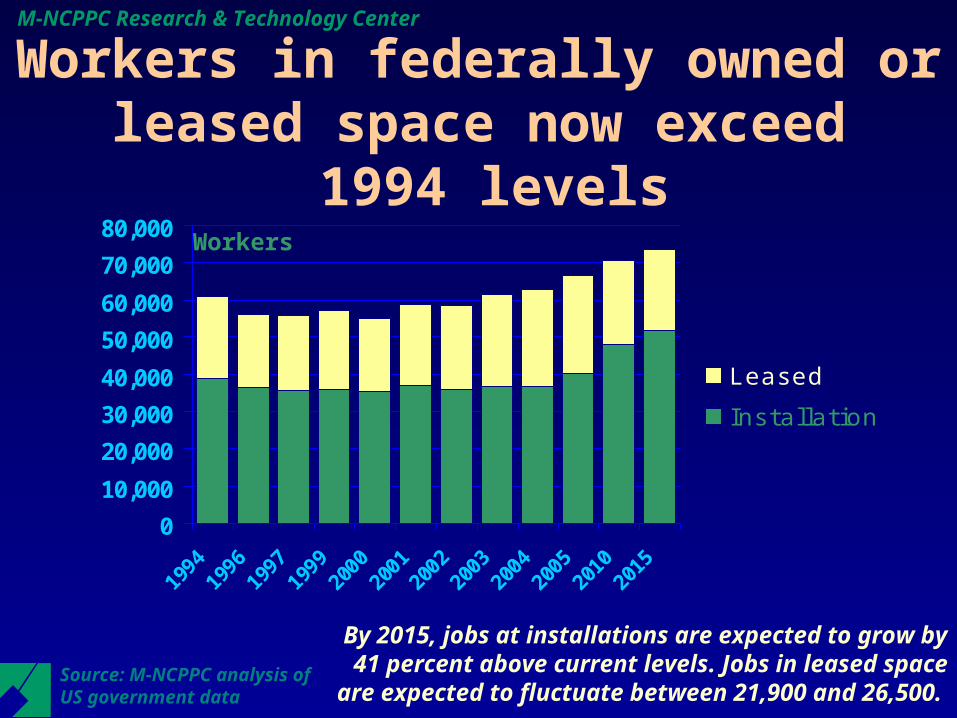
Workers in federally owned or leased space now exceed
1994 levels
0
10,000
20,000
30,000
40,000
50,000
60,000
70,000
80,000
1994
1996
1997
1999
2000
2001
2002
2003
2004
2005
2010
2015
Leased
Installation
Workers
By 2015, jobs at installations are expected to grow by 41 percent above current levels. Jobs in leased space are expected to fluctuate between 21,900 and 26,500.
Source: M-NCPPC analysis of US government data

M-NCPPC Research & Technology Center
Federal leasing reaches 6.9 million sq. ft.
Source: General Services Administration (GSA)
Square feet
Since 1994, GSA has leased between 6.0 and 6.9 million square feet of commercial space in
Montgomery County
0
1,000,000
2,000,000
3,000,000
4,000,000
5,000,000
6,000,000
7,000,000
8,000,000
1984 1989 1994 1996 1997 1999 2000 2002 2003 2004
M-NCPPC Research & Technology Center
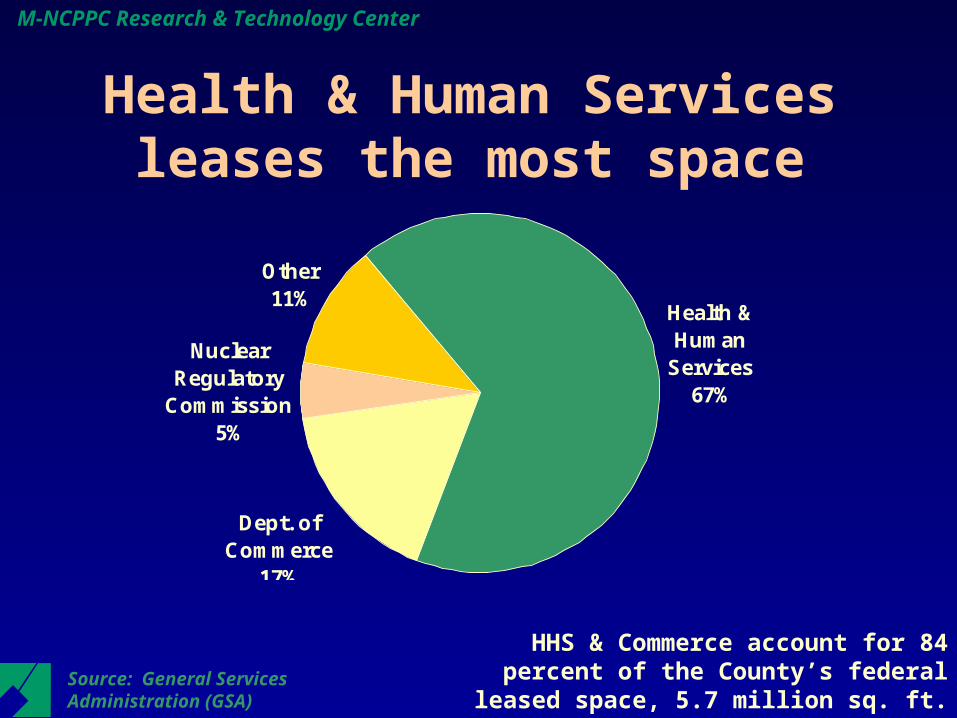
Health & Human Services leases the most space
Health & Human
Services67%
Dept. of Commerce
17%
Other11%
Nuclear Regulatory
Commission5%
Source: General Services Administration (GSA)
HHS & Commerce account for 84 percent of the County’s federal leased space, 5.7 million
sq. ft. out of a total of 6.9 million sq. ft.

M-NCPPC Research & Technology Center
Rockville area home to most federal leased space
Rockville57%
Silver Spring18%
Bethesda15%
Gaithersburg6%
Other4%
GSA leases 3.9 mil. sq. ft. in Rockville (which includes most of North Bethesda), 1.3 mil. sq. ft. in Silver Spring, and 1.1 mil.
sq. ft. in Bethesda.Source: General Services Administration (GSA)

M-NCPPC Research & Technology Center
30 percent of GSA’s leased space in Montgomery County is renewable in the next 2 years (2004-2005)
0
200,000
400,000
600,000
800,000
1,000,000
1,200,000
1,400,000
1,600,000
1,800,000
2004 2005 2006 2007 2008 2009 2010 2011 2012 2013
sq. ft. of leased space by lease expiration year
Source: General Services Administration (GSA)
Leases for 2.1 million sq. ft. up for renewal in 2004-2005

M-NCPPC Research & Technology Center
Where Is the County’s Office Market Headed?

M-NCPPC Research & Technology Center
The real estate cycle provides a framework for understanding
Ne
t A
bso
rpti
on
Expansion
(Phase 2)
Recovery
(Phase 1)
Oversupply(Phase 3)
Recession
(Phase 4)
2001
2000
1980,1997
1994
1988
1991
Time
2002
2003
2004

M-NCPPC Research & Technology Center
The Washington, DC RegionClass A Office Market

M-NCPPC Research & Technology Center
The region’s vacant Class A office space climbs
0
5,000,000
10,000,000
15,000,000
20,000,000
25,000,000
2000 2001 2002 2003 2004
Source: CoStar Group, Property Professional Database, Analytical Search, Historical Trends
1st quarter data, in square feet

M-NCPPC Research & Technology Center
4,138,0484,741,295
13,828,99413,380,732
4,350,8783,609,3720
5,000,000
10,000,000
15,000,000
20,000,000
25,000,000
1st Qtr 2003 1st Qtr 2004
Much of region’s vacant Class A office space is in Northern Virginia
Source: CoStar Group, Property Professional Database, Analytical Search, Historical Trends
Suburban MarylandSuburban Maryland
Washington, DC
Northern Virginia
Square feet

M-NCPPC Research & Technology Center
First quarter 2004 exhibits slowing of Class A office space absorption
DC DCDC
VA
MD
MD
MD
MDMD
DC
DCVA
VA
VA
VA
-500,000
0
500,000
1,000,000
1,500,000
2,000,000
2,500,000
3,000,000
2000 2001 2002 2003 2004
Source: CoStar Group, Property Professional Database, Analytical Search, Historical Trends
1st quarter Class A office space absorption, in square feet

M-NCPPC Research & Technology Center
DC asking rents increases, bucking regional trend
$0$5
$10$15
$20$25
$30$35
$40$45
$50
2000 2001 2002 2003 2004
Source: CoStar Group, Property Professional Database, Analytical Search, Historical Trends
Average asking price for Class A office space – first quarter
Suburban Maryland: $26
Washington, DC: $44
Northern Virginia: $26
Regional average: $30
M-NCPPC Research & Technology Center
The Montgomery CountyOffice Market

M-NCPPC Research & Technology Center
County’s Class A office space rents steady compared to Fairfax
$0
$5
$10
$15
$20
$25
$30
$35
1995 1996 1997 1998 1999 2000 2001 2002 2003 2004
Source: CoStar Group, Property Professional Database, Analytical Search, Historical Trends
Montgomery County: $29
Fairfax County: $25
Average rent for Class A office space – first quarter

M-NCPPC Research & Technology Center
About 100,000 sf of Class A space absorbed in 1st quarter 2004
-400,000
-200,000
0
200,000
400,000
600,000
800,000
19
95
19
96
19
97
19
98
19
99
20
00
20
01
20
02
20
03
20
04
Source: CoStar Group, Property Professional Database, Analytical Search, Historical Trends
Montgomery County net class A office space absorption, in square feet

M-NCPPC Research & Technology Center
2,676,965
3,487,113
28,204,53627,339,60725,728,802
2,945,088
991,0431,111,775
1,022,121
0
5,000,000
10,000,000
15,000,000
20,000,000
25,000,000
30,000,000
35,000,000
2002 2003 2004
Direct vacant
Occupied
Sublet vacant
Source: CoStar Group, Property Professional Database, Analytical Search, Historical Trends
Total Class A space grows, as does vacant & occupied.

M-NCPPC Research & Technology Center
Vacancy rates return to 1995 levels; Class C space has lowest rate
0.0%
2.0%
4.0%
6.0%
8.0%
10.0%
12.0%
14.0%
16.0%
18.0%
1995 1996 1997 1998 1999 2000 2001 2002 2003 2004
Source: CoStar Group, Property Professional Database, Analytical Search, Historical Trends
All types
M-NCPPC Research & Technology Center
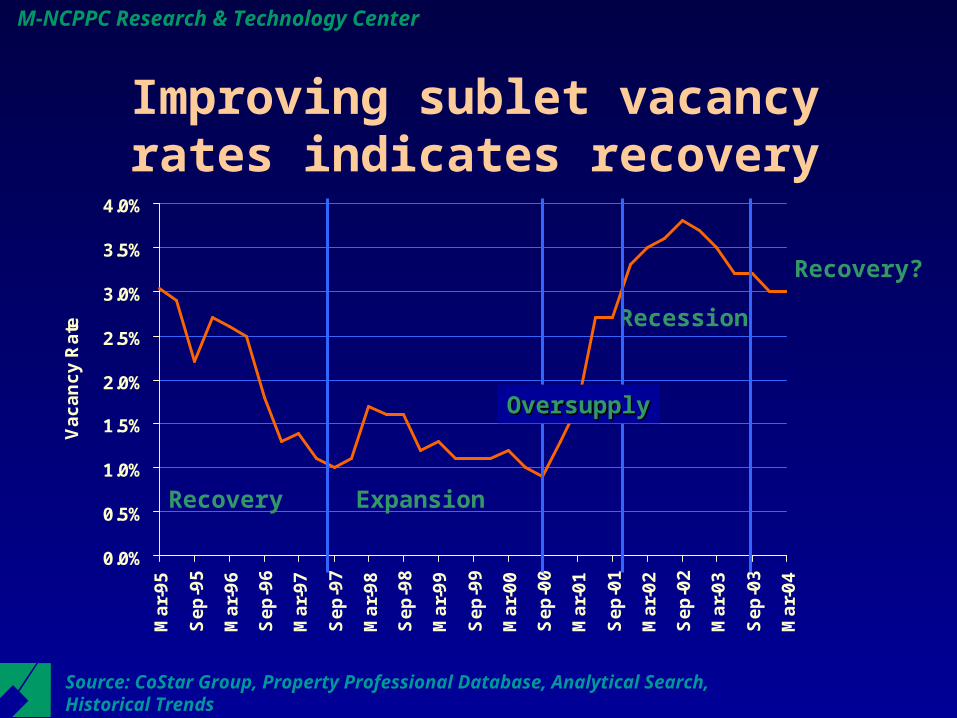
Improving sublet vacancy rates indicates recovery
0.0%
0.5%
1.0%
1.5%
2.0%
2.5%
3.0%
3.5%
4.0%
Ma
r-9
5
Se
p-9
5
Ma
r-9
6
Se
p-9
6
Ma
r-9
7
Se
p-9
7
Ma
r-9
8
Se
p-9
8
Ma
r-9
9
Se
p-9
9
Ma
r-0
0
Se
p-0
0
Ma
r-0
1
Se
p-0
1
Ma
r-0
2
Se
p-0
2
Ma
r-0
3
Se
p-0
3
Ma
r-0
4
Va
ca
nc
y R
ate
Recovery Expansion
Recession
Recovery?
Source: CoStar Group, Property Professional Database, Analytical Search, Historical Trends
OversupplyOversupply
M-NCPPC Research & Technology Center
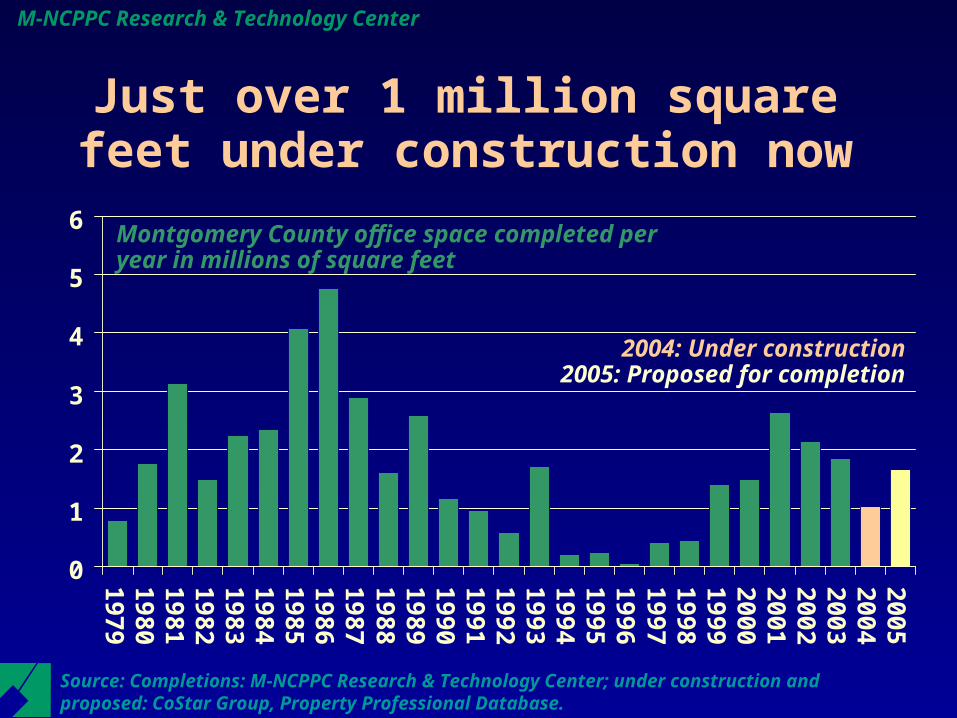
Just over 1 million square feet under construction now
0
1
2
3
4
5
6
19
79
19
80
19
81
19
82
19
83
19
84
19
85
19
86
19
87
19
88
19
89
19
90
19
91
19
92
19
93
19
94
19
95
19
96
19
97
19
98
19
99
20
00
20
01
20
02
20
03
20
04
20
05
Montgomery County office space completed per year in millions of square feet
Source: Completions: M-NCPPC Research & Technology Center; under construction and proposed: CoStar Group, Property Professional Database.
2004: Under construction2005: Proposed for completion

M-NCPPC Research & Technology Center
Discovery leads major Montgomery County Class A Office completions in 2003
Project Square Ft. Submarket
Discovery Communications 600,000 Silver Spring
Human Genome Sciences 481,871 Germantown
MedImmune Headquarters 210,000 Gaithersburg
Twinbrook Metro Station 185,516 Rockville
Redland Center 142,500 North Rockville
Metro Executive Park 79,000 North Rockville
Campus @ Holy Cross 65,000 Kensington/Wheaton
Palisades of Bethesda 33,000 Bethesda/Chevy Chase
Source: CoStar Group, Property Professional Database, Property Search
M-NCPPC Research & Technology Center
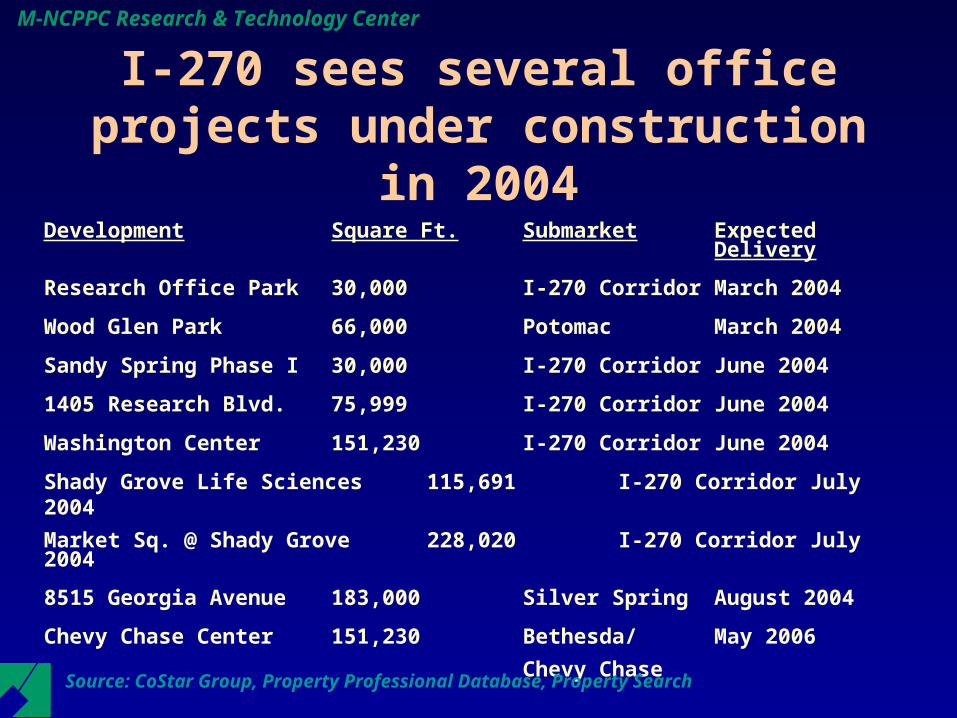
I-270 sees several office projects under construction in 2004
Development Square Ft. Submarket Expected Delivery
Research Office Park 30,000 I-270 Corridor March 2004
Wood Glen Park 66,000 Potomac March 2004
Sandy Spring Phase I 30,000 I-270 Corridor June 2004
1405 Research Blvd. 75,999 I-270 Corridor June 2004
Washington Center 151,230 I-270 Corridor June 2004
Shady Grove Life Sciences 115,691 I-270 Corridor July 2004
Market Sq. @ Shady Grove 228,020 I-270 Corridor July 2004
8515 Georgia Avenue 183,000 Silver Spring August 2004
Chevy Chase Center 151,230 Bethesda/ May 2006
Chevy Chase
Source: CoStar Group, Property Professional Database, Property Search

M-NCPPC Research & Technology Center
Development Square Ft. Submarket
Belward II 54,000 I-270 Corridor
Sandy Spring Plaza Phase 2 125,000 Rockville
Rock Spring Park 217,700 Bethesda/Chevy Chase
Rock Spring Center I 300,000 Bethesda/Chevy Chase
FallsGrove Research Center 350,000 I-270 Corridor
Source: CoStar Group, Property Professional Database, Property Search
2 major Class A office projects proposed for 2005 in Rock Spring Park
M-NCPPC Research & Technology Center
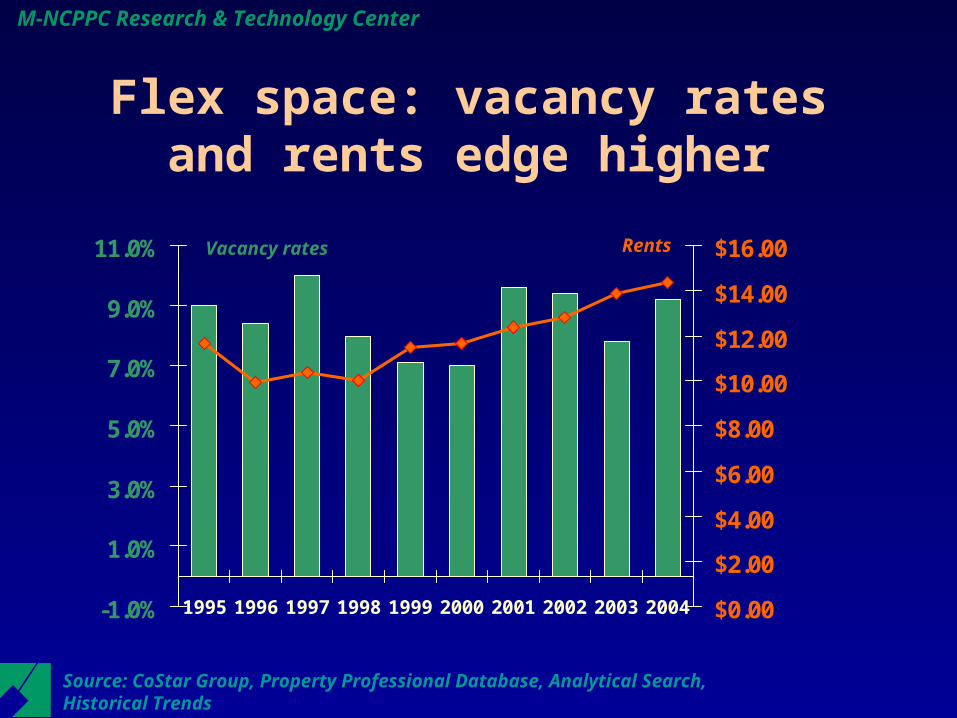
Flex space: vacancy rates and rents edge higher
-1.0%
1.0%
3.0%
5.0%
7.0%
9.0%
11.0%
1995 1996 1997 1998 1999 2000 2001 2002 2003 2004 $0.00
$2.00
$4.00
$6.00
$8.00
$10.00
$12.00
$14.00
$16.00
Source: CoStar Group, Property Professional Database, Analytical Search, Historical Trends
RentsVacancy rates

M-NCPPC Research & Technology Center
Residential Market Indicators Are Strong

M-NCPPC Research & Technology Center
Number of housing sales continues upward trend
9,40310,357
13,088
14,723 14,77915,489 15,372
16,534
1996 1997 1998 1999 2000 2001 2002 2003
Source: MRIS
Number of housing sales

M-NCPPC Research & Technology Center
Most single-family homes now cost over $300,000
$50,000
$100,000
$150,000
$200,000
$250,000
$300,000
$350,0001987
1988
1989
1990
1991
1992
1993
1994
1995
1996
1997
1998
1999
2000
2001
2002
2003
Median price of single-family home
Source: M-NCPPC Research & Technology Center

M-NCPPC Research & Technology Center
Housing units continue to sell quickly
111
5545
29 26 27
1998 1999 2000 2001 2002 2003
Sources: MRIS, COG
Days on the market

M-NCPPC Research & Technology Center
Housing is less affordable Low interest rates help, but price hikes dominate.
0
0.2
0.4
0.6
0.8
1
1.2
1989
1990
1991
1992
1993
1994
1995
1996
1997
1998
1999
2000
2001
2002
2003
The higher the score, the more affordable thehousing is. A score of 1 means the monthly
cost of buying a home equals 28% of gross income.
Affordability index for existing Montgomery County homes
Source: M-NCPPC Research & Technology Center

M-NCPPC Research & Technology Center
00.20.40.60.8
11.21.41.61.8
The median income household can afford the median priced townhouse
New Single Family
New Townhouse
Existing Townhouse
Existing Single Family
The higher the score, the more affordable thehousing is. A score of 1 means the monthly
cost of buying a home equals 28% of gross income.
Source: M-NCPPC Research & Technology Center
Affordability index

M-NCPPC Research & Technology Center
$0
$100,000
$200,000
$300,000
$400,000
$500,000
$600,000
1987
1988
1989
1990
1991
1992
1993
1994
1995
1996
1997
1998
1999
2000
2001
2002
2003
2003 brings marked increase in most home prices
Median PricesNew Single Family
New Townhouse
Existing Townhouse
Source: M-NCPPC Research & Technology Center
Existing Single Family
M-NCPPC Research & Technology Center
0.0%
2.0%
4.0%
6.0%
8.0%
10.0%
12.0%
1990
1991
1992
1993
1994
1995
1996
1997
1998
1999
2000
2001
2002
2003
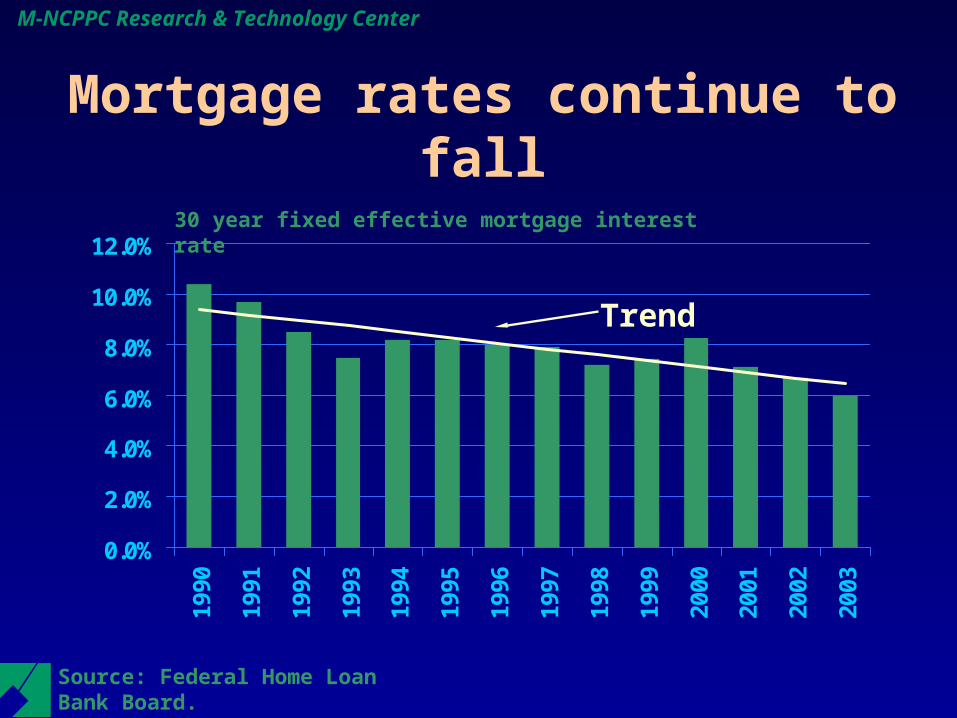
Mortgage rates continue to fall
30 year fixed effective mortgage interest rate
Trend
Source: Federal Home Loan Bank Board.

M-NCPPC Research & Technology Center
Apartment market still tight with vacancy rates steady at 3.8%
4.4% 4.2%3.7%
3.0%2.5%
1.8%
3.7% 3.8%
0%
1%
2%
3%
4%
5%
1996 1997 1998 1999 2000 2001 2002 2003
Source: Montgomery County Office of Landlord-Tenant Affairs
Vacancy rate
M-NCPPC Research & Technology Center
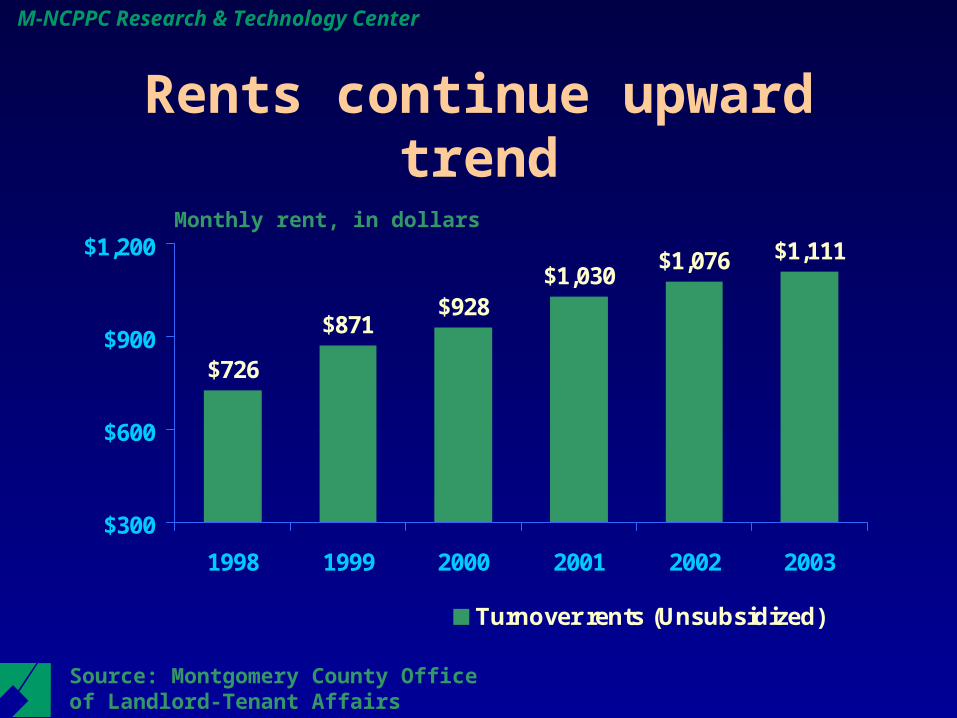
Rents continue upward trend
$726
$871$928
$1,030$1,076 $1,111
$300
$600
$900
$1,200
1998 1999 2000 2001 2002 2003
Turnover rents (Unsubsidized)
Monthly rent, in dollars
Source: Montgomery County Office of Landlord-Tenant Affairs

M-NCPPC Research & Technology Center
-500
500
1,500
2,500
3,500
4,500
5,500
6,500
7,500
8,50019
88
1989
1990
1991
1992
1993
1994
1995
1996
1997
1998
1999
2000
2001
2002
2003
Multi-family units are a larger share of home construction
Housing completions totaled almost 5,500 units for both 2002 and 2003
Housing completions, in units.
Source; M-NCPPC Research & Technology Center
Single-Family Detached
TownhouseMulti-family

M-NCPPC Research & Technology Center
Major 2003 completions include:
• Avalon at Grosvenor Station 497
• King Farm 491• Traville East Village 430• Kings Crossing 250• Fallsgrove 223• Clarksburg Town Center 202• Lakelands 175
In unitsSource; M-NCPPC Research & Technology Center

M-NCPPC Research & Technology Center
In 2003, multi-family approvals outnumbered single-family units 4-1
Subdivision approvals in 2003 by units. Source; M-NCPPC Research & Technology Center
Multi-family: 4,871 units
Single-family: 1,192 units