m-pesa development, operational risk … · 2. m-pesa evolution to a complex and dynamic ecosystem...
TRANSCRIPT
M-PESA DEVELOPMENT, OPERATIONAL RISK MANAGEMENT AND CONSUMER PROTECTION
By Mrs. Anne Mariga
Head National Payments System, Central Bank of Kenya
Innovation on Retail Payment System: Issues, Policies & Challenges
Sheraton Mustika Resort & Spa,
Yogyakarta
November 13-17, 2017
1
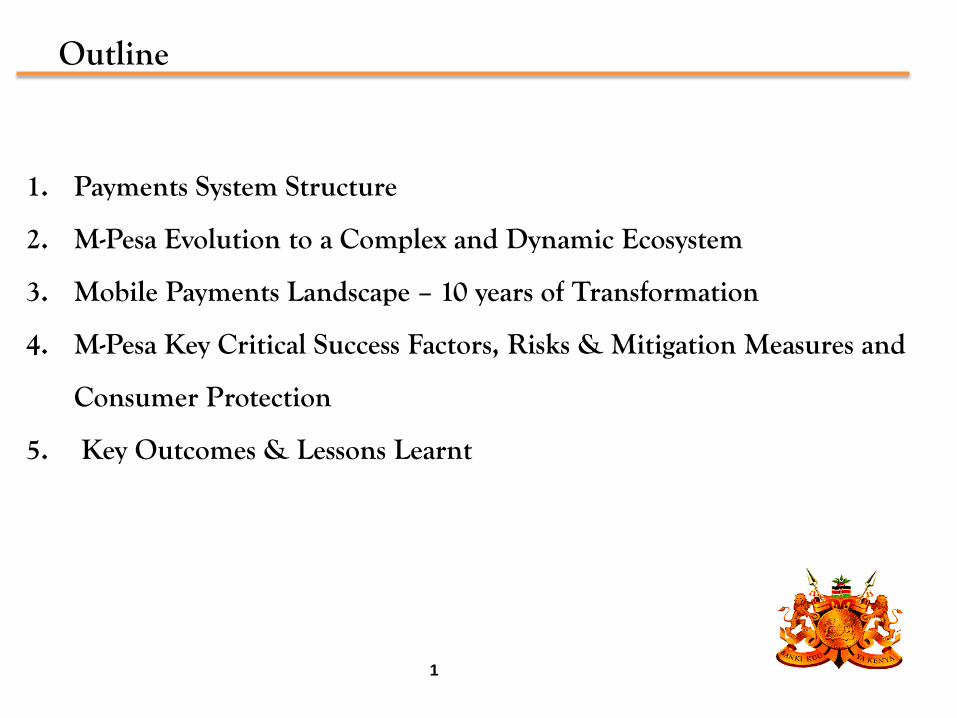
Outline
1. Payments System Structure
2. M-Pesa Evolution to a Complex and Dynamic Ecosystem
3. Mobile Payments Landscape – 10 years of Transformation
4. M-Pesa Key Critical Success Factors, Risks & Mitigation Measures and
Consumer Protection
5. Key Outcomes & Lessons Learnt
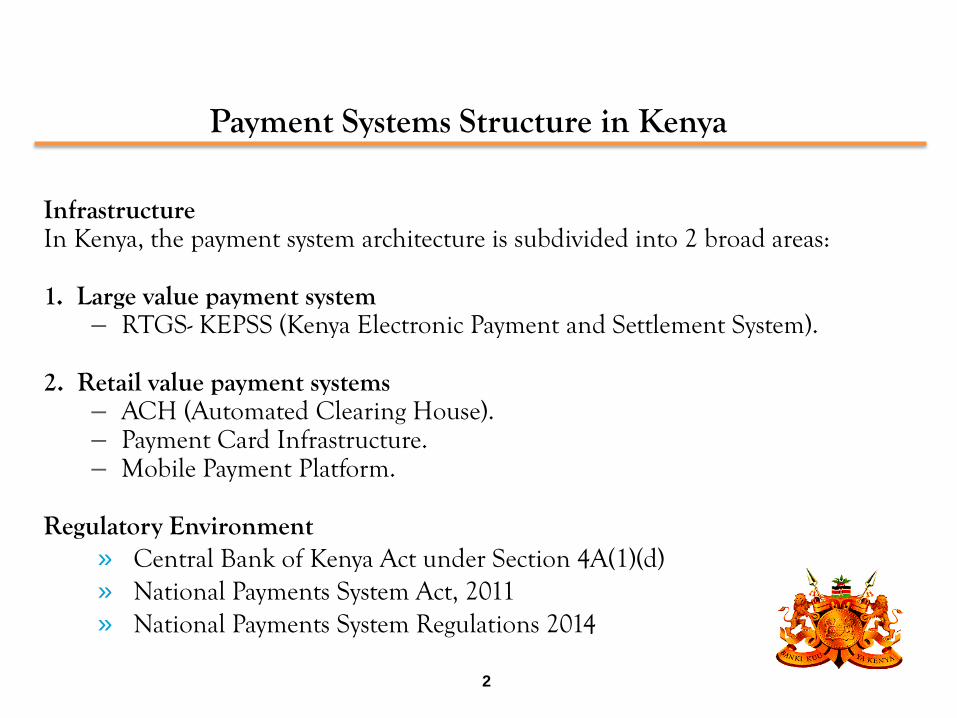
Payment Systems Structure in Kenya
InfrastructureIn Kenya, the payment system architecture is subdivided into 2 broad areas:
1. Large value payment system– RTGS- KEPSS (Kenya Electronic Payment and Settlement System).
2. Retail value payment systems– ACH (Automated Clearing House).– Payment Card Infrastructure.– Mobile Payment Platform.
Regulatory Environment» Central Bank of Kenya Act under Section 4A(1)(d)» National Payments System Act, 2011» National Payments System Regulations 2014
2

Payment systems Structure
Mobile Money moves the highest number of transactions with an average of 4.8 Million per day
KEPSS moves highest value of transactions average of Ksh. 105 Billion (USD 1.01 Billion) daily with a volume of 15, 000 transactions
3

M-PESAMOBILE MONEY TRANSFER SERVICE
4
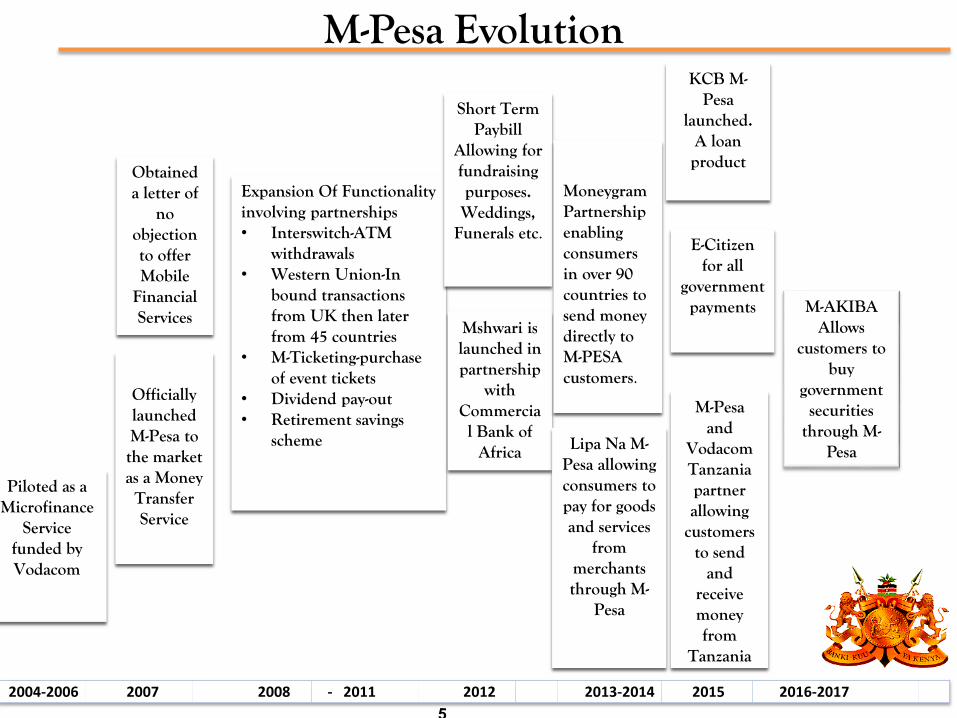
M-Pesa Evolution
2004-2006 2007 2008 - 2011 2012 2013-2014 2015 2016-2017
Piloted as a Microfinance
Service funded by Vodacom
Obtained a letter of
no objection to offer Mobile
Financial Services
Officially launched M-Pesa to the market as a Money
Transfer Service
Expansion Of Functionality involving partnerships• Interswitch-ATM
withdrawals• Western Union-In
bound transactions from UK then later from 45 countries
• M-Ticketing-purchase of event tickets
• Dividend pay-out• Retirement savings
scheme
Mshwari is launched in partnership
with Commercial Bank of
Africa
Short Term Paybill
Allowing for fundraising purposes. Weddings,
Funerals etc.
Lipa Na M-Pesa allowing consumers to pay for goods and services
from merchants through M-
Pesa
MoneygramPartnership enabling consumers in over 90 countries to send money directly to M-PESA customers.
M-Pesaand
Vodacom Tanzania partner allowing
customers to send
and receive money from
Tanzania
KCB M-Pesa
launched. A loan
product
E-Citizenfor all
government payments M-AKIBA
Allows customers to
buy government
securities through M-
Pesa
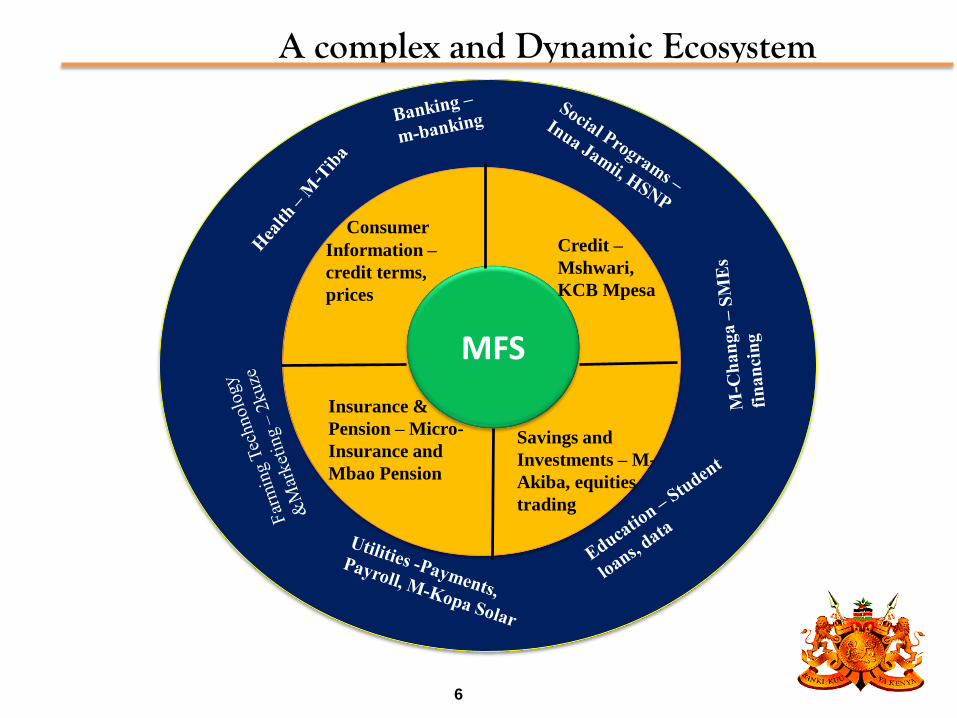
MFS
Credit –
Mshwari,
KCB Mpesa
Savings and
Investments – M-
Akiba, equities
trading
Consumer
Information –
credit terms,
prices
Insurance &
Pension – Micro-
Insurance and
Mbao Pension
A complex and Dynamic Ecosystem
6
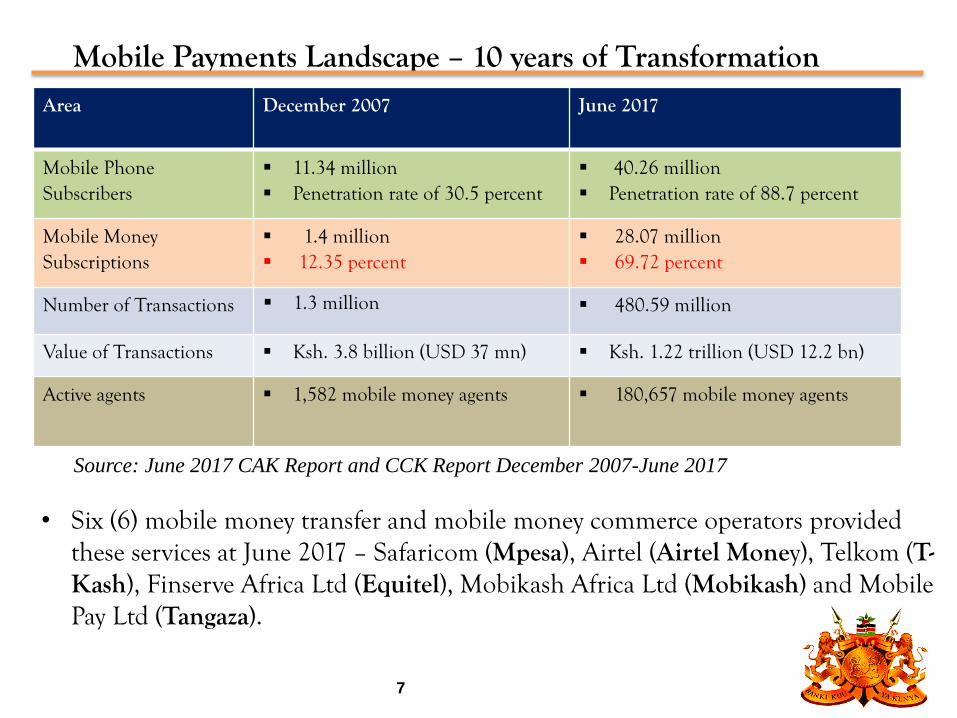
Mobile Payments Landscape – 10 years of Transformation
Source: June 2017 CAK Report and CCK Report December 2007-June 2017
• Six (6) mobile money transfer and mobile money commerce operators provided these services at June 2017 – Safaricom (Mpesa), Airtel (Airtel Money), Telkom (T-Kash), Finserve Africa Ltd (Equitel), Mobikash Africa Ltd (Mobikash) and Mobile Pay Ltd (Tangaza).
Area December 2007 June 2017
Mobile Phone Subscribers
11.34 million Penetration rate of 30.5 percent
40.26 million Penetration rate of 88.7 percent
Mobile Money Subscriptions
1.4 million 12.35 percent
28.07 million 69.72 percent
Number of Transactions 1.3 million 480.59 million
Value of Transactions Ksh. 3.8 billion (USD 37 mn) Ksh. 1.22 trillion (USD 12.2 bn)
Active agents 1,582 mobile money agents 180,657 mobile money agents
7
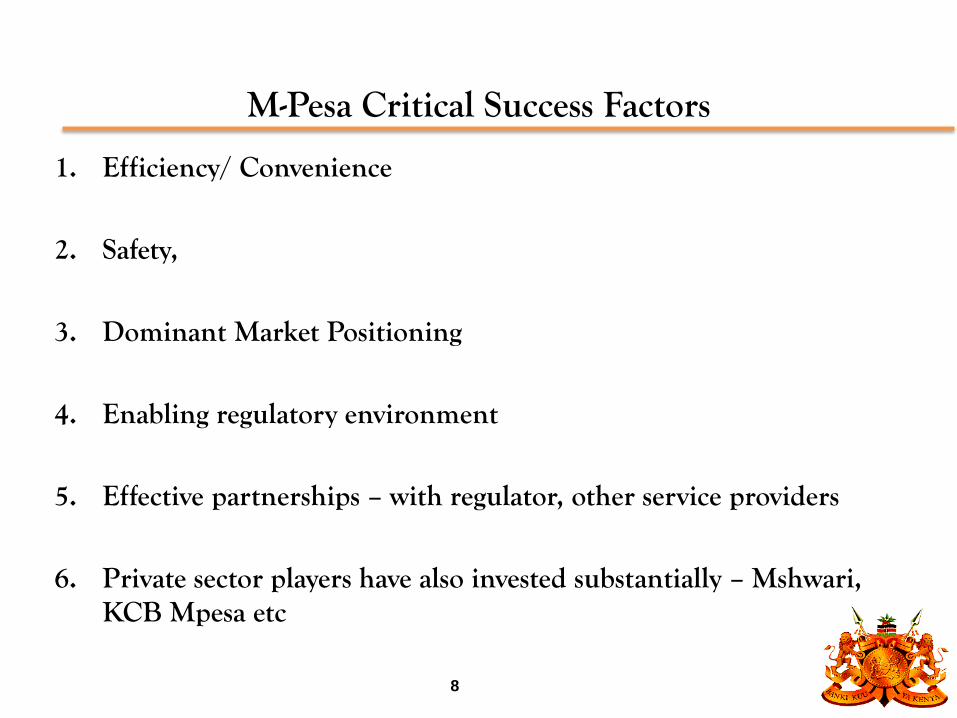
M-Pesa Critical Success Factors
1. Efficiency/ Convenience
2. Safety,
3. Dominant Market Positioning
4. Enabling regulatory environment
5. Effective partnerships – with regulator, other service providers
6. Private sector players have also invested substantially – Mshwari, KCB Mpesa etc
8
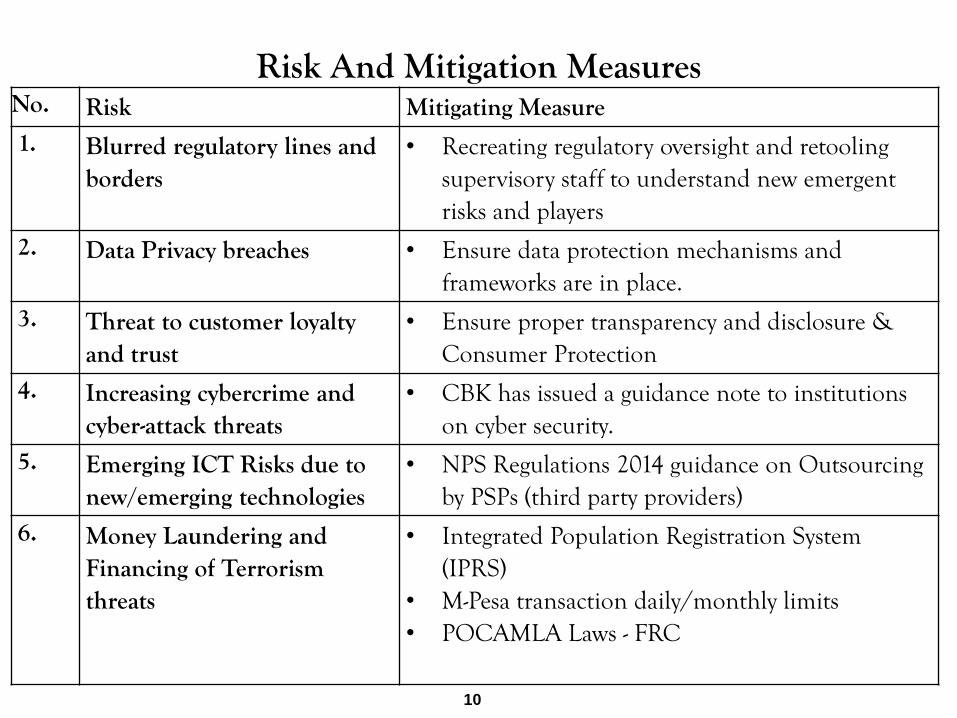
Risk And Mitigation Measures
10
No. Risk Mitigating Measure
1. Blurred regulatory lines and borders
• Recreating regulatory oversight and retooling supervisory staff to understand new emergent risks and players
2. Data Privacy breaches • Ensure data protection mechanisms and frameworks are in place.
3. Threat to customer loyalty and trust
• Ensure proper transparency and disclosure & Consumer Protection
4. Increasing cybercrime and cyber-attack threats
• CBK has issued a guidance note to institutions on cyber security.
5. Emerging ICT Risks due to new/emerging technologies
• NPS Regulations 2014 guidance on Outsourcing by PSPs (third party providers)
6. Money Laundering and Financing of Terrorism threats
• Integrated Population Registration System (IPRS)
• M-Pesa transaction daily/monthly limits• POCAMLA Laws - FRC
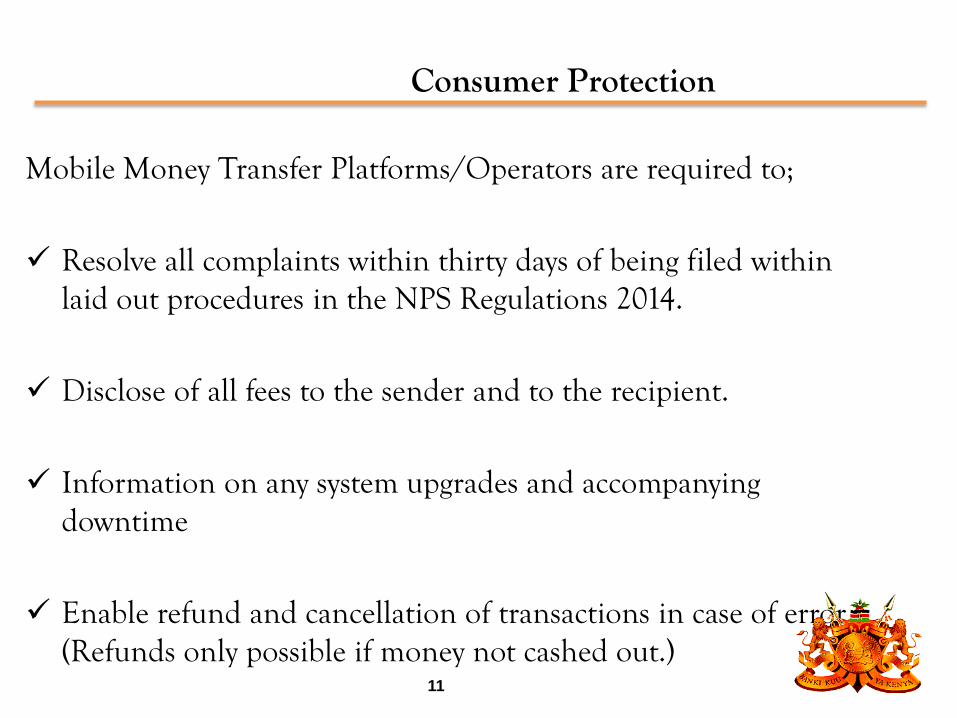
Consumer Protection
Mobile Money Transfer Platforms/Operators are required to;
Resolve all complaints within thirty days of being filed within laid out procedures in the NPS Regulations 2014.
Disclose of all fees to the sender and to the recipient.
Information on any system upgrades and accompanying downtime
Enable refund and cancellation of transactions in case of error. (Refunds only possible if money not cashed out.)
11
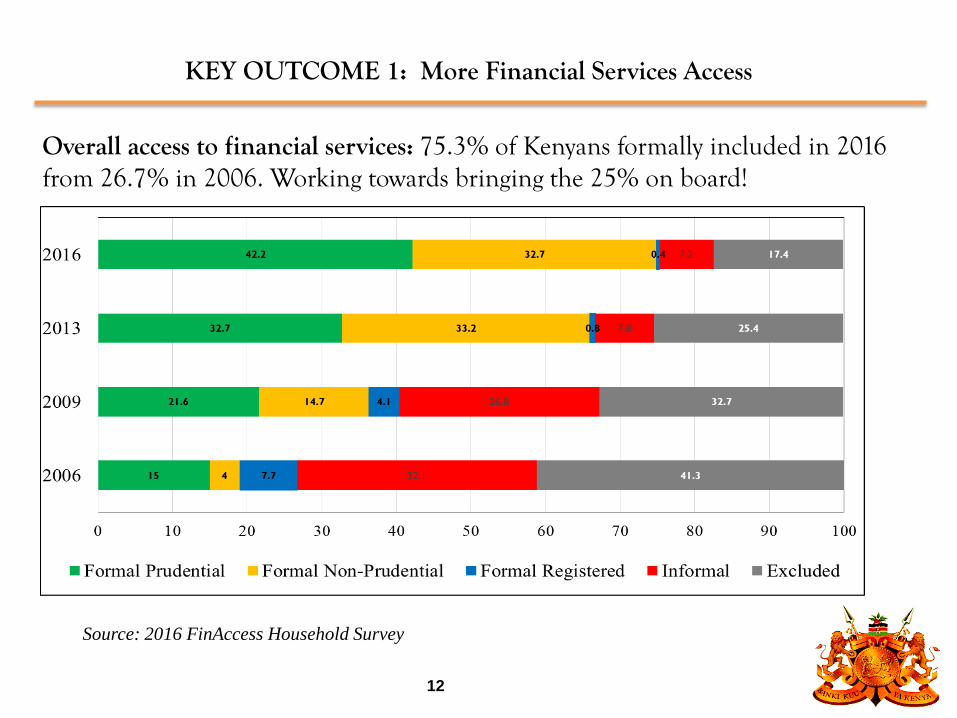
Overall access to financial services: 75.3% of Kenyans formally included in 2016 from 26.7% in 2006. Working towards bringing the 25% on board!
Source: 2016 FinAccess Household Survey
KEY OUTCOME 1: More Financial Services Access
12
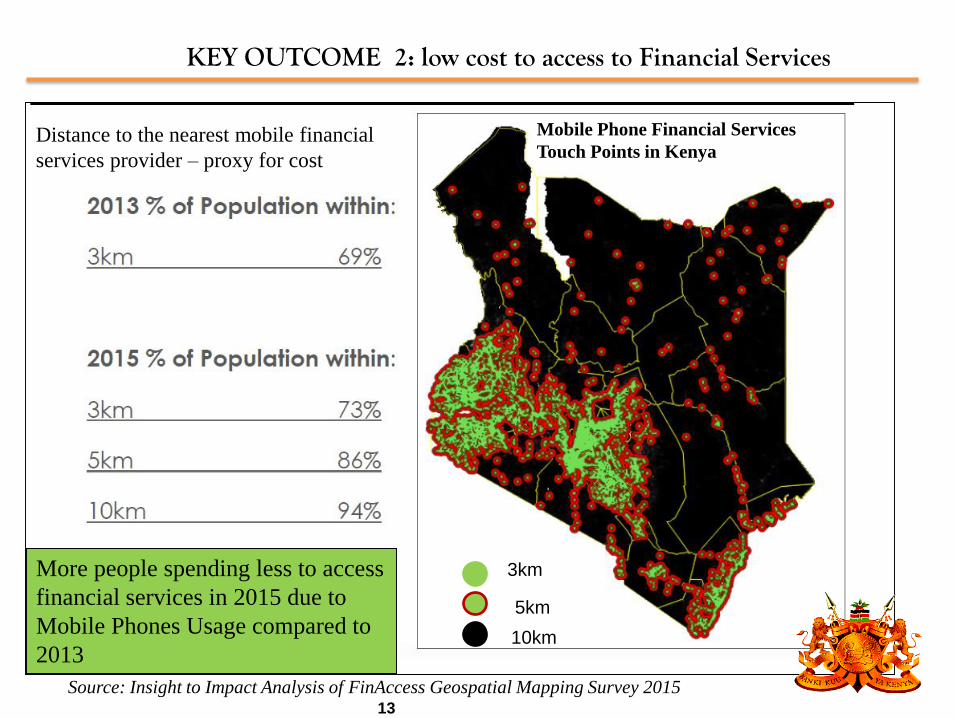
KEY OUTCOME 2: low cost to access to Financial Services
Source: Insight to Impact Analysis of FinAccess Geospatial Mapping Survey 2015
More people spending less to access
financial services in 2015 due to
Mobile Phones Usage compared to
2013
3km
5km
10km
Mobile Phone Financial Services
Touch Points in KenyaDistance to the nearest mobile financial
services provider – proxy for cost
13

Low cost of financial services access
Cost to Population to the nearest Financial Service Access Point: 2013 Vs. 2016 (%)
82,1
11,16.2
0,6
89,9
4,3 5.10,7
0
10
20
30
40
50
60
70
80
90
100
Less than KSh 50 KSh 51-100 Between KSh 101
and KSh 500
Above KSh 500
PE
RC
EN
TA
GE
2013 2016
• About 94% of Kenyans pay less than USD 1.00 to Access Financial Services
14
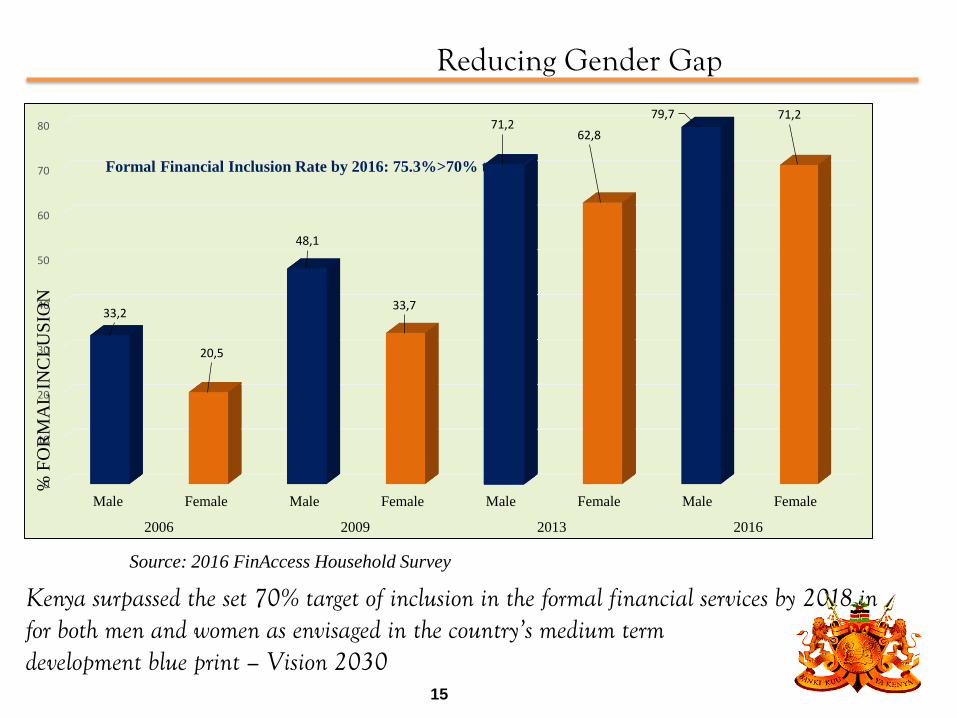
Reducing Gender Gap
0
10
20
30
40
50
60
70
80
Male Female Male Female Male Female Male Female
2006 2009 2013 2016
33,2
20,5
48,1
33,7
71,262,8
79,7 71,2
% F
OR
MA
L I
NC
LU
SIO
N
Kenya surpassed the set 70% target of inclusion in the formal financial services by 2018 in for both men and women as envisaged in the country’s medium term development blue print – Vision 2030
Source: 2016 FinAccess Household Survey
Formal Financial Inclusion Rate by 2016: 75.3%>70% target
15
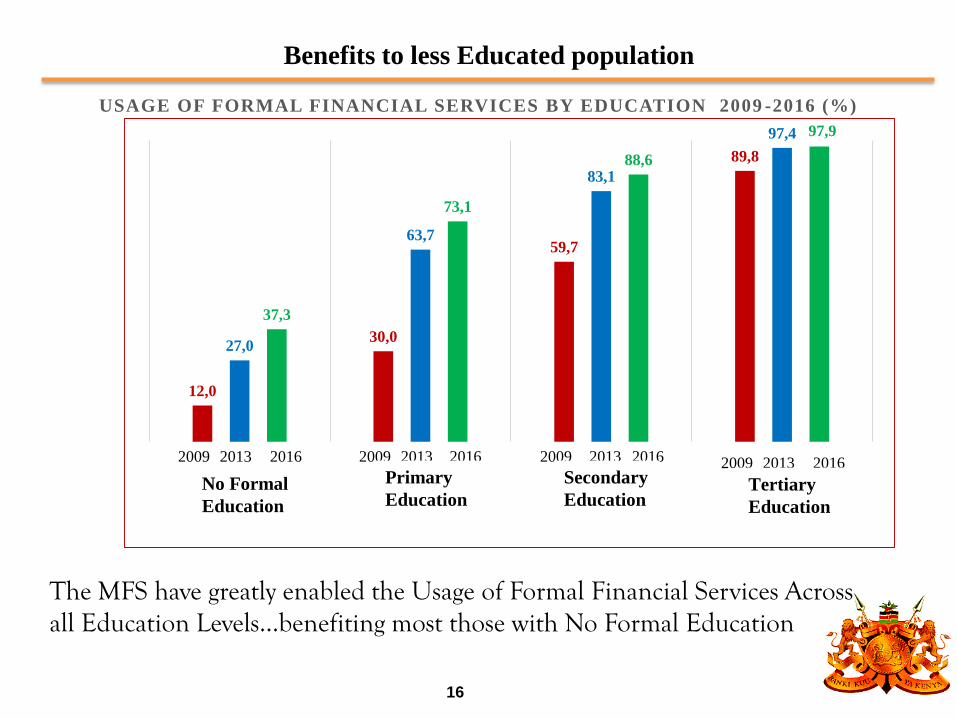
Benefits to less Educated population
The MFS have greatly enabled the Usage of Formal Financial Services Across all Education Levels…benefiting most those with No Formal Education
12,0
30,0
59,7
89,8
27,0
63,7
83,1
97,4
37,3
73,1
88,6
97,9
2009 2009200920092013 2013201320132016 201620162016
Secondary
EducationTertiary
Education
Primary
EducationNo Formal
Education
USAGE OF FORMAL FINANCIAL SERVICES BY EDUCATION 2009 -2016 (%)
16
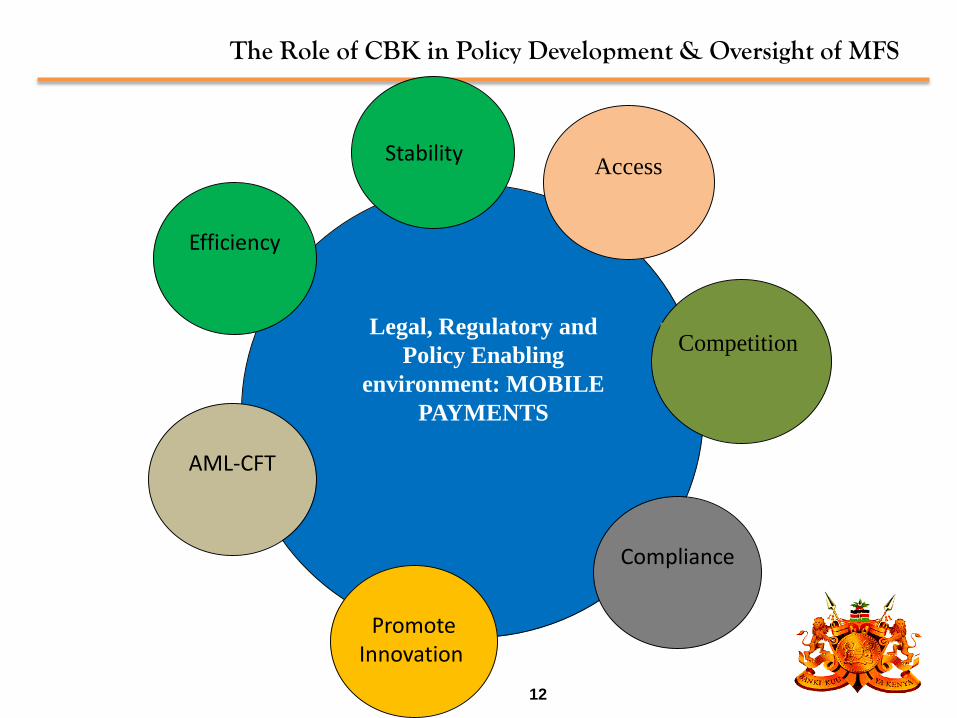
The Role of CBK in Policy Development & Oversight of MFS
Efficiency
AML-CFT
Promote Innovation
Compliance
Competition
Access
Legal, Regulatory and
Policy Enabling
environment: MOBILE
PAYMENTS
Stability
12
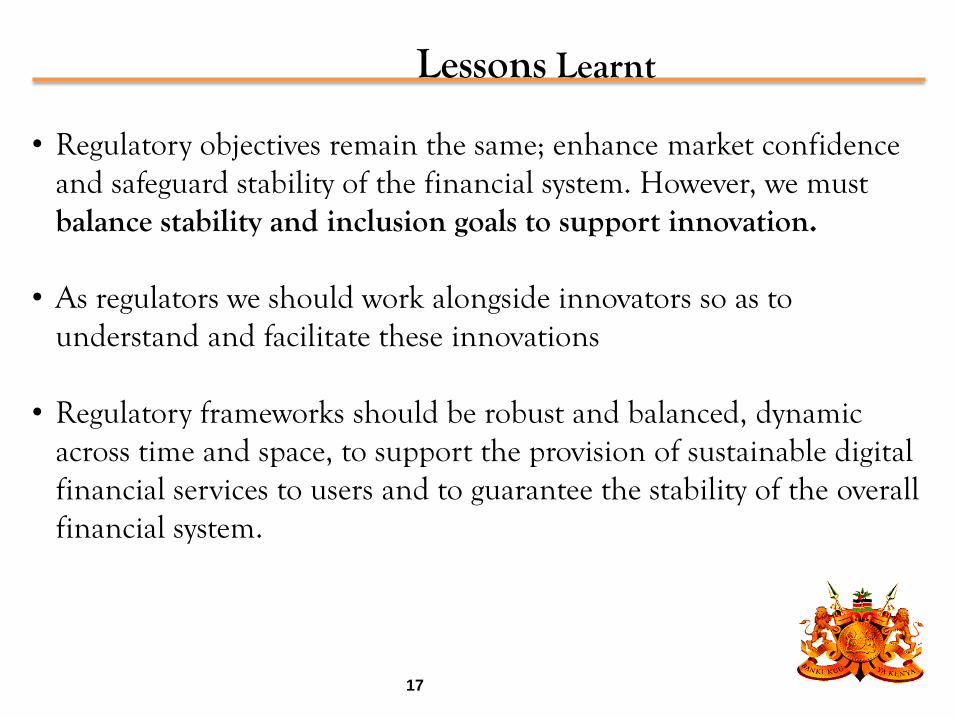
Lessons Learnt
• Regulatory objectives remain the same; enhance market confidence and safeguard stability of the financial system. However, we must balance stability and inclusion goals to support innovation.
• As regulators we should work alongside innovators so as to understand and facilitate these innovations
• Regulatory frameworks should be robust and balanced, dynamic across time and space, to support the provision of sustainable digital financial services to users and to guarantee the stability of the overall financial system.
17

Lessons Learnt Cont….
• Continuous application of the ‘‘Test and learn’’ model to keep up with the rapidly changing environment to ensure:
– Establishment of resilient and viable business models and ecosystems
– Enhanced corporate governance practices– Improved transparency– Management of emerging technology and emerging inherent
risks.
• Consumer protection in the face of innovations must be given attention deservedly
18

19
Q&A
THANK YOU