m sreenivasa rao azim premji foundation 29 april, 2011 achieving universal quality primary education...
TRANSCRIPT

M SREENIVASA RAOAZIM PREMJI FOUNDATION
29 April, 2011
Achieving universal quality primary education in India
Lessons from the Andhra Pradesh Randomized Evaluation Studies (AP RESt)
2
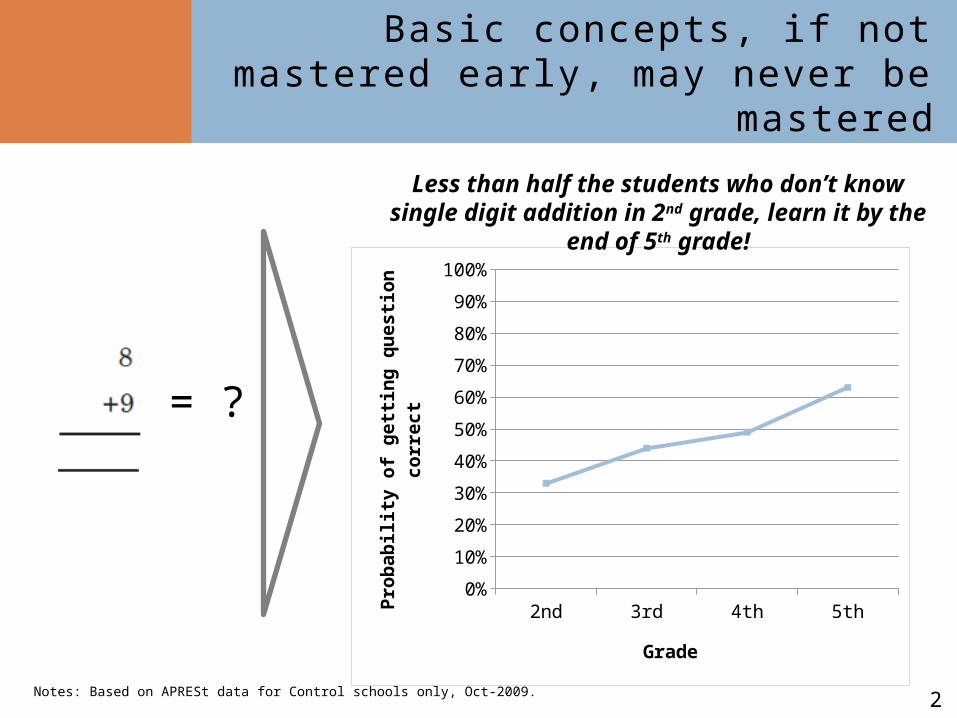
Basic concepts, if not mastered early, may never be mastered
Notes: Based on APRESt data for Control schools only, Oct-2009.
= ?
2nd 3rd 4th 5th0%
10%
20%
30%
40%
50%
60%
70%
80%
90%
100%
Grade
Prob
abili
ty o
f getti
ng q
uesti
on c
orre
ct
Less than half the students who don’t know single digit addition in 2nd grade, learn it by the end of 5th grade!

3
Higher spending in government schools may not be enough
Source: “Teacher Absence in India”, Journal of the European Economic Association, 15-Sep-04
Motivation and effort-levels of government school teachers in India
are a serious problem • High levels of teacher absence (25%) ranging from 15% to 42% across states
• 90% of non-capital spending goes to teacher salaries
• Teacher that are paid more – older teachers, more educated teachers and head teachers – are more frequently absent
• Higher absence rates in poorer states (additional spending has highest leakage where it is needed the most)
Teachers
absent o
n any give
n day
Teachers
not teach
ing0%
10%
20%
30%
40%
50%
60%
25%
55%

4
Broad objectives of AP RESt(Andhra Pradesh Randomized
Evaluation Studies)
Move the focus of education policy from outlays to outcomes
Focus systematically on institutional incentives for
service delivery
Improve evidence base for policy with rigorous
(randomized) evaluations
5
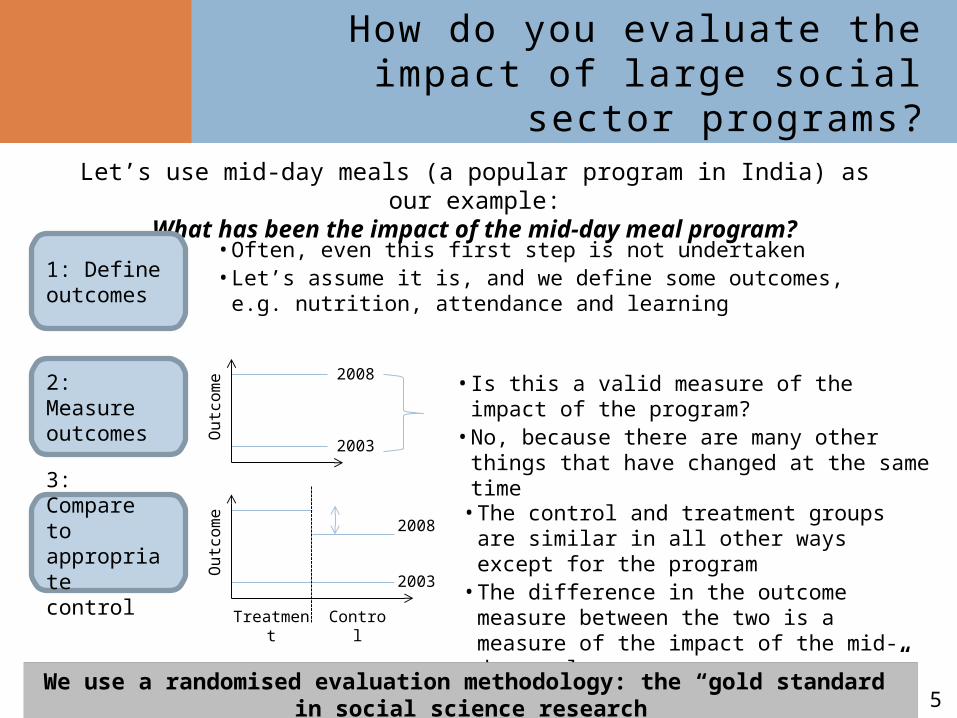
How do you evaluate the impact of large social sector programs?
Let’s use mid-day meals (a popular program in India) as our example:What has been the impact of the mid-day meal program?
3: Compare to appropriate control
1: Define outcomes
2: Measure outcomes
• The control and treatment groups are similar in all other ways except for the program
• The difference in the outcome measure between the two is a measure of the impact of the mid-day meals program
• Often, even this first step is not undertaken• Let’s assume it is, and we define some outcomes, e.g. nutrition, attendance
and learning
• Is this a valid measure of the impact of the program?• No, because there are many other things that have
changed at the same time
2008
2003
Out
com
e
2008
2003
Out
com
e
Treatment Control
We use a randomised evaluation methodology: the “gold standard” in social science research
6
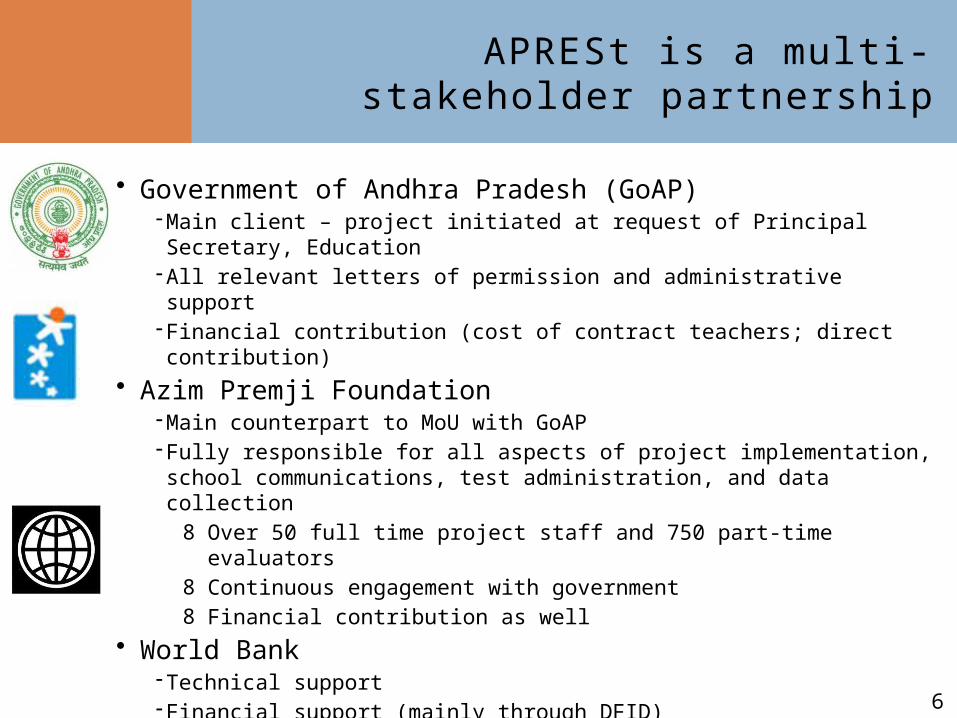
APRESt is a multi-stakeholder partnership
• Government of Andhra Pradesh (GoAP)- Main client – project initiated at request of Principal Secretary, Education- All relevant letters of permission and administrative support- Financial contribution (cost of contract teachers; direct contribution)
• Azim Premji Foundation- Main counterpart to MoU with GoAP- Fully responsible for all aspects of project implementation, school communications, test
administration, and data collection8 Over 50 full time project staff and 750 part-time evaluators8 Continuous engagement with government8 Financial contribution as well
• World Bank- Technical support- Financial support (mainly through DFID)- Institutional continuity with government (6 secretaries in 6 years!)
7
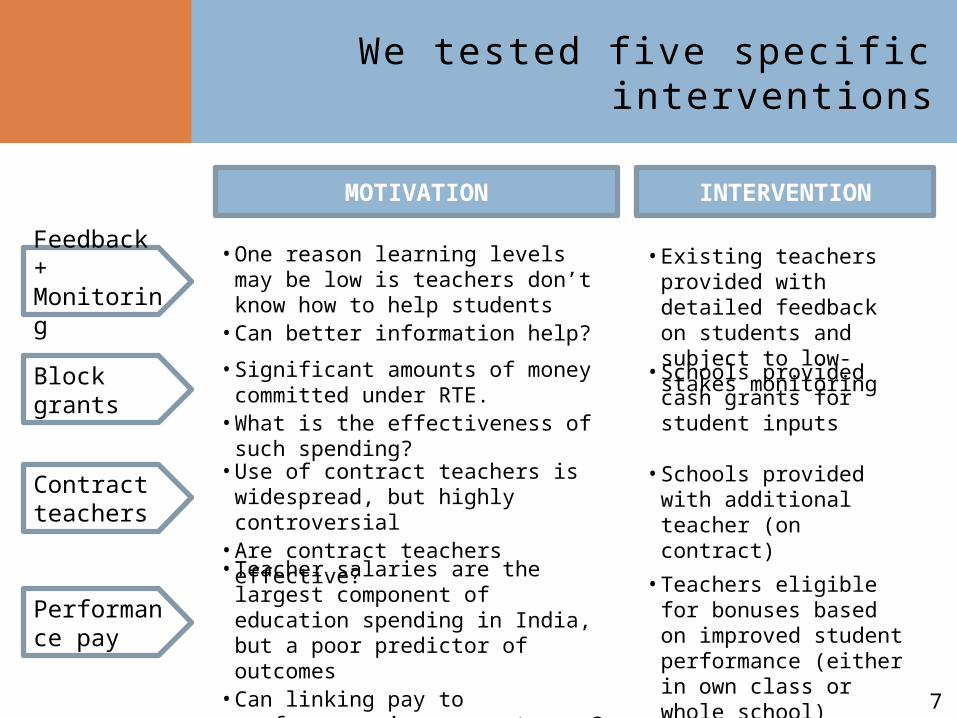
We tested five specific interventions
Contract teachers
Block grants
Performance pay
Feedback + Monitoring
• Schools provided with additional teacher (on contract)
• Schools provided cash grants for student inputs
• Existing teachers provided with detailed feedback on students and subject to low-stakes monitoring
• Teachers eligible for bonuses based on improved student performance (either in own class or whole school)
MOTIVATION INTERVENTION
• One reason learning levels may be low is teachers don’t know how to help students
• Can better information help?
• Use of contract teachers is widespread, but highly controversial
• Are contract teachers effective?
• Significant amounts of money committed under RTE.
• What is the effectiveness of such spending?
• Teacher salaries are the largest component of education spending in India, but a poor predictor of outcomes
• Can linking pay to performance improve outcomes?
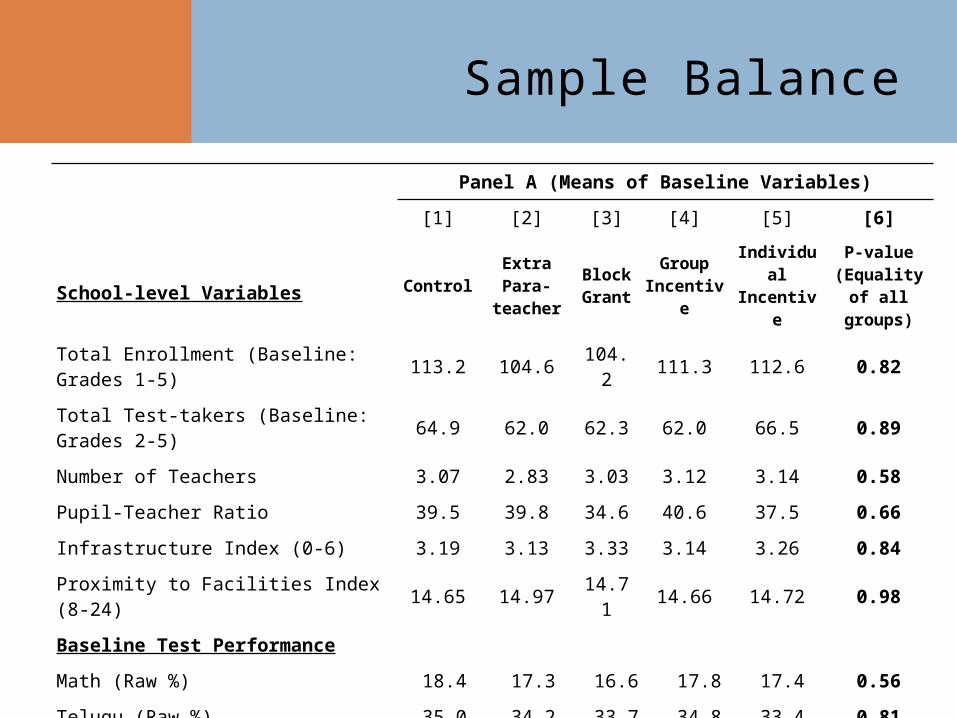
Sample Balance
Panel A (Means of Baseline Variables)
[1] [2] [3] [4] [5] [6]
School-level Variables ControlExtra Para-
teacher
Block Grant
Group Incentive
Individual Incentive
P-value (Equality of all groups)
Total Enrollment (Baseline: Grades 1-5) 113.2 104.6 104.2 111.3 112.6 0.82
Total Test-takers (Baseline: Grades 2-5) 64.9 62.0 62.3 62.0 66.5 0.89
Number of Teachers 3.07 2.83 3.03 3.12 3.14 0.58
Pupil-Teacher Ratio 39.5 39.8 34.6 40.6 37.5 0.66
Infrastructure Index (0-6) 3.19 3.13 3.33 3.14 3.26 0.84
Proximity to Facilities Index (8-24) 14.65 14.97 14.71 14.66 14.72 0.98
Baseline Test Performance
Math (Raw %) 18.4 17.3 16.6 17.8 17.4 0.56
Telugu (Raw %) 35.0 34.2 33.7 34.8 33.4 0.81
9
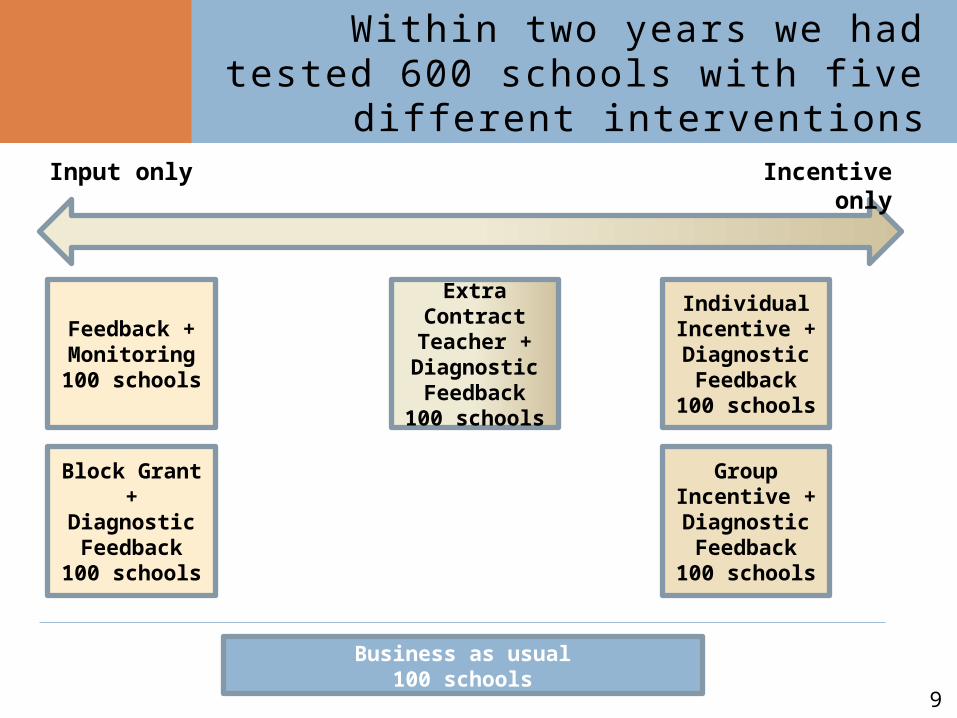
Within two years we had tested 600 schools with five different
interventionsInput only Incentive only
Feedback + Monitoring100 schools
Individual Incentive + Diagnostic Feedback
100 schools
Group Incentive + Diagnostic
Feedback100 schools
Extra Contract Teacher + Diagnostic Feedback
100 schools
Block Grant + Diagnostic Feedback
100 schools
Business as usual100 schools

10
Timeline of experimental design and execution
Jun-Jul ’05 Conducted baseline tests in these schools
Late Jul ’05 Schools randomly assigned to various treatments
Early Aug ’05 Provided diagnostic feedback on test performance to all schools
Sep ‘05 – Feb ’06 Monitored process variables over the course of the year via unannounced monthly tracking surveys
Mar-Apr ’06 Conducted endline tests to assess the impact of various interventions on learning outcomes
Jul ’06 Interviewed teachers in incentive schools, but before outcomes are communicated to them
Next school year Repeated process above
Intervention Results
12
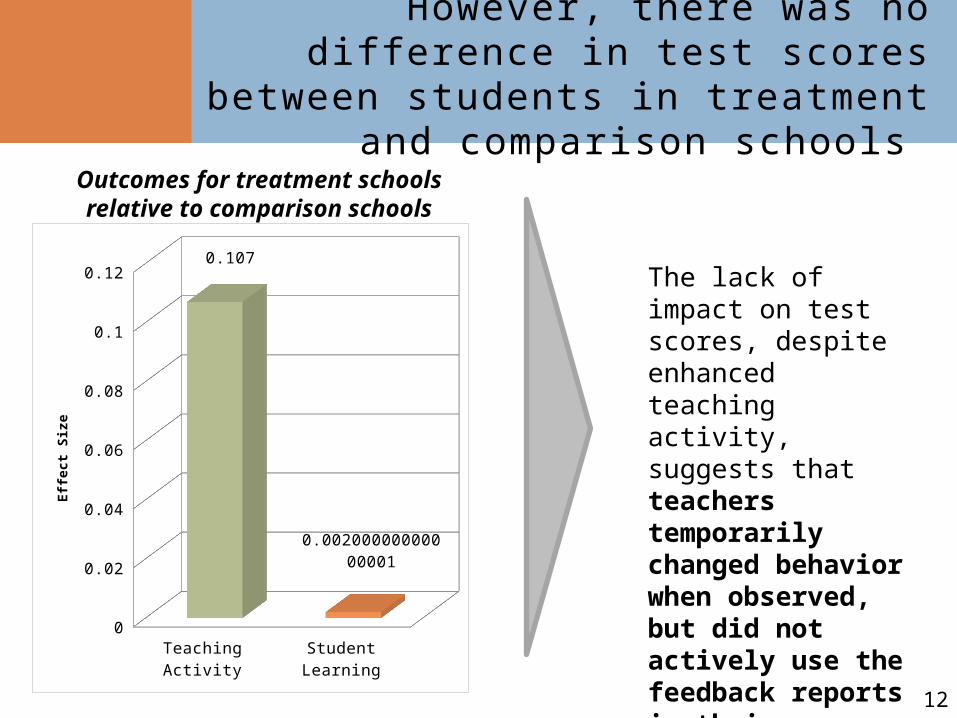
However, there was no difference in test scores between students in
treatment and comparison schools
Teaching Activity Student Learning0
0.02
0.04
0.06
0.08
0.1
0.12 0.107
0.00200000000000001
Effec
t Size
Outcomes for treatment schools relative to comparison schools
The lack of impact on test scores, despite enhanced teaching activity, suggests that teachers temporarily changed behavior when observed, but did not actively use the feedback reports in their teaching.
13
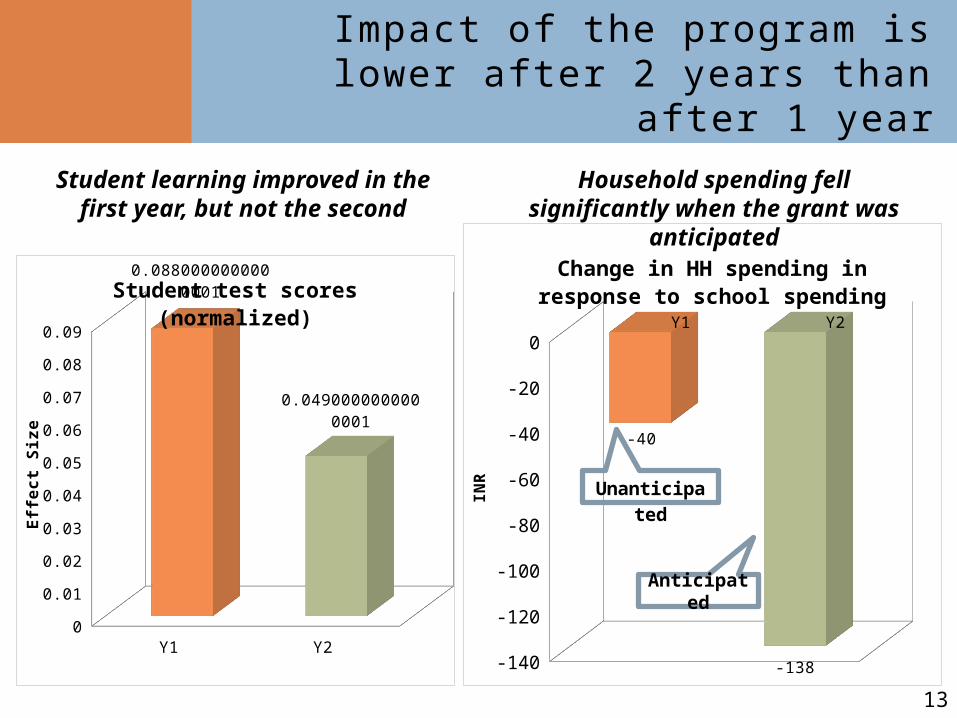
Impact of the program is lower after 2 years than after 1 year
Y1 Y2
-140
-120
-100
-80
-60
-40
-20
0
-40
-138
Change in HH spending in response to school spending
INR Unanticipated
Y1 Y20
0.01
0.02
0.03
0.04
0.05
0.06
0.07
0.08
0.09
0.0880000000000001
0.0490000000000001
Student test scores (normalized)
Effec
t Si
ze
Household spending fell significantly when the grant was anticipated
Student learning improved in the first year, but not the second
Anticipated
14
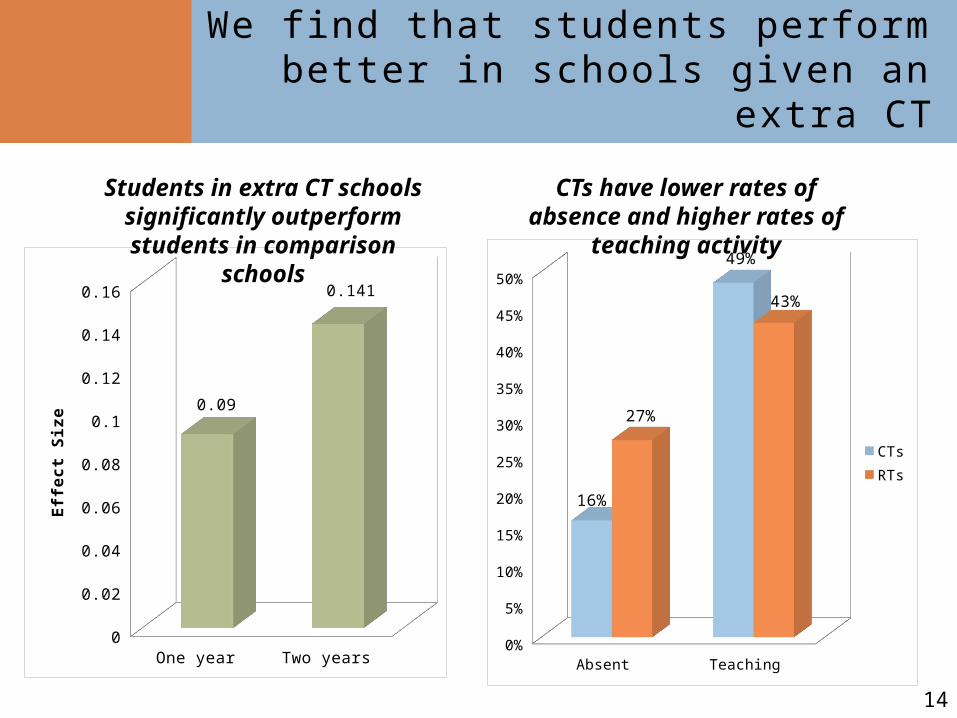
We find that students perform better in schools given an extra
CT
Absent Teaching0%
5%
10%
15%
20%
25%
30%
35%
40%
45%
50%
16%
49%
27%
43%
CTsRTs
One year Two years0
0.02
0.04
0.06
0.08
0.1
0.12
0.14
0.16
0.09
0.141
Effec
t Si
ze
CTs have lower rates of absence and higher rates of teaching
activity
Students in extra CT schools significantly outperform students
in comparison schools
15
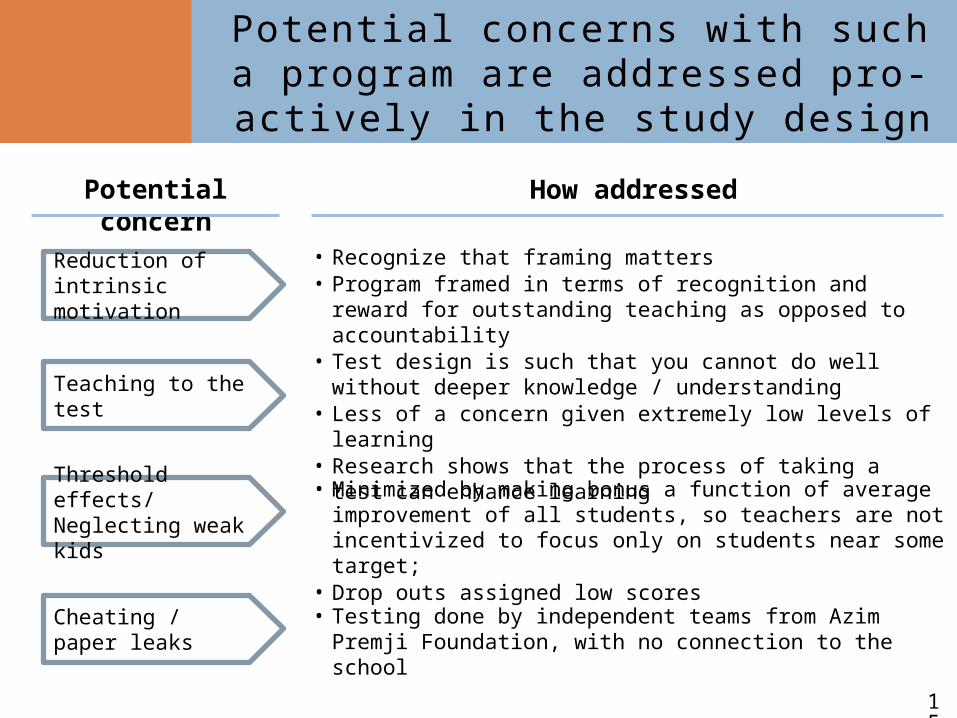
Potential concerns with such a program are addressed pro-actively in the study design
Potential concern How addressed
Teaching to the test
• Test design is such that you cannot do well without deeper knowledge / understanding
• Less of a concern given extremely low levels of learning• Research shows that the process of taking a test can enhance learning
Threshold effects/ Neglecting weak kids
• Minimized by making bonus a function of average improvement of all students, so teachers are not incentivized to focus only on students near some target;
• Drop outs assigned low scores
Cheating / paper leaks• Testing done by independent teams from Azim Premji Foundation,
with no connection to the school
Reduction of intrinsic motivation
• Recognize that framing matters• Program framed in terms of recognition and reward for outstanding
teaching as opposed to accountability
16
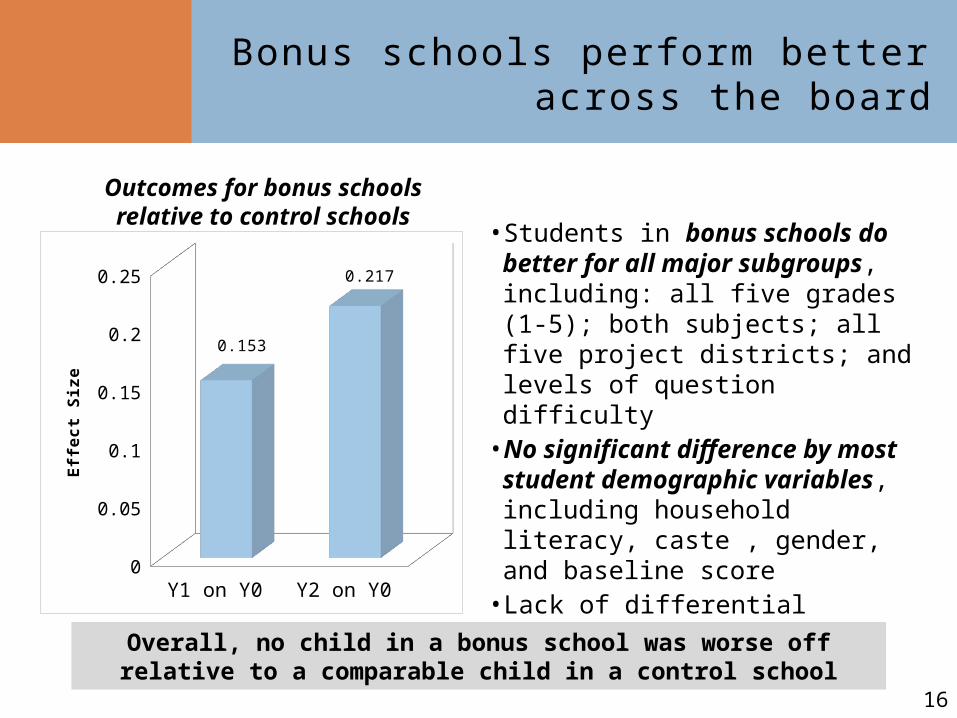
Bonus schools perform better across the board
Outcomes for bonus schools relative to control schools
• Students in bonus schools do better for all major subgroups, including: all five grades (1-5); both subjects; all five project districts; and levels of question difficulty
• No significant difference by most student demographic variables, including household literacy, caste , gender, and baseline score
• Lack of differential treatment effects is an indicator of broad-based gains
Y1 on Y0 Y2 on Y00
0.05
0.1
0.15
0.2
0.25
0.153
0.217
Effec
t Si
ze
Overall, no child in a bonus school was worse off relative to a comparable child in a control school
17
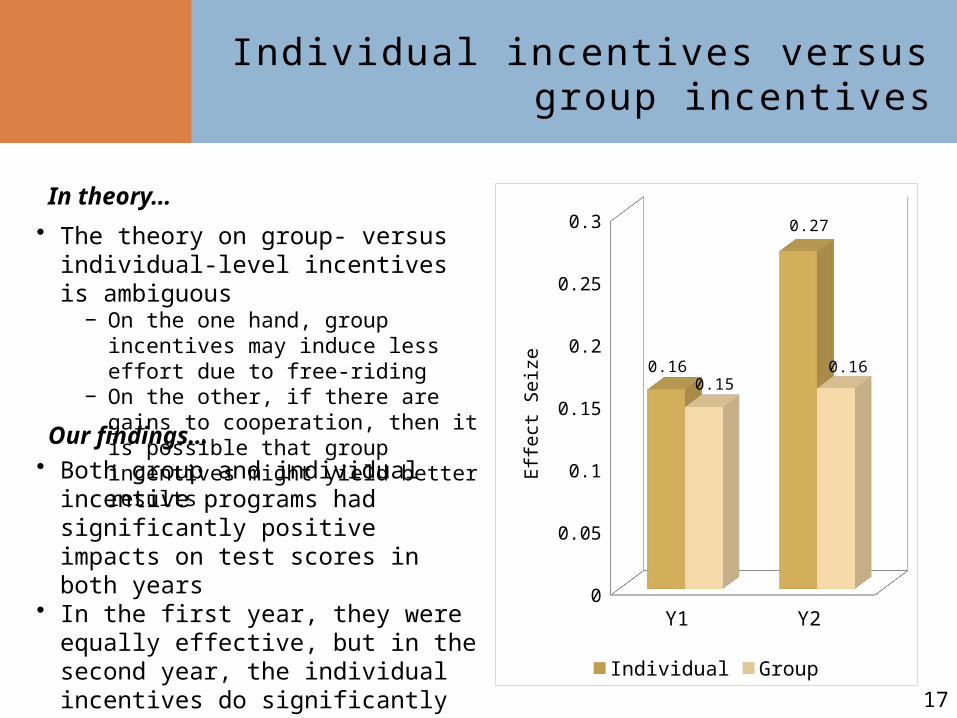
Individual incentives versus group incentives
• The theory on group- versus individual-level incentives is ambiguous
− On the one hand, group incentives may induce less effort due to free-riding
− On the other, if there are gains to cooperation, then it is possible that group incentives might yield better results
• Both group and individual incentive programs had significantly positive impacts on test scores in both years
• In the first year, they were equally effective, but in the second year, the individual incentives do significantly better
• Both were equally cost-effectiveY1 Y2
0
0.05
0.1
0.15
0.2
0.25
0.3
0.16
0.27
0.150.16
Individual Group
Effec
t Sei
ze
In theory…
Our findings…
18
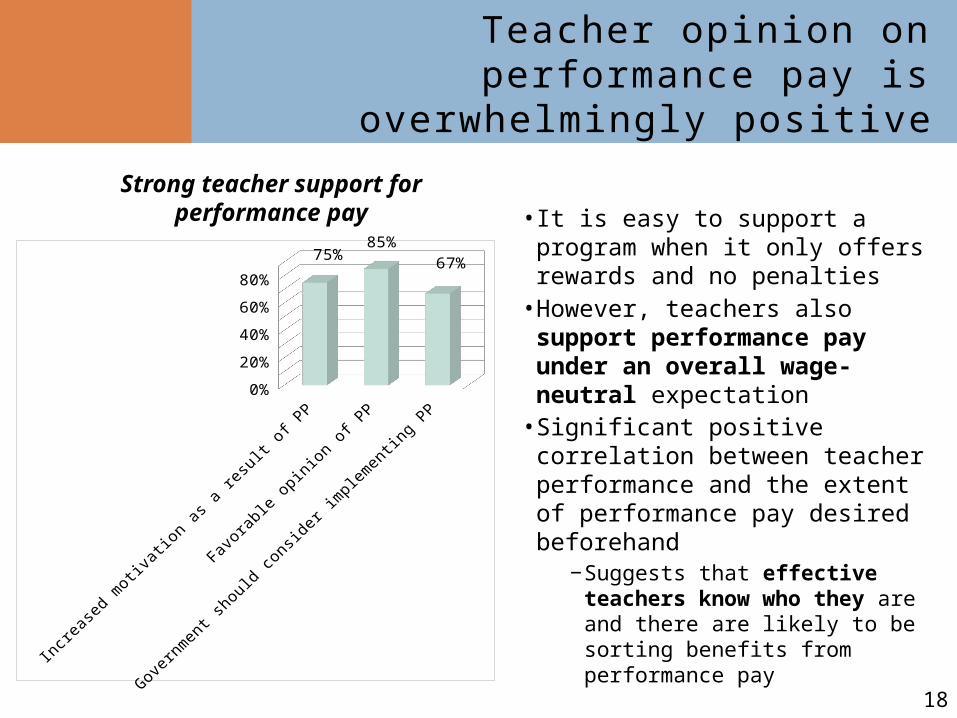
Teacher opinion on performance pay is overwhelmingly positive
• It is easy to support a program when it only offers rewards and no penalties
• However, teachers also support performance pay under an overall wage-neutral expectation
Increase
d motiva
tion as a re
sult o
f PP
Favo
rable opinion of P
P
Govern
ment should co
nsider i
mplementing PP0%
10%20%30%40%50%60%70%80%90% 75%
85%
67%
Strong teacher support for performance pay
• Significant positive correlation between teacher performance and the extent of performance pay desired beforehand
− Suggests that effective teachers know who they are and there are likely to be sorting benefits from performance pay
19
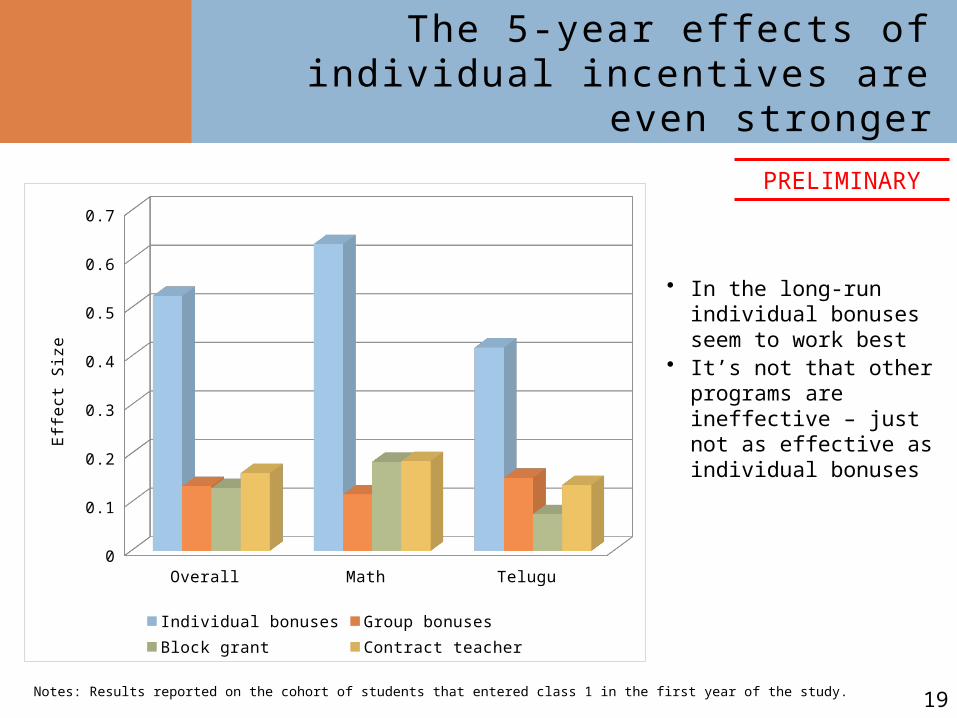
The 5-year effects of individual incentives are even stronger
PRELIMINARY
Overall Math Telugu0
0.1
0.2
0.3
0.4
0.5
0.6
0.7
Individual bonuses Group bonuses Block grant Contract teacher
Effec
t Siz
e
• In the long-run individual bonuses seem to work best
• It’s not that other programs are ineffective – just not as effective as individual bonuses
Notes: Results reported on the cohort of students that entered class 1 in the first year of the study.
20
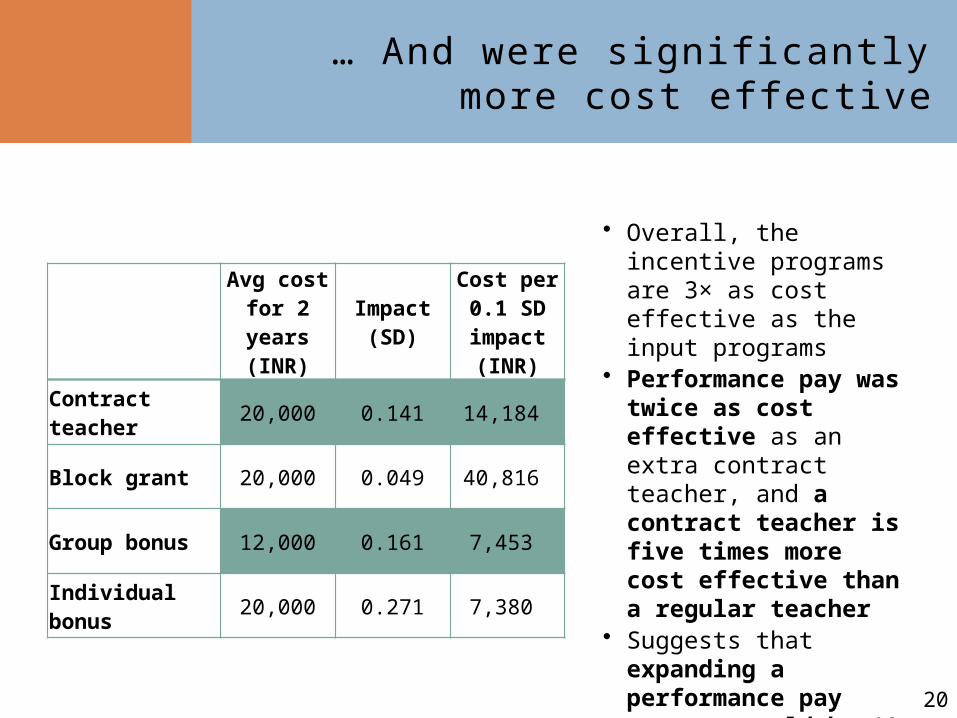
… And were significantly more cost effective
Avg cost for 2 years (INR) Impact (SD)
Cost per 0.1 SD impact
(INR)
Contract teacher 20,000 0.141 14,184
Block grant 20,000 0.049 40,816
Group bonus 12,000 0.161 7,453
Individual bonus 20,000 0.271 7,380
• Overall, the incentive programs are 3× as cost effective as the input programs
• Performance pay was twice as cost effective as an extra contract teacher, and a contract teacher is five times more cost effective than a regular teacher
• Suggests that expanding a performance pay program would be 10 times more cost effective than hiring additional regular teachers

Towards a Just, Equitable, Humane and Sustainable Society
Q&A Session
Thank You
21