m-sster ofcollectionscanada.ca/obj/s4/f2/dsk3/ftp05/mq23415.pdf · 2005-02-02 · per megawan-hour...
TRANSCRIPT

DISTRIBUTIVE FAIRNESS MEASURES FOR
StTSTALhïABLE PROJECT SELECTIOK
A Thesis Submined ro the Facul- of Graciuare Stuaies in
Paniai Fulfaent of the Requirernenu for the Degree of:
M-sSTER OF SCIENCE
Depamnenr of Civil and Geoiogical Engineering
University of Manitoba
Winnipeg. Manitoba
21 Janua., 1997
O Copyright by Samuel Murray Matheson, 1997

National Library Bibliotnèque nationale du Canada
Acquisitions and Acquisitions et BibliograpC,ic Srvices se- bibliographiques
The author has granted a non- exclusive licence aiiowbg the National L1huy of Canada to reproduce, loan, distriiute or sell copies of dÿs thesis in microform, papa or electronic formats.
The author retains ownership of the copyright in this thesis. Neither the thesis nor substantial exbracts fiom it may be printed or otherwise reproduced without the author's permission.
L'auteur a accordé une licence non exclusive permettant à la Bibliothèque nationale du Canada de reproduire, prêter7 distniuer ou vendre des copies de cette thèse sous la forme de microfiche/film, de reproduction sur papier ou sur format électronique.
L'auteur conserve la propriété du droit d'auteur qui protège cette thèse. Ni la thèse ni des extraits substantiels de celle-ci ne doivent être imprimés ou autrement reproduits sans son autorisab.

THE UNIVERSfTY OF MANITOBA
FACCTLTY OF GRAbUATE STUDIES
COPYRIGHT PERMISSION
A Tbcsir/PnctScum submitted to the Frcolty of Gndurk Studia o f the University of Manitoba in partir1 faliEllment o f the rquinmtats for the degrce o f
Pcroiuka bas ôeen gnitcd to the ~~RARY OF THE UN~VERS~TY OF MANITOBA to lend o r wU copies of thb thesis/pncticam, to the NATIONAL LIBRARY OF CANADA to microfilm thb thes&/practicum and to lead or sel1 copies of the Nm, and to UNIVERSITY MICROFïLMS ïNC to publisb an rûstract of th& thesiipracticum..
This mptoduction o r eopy o f this tbaU bas been made available by autliority o f the copyright onner soltly for the purpose o f private study and researcb, and may ouly be reproduced and copied u pcrmitttd by copyright I.ws or with espress written authorbtion from the copyright owuer.

This work develops general faimess measures that rnay be used as criteria for
sustainable project selection. Sustainable deveiopment, fair allocation noms. and
empirical distance-based rneasures of fairness. and their evaluation are discussed-
GeneraIized faimess measures are deveioped and extended for both intratemporal and
intertemporal faimess comparisons. A preiiminary application of the extended distance
based faimess rneasures is rhen performed for a case srudy of the selection of an
elecvicity supply projecr The case s~udy involves seiecting between a dispersed diesel
energy supply and cenuaiized energy supply with land line energy distribution. Due to
dam Limitations, the perceived faimess is meanired in ternis of the annual energy COSU
per megawan-hour that resuit from implenenting each aitemauve. The appiied faimess
measUres indicate that inrratemporal faimess. in temis of the dismburion of user unit
costs, may be increased by choosing the land line aimative and that there is no
significant ciifference among alternatives with respect to intertemporai faimess. These
resulu provide limired insight into the energy supply problem, however, and it is
suggested thar further analyses shodd be conducred when information on the
envuomenral impacts and reiiabiiity of power supply for each of the alternatives become
available.
TABLE OF CONTENTS
LIST
General I
Problem 3
Scope 4
c c "
2.1 Distance Based Fairness Measures 1
. - 2.2 Sustainable Developmenr and Project Selection i /
22
3.1 Classificauon 23
3.2 Relevant Principles and Characteriaics 38
3.3 Evaluation and Recommendations
4 . 0 0 R A T . &NI TN-MP-
39
4.1 Temporal Considerations 39
4.2 Operational Defiirions of Dism'butive Faimess 41
L
5.1 Background 33

5.2 Generation of Annual Costs of Consumers
5.3 Appiication of Dismbuuve Faimen Measures and Discussion
6-Y- coNCr -mQu. A m R E C m M w R A T TTOhTs 70
6.1 Summary and Condusions 70
6.2 Recommendations 74
APPENDICES 82
Appendix A: Raie Calculations
Appendix B: Annual Energy Demand Calculations
Appendh C: Unit Energy Con Calculations 135
Appendix D: Dismbutive Faimess Measure Calculations 174

LIST OF TABLES
b
Table 3.1: Potential Proponionaiity and Need Based Measures 76
Table 3.1: Potenrial EquaIity Based Mesures 7 6
Table 3.3: Impact Distribullons Used to Evaiuate EquaIiry Based Measures -3 5
Tabie 3.4: Results of Applying the Measures to the Exampie Impact Distributions 37
Table 5.1: Average Energy Costs (1993% CDN/MWh/meter)
for a Residential Consumer
Table 5.2: Average Energy Cosu (19935 CDN/MWh/meter)
for a Nonresidenrial Consumer 66
Table 5.3: huatemporal and hrertemporal Fairness Meanire Magnitudes 69

LIST OF FTGURES
Ew
Figure 5.1: Vicinity Map of the Remore Communiries - I 32
viii

The author greatiy appreciares the interest shown and advice offered by Dr. B.
Lence who was the author's graduate advisor during the course of this research. The
insightful comments and suppon offered by Dr. S. Simonouic, Dr. D. Bum. Dr. G.
Johnson. and fellow graduate studenrs at the University of Manitoba were invaluable.
The inter es^ and feedback by Dr. E. Onyebuchi, . Ms. R Kristjanson. Mr. A. Miles. Mr.
B. Wojinski, Mr. Loren Chic& Mr. R Wiens. and Ms. Louelta Harms of Manitoba Hydro
and by Dr. J. Füm and Dr- H. P. Nachmebel ai ~ h e hstitute for Water Managemem.
Hydroiogy, and Hydrauiic Engineering, Vienna. Austria were also greatly appreciated.
The author is m t e N for the financial and rechnical support provided by Manitoba Hydro
under award No. G105, the University of Manitoba Research and DeveIoprnenr Fund. the
Na& Science and Engineering Research Council of Canada under award No.
OGP041643, and the gracious hospitaiity shown by the International Instimte of AppIied
Systems Andysis, Laxenburg, Autria, during a visit to the insurute. Las, but not least, I
thank rny family and fiends for their suppon The views expressed in this work are those
of the author and Manitoba Hydra does noi endorse this work in any way.

Chapter 1 :
INTRODUCTION
1.1 Generai
In the process of project selection and implementation a best compromise solution
for a problern is achieved ofren by considering conflicring aiteria, or objectives, and after
the project is implemented it may be modified as appropriate based on initial impacts and
additional information as this becomes available (United Nations, 1988). Project
selection critena may consider econornic, fiancial, biophysical, and social impacts of a
given project alfernative. Simonovic et al. (1994) recently identified three additional
criteria for including sustainabiiity in project selection. These are: intergenerational
equity. project and impact reversibiiity, and risk management over the. While common
project selection criteria such as economic efficiency are widely applied, appiications of

Chuprer l: INTRODUCTION
project selection aitena based on equity. or faimess, are less cornmon. This work
deveIops intratempod and intertemporal faimess measures that rnay be used in project
selecrion. These measwes are appiied ro a case study, known as the Nonh Cenual
Roject, h a evaluates alternative electrical power supply technologies required to meet
the forty-year load forecast for seven northem Manitoba comunities.
Faimess considerations of a project's impacts are important for two reasons.
First, a decrease in the faimess of a project's impacts rnay decrease social weil being
through the inuoductîon of tension and conflict among individuals within a sociery, that
rnay in nini, decrease individual well being. While a project's mandate may be to secure
an improvement in social and individuai well being, if these project related impacts are
disnibuted Wlfairly, the mandate's objectives rnay not be M y realized. Furthemore, if
civil engineers are aware in advance of faimess issues, which are often a prirnary concem
for decision makers, projects rnay be better designeci for their intendeci purpose. Second,
decreases in fairness rnay increase the drive for interested and affected individuais ro
form an organized effort to resist the project from being implemenred Therefore, the
more unfak a project's impacts are perceived, the more iikely it is that individuals rnay
oppose the project, and that the risk of irnplementation faiiure wodd increase.
1.2 Problem
Civil engineering projects rnay be seen as an allocation of different impacts that
rnay originate during the constmcùon and operational phases of a project's design iife.

Impacts rnay persist aftet the project has been dismantled, rnay affect other regions. and
may act on a Lofal regional. or giobai scale- An example in water resources engineering
is the consnuction of a structure which controls both spatial and temporal quantities of
surface water in order to harness the biophysicai system's potential energy to further the
well being of individuais within the region. The spatial and temporal manipulation of
surface water from its natud srare rnay distribute impacts within the region that rnay be
seen as unfair by affected or interested groups of people. As tensions aroused by an
unfair allocation of project related impacts rnay decrease well being. the project rnay
therefore not fulIy achieve its intended purpose.
As a review by Marsh & Schilling (1994) shows, a cornmon approach to the
empirical meanirement of disaibutive faimess is performed by using distance based
fainiess meanires. A distance based rneasure is a function of the weighted distance
between a distribution of actual impacts of a project and a disaiution of ideai impacts.
While many different distance based faimess measures exist, a consensus does not exist
as to which are the most suitabIe distance based fairness measures. If these measures are
to be used as dis tr i ive faïmess criteria for project selection, the Nitability of these
different meastrres m u t be addresseci. Furthemore, if these measures are to be used as
aiteria for ortainable project selecuon, they must be cornpatiile with the notion of
sustainability over tirne.
Dinniuuve faimess measures that may be used as aiteria for sustainable project
selection are developed in rhis work. The objective of Chapter 2 is to review the
lirerature in order to answer initial research questions and to identiQ key research
questions which are further addressed in the following chapes of this work. The initial
research questions addressed in Chapter 2 are: What is project selection?; What are key
sustainability issues relating to faimess?; What is fairness in a distributive situation?;
What distance based measures have been used to measure distributive fairness?; Have
any of these measures been evaiuated?; If so. on what bases?; and How have they been
applied in actual case studies? While other methods of measuring fairness may exist,
such as envy or utility based techniques, this work focuses only on the distance based
faimess mezISufes as defined by Manh & Schilling (1994).
The objective of Chapter 3 is ro apply the infomatîon obtained in the fiterature
review in order to idenu@ acceptable distance based fairness measwes which may then
be exarnined in more detail. A set of required principles and characteristics for distance
based distriibutive faimess meames are compiied and for hypothetical impact distribution
magnitudes, several measures that meet these requirements are identified. These
meanses may be extended to account for temporal issues which relate to sustauiability.
The objective of Chapter 4 is to formulate generaiized aggregate distance baseci faimess
measmes that may be used as criteria for sustainable project selection. Sources of
uncertainty relating to these ~~es are bnefly discussed.

Chapter 5 disauses the application of the generaIÏzed distributive faimess
measures to a case study involving a choice between two different power suppiy
technologies for a number of nonhem Manitoba communities. The alternatives for this
problem are disperseci diesel genedon and hydropower generation with land line
distribution, which m u t meer a forty-year load forecast for the communities. For each
alternative. this work considers the annual forecasted average unit energy cost, in 1993
Canadian dollars per rnegawatt-hour ( 1993S/MWh/Year) to consumers wi thin the
communities as the impacts tha are analyzed in temis of distnbutional faimess. Further
cornparisons of other biophysical, sociocultural, and economic impacts that result from
each alternative would be required for îhis problem before a given alternative may be
selected. However, the measures presented here may be appiied should further
meaNngful impact forecasts become available. Finally, a disaission of the application
and conclusions are given. Chapter 6 summarizes the major fmdings of this work and
offers suggestions for future research

Chapter 2:
LITERATURE REVIEW
The Lirerature reviewed here addresses eight initiai research quesrions and
identifes the key issues which are the focus of the following two chapten of this thesis.
The initial researcii questions addressed are: What is project selection?; What are key
çustainabiiity issues relating to faimess?; What is faimess in a disrributive situation?;
What distance based measures have been used to rneasure distributive faimess?; Have any
of these measures been evaluated?; If so, on what basis?; and How have these distance
based meaSuTes been applied in achiai case studies? The Literawe review is organized in
two sections, namely Distance Based Fairness Measures. and Sustainable Development
and Projet Selection.

2.1 Distance Based Fairness Measures
In generai. groups of individuals evaiuate the faimess of a distributive situation by
a social cornparison process in which each group compares what is received to whar il
feeis it should teceive- Blalock (199 1: 207) states that in
". . . considering the reactions of the several parties to any allocation process we need u> rake into consideration their perceptions and interpretations conceming the faimess of both the procedures that have apparentiy been used and also the outcomes or resultants of these procedures."
The procedural aspects of faimess perceptions, such as public participation in decision
making, are important as this process helps to make outcomes more socially Iegitimate.
Legitimacy is a key concem for effective govername. Authors such as Deutsch ( l g i j ) ,
Arthur & Shaw (19781, Blalock (19911, and Alrnond (1995) indicare that groups of
individuals rnay evaiuate the faimess of a disuibution from two general standpoints.
Fim, a group's perception of faimess may be influenced by the procedures used by the
aiiocator such as the quaiification of the allocator, the niles the dlocator follows, and the
timing of the process. Deutsch (1975: 143) states that perceiveci unfaimess
". . . can be aroused in relation to the values underlying the distribution of benefirs and h m , the d e s by which the values are operationaiized (into allocation niles), the implementation of the d e s , or the procedures for deteminhg which vaiues. rules, or practices shall be ernployed."
Deutsch also highüghts the importance of procedural aspects because if the procedure is
seen as unfair the outcome may likely be seen as unfair also. Second, groups of
individuais rnay fom a perception of the faimess of a disuibutive situation based on the
outcome, regardless of the proces used by the allocator. Such discussions iend
themselves to the first question to be addressed in this iiterature review, namely. Whar is a
fair allocation? A review of the literature (Deutsch, 1975; Arthur & Shaw. 1978; Young,
1994; Almond, 1995) indicates two common approaches for identifying the faimess of the
outcome of a distributive situation that rnay be compatible with distance uased fairness
measures a n 4 in ihis work, these two are referred to as the nom-based approach and the
nomarive approach. Other approaches for identifying a fair allocation are reviewed by
Young (1994) and Airnond (1995).
The nom-based approach focuses on three different fair allocation noms that
groups rnay employ to evaiuate the fairness of a disnibution of benefits and hams:
equaiity, need, and proponionaiiry. An equal distribution rnay be seen as fair when there
is no ba i s to differentiate among groups. However, situations rnay arise where groups
are different and one group rnay need more of what is being disaibuted than anorher. For
this reason, the distribution of bene& according to how much each gmup needs is often
proposed in addition to equaüty. The concept of need is not wideIy addressed in the
Iiteratwe reviewed and requires funher investigation. Almond (1995) states that the
determination of how needy a group is rnay be addressed by examining statistics such as
infant monality or life expectancy. An approach that ody considers needs however,
ignores differences in how much each group conaibutes towards receiving a given benefit
or h m

The third allocation nom, known as proponionality, focuses on differences
arnong groups and requires that each group should receive goods in proportion to what
that group desemes. How much a group deserves, .dso referred to a group's input. is
problem specific and many factors have been considered as inputs (Deutsch, 1975 and
Cook & Yamagishi, 1983). Inputs rnay be multidimensional and classified as either
contributions or attributes (Cook & Yamagishi, 1983). Contributions may inciude factors
such as effort expended or rime spent on a task Atvibutes are specific to each group and
include characteristics such as: age. race, occupation. and 'gender. The authon feel that
the choice of which attribue is imponant is greatly influenced by cultural beliefs. The?
&O state that, ideally, contributions should be used as an input rather than atmbutes
because conmi.utions such as effort and performance are more directly related to the
input-outcome relationship.
Cook & Yamagishi (1983) also distinguish between fmed settings and variable
senings. In fixed settings, there is a fuite amount of what is being dismbuted and in this
senùig, both amibutes and conmbutions are likely to be perceived as relative inputs. In
variable senings, there is a Iimirless quantity being distributed, there is a more direct
relationship between inputs and outcornes, and thus contribution may be perceived as the
most relevant input The defintion of proportionalhy may be problematic if each group's
input cannot be assessed or if the effect being distributed carmot be divideci. Young
(1994) disaisses methods to overcome problems of indivisibility such as conversion,
rotation, and randomization,

The relative importance of each fair allocation nom is identified by Deutsch
(1975) and Blalock (1991) with some success. Deutsch (1975) proposes that
proportionality would prevail in economically cornpetitive settings. equality would
prevail in solidarity orientated settings, and need would prevail in caring senings.
Addiuonaily, Deutsch (1975: 145) States that proponionally, *. . . over the long mn, is
likely to be dysfuncuonai for groups, economically as weii as socially." B y allocaring in
proportion to one's convibution Deutsch States that people with power rnay bias the
system toward disproportionate awards. Also, a propo&onaiity based allocarion ma!
propagate economic values into all aspects of social hie that rnay result in a loss of qualiry
of life (Deutsch, 1975). Blalock (1991) proposes a generalized mode1 that consisrs of 42
causal variables that rnay be used to detemllne differential emphasis placed on the three
different allocation noms by allocators and groups. For exarnple, a greater emphasis on
proportiondicy rnay result in situations when groups have a self-serving bias, when
influentiai groups favor their own qualifications, and when there is a possibility to modify
beliefs. A grearer emphasis rnay be placed on need when groups do not have a self-
serving bias, when the item beuig dismbuted is scarce, and when groups feel that the
needy are in such a position through no fadt of their own. A greater emphasis rnay be
placed on equaiiy when groups do not have a self-serving b i s , when soiidarity is
irnponanf when the cornpetitors are indifferent to receiving the item being disaibuteci,
and when there is iittie information avafiable to the allocator.
The second comrnon approach to evaluate the faimess of a distributive situation
employs a normative theory of distributive justice. Authors such as Anhur & Shaw

(1978) and Young (1994) briefly mention the t h e fair allocation n o m describe above
and state that these are aho used in the more complex normative approaches. These
authors highiight cornmon Utilitarian, Rawisian and Libenarian philosophies. A classic
Utilitanan philosophy, advocated by Mill (18611, states that a just distribution will be a
distribution that maximizes the total satisfaction of al1 individuals. CIassical
Utilitarianism, usually operationalized in tems of the Greatest Good Pnnciple, requires
that the besr distribution resulrs under the greatest sum of satisfaction or. utility.
UUIitarÏanism is often criucized as a theory of jusuce because it may favor situations in
which a few may pay a high pnce while many may benefit litrle. .4dditionaliy. the
concept of utility is often criticized because one person's uiility is not readily comparable
to another person's utility. A Rawlsian phiiosophy, based on the work of Rawis (1971).
states that a just distribution will be the lest unequal distribution of primary goods thar
makes the worst-off person as bestsff as possible. Primary goods are defined by Rawls
as means to achieve satisfaction and include factors such as income, power, and
oppommity. A Rawlsian approach is unially operationdized by employing the M m i n
P ~ c i p l e which requires that the worsm-off group be made as well-off as possible.
Libertarians, such as Nozick (1974), state that the just dismbution is the dismbution that
does not violate any individual's righu.
Issues related to distance based faimess meaSuTes include: What distance
measufes are commoniy used?; Have these meastres been evaluated regarding their
applicability?; If so, on what bases?; and How have these meanus been applied? Manh
& Schilling (1994) review disrance based proportionality and equaIity measures.

commoniy refend to as equity measures. that are frequentiy used in faciiity location
analysis. They defue equity as the fairness of the impacts that result from a siting
decision, as perceived by affected groups of similarly situated individuals. A distance
based faimess measure is a weighted sum of the distance between a dismbution of ideal
points and a distribution of actual points. The authors suggest that while grouping is
problem specific, similarly situated individuals rnay be aggregated into groups bg a
spatial basis, demographic basis. physical basis. temporal basis, or combination of bases.
Additionally, tools such as ciuster analysis and pattern reco&tion techniques may also be
useful for group definition. The authon review twenty distance measures found in
economics, sociology, social psychology, management science, and engineering literature.
Regarding the evaluaüon of various distance based fairness measures, Marsh &
Schibg (1994) note a lack of consensus in the literature as to which distance based
himess measure is appropriate in a given situation and mention several common
desirable characterinics. These characteristics are analytic tractabiliry, appropriateness,
irnpaniality, adherence to the Principle of Tramfers, adherence to the Principle of Scaie
Invariance, satisfaction of Pareto Oprimahy, and the ability to be normaiized. Some of
these characteristics are discussed in more detaii by Aiker & Russett (1964), Atkinson
(19701, Champemowne (L974), Kolm (1976), Aiiison (1978). Muiiigan (1991), and
Mandeil (1991). Manh & Schilling (1994) note that there is no consensus in the Iiteranire
on which characteristics are required, and which characteristics are simpiy desirable, for a
good distance based faimess measure.
Marsh & Schilling (1994) propose an oqanizational framework to facilitate future
evduation of distance based equity measures that consists of soning measures based on
three factors: reference disuibution. scalhg, and distance exponent The authon describe
a reference distribution as being a specific or desired effecr level for each group. or the
perceived fair disnibution. Possible types of reference distributions are peer, rnean. or
atmbute based distributions. Peer and mean based reference distributions reflect the
equaiity fair allocation nom where peer reference distributions refer to comparisons
among al1 peen and mean reference distributions refer io comparisons with the rnean
impact for al1 peers. From this point on, measures of this type are referred to as measures
based on an equdity comparison approach- It is important to note that of the cwency
measures reviewed by Marsh & Schilling (19941, thineen of these measures are based on
an equaIity comparison approach Marsh & Schilling (1994) also describe an anribute
reference distribution as being specific to each group and being based on, for example. the
Level of social need, desire, demand social merit, or population of the group. An atuibure
based reference distribution rnay be seen to be based on the proportiondity or need fair
aiiocation nom. Thus, from this point on, measures of this type are referred to as
measures based on propoxtionality or need comparison approaches. Scaiing is described
as being cornmoniy used when group s i w differ to account for large differences in the
sue of the distances measured. If scaiiig is perfomed, it is typically based on a
normalization of distances or a weighting based on the different attributes of the groups.
Commonly used distance exponents are either one, two, or infinity. As tbe magnitude of
the distance exponent increases from one, a greater weight is placed on deviations fiom
the reference distributioa Manh & Schilling (1994) conclude by stating that a universal
distance based fairness measure does not exist and that more work needs to focus on
defming seleetion criteria that may be used to determine what is a good equity measure
and exarnining the conflict between equity and efficiency.
The work of Marsh & Schilling (1994) is an organized attempt to f o m a cornmon
framework for using distance based faimess measures defined as some weighted distance
between an actual sutte and an ideal state. However. a few points are not svessed
suficiently in this work. First. discussions of an ideal. fair. or just disuibution are not
addressed in Marsh & Schilling (1994). These are considered in the dornain of
disaiiuuve justice, and have been discwed since philosophers such as Anstotle (see
Thomson, 1985).
Second, distance based measures are used by social psychologists and economists
ro ernpiricaily meanire how fair or jus& a distributive situation may be perceived by
affecteci individuaIs, and they refer to these empiricd measures as inequdity and inequity
measures, respectively. They have different perspectives on what consutures a fair
allocation- Distance based measures, employed by economists to measure equaliry, may
be thought of as a nom-based approach to fairness measurement and are based on an
equality fair allocation nom. in contast to th&, distance based measures employed by
social psychologists, are based on both equality and proportionality n o m following the
work of Adams (1963) who defined equity in this rnan.net. These attitudes, which are not
expIicitly disnissed by Marsh & Schilling (1994), may have important impiicatiow in the
evaiuation of distance based fairness masures. For example, Marsh & Schilling (1994)

srate that a desirable characteristic of a good equity measure is that it sati* the Principle
of Transfers. However. the Pruicipie of Transfers, deveioped by Pigou (1912) and Dafton
(1920) for equality measures, is associated with an equality nom and has nothing to do
with a propo~ionality nom, a persons input, or contribution-
Third. definitions of distance based faimess measures reflecting a need based fair
allocation n o m are not reported. As the Iiterature indicates (Deutsch. 1975: Blalock.
1991: and Almond. 1995) proportionality, equality. and need fair allocation noms are
empioyed by groups in faimess evaluations to varying dekees. the introduction of need
based cornparison measures may make distance based faimess measurement more
andogous to that of the nom-based fair allocation approach discussed above.
A diverse iiterature on the application of distance based faimess measures in
acntal decision making situations exists. Examples in water resources engineering and
management science include Brili (1972), McALlister (l976), Cohen (1978). and Sampath
(1991). Brill (1972) examines both efficiency and equity aspects of wasre discharge water
quality management programs for the Delaware Escuary. He defines equity as the
equaiity of removal efficiencies among dischargers and uses three different distance based
fairness measures. These are the absolute deviation from the mean waste treatment levei,
the range between the maximum and minimum waste treatment leveis, and the maximum
of the waste meamient levels. McAUister (1976) presents a theoretical framework to
evaluate faimess and efficiency for both deiïvered and non-delivered urban public
services to examine the implications of service size and service spacing alternatives. He
defines faimess as the degree of equality and operationalizes it by comparing standard

deviations of the distances between service centen and demand points- Cohen (1978)
discusses a muiti-objecthe river basin development plan for the Rio Colorado River in
Argentha in which a regional allocation objective function is formulaied in addition to an
efficiency objective function. The regional objective function is to mùiimize the mean
absolute deviation of water withdrawals among four provinces in a region Cohen also
mentions that, for this case study, the decision rnakers did not agree with an equality norm
nor would they reveai their preference for an alternative fair allocation norm. Sampath
(1991) employs the Theil Entropy Coefficient to examine'fairness in the distribution of
access to imgauon water between agricultural groups in India. Sampath also mentions
that an egditarian policy may be compatible with a Rawlsian based imgation policy.
Egalitarianism, a popdar phiiosophy in welfare economics, is another possible normative
approach and requires an equal distribution of welfare among individuals.
McKerIie (1989) addresses the intertemporal application of distance based faimess
measures and discusses temporal aspects in faimess evaiuations. In comparing impacts
on two people, he considers whole lives, sirnultaneous segments of lives. and
corresponding segments of Iives cornparisons The whole Iives approach compares the
total impact acting on each person's Iife. This approach may not reflecr differences that
occur during some time penod of the different Iives. The sirnultaneous segments
approach compares the impacts acting on the individuals in some mutuai time period in
both Iives. The comesponding segments approach compares the impacts acting on each
life in the same stage of the respective lives.

Chaprer2: LI7ERUU.E REWEW
2.2 Sustainable Development and Project Seiection
According to Munasinghe & McNeeiy ( 1995: 20), throughou the
populations that swived were by definition those that had a susrainable relationship with
their environment: that is. unsustainable behavior led to displacement or extinction of the
population or to a change in human behavior." However. as David Suzuki (Aberly, 1991:
2) sures, 'this century. human societies have undergone explosive change as a result of
technologica1 innovation, increased population, higher material demands and
consumption. a massive move to cities, and the giobaiization of economies." These
driving forces. processes, and movemenis have caused ecologica1 damage on al1 scales
that was severe enough to gain the attention of the international community and the rem11
is an extremely large and diverse Lirerature involving the harmonization of human activiry
with environmentai protection.
Morita et al. (1993) review the origin and meaning of susrainable developmenr
and note that in 1980, sustainable development was used for the first t h e bp the World
Conservation Smtegy who advocate three ways to achieve bener developmenr. These
are: the maintenance of a basic narurai system, the preservation of genetic resources, and
the sustainable use of the environment. They also review forty definitions of susminable
development from different discipiines and find that these are different from one another
but may be classified into three different categories. These categories are: definirions
that sness the importance of naturai conditions, definitions that stress equity, or faimess,
among generations. and definiuons that stress social justice and quality of life.

Additionally, authors such as LeIe (1991) and Dovea & Handmer (1993) also mention a
lack of consistency in the definition of sustainable development and several
inconsistencies and paradoxes with the concept Holdren et al. (1995: 4), in discussing
the biogeophysicai aspects of sustainability. note that -. . . much of the analysis and
discussion of this topic remains mired in terminological and conceptual ambiguity about
the facts and practical implications." Morita er al. (1993) note the term sustainable
developmenr gained greater popularity in 1987 when the Brundtland Commission
(WCED, 1987) defined sustainable development as '. . . development that meets the
needs of the present while not compromising the ability of future generations to meet their
own needs." The Brundtland Commission ' s definition of sustainable developrnen t
stresses the consideration of the needs of the present generation and of future generations,
and has prornpred others (Young, 1992; Beluatti, 1995; Munasinghe & Shearer, 1995) to
promote equiv as one of a number of objectives required for sustainability.
Munasinghe and McNeely ( 1995) organize approaches to sustainable developrnent
by the common disciplines that discuss the concept, namely: economics. ecology, and
sociology. Economists relate sustainability to the preservation of productive capital stock
where efficiency. growth, and stability of capitai are main objectives. Ecologisa are
concemed with the sustainabüity of the biophysical subsystem and focus on the
biophysical system's resilience. An ecologist's perspective of sustainable development
includes considerations such as the maintenance of biodiversity, the sustainable use of
naturai resources, and the assurance that human activity does not exceed an ecosysrem's
canying capacity . B iodivenity, according to Munasinghe & McNeel y ( 1993, includes

the genetic raxonomic and ecologicai variabiiity among living organisms; that is the
variety and variabiIity within species. between species. and within the biotic components
of ecosystems. The sociocultural approach focuses on sustaining the socioculturai system
through the adaprability and presewation of diverse social and cultural systems. The
main objectives are thought to include the reduction of poverty. the promotion of public
consultation and empowennent. and the preservation of culture and heritage.
Innagenerationai equity. or faimess within a generation. and targeted relief and
employment are to provide econornic and social linkag& according to these authors
although these are not discussed in detail. The economic and biophysica1 linkages are to
be achieved by economic valuation techniques and the intemalization of externaiities.
The social and biophysical mages are to be achieved through intergenerationai equity.
or faimess between generations, and gras-roots participation considerations. Three
reoccurring themes appear in al1 Iiteramre reviewed that discuss sustainable development.
Fit, nisralliability discussions usuaiiy focus on developmenüii impacts to social.
economic, and biophysical systems because sociologisrs, economists, and ecologists
respectiveiy. have discussed sustainable development the most This may indicare that
sustainabIe project selection aiteria shouid examine social. economic, and biophysical
project related impacts rather than, for exampie, only the economic impacts of a given
project alternative- Second, discussions of intragenerational and intergenerational equiry
in the sustainability literature are very iimited and do not mention any of the Iiterature on
fair allocation or distance based faimess measures discussed in the previous section.
Thus. the incorporation of these considerations rnay more iully deverop the concept of

sustainable project seiection especially if one chooses to use a definition of sustainable
development, such as the Brundtland Commission's. which according to Monta et ai..
stresses the imponance of faimess berween and among generations.
Nachmebel et al. (1994). Simonovic et al. (19951, and Matheson et al. (1997)
discuss criteria for sustainabie project selection. According to the United Nations (l988),
project selection and implemenration negotiares a best compromise decision where
confiicting objectives exist, initiates the project, and modifies it as appropriate based on
initial impact and additional information as it becomes available. The combining of these
impacts into a measure of relative worth so that the aitemative projects can be ranked
clearly involves making compromises arnong conflicting objective values. Typically.
multi-objective project seiection techniques are used to make comparable objectives
which are initidy non-cornmensurate so that the project rnay be selected that achieves
each of the objectives to some degree. For a detailed discussion of multi-objective
techniques, see Cohen (1978) and Bogardi & Nachtnebel (1994). According to Cohen
(1978) and the United Nations (1988). project selection is one srep in the project planning
cycle. The project planning cycle consists of five inter-related and iterative mks (United
Nations, 1988). These are: project identification; project assessment; project screening;
project selection and irnplementation; and project monitoring and modification. Project
identification involves the creation of alternative activities or projects that appear ro
satisw development objectives. that wiU be financialiy feasible, and that are
institutiondly acceptable. Development objectives rnay be categorized as financial.
economic, social, and environmental. Project assessment predicu and evaluates di

altemauve project impacts, costs, and benefiu to aii affecred individuals to the extent
possible. According to Erickson (1994). impacts may be seen as direct, indirect, or
cumulative. Direct impacts are changes in environmenta1 components and processes that
result immediately from a project related activity or action. Indirect impacts are changes
in environmental components and processes that are consequences of direct impacts.
CumuIative impacts are the aggregates of direct and indirect impacts resulting from two
or more projects in the same area or region. Cumulative impacts are important because.
while a given project may have a srna11 incremental impact on the environment. the
cumulative loss in the region may be seen as significant. Projecl screening is the ranking
of alternative competing projects and the identification of projects which seem to ment
senous consideration by those responsible to the extent possible. This may be
accomplished by techniques such as the development of Information Matrices. Scorecard
Display Techniques, and Cornputer Graphic Dispiays (United Nations, 1988). Project
Monitoring and Modification requires the monitoring of project impacts and modifying its
design and/or operation as desired to reduce adverse impacts and enhance beneficial
impacts.

Cilaprer 3: DISTANCE BASED FAlRhZSS MEASGRES
Chapter 3 :
DISTANCE BASED FAIRNESS
MEASURES
As discussed in Chapter 2, works in the disciplines of economics. engineering.
management science, and social psychoiogy have empiricaily meanired the faimess of a
distributive situation by using a variet. of distance based faimess measures. However. a
consensus on which measure is the most appropriate, and a method with which to select
an appropriate masure fron arnong a set of possible meanires, are not given in the
literature. Therefore, this chapter discusses the evaiuation of distance based faimess
measures in more detail given the desirable principles and charac~eristics found in the
fiterature, proposes a framework for their evahation, and evaluates the appropriateness of

the twenty masures discussed by Manh & Schilling (1994) based on this framework.
Ody appropriate measutes, as decermined here, are then be considered for the
development of sustainable project selecrion cnwia presented in Chapter 4.
3.1 Classification
It is proposed in this work that the generalized frarnework for classifying distance
based faimess measures in Marsh & Schilling (1994) be modified to explicitly
accommodate the three types of fair allocation norms discussed in Chapter 2. Recall b a t
the three fair allocauon norms are based on proponionality, equaiity, and need Distance
based faimess measures that account for deviations from an allocation that is proportional
to a group's input are refend to hereafter as proportionality based measures.
Proponionaliy based measures compare an actual impact that acts on group i, E N , to
A M , the amount of that impact that group i deserves to receive; or A, the average
deserved impact of ail groups. Distance based faimess measures that account for
deviations fiom an equal aliocauon are refened to hereafter as equaiity based comparison
measures. Equality based measures compare an acnial impact that acu on group i, EC). ro
either EiI), the actuai impact that affects groupj; or Ë , the average of the actual impacts
affecting ail groups. Distance based faimess measures that account for deviations from an
allocation that allows the needs of each group to be met are referred to hereafter, as need
based comparison measures. As no need based mesure is given in the literature, and
since one's need may be expresseci as a constant similar to one's input toward receiving

Chaprer 3: DISTMCE BASED FAIRNESS MEASURES
an impact or one's deserved impact. meannes sirnilar to those of proponionaIity based
measures may be used as need based measures. In this manner, need based measures
compare an actual impact that acts on group i, E(il, to Z(il, the amount of impact thar
allows group i to meet its needs or 2 , the average of what al1 groups require to meet rheir
needs. Of course. this is only one way of meamring the deviation from meeting needs
and other approaches may be possible.
Distance based faimess measures discussed by Hams (1983) and Marsh 6;
Schilling (1994) are the: Center. Variance, Mean Absolute Deviation, Sum of Absolute
Deviations, Range. Coefficient of Variation, and Variance of Logarithms measures: two
variations of the Surn of Absolute Deviations (ErkutJ992), one variation of the Mean
Absolute Deviation (ErkutJ992). and one variation of the Range (BriU,1972); the Gini
Coefficient, Hoover Concentration Index, Coulter Measure, Walsrer Meanire, Equal
Excess F o d a , Adams Formula, Schutz Coefficient, and Theil Entropy Coefficient: and
one variation of the Coulter Measure proposed by Mayhew & Leonardi (1982). These
measures are presented in Tables 3.1 and 3.2 according to whether they are prirnarilv
based on the proportïondity or the equdity nom, respectively. Potenual need based
measures may be viewed as having the same structure as the proponiondiry based
measures presented in Table 3.1 at this point, but here Ac) would be replaced by Zfi) and
- A wouid be replaced by Z. These potentiai need based measures are not shown as to
avoid unnecessary =petition at this t h e .

CMprer 3: DISTANCE BASED FARNESS MEASURES
The Center measure does not correspond to any nom-based fair allocation
approach and is chus eliminated from further consideration. When considering the
frmework of Manh & Schilling (1994). potentially appropriate proponionality and need
based measures have an attribute based reference distribution. Potectially appropriate
equality based measures have peer or mean reference distributions and do not contain an'
reference to an attribute. EquaIity based measures that have a mean reference distribution
have, in actuality. a peer reference disuibution as the mean is the average of ail peer
impacts. Recall from Chapter 2 that while both peer and mean based reference
distributions reflect the equaiity fair allocation nom. atuibute based reference
disuibutions may reflect a proportionality or need fair allocation nom. Peer reference
dism%utions refer to comparisons among al1 peen and mean reference distributions refer
to comparisons with the mean impact for al1 pers. An anribute based reference
distribution is specific to each group and rnay be, for example. the level of social need,
desire, demand, social merit, or population of the group. An amibute based reference
dismbution may be seen to be based on the proponionality or need fair allocation nom.

CRPprer 3.- DISTANCE BAS= FAiRNESS MEASURES
Table 3.1: Potential Proponionality and Need Based Measures
Name Measure Fair Allocation Reference N o m Distribution
Adams Formula Eü) E ( j ) Proponionai i ty Peer (and Equality)
Proportional i <y Attribute Walster Formuia
Equal Excess Formuia
Couiter Method
Proportionality Attnbure
Proportionai it y Attribute
Coulcer Method $1 Proportionaiiry Mean (and Equality) (and Peer)
Hoover Concentration Index
Tabie 3.2: Potentîal Equality Based Measures
Name Formula Fair Allocation Reference N o m Distribution
Variance Measure
Coefficient of Variation Equaiity Measure (i (EH -Ê)')
k l
Mean Absolute Deviation Measure
Schutz Index

C ~ p c e r 3: DISTANCE B A S W FAIRNESS MEASURES
Table 3.2 (cont.): Potenual Equality Based Meanires
Name Formula Fair Allocation Reference N o m Distribution
Variation $1 of EquaIity Mean the Mean Absolute Deviation Measure Erkut, 1992)
Peer
Peer
Sum of Absolute Deviations Measure
Variation $1 of the Sum of Absolute Deviations Measure (Erkut, 1992)
Equai i ty
Variation $2 of the Sum of Absolute Deviations Measure (Erkut, 1992)
Equality Peer
Equaiity Peer Gini Coefficient
Equaiity
Equality
Peer
Peer
Range Meanire
Variation =l of the Range Measure (Brill, 19/21
Equality Mean (Peer)
Theil Entropy Coefficient
Equality Variance of Logarithms Measure

3.2 Relevant Principles and Characteristics
When discussing equality measures. Temkin (1993) suggests that a lack of
consensus on appropriate faimess rneasures may result from authors not knowing which
distribudve principles should be represented by each measure. He suggests thar in order
io capture the notion of equality. one should determine the important pnnciples. arrive at
an accurate measure of each principle. and constnict a measure so as to reflect the
importance of each principle. Expanding on these ideas. it is proposed in this work that
principies given in the Iiterature be associaied with proportionality. equality. and need fair
aliocation noms in this section so that each type of fairness measure may be evaluated in
the next section of this chapter..
The Iiterature reveais that distance based fairness measures are evaluated
according to the following principles: Fundamental, Transfen. Scale Invariance.
Additive, Weighted Additive. Maxmin. Impaniafity, and Consistency in addition to
analytic tractability, satisfaction of Pareto OptimaIiry. and an ability io be nomalized.
Based on the work of Adams (19631, Harris (1983) cites the Fundamend Pnnciple as a
major requirement for al1 appropriate proportionality based faimess measures. The
Fundamentai Principle requires that when a group's relative outcome remains constans.
the group's outcome should increase monotonically with that group's input Hams
defines a group's relative outcome as the cornparison of that group's outcome to their
input where, an input is that which a group perceives as a contribution or anribute towards
receiving some impact, and an outcome is the impact that this group perceives as
receiving for this input. This means that outcomes should be disîributed in proportion to

Chapcer 3: DISTANCE B A S ' FAliClyESS MEASURES
inputs. In the context of sustainable project selection, a group's inputs are seen to be
either atmfibutes or contributions towards receiving a given project related impact A
group's outcornes are the project related impacts that affect that group.
The Principle of Transfers. developed by Pigou (1912) and Dalton (1920). requires
that meanires show an improvement in equality when a unit amount of some benefit is
transferred from someone better off to someone wone off. The Principle of ScaIe
Invariance is also suongly supponed in the lirerature. Measures satisfying the Principie
of Scale Invariance mus1 show thai relative differences in impacts matter and not absolute
differences. Thus. if a situation occurs in which. for two impact distributions. one
distribution is a multiple of the other. a scaie invariant equality measure would caiculate
the same deviation from equaiity for both distributions as the relative differences remain
the same.
Temkin (1993) proposes the Maxmin. Additive. and Weighted Additive PrincipIes
as principies of equality. The Weighted Additive Principle requires equaiity ro be
measured by nimming up dl differences among individuals and attaching a weight to
these differences. The Additive Principie may be seen to be a special case of the
Weighted Additive Principle, it is the same except that, no additional weight is afforded to
larger differences. The Maxmin Principle may also be seen to be a speciai case of the
Weighted Additive Principle, it is the same except that, the largest possible weight is
atmched to the largest deviation from equality. Under the Mêwmin Pnnciple the equdity
masure would report the magnitude of the largest deviation.

Citaper 3: DISTANCE BASED FWlùESS h&tSC/RES
It seems intuitive that d i distance based faimess measwes shouid be both
Impartial and Consistent Impartialiry requires that faimess evaluations be based on what
is being disuibuted and not on some oher ordering or ranking while Consistency requires
faimess evaIuations to be made in a similar fashion among al1 groups. A measure that is
not impartial may be a measure that is biased towards one group. In this work. an
impartial measure examines al1 impacts among al1 groups. Consisrency requires that.
when a measure is applied to a distribution of impacts, the measwe is appiied in the same
way for a11 groups.
The desirable characteristics suggested in the lirerature include analytic
nactabiliry, satisfaction of Pareto Optimaliry, and the ability to be normalized. A measure
that is anaiyticaily tractable shouid be intuitive for the decision maker and be relatively
easy for the analyst to apply. Pareto Optimdity requires that, as one person is made
bener-off no one is made woee-off. Nomaiization requires that the magnitude of the
measure be bounded between two values so as to facilitate the cornparison of the
magnitudes of measures for two or more different distributions. Faimess measures may
also be bounded from some lower value up to some upper value to provide the decision
rnaker with numbers that are comparable across alternatives.
As the Fundamental Prïncipie is the only principle found in the Iiterature retated to
a group's input, the Fundamentai Principle from this point on, is regarded as a principle
associateci with a proportionality fair allocation n o m The Principles of Transfen and
Scale Invariance have been discussed historicaily by economists in the context of equality
and are not related to a group's input in any way. It should be stated that Temkin (1993)

Chuper 3: DfSTmCE B A S ' FAiRNESS MEASORES
feels that deviations from equaiity matter more at Iower positive impact magnitudes than
at higher positive impact magnitudes. While the author of this thesis agrees with Temkin
in part that deviations from equaiity matter more at Iower positive impact magnitudes. the
author believes that, as defined in this thesis, the issue of absoiute difference relates more
to a need based fair allocation n o m than an equaiity based fair allocation nom.
Therefore. from this point on, al1 appropriate equaiity based rneasures should satisfy the
Pnnciple of Transfen and the Principle of Scaie Invariance, and these principles will be
considered in the evaluation of appropriate equaiity based measures given in the nexr
section. Principles relathg to a need fair allocation norm were not found in the
and future research efforts toward defining these must be iniuated.
AD proponionaiity, equality, and need distance based fairness measures
i terature
are seen
to satisfy the Weighted Additive Principle as the value of the exponent implicir in the
equations presented in Tables 3.1 and 3.2 may take on any value. Therefore, it is
proposed here that d l faimess meastues satisfy the Weighted Additive Principle. As al1
rneasures appear ro saus@ the Weighted Additive Pnnciple, this principle is not
considered in the evaluation of appropriate measures given in the next section. The
principles of 1mpaniaIit.y and Consistency are considered by Young (1994) and Almond
(1995) to be cenaal to fair allocation. The Impaniality, Consistency, and Weighted
Additive Principles are considered in this work to associated with fairness in general and
not specific to any one fair ailocation nom. Thus, al1 distance based fairness mesures.
regardless of the fair allocation norm the measure may reflect, must therefore satisfy the
Irnpartidity, Consistency, and Weighted Additive PNiciples. As al1 distance based

faimess meanves discussed here appear to satisfy the faimess principles, they are not
considered furthet however, these p ~ c i p l e s may gain importance when considering the
procedural aspects of faimess evaluations. For example, a survey designed to collect
information on the relative imponance attached io different fair allocation noms by
groups should not exclude any group or attach more weight to a certain group's response.
The characteristics of analytic uactability. satisfaction of Pareto Optimality appear to be
more relevant to the application of the measure rather than the design of the measure itself
and thus are not considered further.
3.3 Evaluation and Recornmendations
While social psychologisrs, economists, and management scientists have made
valuable contrïïutions in the evduation of distance based fairness rneasures much work
remains. Hamis (1983) reviews commonly used distance based faimess measures, known
as equity measures, in social psychoiogy, and concludes that equity measures are still
evolving and that there is no single best meanire. He examines seven rneasures of which
three are also analyzed in Marsh & Schilling (1994): Adams Formula, Walsters Formula,
and Equai Excess measute. The remaining four meanires are variations on the three
rneasures ais0 examineci by Marsh & Schilling (1994). Harris tests seven common equity
measures and f i that, of the three equity meanires also discussed by Manh & Schilling
(1994), o d y the Equal Excess Formula satisfies the three criteria required for a good
equity rneasure- Four other measures not menrioned by Marsh & Schilling (1994) also
32

satisfy the Fundamental RUiciple. These are the: Walsrer Formula $2, Moschetti
Formula, Harris Linear Formula, and Ham's Exponenrial Formula. Hams concludes by
recommending the Iatter two rneasures and swing that while progress has been made in
the search for a good equity formula, it is however an ongoing process. AIiison (1978)
evaluates the Relative Mean Deviation and Variance of Logarithms measures; and the
Coefficient of Variation, Gini Coeficient, and Theil Entropy Coefficient. While al1
measures satisfy the Principle of Scale Invariance, the Relative Mean Deviation and
Variance of Logarithms masures fail to satisfy the ~rin$e of Transfen. Mulligan
(1991) determines that while the Standard Deviarion measure satisfies the Principle of
Transfers, the Hoover Concentration Index does nor Mulligan does not evaluare the
compliance of these measures with the Pnnciple of Scale Invariance. Erkut (1992) shows
that while the Sum of Absolute Deviations measure satisfies the Principle of Transfers.
the Center and Range based measures do not Mandel1 (1991) determines that the Center.
Range, and Sum of Absolute Deviations measures fail both the Pnnciple of Transfers and
the Principle of Scale Invariance. These results tsonflict somewhat with Erkut's (1992)
resdts for the Sum of Absolute Deviations measure.
While the above authon evaluate a given measure with respect to a given
principle. they are not specific about how they evaluate a given measure nor do they
provide any caicuiations. In addition, a comprehensive evduation of these meanires
remains to be conducted For a hypothetical data set, this section aaempts ro address
these shortcomings by evaiuating proponionality and equality based faimess meanires
Ciuzprer 3: D I S T ' C E BASED FdRhrESS MMEASURES
according to the pnnciples associated with each fair allocation nom as found in the
previous section.
Table 3.1 contains six potenrial proponionality and need based faimess measures
the Adams Fonnuia, Walster Formula, Coulter Method, Variation +1 of the CouIter
Method. Hoovers Concentration Index, and Qua[ Excess Formula. To evaIuate the
ability of these measures to satisfy the Fundamental Principle. consider a situation where
group 1 has a input, A(l l , equal to -2 and an outcome, E(l), equal to +2. Croup 2 has an
input, A ( 2 , equal to +4 and an outcome. EIZIT of -4. In this situation. Adams Formula
calculates a magnitude of zero indicating that the situation is proponionately fair bur
group 1 has acted in a negative manner and received a positive outcome while group 2 has
acted in a positive manner and received a negative outcome. This is not a fair situation
and a good proponionaiiry based faimess measure should not Say that it is. Thus.
proportiondity based faimess measures that sausfi the Fundamental Principle must
calculate a deviation from a proportional allocation for this data set. Of the six potenrial
proporiionalis, based fairness measures Adams Formula, Coulter Method, variation %1 of
the Coulter Method, and Hoover Concentration Index fail to satisfy the Fundamenta1
PrincipIe because these measures have a magnitude of zero when applied to the above
scenario. The Walster Formula and the Equal Excess Formula satisfy the Fundamental
Principle because these measures calculate deviations of 4 and 12, respecuvely for this
scenario of inputs and outcornes.
Thineen equaiity based measures found in Table 3.2 are evaluated with respect to
the Principle of Scale Invariance and Principle of Transiers by considering a scenario

W p c t r 3: DISTANCE BASED F a ' E S S MEASURES
where there are four groups that are affected by four impact distributions. Impact
Dismburions A-D. as shown in Columns 2-5 of Table 3.3. Impact Distribution A may be
thought of as an arbiuary initiai state. Impact Distribution B, shown in Coiumn 3 has a
magnitude that is exactly half that of Impact Distribution A. Equality based mesures that
satisfy the Principle of Scale Invariance wil1 calculate the same deviation from equaliry
for both Impact Distribution A and Impact Distribution B. Impact Distributions C and D.
shown in Columns 4 and 5, have the same mean as Impact Distribution A. but are
designed to represent a unit transfer from a better-off group to a worse-off group belou
the mean and above the mean, respectively.
Table 3.3: Impact Distributions Used to Evduate Equality Based Measures
Impact Distribution
Group A B C D
1 2.0 1 .O 3.0 2.0
2 8.0 4.0 7.0 7.0
3 6.0 3.0 6.0 7-0
4 4.0 2.0 4.0 4.0
The signifcance of cornparhg Impact Distributions A, C, and D is to detemine if a given
masure satisfies the P ~ c i p l e of Transfers which requires that a measure repon an
improvement if a unit amount of positive impact is transfened from a bettersff group to a
worse-off group. Thus, if a measure satisfks the Principle of Transfen it will calculate a
smaller deviation from equaiity for Impact Distributions C and D than for Impact

Chaprer 3: DISTANCE BASED F U R N E S MEASURES
Distribution A. The r d & of applying the thirteen equaiity bas& measures shown in
Table 3.2 to the impact distributions listed in Table 3.3 are shown in Table 3.4. Measures
that satisfy the Rinciple of Transfen for rhis data set are the Variance, Coefficient of
Variation, Sum of Absolute Deviations, variation $1 of the Sum of Absoiute Deviations,
Gini Coefficient, Range. and variation $1 of the Range because: for each of these
measures, the magnitudes in Columns 4 and 5 are less than the magnitude in Column 2 in
Table 3.4. Measures that sari* the Principie of Scale Invariance for this data set are the
Coefficient of Variation, Schutz Index. Gini Coefficient, and the Variance of Logarithms
because; for each of these measures, the magnitude in Cohmn 3 equals the magnitude in
Column 2 in Table 3.4. Of the thirteen equality based measures, only the Coefficient of
Variation measure and the Gini Coefficient saMy both the Principle of Transfers and die
Principle of Scale Invariance. It is interesting to note that the Variance of Logarithms
measure, when applied to Impact Distributions C and D, is the only measure ro report that
rransfers from the besc-off to the worst-off group will decrease faimess. A more detailed
examination of the sensitivity of the equaiity based measures to transfers may be
warranteci. Most of the magnitudes of the equafity measures for Impact Distributions C
and D, Iisted in Columns 4 and 5 are different from each other, possibly implying that
different meastres have different transfer sensitivities. and this may prove to be another
criterion for choosing an appropriate equality based faimess measure. Future
investigation into the evaluation of equaIity based measures for altemate distribution
magnitudes is recommended.

C ~ p r e r 3: DISTANCE BAS= FAIRNESS MEASCLES
Table 3.4 Resuits of Applying the Measures to the Exampie Impact Distributions
Equality Measure Magnitude for Impact Distribution
Mwure A B C D
Variance Measure 20.00 5.00 10.00 18.00
Coefficient of Variation 0.89 0.89 0-63 0.85
Mean Absolute Deviation Measure 8.00 4-00 6.00 8-00
Schutz Index 0.20 0.20 0.15 0.20
variation $1 of the Mean Absoiute 3-00 1.50 2.00 3.00 Deviarion Measure
Sum of Absolute Deviations Measure 40.00 20.00 28.00 36.00
Variation 81 of the Sum of Absolute 20.00 10.00 10.00 18 -00 Deviarions Measure
Variation $2 of the S m of Absolute 12.00 6.00 6.00 12.00 Deviations Measure
Gini Index 0.25 0.35 0.18 0-33
Range Measwe 6-00 3.00 4-00 5-00
Variation $1 of the Range Measure 6.00 3-00 4-00 5.00
Theil Entropy Coefficient 0.15 0. 12 0.13 O. 15
Variance of Logarithms Measure 0-05 0.05 0.45 O. 12
Based on the results of this chapter. appropriate proportionaiity based measures
are the Walster Fomuia and the Equai Excess Formula because these measures satisfy
impaniality, Consistency, Weighted Additive, and Fundamental Principles. The
Coefficient of Variation and the Gini Coefficient are appropriate equality based faimess
meanves because they satisfy the Impartialiry, Consistency. Weighted Additive.
Transfers, and Scale Invariance Principles. Six need based measures are deemed
Chaprer 3: DISTANCE BASED FAIRNESS MEASURES
appropriate at this point because these measures satisfy hnpaniaiity. Consistency, and
Weighted Additive Principles. As there are ccurrently no restrictions on need based
measures, potential need based measures may be al1 six measures presented in Table 3.1
when rewritten as to replace A with Z and Ah7 with Z(d. These measures are variations
of the Adams Formula, Walster Formula, Equal Excess Formula, Coulter Method.
variation $1 of the Coulrer Method, and Hoovers Concentration Index. It should be noted
that more work is required to funher develop pnnciples relating to distance based faimess
measures and the further evaluation of the appropriateness of these distance based
measures. As more principles are developed for proponionality, equaiity, and need based
measwes, some of the appropnate meastues presented here may appear inappropriate and
should be rejected Furthemore. the distance based rneasures found to be appropriate in
this work need to be evaluated in a more rigorous manner for other impact distributions
because the measufes may be inappropriate when evaluated for other impact distribution
magnitudes.

Chapter 4:
INTRATEMPORAL AND INTERTEMPORAL DISTRIBUTIVE FAIRNESS MEASURES
A discussion of the sustainability issues relevant to inuaremporal and
intertemporal faimess considerations is presented here. Following this discussion,
fonntdations are presented for intratemporal faimess. intertemporal faimess. and overall
fainiess. Using the acceptable distance meanires found in Chapter 3. it is suggested that
overall fairness is some weighted combination of appropriate proportionality, equaiig,
and need based measures. OveralI faimess measures are proposed here to be potenuai
distributive fainiess criteria for the purposes of sustainable project seleetion.
4.1 Temporal Considerations
FolloMng the Brundtland Commission's discussion of achieving sustainability
through sustainable development, the sustainability literanire generaliy makes reference
to h-generationd fairness and --generauonal faimess. m-generational faimess

refen to faimess within a generation while, inter-generational faimess, considers faimess
benveen generations. This literature raises three related questions namely. What is a
generation?, Who is making the comparisons?, and What is being cornpared? Regarding
the issue of defining a generation, the use of time steps instead of generations for such
cornparisons might be a more flexible approach because project related impacts are
project specific and rnay not have a duration that exceeds a generation or rnay exhibit
high variability within a generation. Cenerational comparisons would not accounr for
this variability and in such cases an annual time step rnay be more appropriate than a
generationd t h e step. In this rnanner, the notions of invatemporal faimess and
intertemporal faimess bas& on time seps are now introduced. Therefore, intra-
generational and inter-generational fairness comparisons are simply intratemporal and
intertempord faimess comparisons when the time step equals one generation. Based on
the simultaneous segments cornparison approach discussed by McKerIie (1989).
innatempord comparisons are proposed here to occur across ail groups dunng a given
time step. Intenemporal comparisons are proposed here to occur, for a given group,
across al1 t h e steps for which that group exists. Regarding the issue of what is being
compared, it appears logical to evduate the fairness of a project alternative based on the
different impacts. where impacts rnay be either benefiu or costs, that affect groups as a
resuit of implementing and operating this project alternative. These impacts may
originate during the construction and operational phases of a project's design life, rnay
persist after the project has been disrnantled, and rnay affect varying spatial scales. As
the sustainabiiity literature centers around discussions of social, economic, and ecological

impacts; it is proposed that sustainable project selection be concemed with these impact
types. Examples of social. economic. and ecological impacts are those that affect heaith
and safety, a region's contribution towards the gmss domestic product, and regional
biodiversity, respectively.
4.2 Operational Definitions of Distributive Fairness
Consider a situation in which there are a totàl of 1 groups where group i is
affected by some impact with a magnitude E6) that results from some action. In bis
situation, define A@ as the impact magnitude that group i feels it deserves and Z(i) as the
impact magnitude required to meet the needs of group i- As there are currentiy no
restrictions on need based measures, potentid need based measures may be au sir;
measures presented in Table 3.1 when rewrirten as to replace A wiîh Z and A@ with
Zfi). Appropriate measues as determined in Chapter 3 are given in equations 4.1-4.10
below. These equations are based on proponionaiity, equality. and need cornparison
noms. They are:

Where: an appropriate proportionaiity based cornparison approach
representing deviations from a proportional impact
allocation;

an appropriate equality based cornparison approach
representing deviations from an equal impact allocation;
a potential need based cornparison approach representing
appropriate equation based on deviations from an impact
allocation that satisfies the ne& of al1 groups:
number of groups being considered;
group indices:
impact magnitude acting on group i
impact magnitude that group i deserves. or group i's
conuibuUon towards receiving E N ;
amount of E(ii that group i requires to satis@ its needs;
average impact magnitude that acts upon the I groups
being considered;
average impact magnitude which the 1 groups need to meet
theu needs; and
average impact magnitude which the 1 groups deserve.
Equations 4.1-4.2 are appropriate proportionality bas& fairness measures as
determïned in Chapter 3 since these measures satisw the Impaniality , Consistency ,

Weighted Additive, and Fundamental Rincipies. Equations 4.1-4.2 are commonly
referred to as the Quai Excess Formula and Waister Formula Equations 4.3-4.4 are
appropriate equaiity based faimess measures as these measures satisfy Impaniality.
Consistency, Weighted Additive, Transfen, and Scale Invariance Principles. These
measures are commonly referred to as the Coefficient of Variation and the Gini
Coefficien~ The Gini Coefficient is commonly used by economists to meanire inequaiiry
and is presented in the form given in Marsh & Schilling (1994). Two group indices. i and
j, are required for equation 4.4 as the numerator of this ecpation is the sum of al1 possible
pair-wise cornparisons of impact magnitudes becween groups. The Gini Coefficient's
magnitude represents the decrease in faimess resulting from impacts that deviate from
being allocated equaiiy among al1 I groups. Equations 4.5-4. 10 presented as need based
fairness measures that may be appropriate and are the equations presented in Table 3.1
rewritten by replacing the variable that represents a group's input with a variable that
represents the amount of impact that a group needs. It should be noted thar other rnethods
of operauonaiizing a need comparison approach, such as a buiary expression of whether
or not a need is met, may be possible. Equations 4.1-4.10 have values that may increase
in magnitude from zero, where zero corresponds to complete fairness as defined by each
comparison approach
If equations 4.1-4.10 are to be used in the context of sustainable project selection.
the equations must be expanded to address four major concems. Fint, these measures are
not f o d a t e d in a way that accounts for the dimensions required for innatemporal and
intertemporal comparisons. Second, a project is likely to distribute many impacts among

gmups and a measure of fairness should account for this in some way. Third. equations
4.1-4.10 represent three different aspects of fairness evaluarions and a faimess measure
should incorporate ail of these approaches because. for example, nor al1 people evaluate
faimess by proportionaiity alone and may employ one or more comparison approaches in
assessing faimess. This rnay gain more significance when considering the extended
temporal horizons associated with intenemporal faimess evaluations. Finall y. as
evaluations of faimess are case specific. a measure should reflecc the variability in the
emphasis placed on the different comparison approaches by the groups who are affected
by a project
Consider a situarion in which there are X project alternatives, each distriburing G
different impact types ro I groups over T tirne sreps. Thus, each project alternative may
be thought of as having a G x 1 x 7 impact mauix. While it rnay be possible for each
project impact rnam to have different magnitudes for G, 1, and T, this work assumes. for
simpIicity, that each project alternative impact matrix is the same size. Therefore, the
ma& that represents the impact magnitude accming to group i, of impact type p. during
Ume step t, that resuits from projecr alternative x rnay be written as E(i,g9sx). For each
group, i, its contribution towards receiving a certain impact type, g, or the impact it
desemes, rnay Vary with time step r and is wrirten as A&g,r). Additionally, a group's
need for a panicular impact rnay also Vary with tirne and is written as Z6,gt). m i l e
equations 4.1-4.10 rnay dl be rewrinen for this generalized problem, only equations 4.1,
4.4, and 4.5 are expanded here aithough the remaining seven measures can be expanded
in a similar manner as discussed below.
Chupter 4: l i V l R A m O R A L AND INEUTEMPORAL RiSTRIBLTIVE FURNESS MUSURES
The expansion of appropriate measures into intratemporal faimess measures is
accompbhed for a given impact type. by applying an appropriate distance based faimess
measure across aii groups during a given time srep. The invatemporal faimess measure
magnilude nay be interpreted as how fairly, according to a given nom. a given impact at
a given time step is distnbuted among ail groups. However, this results in a intratemporal
faimess measure magnitude for each impact type and for each time step. The expansion
of appropnate measures into intertemporal faimess measures is accompIished for a given
group by applying a given appropriate measure across al1 tirne steps for which that group
exists. The intertemporal faimess measure magnitude may be interpreted as how fair1 y.
according to a given nom, a given impact for a given group is disvibuted over ùme
steps. This also resdts in a faimess meanire magnitude for each group and each impact
type. The different invatemporal and intertemporal faimess mesure magnitudes may be
reduced to a single number by employing a mathematical operator. The mathematical
operaton considered here are the average, weighted average, sum, maximum, and
minimum of the nom based fahess measwes. Distributive fairness measue magnitudes
corresponding to different impact types are suggested to be reduced to a single magnitude
by employing a weighted average operator because the distribuuve fairness of different
impacts may Vary in importance. For dismiutive fairness measure magnitudes that
correspond to different time steps, an average operator is suggested because, for a given
goup at a given tirne step, fahess at one t h e step shouid have the same weight as
faimess at another time step. Dismbutive faimess measure magnitudes corresponding to
different groups may be reduced to a single magnitude by employing an average operator

is suggested here because al1 groups are morally equal and should have the same w e i g h ~
The tomuiations for the invatemporal and intertempord faimess measures based on
equations 4.1, 4.4. and 4.5 are show below as equations 4.1 14-13 and 4.14-4.16. for
innatempord and intertemporal fairness measures. respectively. It should be noted that
other variations may be possible depending on the choice of the operator used with al1
combinations of equations 4.1-4.10.

Where: B, (x) - average intratemporai faimess measure which is the -
weighted sum of deviations from a proponional
impm allocation for al1 groups;
B, (XI - - average inuatemporal faimess measure which is the
weighted surn of deviations from an equal impact
allocation for al1 groups;
B, Cr) - - average inuatemporaf faimess measure which is the
weighted sum of deviations from an allocation that
meets the needs of al1 groups;
Bi (x) - - average intertemporal faimess measure which is the
weighted surn of deviations from a proponional
impact allocation for all groups; .
Bi (x) - - average intertempord fairness mesure which is the
weighted sum of deviations from an equal impact
allocation for al1 groups;
Bi (x) - - average htenemporal fairness measure which is the
weighted sum of deviations from an allocation that
meeu the needs of ail groups;

G , I , T , X = number of different impact types* number of
groups, number of time steps. and number of
project ai tematives, respective1 y;
- - indices for group, impact type. tirne s e p , and
alternative, respectively. such that l l g S G. I 5 i 5
I . l I t S T , a n d I I x I X
- - group and time indexes, respectively. that are
required for pair-wise cornparisons such chat O S j 5
l a n d 1 I s S T ;
C
= weights on impact typeg, such thar wb =l ; p=I
E&g, UI - - magnitude of impact typeg acting on goup i during
time step t that resulis from project alrernativex:
- - average impact defined over ail groups for a given
a combination of impact type, time step, and
1 alternative such ùiar Elp =-2 E (i,g,t ,X I ;
1 &=l
- - average impact defmed over ail Ume seps for a
given combination of group, impact type, and
alternative such that EjP = ' E (i,g, t ,x ) ; ,=l
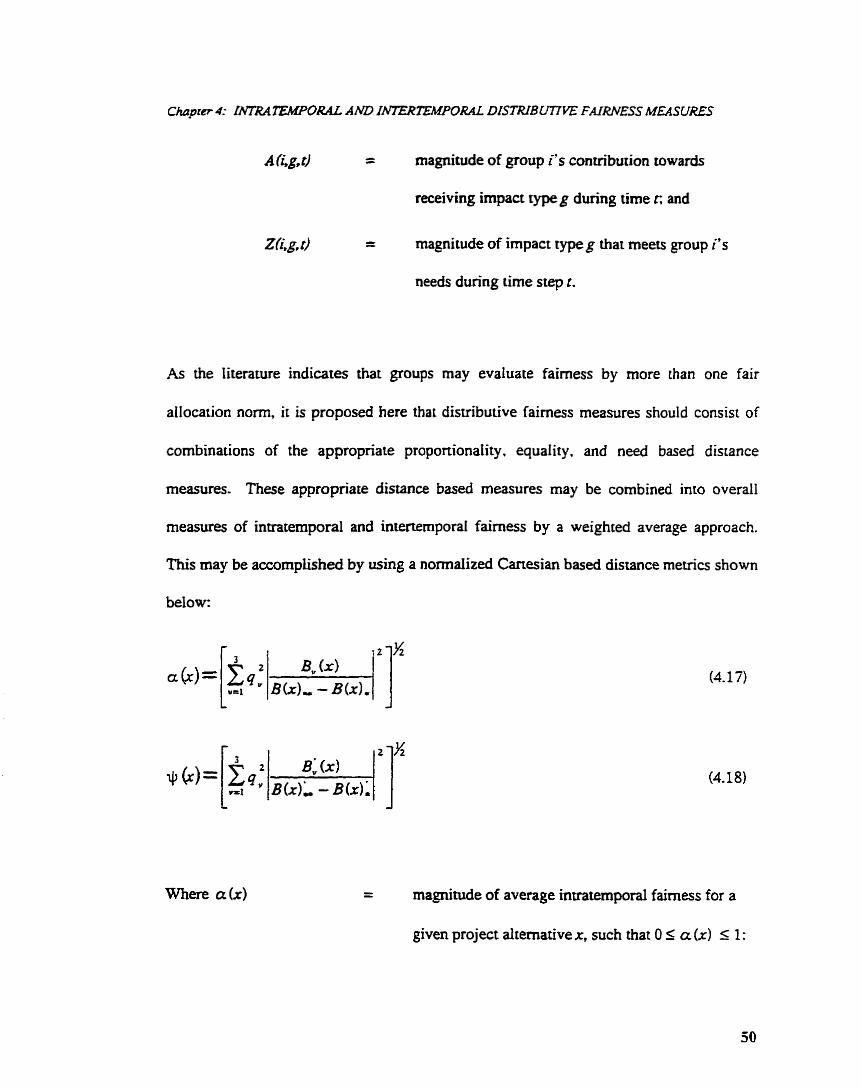
A Kg,?, - - magnitude of group i's contribution towards
receiving impact type g dunng time r; and
z(i,g* tl - - magnitude of impact typeg that meeü group i's
needs dunng tirne step r.
As the literarure indicates that groups may evaluate fairness by more than one fair
allocation nom, it is proposed here that distributive faimess measures should consist of
combinations of the appropnate proponionality. equality. and need based distance
measures. These appropriate distance based measures may be combined into overall
measures of intratemporal and intertemporal faimess by a weighted average approach.
This may be accomplished by using a normaiized Cartesian based distance mevics shown
below:
- - magnitude of average invatemporal faimess for a
given project alternative x, such that O S a (x ) S 1 :

- - magnitude of average intertemporal faimess for a
aven project dternativex, such that O L il, (x) 5 1:
- - index for different cornparison approaches. Le.,
based on different fair allocation noms:
- - weight atiached to cornparison approach v such that
- - magnitudes of the three intraternporal and three
intertemporal comparison approaches, respective1 y;
= minimum values of B and B b): across al1 v
given a project alternative x; and
B b), m d ~ k), = maximum values of B (.r)v and B (x): across al1 v
given a project alternative x.
Thus, distance-based measures that reflect proportionality, equality, and need fair
allocation objectives are expanded to account for comparisons bath within and between
Ume steps for more than one type of impact The expanded faimess measures are
fomiulated in thk work as averages of fairness comparisons across time steps. groups,
and different impact types. In equations (4.1 1-4-18) weights w, and q, are used ro
represent the relative importance of faimess considerations among different project-

related impacts and the relative importance placed on the three different fair allocation
objectives, respectively. These weights represent the affecteci group's preferences and
rnay be obtained, for example. by a social sunrey. According to Cohen (1978), the use of
predetemined weights is a simple way of incorporaring preferences into the decision
making process but assumes that weights remah constant regardless of the objective
functions' magnitudes and the wilIingness to <rade-off one objective for another is
independent of the magnitudes of the objective function values. This issue requires
further investigation. however, it should be noied that &e overall fairness rneasures
presented in equations (4.17418) rnay represent a social objective funcrion of the
affected groups and their views of intraternporal and intenemporal faimess. respecrively.
For these measures, uncertainty in faimess measurement rnay arise from
employhg a fairness mesure that relies on cornparison noms that do nor accurately
descnie the overaiI perception of dimibutive faimess for the system being managed.
Uncertainty rnay also result fiom unknown values for the weights that reflect the relative
importance of each type of cornparison approach. Another type of uncenainry rnay anse
due to prediction erron, e.g., erroa in the predicuons of the impact esrimares over time.
Impacts rnay increase, decrease, remain constant, or be some combination of these
trajectories over time and the number of impacts that affect each group rnay increase,
decrease, or remain constant over tirne. The uncenainty introduced by considering an
increased temporal horizon rnay be so great that a fairness analysis rnay be untenable.
Clearly, addirional investigation of uncertainty reduction for the distributive faines
measures are needed.
Chopter 5: CASE STU' Y
Chapter 5:
CASE STUDY
The North Central Electricity Supply Project case suidy is discussed here and the
overall disuibutive faimess measures, presented as equations 4.1 1-4-18, are then applied
ro the esrimateci impacts of annual average cost per megawatt-hour of energy accming to
consumer types in different communities that results from implementing an energy supply
alternative- Annual average energy cost per megawatt-hour of energy, in 1993 Canadian
dollars, is hereafter referred to as the unit energy cost The faimess of unit energy cost
disPi'butÏons are exarnined in order to discuss the applicability of the intratemporal and
intertemporal fairness measures rather than the selection of a given project alremauve.
The resdts are discussed and observations about the faimess measures are given.
5.1 Background
The generaIized faimess measmes presented in equations 4.17-4.18 are applied in
this section to a case study, known as the North Central Project, that involves selecting
amng taro different power supply technologies for seven remote communities located in
Ckprer 5: CASE STOD Y
northern Canada's Boreal forest approximately 560 km northeast of Winnipeg, Manitoba.
The power supply alternatives being considered to satisfy a fony-year load forecast
between 1997 and 2037 are either dispersed diesel generation or a land line connection to
Manitoba Hydro's centrai power grid. The remote communities of Oxford House. GO&
Lake, Gods River, Red Sucker Lake, Garden HiII, Wasagamack, and St Theresa Point
cwentiy have electncity supplied by diesel generators in each community. The
nonremote communities of Nelson House, Cross Lake. and Spiit Lake are supplied by a
Iand line comection to Manitoba Hydro's centrai system. fiese nonremote communities
are used as reference communities for faimess cornparisons because these communities
are in the vicinity of, and have similar demographic characteristics to, the remote
communities. Other communities, such as Thompson, Manitoba, may also be used as
reference comrnunities for ihis system but data for these communities were not available
for this anal y sis. While Manitoba Hydro (1 993) considered other power generat ion
methods such as smaU scale hydrû, centra1 biomass, and dispersed biornass. these
alternatives were found to be uneconornicd compared to the construction of a
transmission line connection to the centrd power grid. The proposed transmission Iine
r o u h g is shown in Figure 5.1-
The two energy supply alternatives are thus to continue supplying energy to the
remote communities with a dispersed diesei technology or to abandon the existing
technoiogy and supply energy via a transmission line comection to the provincial
elecûical grid. The frst alternative would require the addition of diesel generating units
to each remote community over urne in order to meet the forecasted peak loads. As

shown in Figure 5.1, the second alternative, a uanmiission Iine originaring at the Kelsey
Gmeraling Station would connect Oxford House, Gods Lake, Gods River. Red Sucker
Lake. Wasagamack, Garden Hi11 , and St Theresa Point to the provincial power grid.
Mg. 5.1 Viciniw map of the remote communities
Choper 5: CASE STUD Y
5.2 Generation of Annuai Costs of Consumers
Within each community there are residentiaI consumers and nonresidential
consumes who pay for energy. Residential consumers consist of the people who Iive in
each community and nonresidential consumen consist of both govemment and
commercial facilities within the communities. Ideally. one would want to examine
residential, commercial, and govemment consumers separarely but energy dernand data
obtained from Manitoba Hydro (Knstjanson. 1996) were only available for residential and
nonresidential aggregarions. As the diesel alternative may result in a higher energy cost to
connimers due to higher operating cos= than the land line alternative, each alternative
rnay be seen to result in different economic impacts among consumers. Other impacts are
Likely, such as paniculate emissions associated with the diesel alternative, but are not
considered here due to a lack of monitoring information for these faciliries.
environmental impact statement for the land line al ternative (Manitoba Hydro & Epstein
Associates, 1993) is avaiiable but an environmental impact statement for the diesel
alternative is not avaiiable. The approach taken in this work, therefore, is to examine unir
energy costs accruing to a given consumer goup in a given community between 1997 and
2037 which remit from implementing a project alternative. This impact may be a
function of Manitoba Hydro's rate charges and the energy demands of a particular
consumer group in a given community.
Historical rate data (Harms, 1996) are available for a twelve year penod from 1985
to 1997. These data are contained in AppendDr A for Manitoba Hydro's Rate Zone 2 and
Rate Zone 3 as Tables Al , A4, and Ai , A10, A13, A14, respectively. A rate zone is an

Chpter 5: CASE STUD Y
area where Manitoba Hydro charges unifonn energy rates for energy consumed to a given
type of energy consumer. For example, consumers residing in Winnipeg. a nonremore
community with a centrai systern energy supply. or a remote community with dispened
diesel supply woufd be charged for the energy they consume at Zone 1. 2. or 3 rates.
respectively. Manitoba Hydm's energy rates. which include both a fixed cost and variable
costs, are a function of the rate zone, consumer type, and energy consumed in a month.
In estirnaring the distribution of energy costs aaoss consumer groups and across
tirne. three main assumptions about the variability of consumer energy rates over time
steps. the consumer energy rates that may result from implementing a project alternative.
and the classification of nonresidential consumers in each community are made.
Consumer energy rates for a given consumer type in a given rate zone are assurned ro
remain constant over tirne steps because rate data by which to estimate these are only
available for a twelve year period of record for Rate Zone 2 and five year period of record
for Rate Zone 3. These data are considered insufficient to obtain rneaningful estimates of
energy rate variabiIity over the fony-year forecast period examined here. Consumer
energy rates for nonremote communities are assumed to be fixed at Zone 2 energy rates
regardess of the project alternative implemenred because these communities are not
affected by either project alternative. Remote cornmunities currentiy pay Zone 3 rates
because these communities currently have a power supply provided by dispersed diesel
generation. If the dispened diesel alternative is irnplemented the remote communities are
assumeci ro remain paying Zone 3 energy rates. If the land line alternative is chosen, the
remote communities are assumed to pay Zone 2 rates. Energy rates distinguish arnong

Chaper 5- CASE STUDY
different types of energy consumers in a given rate zone but the rates for nonresidential
consumer classifications in Zones 2 and 3 do not correspond Thus. the assurnption is
made that nomsidentid consumers in the nonremote commwii~ia are charged ai small
nondemand commercial Zone 2 rates. In the remote cornmuniries. the assumption is made
that nonresidential consumers are charged at a weighted average of boih full cost
commercial and full cost governmenr rates. Variations in weight afforded to full cost
commercial and full cost govemmeni demand are Iisted in Table A20 given in Appendix
A. The results show that weighted average remote nonresidential rates are very sensitive
to the weighting used As data on the composition of nonresidential demand were not
made avaiiable by Manitoba Hydro. il was assumed that future remote nonresidential
energy demands are fured at 70 percent fuU cost commercial and 30 percent full cost
govenunent rares-
Monthly rate data obüiuied from Manitoba are used to develop annual energy cosr
fimcxiow as a function of residential and nonresidential consumer's energy demands when
subject to Zone 2 and Zone 3 rates. Annual energy cost functions are Iinear and composed
of a f i e d annual cost and one or more variable cosrs. The variabie costs are a function of
the energy demanded by a consumer in a given year. The fured cost and variable cost
coeffkients for the cost functions were obtained by taking the average of historical fixed
and variable costs, converted to 1993 Canadian dollars, over the penod of record. These
calcdations, based on a six percent discount rate, are given as Tabies Al-A14 in
Appendix A. As shown in Tabies A15-A19, energy cost function coefficients were
calcuiated with three different annual discount rates of 4, 6, and 8 percent and are not very

sensitive to the diswunt rates examineci. Thus. a 6 percent discount rate was used in this
work. Rate Zone 2 and 3 energy cost functions for residemial and nontesidenrial
consumers are:
Where: C: - average energy cost in 1993$ CDN for a residenùal -
consumer in Rate Zone 2;
CL - - average energy cost in 1993% CDN/year for a
nonresidential consumer in Rate Zone 3;
CZ - - average energy cost in 19939 CDN/year for a
residential consumer in Rate Zone 3;
CL - - average energy cost in 1993% CDN/year for a
nonresidential consumer in Rate Zone 3;
- - annual residential demand in Rate Zone 2 for ihe
fmt energy block, such that O 5 4 5 2.îMWh/year;

- - annuai residential demand in Rate Zone 2 for the
second energy block, such that 2 . l l D, MWh/year;
- - annual nonresidentia1 demand in Rate Zone 2 for the
first energy block such that O d D, S 13 MWhiyear:
- - annual nonresidential demand in the second energ
block in Raie Zone 2. such that 13 I D, S 85
MW h/y ear;
- - annual nonresidential demand in the third energy
biock in Rate Zone 2, such that 85 S D, MWMyear;
- - annual residentid demand in Rate Zone 3 for the
first energy block such that O 5 D, 5 21 MWh/year;
- - annuai residentid demand in the second energy
block in Rate Zone 3. such that î i S D, MwMyear;
and
- - annuai nonresidential demand in the first energy
block in Rate Zone 3, such that O I D, MPCrhlyear.
In equations 5.1-5.4 an energy block is a portion of a consumer's annual energy demand
that is charged a given rate by Manitoba Hydro. Thus, for equation 5.1, annual residential
demand in Rate Zone 2, 5, is composed of demand blocks D, and D,.

CtrPpter 5: CASE STUD Y
Historid demand data for residential and nonresidential consumers in remote and
nonremote communities was obtained fiom Manitoba Hydro for a 23 year period of record
from 1973 to 1996 (Kristjanson. 1996). These data, for nonremote and remore
communities, are included in Appendix B as Tables B 1,B4, B7. and B10, B13. B 16. B 19.
BU, BZ5, B28, respectiveiy. Two main assumptions involved in the estimation of annual
energy demands are that if the land Iine alternative is implemented the remote
communities will exhibit a demand gmwth similar to that of histoncal nonremote
community demands and, that residential demand in the nonremote communities exhibits
parabolic, rather than a linear growth, in annual energy demand per meter.
Estimates of annual energy demands for residential and nonraidentid consumen
in the different communities over the period of 1997 to 2037 are obtained as follows. For
each consumer type in each community, both annual residentiai demand and annual
nonresidential demand per meter are calculated based on historical data available fiom
1913 to 1996. Scatter plots of the historical energy demand per meter are given in
Appendix B in Figures BLB6. Figures BLB6 reveai that annual energy demands rend to
increase non-monotonically in a somewhat piece-wise linear fashion. A generalized
polynomiai function shown as equation 5.5 that may represent annual energy dernand per
meter was used to frnd annual demand funciions for residential and nonresidentiai
consumers in the remote and nonremote comrnunities.

Cirap~er 5: CASE STUDY
- - annuai average demand per meter for a
consumer type in a given community;
- - parameters specific to a consumer type and
community that define the polynomial: and
- - the cument tirne sep.
This was accomplished, for a given consumer type in a given community, by solvinp for
the a, 6, and c parameters in equation 5.5 such that, the sum of squared deviaiions
between demand function values and historical values was minimized, It shouId be noted
that bener parameters may be possible as there are many varieUes of possible functions.
The best fit calcuiations using equation 5.5 to histoncd energy demand data are given in
Appendùr B for nonremote and remote communiries, in Tables B2, B3, B5, B6, B8. B9.
and BU, B12, B14, Bl5, BI?, B18, B20, B21, BU, B24, B26, BZi. B29. B30.
respectiveiy .
Best fit parameters detennined for equation 5.3 for both consumer types in al1
cornmunities are used to generate annual energy demand estimates over a fony-year
period from 1997 to 2037 for each project alternative. As nonremote comrnunity energy
demands are not affected by alternative selection, energy demand function parameters for
Nelson House, Cross Lake, and Split Lake remain the same for both project alternatives.
Annual energy demands for a given consumer type in the remote communiries are
expected to change if the land line alternative is implemented and thus so should the
demand function parameters. As demand function parameters based on the best fit to
historical data for nonremore communities have sirnilar magnitudes ro each other. the
approach raken is to use the average of the nonremote communities best fit energg
demand parameters over the 19734996 period for a11 remote communities for the land
Iine alternative. This implies that for the land line alternative, the remote communities
will exhibit similar demand growth between 1997 and 2037 to thac of nonremote
communities beoveen 1973 and 1996. Cross Lake, Splii Lake, and Nelson House were
provided with a land line based energy supply betw&n 1972-1973 (Miles. 1996).
Demand iunction parameten for each consumer type in each cornmunity that correspond
to the diesel and iand line alternatives are given in Appendix B in Tables B3LB32,
respective1 y.
For each consumer type in each community, annual energy cosu in 1993 dollars
that remit from impiementing a project alternative are esthated using equations 51 -55
from 1997 to 2037, and are given in Appendix C in Tables C5C38. On an annual basis,
unit energy costs for a given consumer type in a given cornmunity, are calculated by
dividhg annual energy costs by annual energy demands. These unit energy cosrs are
surnmarîzed in Tables Cl-C4. Due to space limitations, the estimates of annual unit
energy costs are listed in Tables 5.1 and 5.2 for residential consumers and nonresidential
cunsumers, respectively, for the years of 1997, 2017. and 2037. There is a full iisting of
these data in Tables W C 4 in Appendut C. As Table 5.1 shows, bot . residential and
nonresidentid consumers in the nonremote communities of Cross Lake. Nelson House.
and Split Lake are not affected by the project alternatives. Therefore. the annual average

Chaprer 5: CASE SïüDY
unit energy costs for these cornmunities in any year rernain conswt over aii alrematives.
Aiso shown in Table 5.1. for a given community in a given year, is a slight decrease in
annuai average energy costs for residential consumers in the seven remote comrnunities
when the land line alternative is implemented in 1997. This may be a resuli of an annual
average increase in demand per residential merer after a community switches to a land line
power nipply since Manitoba Hydro ' s land line residential rate structure reflects
decreasing marginal costs to the consumer. A significant decrease in annual average
energy cos= for nonresidenrial consumers under the land line aitemacive is shown in
Table 5.2 for a given remote community in a given year. This occurs due to the decrease
in nonresidenüal rates to the level of nonresidential rates experienced by the nonremote
cornmuniries already connected to a land Iine based power supply.

Table 5.1 Average Energy Costs (19935 CDNMWhlrneter) for a Residential Consumer
Diiersed D i d Land Une
Community 1997 2017 2037 1997 2017 2037
52.21 51.42 52.52 Cross Lake
Nelson House
Split Lake
Oxford House
Gods Lake
Gods River
Red Sucker Lake
Garden Hill
SL Theresa Point
Wasagamack

Ctiaprer 5: CASE Sm, Y
Table 5.2 Average Energy Costs (1993SCDN/MWh/merer) for a Nonresidential Consumer
Disperscd Diesel Land Line
Community 1997 2017 2037 1997 2017 2037
Cross Lake 45.69 43.82 43.04 45.69
NeIson House
Split Lake
Oxford House
Gods Lake
Gods River
Red Sucker Lake
Garden Hill
SL Theresa Point
Wasagamack

5.3 AppIication of Distributive Fauness Measures and Discussion
The overall faimess mesures presented in equations 4.17-4.18 are applied to this
case study for an annual time step berareen 1997 and 2037. When considering
intratemporal faimess as defined in equation 4.17, a given energy consumer evaluates
faimess based on cornparïng unit energy cosu that customers of the same type pay in the
other nine communities during a given year. When considering intenemporal faimess as
defined in equarion 4.18, an energy consumer in a community evaluates faimess based on
cornparhg annual unit energy costs that act on that consumer, in a given communiry
during a given year, with the average annual energy costs for the same type of consumer
in the same community over the remaining 39 years. Of the proponionality, equality. and
need based cornparison approaches considered in this work, the equaIity approach is
judged to be the most applicabie for both intratempord faimess and intertemporal faimess
cornparisons in this case study because the quantification of each group's input and need
requires further examinauon. Proponionality and need may be important considerations
for other impact distributions associated with this case study. The approach taken here is
to apply the generaiized dismbutive faimess measlues to the residential consumers and
the nonresidential consumers separately. Therefore, equations 4.1 M.16 are calculated by
setting 1, the number of groups, equal to 10; T, the number of time steps, equal to 40; and
G, the number of different impact types, equal to 1. Detailed results of the dimibutive
faïrness evaluations may be found in AppendU D. In this chapter, the E n g , ~ ) are the
annuai average unit energy costs in 1993s CDN/MWh/meter and are contained in Tables
5.1 and 5.2. Equations 4.17-4.18 are then applied by using the weight of uniry for q, and

the residentiai and nonresidenual data show in Tables 5.1-5.2. respectively . The results
of this application are shown in Table 5.3 and are also given in deuil in AppendU; D as
Tables DLD9. The intratemponl faimess measure, am, indicates that fairness rnay
increase. regarding the distribution of unit energy costs for both the residential and
nonresidential consumen. if the land line altemarive is selected because the average
annual unit energy costs will be more equal to that expenenced by the nonremote
communities if the land line alternative is selected The intertemporal fairness rneasure.
y@, does not indicate a difference among project altemat&s as the average annual unit
energy costs. for a given consumer group, remain fairly constant over rime. The greatest
innatemporai faimess increase associated with swirching from dispened diesel supply to a
land line suppiy would be experienced by nonresidential consumers who appear worse-off
under the existing dispersed diesel energy suppiy. This can be seen in Table 5.3 by
comparing the fairness measure magnitudes of 0.26 and 0.02 for the dispened diesel and
land line alternatives, respectively. Of course. other types of impacts, such as impacts to
health and safety may show a greater difference between aitematives for faimess
considerations. The analysis of average annual energy cosu per megawan-hour is only
one of a number of different impacts associated with each project altenative and thus
represents a partial perspective of the perceived faimess present in this system. As data
on these and otber impacts such as environmental changes and reliability of power supply
becorne available, for each altemative, M e r cornparisons should be made before the
analyst could advise the decision maker.

Ciraprer 5: CASE STUDY
Table 5.3: Inaatemporal and Intertemporai Faimess Measure Magnitudes
a fxl JlW IntratemporaI Intertempord
Fairness Measure Faimess Measure
Alternative Residential Non Residential Non
res ident iaI residen tial
Dispened diesel 0.08 0.26 0.0 1 0.01
Land iine 0.0 1 0.02 0.0 1 0.01

Chapter 6:
SUMMARY, CONCLUSIONS, AND RECOMMENDATIONS
6.1 Summary and Conclusions
Sustainable development, project selection, fair allocation objectives. empincal
distance based faimess measures and their evaluation, and the application of these
measures to real problems, are reviewed in this work. While distance based faimess
measures have been appiied in the Iiterature, a consensus as to the appropriate measures
and principles associated with these rneasures was not found. The nom based and
normative approaches are two broad approaches to distance based faimess meaniremenr
While the nom based approach appears to be the easiest to apply in conjuncüon wirh
distance based meames, this approach is not yet fuify developed
Based on proponionality, equality, and need fair allocation noms, Chapter 3 of
this work classifies twenty cornmonly applied distance based fairness measures as either
potentid proportionality, equaiiq, and need based faimess measures. A number of
principles found in the literature are discussed and then categorized as principles
associated with either fairness, proportionality, equaiity, or need based fair allocation

noms. finciples associated with faimess are ImpartiaIity. Consistency, and Weighted
Additive Pruiciples. The Fundamental Principle is associated with a proportionality
norm. The Transfers and Scale Invariance Principies are associated with an equality
norm. As no meanires of need nor pnnciples associated with need are given in the
literature, variations of proponionality based faimess measures are suggested as initial
need based faimess measures. The potential measures are then evaluated with respect to
how weli each measure satisfies the faimess principles and the pnncipIes associated with
the nom which that measure embodies. Appropriate proportionaiity based meanires are
Wasten Formuta and the Equal Excess Formula because these measures satisfy the
hpaniaiïty, Consistency, Weighted Additive. and Fundamental Principles. The Relative
Mean Deviation Measure and the Gini Coeffkient are appropriate equaIity based
measures because these measures satisfy the Impartiality, Consistency, Weighted
Additive, Transfers, and Scale Invariance finciples. Six potential need based rneasures
are proposed at this point because these measures satisQ the Impartidisr. Consistency.
and Weighted Additive Principies. These potential need based measures, which are
variations of common proportionality based measures such as Walsters and Adams
Formulae, must be further evaiuated as additionai evaiuation criteria become auailable-
These appropriate distance based faimess measures are recornmended for expansion to be
compatible with sustainable project selection.
Faimess considerations in sustainable project selection requires mesures that
incorporate intratemporal and intertemporal cornparisons and have an ability to be applied
in a project selection conrext for multiple impacts which affect muitiple groups of

Ciuzprer 6: SUMMARX CONCLUSIONS. AND RECOMMENDA TIONS
similarly siarateci individuals. Additionally. distributive faimess measures shouId
incorporate more than one fair allocation nom. such as equality. as the literature indicates
that people judge the fairness of a distributive situation by one or more of the fair
allocation n o m . The nom based measures are extended to address a generic situation
for inuatemporal cornparïsons. intertemporal comparisons, and multiple impact types.
These extended nom based fairness measures are then combined into overai1
intratemporal and overali intertemporal fairness measures at the end of Chapter 4 in this
work. These overall fairness measures incorporate three common perceptions of fair
allocation by employing a weighted average of the extended proportionaliry, equality. and
needs based faimess measures. These overall faimess measures may be a more flexible
approach to meswing distributive faimess in different w e s and over iong rime horizons.
It should be mentioned that the o v e d faimess measures deveioped in this work are a
mathematical abstraction of a social system and shouId not be considered as being precise
meawes of faimess. The overall faimess meanires may serve as a starting point from
which more refined faimess measures for sustainable project seiection may be developed.
Unce-ty may be introduced from a number of sources. for example, in employing
faîmess rneasures that rely on cornparison noms that do not accurately descnbe the
overall perception of distributive faimess for the system being manage& Unceminry
reduction in dism%utive fairness measUrexnent is seen as an important issue that must be
addressed in future work The overail dismiutive faimess measrues presented in this
work are, to this author's knowledge, an original conaibution to the topic of susminable
project selection. The overall disnibutive measures rnay also be interpreted as

Chaprer 6: SUMURY. CONCLUSIONS, AND RECOMMElVDATIONS
innatemporal and inwtemporal social objective funcrions that are defined by the weights
employed with each measure. Additionaily. the fornidation of ihese meantres may serve
to guide data collection efforts for the purposes of faimess evaluation for sustainable
project selection.
in Chapter 5. the overalI distributive faimess rneasures are applied to a case smdy
that requires the analyst CO choose between either a dispersai diesel generation or fand
Iine based comection to a central power grid in order to meet energy demands over a
forty-year horizon. The faimess measures are applied co aMua~ average energy costs per
megawatt-hour, or unit energy costs. accruing to residential and nonresidential energy
consumers in ten communities as a result of implementing a project alternative- The
dismbuave fairness criteria formdated for this case study are based on an equaiity
cornparison approach. As more work is requued for further development of
proportionality and need based faimess measures. the application of these measues to this
case snidy was not accomplished. Innatemporal faimess conceming the distribution of
average annual unit energy costs, paniculariy for the noruesidentid energy consurners.
may be increased by choosing the land Iine alternative. While other approaches to
defining a fair allocation and other interpretations of faimess are possible, the measures
presented here provide conclusions that are reasonable and they may offer a greater
insight into fainiess evaluations for sustainable project selecrion. The dismautive fakness
measures presented in this work are considered to be useful as criteria for sustainable
project selection and may also be useful for other applications in civil engineering. For
example, the disaibutive faimess measures might be modified and used to develop

reservoir operating strategis that distribute reservoir related impacts in some fair manner.
The main limitation in applying this appmach is seen to be the estimation of the impact
distributions that result from each project alternative and the weights chat indicate the
avaerage of affected group's preferences. Impact assessrnent and impact valuation.
panicularly for impacts over long time horizons are daunring tasks and rernain to be
addressed. Civil engineering projects. particulariy the provision of public services may
affect a iarge nurnber of people, thus faimess considerations may be important ro the
analyst who advises the decision maker.
6.2 Recommendatious
Further investigation into other faimess measurernent approaches for sustainable
project sefection, a further refmement of the faimess measures presented here.
investigation of the effects and accommodation of uncertainty. and the further
examination of this and other case studies are recornrnended, Research efforts could be
directed at investigating the relevance of proportionality and need allocation approaches
in project selection and identifying the factors that influence the relative imponance
placed on different cornparison approaches by groups. Additional desirable principles
associateci with intratemporal and intertemporai measues of proportionaiity, equaiity, and
need may exist and this issue shouid be investigated in more detail. Much work remains
in defining and measuring ne&. The appropriate nom based measures should also be
evaluated for different impact distribution magnitudes as these meanires may be

inappropriate. Funher research may be directeci at the interpretation of the overall
distributive faimess measwes. Moreover, efforts toward reducing associated
measurernent, weighting, and impact prediction uncertainties need to be undenaken and
ultimately these approaches for measuring faimess need to be vaiidated.

Refer ences :
Abed y. D. (Ed.) . Fumres by Design: nte Pracrice of Ecological Planning, New Society
Publishers, Gabriola IsIand, Canada, 1991.
Adams, J., Toward and onderstanding of inequity, Journu2 of Abnoml and Social
Psych~logy, 676). 422-436, 1963.
Alker, H. and B. Russett, On measuring inequality, Behavioral Science, 9,207-218,
1964.
AUison, P., Mesures of inequality, Arnen-can Sociological Review, 43, 865-880, 1978.
Almond, B., Right~ and justice in the environment debare, Appears in Just environ men^
Iktergenerarional, In~ernatiowI; and Intempecies issues, eds. D. Cooper & J.
Palmer, Routledge, New York, USA, 1995.
Arthur, J. & W. Shaw, Jwtice and Economic Distribution, Prentice-Hall Inc., New
Jersey. USA? 1978.
Atkinson, A., On the meanirement of inequality, Journal of Economic Theor-y, 2,244-
263,1970.

Beluatti, A.. htergenerational equity and environrnenral preservauon. Ener , ,
Environmen& and Economic Growrh, 42.95. University of Tonno and
Fondazione, Milan, Italy, 1995.
Blaiock. H., Undemfarzding Social lnequaiity: Modeiing AIIocarion Processes. Sage
Pubiications. London, UK, 199 1 .
Bogardi. J. and H. Nachmebel (eds) , Multicrirera Decision Analysis in Wa~er Resources
Mmagemenr. UNESCO, Paris. France. 1994.
Btïii. E., Econornic Effrciency and Equity in Warer Quaiip Mmagemenr, Phd.
Dissertation. The Johns Hopkins University. Baltimore, Maryland, USA, 1972.
Champemowne, D.. A cornparison of measures of inequdity of incorne disuibution,
The Economic Journal, 84,787-816, 1974.
Cohen, J., Multiobjective Programmiirg ond Planning, Academic Press, New York. USA.
1978.
Cook, K. & T. Yamagishi, Social determinans of equity judgrnenu: the problem of
multidimensional input, Appears in Equip Theory, Eds. D. Messick & K. Cook,
Praeger Publishers, New York, USA, 95425,1983-
Dalton, H., The measurement of the inequaiity of incorn- The Economic J o m l , 30,
348-36 1, 1920.
Deutsch. M., Equity, equality, and need: What detemines which value wiU be used as the
basis of dismiutive justice. J o d of Socirrl Issues, 31 (3), 137- 149,1975.

Dovers, S. & J. Hancimer, Contradictions in sustainabiiity , Envimnmenuzi Commazion.
20(3), 217-t22,1993.
Erickmn, P., A Practr'cal Guide To Envitonmental Impact Rssessmenr. Academic Press.
Boston, USA, 1994.
Erkut, E.. hequtliity Meosw-es for Location Problems. Research Report 91-2 for the
Department of Finance and Management Science, University of Alberta.
Edmonton, Canada, 1992.
H m s , L.. Penonal communication. Manitoba Hydro. Winnipeg, Canada. 1996.
Hams, R., Pinning down the equity fornula. Appean in Equiy meos>, Eds. by D.
Messick & K. Cook, 207-241. Prager Publishen, New York, USA, 1983.
Holdren, J., C. Gretchen, C. Daily, & P. Ehrlich, The meaning of sustainabiliry:
biogeophysical aspects, Appean in Defning and Mearuring SusuzinabiIity: me
Biogeophysical Fomdations, Eds. M. Munasinghe & W. Shearer, The United
Nations and the World Bank, Washington. USA, 347,1995.
Koim, S., Unequal inequaiities 1, Joumal of Economic ?ïieor-y, 12,416-442, 1956.
KNtjanson, R, Personal communication, Manitoba Hydro, Winnipeg, Canada, 1996.
Lele, S., Sustainable development: A critical review, World Developmenr, 1 P(6), 607-
621,1991.
McAiiister, D ., Equity and efficiency in public facility location, GeogmphicaZ Anoiysis,
8,4'7-63,1976,

McKerlie. D.. Equaiiry and time, Ethim. 99,475-491, 1989.
Mandell. M., Modeiing effectiveness-equity tradeoffs in public service delivery
systems, Managemenr Science, 37(4). 467-482, 199 1.
Manitoba Hydro Corporation, Review o/hrorfh Central Oprions, A Generation Planning
Technical Memorandum. 93/7. Winnipeg. Canada. 1993.
Manitoba Hydro Corporation & Epstein Associates Inc., North Cenwal Projecr
Roure/Sire Selecrion and Environmental Assasment, 1-4, Winnipeg, Canada.
1993-
Manh, M. & D. Schilling. Equity measurement in facility location analysis: A review
and frarnework, Eurogean Jouninl of Operatiomi Reseurch, 74.1 - 17, t 994.
Matheson, S., B. Lence, and J. Fürst, Distributive faimess considerations in sustainable
project seiection. Submitted to the Hydrologie Sciences Jownal, 1997.
Mayhew, L. & G. Leonardi. Equity, efficiency, and accessibiliry in urban and regional
health care systerns, Environment and Planning A, 14.1479-1507,1982.
Messick, D. & K. Cook (Eds.) , Equity Theory, Raeger Publisbers, New York, USA,
1983.
Miles. A., Personal communication, Manitoba Hydro, Winnipeg, Canada, 1996.
Mill, J. (1 86 1) Utilitarianism, In UiiIitar+anism and Other Essays, ed. A. Ryan, Penguin
Press, London, UK, 1987.
Motira T. Y. Kawahima. & 1. Inohara. Sustainable development - Its definitions and
goals. Mit0 JoumaI o/Economics. 8'(4), 1993.
Mulligan, G.. Equality measures and faciiity location Papen in R e g i o ~ l Science: 7Xe
Journal of The Regionul Science Association International. ïO(4), 345-365,
1991.
Munasinghe, M. g: J. McNeeIy. Key concepts and rerminology of sustainable
deveiopment, Appears in Defining and Measuring SusminabiiiLy: The
Biogeophysicd Foundations. Eds. M. Munasinghe & W. S hearer, The United
Nations and the World Bank. Washington. USA. 19-56. 1995.
Munasinghe. M. & W. Shearer (Eds.) . Definhg and Measunng Smainability: The
Biogeophysical Foundations, The United Nations and The Worid Bank:
Washington. USA, 1993.
Nachmebel, H., G. Eder, & 1. Bogardi. Evaluation of criteria in hydropower utiiization in
the context of susminable developmenf In Proceedings of the IntenzdonoZ
W S C O Symposiwn: Water Resomes Plunning in a Changing WorId,
Karlsnrhey Gemiany, 13-24,1994.
Nozick, R., Anarchy, State, and Utopîa, Basic Books, New York, USA, 1974.
Pigou, AC., Wealth und WeIf'ie, MacMillan Press, London, UK, 1912.
Rawls. J.. A Theor-y of Justice. Harvard University Press, Cambridge, UK, 197 1.

Sampath, R.. A rawisian evaluation of imgation distribution in India. Worer Resources
Bulletin, 27,745-751.199 1.
Savas. E., On equity in providing public services, Management Science, 24(8). 800-
808,1978.
Simonovic, S.. B. Lence, & D. Bum, Sustainability criteria: An application to the
hydropower industry. Proceedings of the ASCE 22nd Annual Conference O/ Warer
Resources P Ionning and Mt2~gemen~ntegmted Watef Resources Planning for
the 221st Cennuy, ed. M. Domenica, 173-1 76, 1995.
Temkin, L.. Inqualiy . Oxford University Press. New York. USA, 1993.
Thomson. J., uans., The Ethics of ANrotZe: Nicornachean Ethics, Hamondsworth,
MiddIesex. Pen@ Books, UK, 1985.
United Nations Department of Technical Co-opemuon for Development, Assesment of
Multiple Objective Water Resource Projectri A p a c h e s for Developing
Cowimks, United Nations Press, New York, USA, 1988.
World Commission on Environment and Development (WCED), Our Cornmon Future.
Oxford University Press, London, UK, 1987.
Young. H., Equig: In Theory and Practice, Princeton University Press. New Jersey,
USA, 1994.
Young, U. Sutuinable Invertment and Resource Use: EquipJ Environmental Integnty,
and Economic EDciency, Man and the Biosphere Series, 9, The Parthenon
Publishing Group Inc., New Jersey, USA, 1992.

Appendix A:
Rate Calculations
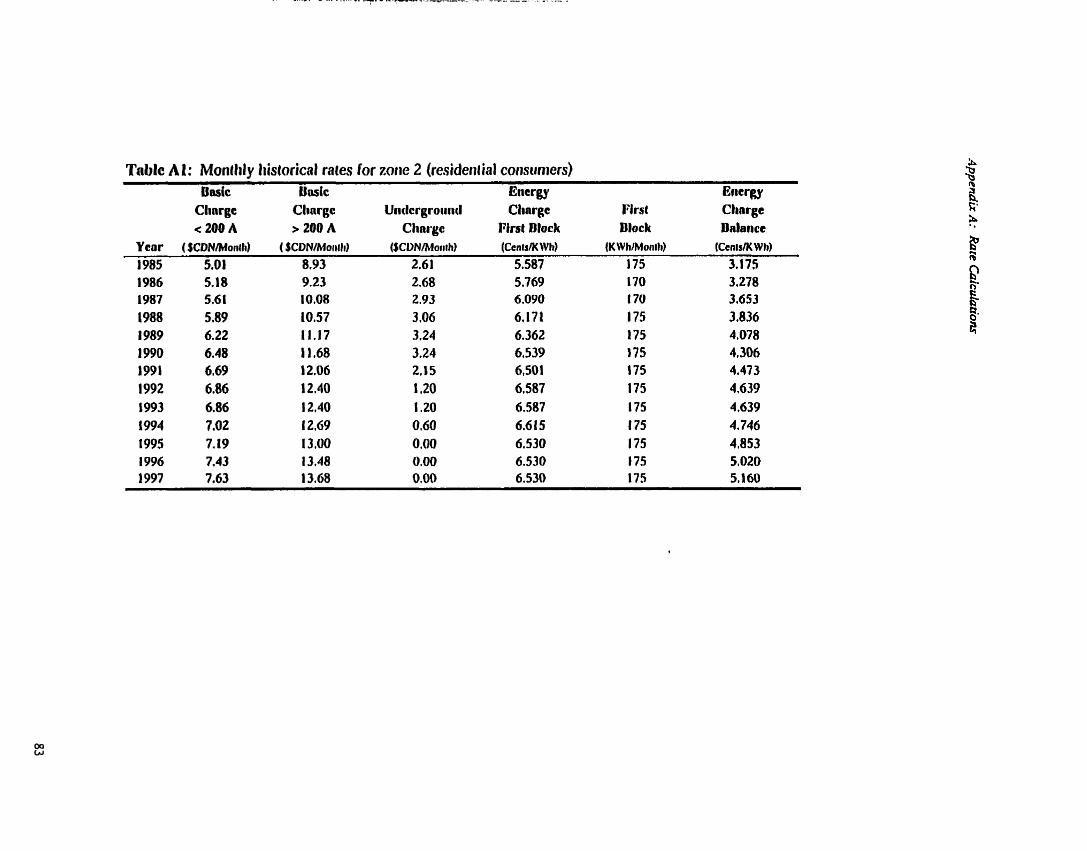
Table A 1: Montlily Iiis(orical rates for zotie 2 (resideiitial consuniers) Uasfc Uwic Encrgy Eiicrgy
Clinrgc Clirirgc Utidcrgroiititl Clirirgc Firsi Charge < 200 A > 200 A Chni'gc P h t Dlack Dlock Ualoiicc
Ycar ( $CDN/Monili) ( $CDN/Moiillr) ($CDN/Moii th) (Ccn ts/K Wh) (K Wh/Monih) tCcnislK W h)
1 985 5.01 8,93 2.61 5.587 175 3.1 75

TnMc A2: Aimual Iiistoricnl rotes for zone 2 (residential coiisumers) Dnsic Dnsic Bnergy Encrgy
Clinrgc Clinrgc Utrtlcrgraiiiid Clirrp Zsirst Cliargc < 200 A > 200 A Clinrgc Pirsl Black Uloc k Ualancc
Ycnr ( fCDNffcir) ( JCDNNcor) ($/Y car) (SCDNMWIi) (MWhlYcar) (SCDNWW hl 1 985 60.12 107.16 3 1.32 55.87 2.100 3 1.75

Triblc A3: Atiiiual Iiistoricnl rnlcs i r i 1993 $CDN foi* zone 2 (rcsitlcnîial cnrisuiiicrs)
ANNUAL DISCOUNT RATE: 6.00 % J
Bmic Eircrgy Encrgy Fcriods Clisrgc Uiiclcrgroiiird Clrnrgc 6irsl Charge Fra tir < 200 A Clinrgc I h t lllock Oloc k Balaircc
Ycar 1993 (1 993 SCUNNcar) (1 993 $CONNcar) (1993 $CON/M Wh) (M WhNear) (1993 SCDNtMWh) 1985 8 95.82 49.92 89,05 2,100 50.60 1986 7 93.47 48.36 86,74 2,040 49.29 1987 6 95.49 49.88 86.39 2,040 51 8 2 1988 5 94.59 49.1 4 82.58 2.100 51.33 1989 4 94.23 49.09 80.32 2,100 5 1 -48 1990 3 92.6 1 46.3 1 77.88 2,100 51.29 1 991 2 90.20 28.99 73,05 2.100 50,26 1 992 1 87.26 15.26 69,82 2.1 O0 49.1 7 1993 NIA 82.32 14.40 65.87 2,100 46.39 1994 1 79.47 6.79 62,41 2.1 O0 44.77 1995 2 76,79 0 ,O0 58.12 2. f O0 43,19 1996 3 74.86 0.00 54.83 2,100 42.15 1997 4 72,52 0.00 51 -72 2.1 O0 40.87
AVERAGE 86.90 27.55 72,2 1 2.09 47.89


Tnblc A5: Annual I~isiorical raies for zone 2 (smnll noi~demand coi~suiners) 'Ilirce Eiicrgy E~icrgy Encrgy
DRSIC Phrisc Clinrge Pi r d CImrgc Second Chrrgc Clinrgc Clriirgc Fird Rlnck Dlock Secoird ISlock Block Balancc


Table A7: Montlily Iiistoricûl rates for m i e 3 (resideii~irl coi~sunicrs) Basic Dcisfc Eiicrgy Eiicrgy
Cliargc Cliargc Clinrgc Pirs t Clinrge < 200 A > 200 A Rrst Block Dlock llolnncc

I'nblc AS: Annual Iiistorical rates Cor zone 3 (resideii~ial coiisuiners) Dmfc Bnsic Encrgy Energy
Charge Clinrge Cliargc l'irst Clmrgc < 200 A > 200 A Pirst lllock Block Uslsircc
Ycnr (SCDNNear) (SCDNNcar) (SCUNIM W 11) (hiWhNeai) (SCDNIM W II) 1985 1 17.48 164.52 64.00 2.58 3 1.75

Tnblc A9: Annual raies hi1 993$ for zoiie 3 (rcsidel~iinl consumer~) Aiinuol discouiit rote: 6.00 %
Dnsic Eticrgy Ettcray Pcrioda Clinrgc Cltnrgc Isirst Clinrgc Froin < 200 A Firsl Block Wock Dolnncc
Ycnr 1993 (1993 SCDNNcnr) (1 993 $CDN/M Wh) (M Wliiïcar) ( 199.3 sCDNfi1 Wh) 1985 8 187.25 f 02.01 2.58 50,60 1986 7 180,26 99.27 2.46 *19,29 t 987 6 168,61 98.20 2,22 51,82 1 988 5 187.24 94,91 2.10 5 1 3 3 1 989 4 183d 1 90.57 2,10 5 1 ,48 1990 3 176.94 87.55 2,10 51,29 1991 2 172,32 82.18 2.10 50, 26 1992 1 165.23 78.07 2,10 49,17 1993 O 155.88 73,65 2,lO 46,39 1994 t t 48.30 69.8 1 2,iO 44.77 1995 2 141.08 65,24 2.10 43,19 1996 3 135.5 1 61.54 2.10 46.20 1997 4 129,74 58.06 2.10 40.87
AVERAGE 16554 8 1.62 2.17 48.21
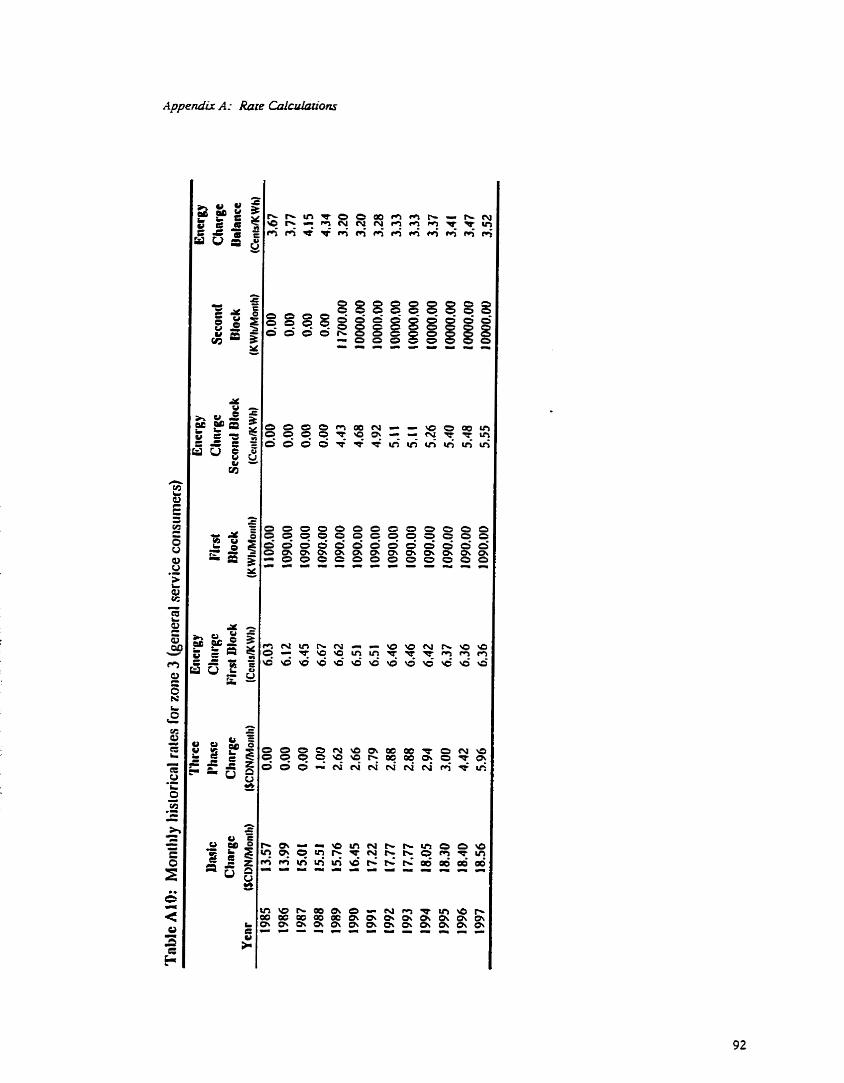
Appendiz A: Rare Coicuh i io~

Tnblc A 1 1: Annual historical rates for m i e 3 (geiieral service consuiners) Tlircc Encr gy 1Siicr gy Encrgy
Bnsic i ' t ~ ~ c c Cllnrgc Firsl Cliarge Sccand Charge Clisrgc Clinrge ipirsl Dlock lllack Sccoticl Dlock Block Balance
Yew OCDNNcar) (SCDNNcar) ($CDN/MWh) (M WWcar) (SCDN/M Wh) (MWhNEAR) ~$CDN/M W hl 1985 162.84 0.00 60.29 13.20 0.00 0.00 36.66
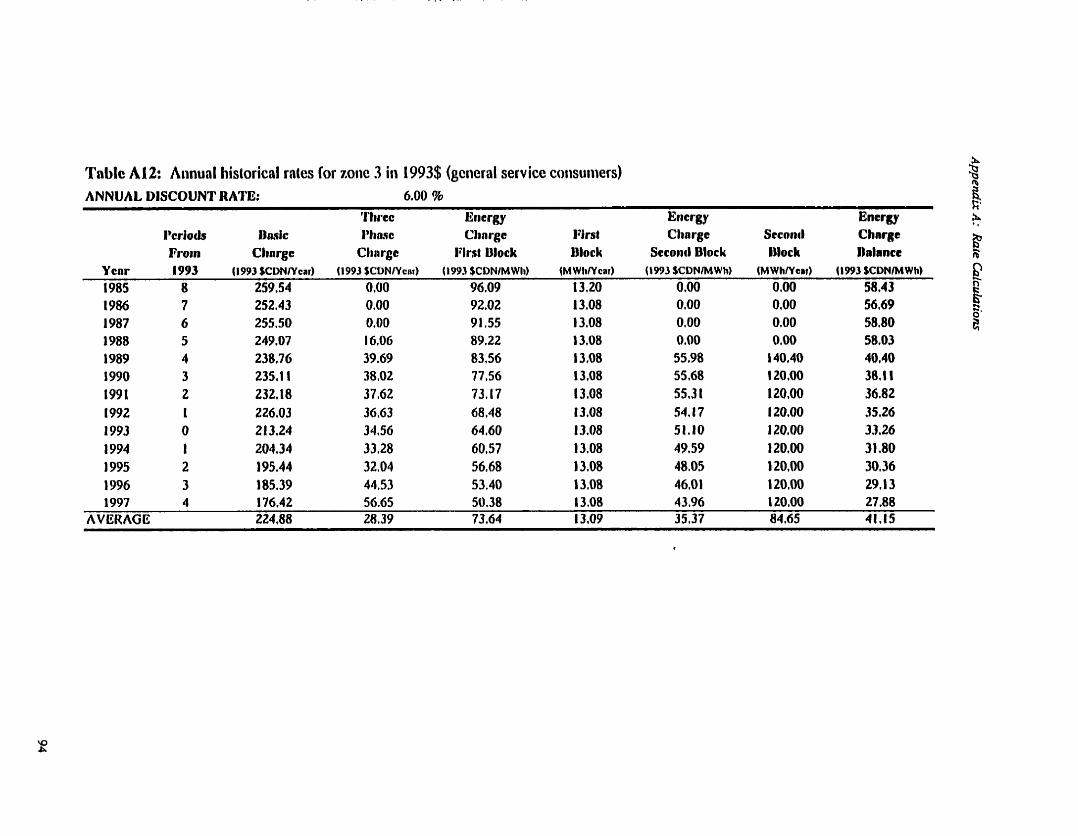
Tablc A12: Aimual hisiorical raies for zone 3 in 1993$ (gciieral service coiisuiners) % B ANNUAL DISCOUNT RATE: 6.00 % & ri'
'l-t~rcc Eiicrgy Eitcrgy Encrgy 5: Il'crioùs Dnsk IBltn~o Cltnrgc First Cltorgc Sccoitd Chwgc h o i n Cknrgc Cltnrgc Pirat Ulock Wock Sccoiitl Block lllock nalance
P R
Y car 1993 (1993 SCDNNcar) (1993 SCDNNcw) (1993 SCDNIMWIi) (MWkNcar ) (1993 SCDNMWh) (MWhNcai) (1993 SCDNIMWh) 6 h
1985 8 259.54 0.00 96.09 13.20 0.00 0.00 58.43 g 1986 7 252.43 0,OO 92.02 13.08 0.00 0.00 5669 a 1987 6 255.50 0.00 91 55 13.08 0.00 0,OO 58,80 1988 5 249.07 16.06 89.22 13.08 0.00 0.00 58.03
f ' 1989 4 238.76 39,69 8356 1 3.08 55.98 140.40 40,40 1990 3 235.1 1 38,02 77S6 13.08 55.68 1 20.00 38.1 1 199 t 2 232.18 37,62 73,17 13.08 55,3 1 120,OO 36.82 1992 1 226.03 36.63 68.48 1 3,08 54,17 120.00 35.26 1993 O 21 3.24 34.56 64.60 13.08 51,10 1 20.00 3.326 1994 I 204.34 33,28 60.57 13.08 49.59 120.00 31.80 1 995 2 195.44 32,04 56.68 13,08 48,05 120.00 3 0 3 1996 3 185.39 44.53 53.40 13.08 46.0 1 120.00 29.1 3 1997 4 176.42 56.65 50.38 13.08 4 3,96 120.00 27.88
AVERAGE 224,88 28.39 73,64 1 3.09 35.37 84.65 41.15

Tnblc A13: Historical raîes for zone 3 (diesel full cos1 coii~iiiercisl consuiiiers) ANNUAL DISCOUNT RATE: 6.00 %
Eiicrgy Encrlçy Encrgy I'criocls Dnsic tladc lhsic Cliargc Chnrgc Cliargc From Clinrge Clinrgc Clinrgc (1cr KWh OC^ WVh pcr M W l e
Y trrr 1993 (SCUNIMonili) (SCDNNcar) (1 993 SCDNNenr) (CcnlslK Wh) (SCDNIM Wh) ( 1993 SCDNN Wh) 1992 1 17.91 2 1 4.92 227.02 32.40 324.00 343.44 1993 O 17.91 214.92 21 4,92 32.40 324,ûû 324.00 1994 1 18.05 2 16.60 204.34 33,IQ 33 1 ,QQ 3 1 2,26 1995 2 18.05 2 16.60 192.77 33.10 33 1 ,O0 294.59 1996 3 1 8.05 2 l6,60 181.86 33.10 33 1 ,ûû 277.91 1997 4 18.05 2 16.60 17157 33,lO 33 1 ,O0 262.18
AVERAGE 18.00 2 1604 198.88 32,87 328.67 302.40
Tnblc A14: 1-lisîoricd rates for zonc 3 (l'id1 cos1 govcriiiiieiii co~isuiiiers) ANNUAL DISCOUNT RATE: 6.00 %
Eiicrgy Encrgy Energy I'criads Ihsic llnsic Dnsic Ch nrgc Clirirgc Chlirgc Froiir Cltnrgc Clinrgc Clinrgc pcr K\Vk OC^ h lWi OC^ M W I i
Y cnr 1993 (SCDNfilonlli) (SCVNIYcnr) ( 1 993 SCDNIYcar) (CcnisJK Wh) ' (SCDNIM Wh) (1 993 $CDN/M Wh) 1992 1 17.91 2 14.92 227.82 70,20 702.M) 744.12 1993 O 17.91 2 14.92 214.92 83.20 832,ûû 832,OO 1994 1 18.05 2 16.60 204,34 77.90 779.00 734,91 1995 2 1 8,05 2 16.60 192.77 77,90 779.00 693.3 1 1996 3 18.05 2 16.60 181 -86 77.90 779.00 654.06 1997 4 18,05 2 1 6.60 171.57 77.90 779.00 617.04
AVERAGE 18.00 2 16.04 198.88 77.50 775,OO 7 1 2,57

Appenàk A: Rare CalcJarions
Table A15 Average rate for zone 2 (residential consumers) Parameter 4% 6% 8% Fied Annual Cost (1993 $CDN) 83.32 86.90 90.99
Table A16: Average rate for zone 2 (srnall nondemand consumen) Parameter 4% 6% 8% FÎed AnnuaI Cost (1993 $CDN) 215.27 223.55 233.08 D, (1993 $CDN/MWh) 68.01 71-58 75.62 D, (1993 $CDNIMWh) 35.27 35.37 35.55 D, (1993 $CDN/MWh) 38.97 41-15 43.62
Table A17: Average rate for zone 3 (residentia1 consumers) Parameter 4% 6% 8% Fixed Annual Cost (1993 $CDN) 158.41 165.54 173-66 D, (1993 $CDN/'MWh) 77.77 81.62 85.98 D, (1993 $CDN/MWh) 46.32 48.21 50-37
Table A18: Average rate for zone 3 (full cost commercial consumen) Parameter 4% 6% 8% Fixed Annual Cost 204.11 198.88 194.07 Variable Annual Cost Coefficient 3 10 -41 302.40 295.04
Table A19: Average rate for zone 3 (full cost govemment c o r n e r s ) Parameter 4% 6% 8% Fixed Annuai Cost 204-1 1 198.88 194.07 Variable Annual Cost Coefficient 73 1-63 7 12.57 695.05
Table N O : Average rates for zone 3 (nomesidentid consumen) Commercial Demand (%) O 20 40 60 70 80 100 Government Demand (%) 100 80 60 40 30 20 O D, (1993 $CDN/MWh) 712.57 63054 54850 466.47 425.45 384.43 302.40
Appendir B.- A n n d Energy Demolrd ~kuLar ionr
Appendix B:
Annual Energy Demand Calculations


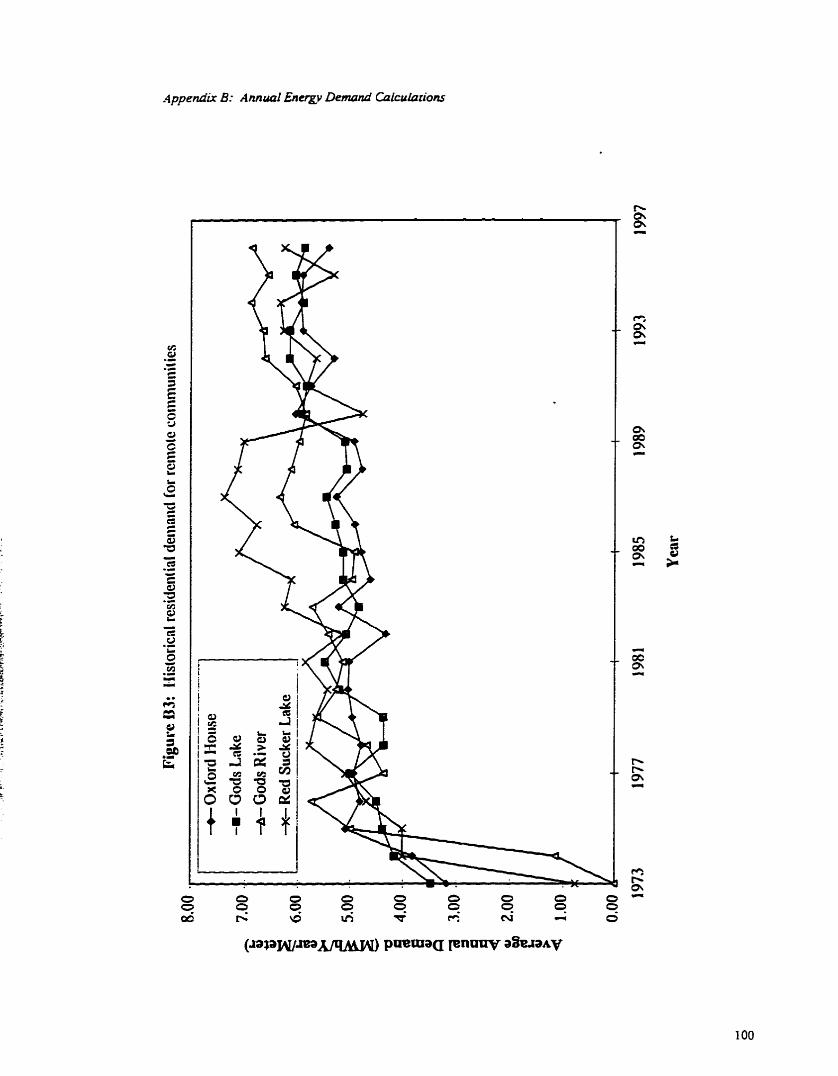

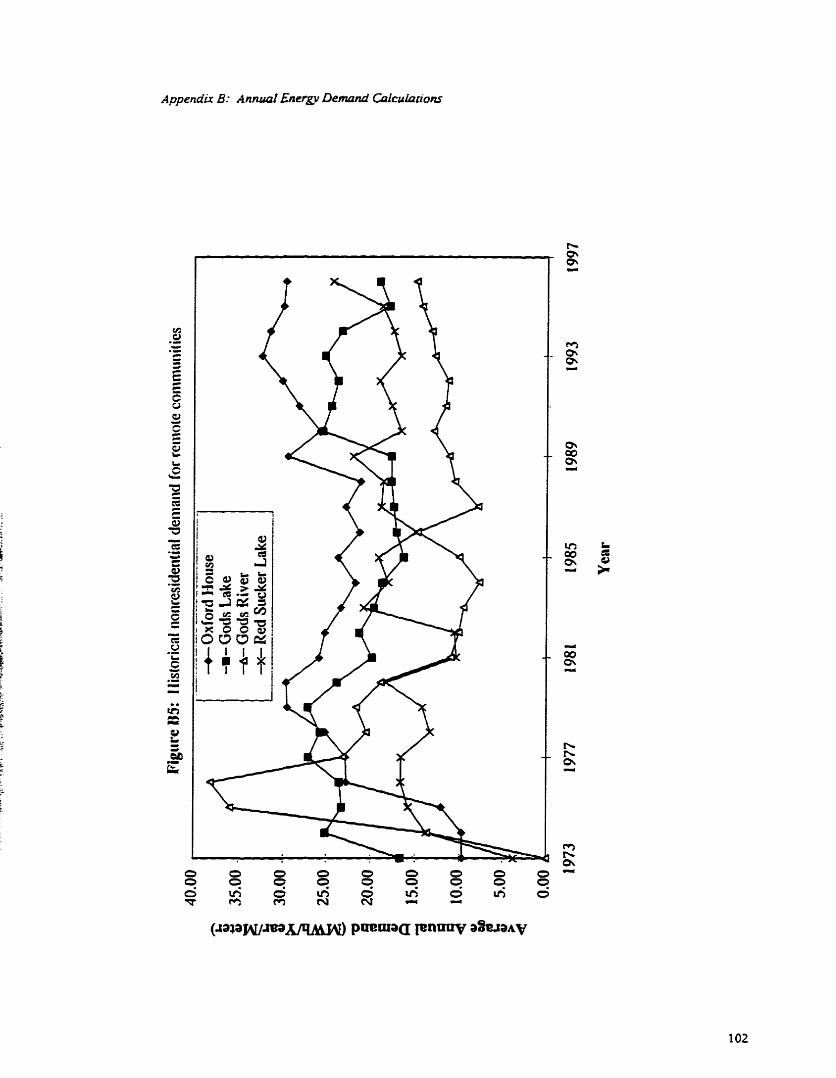
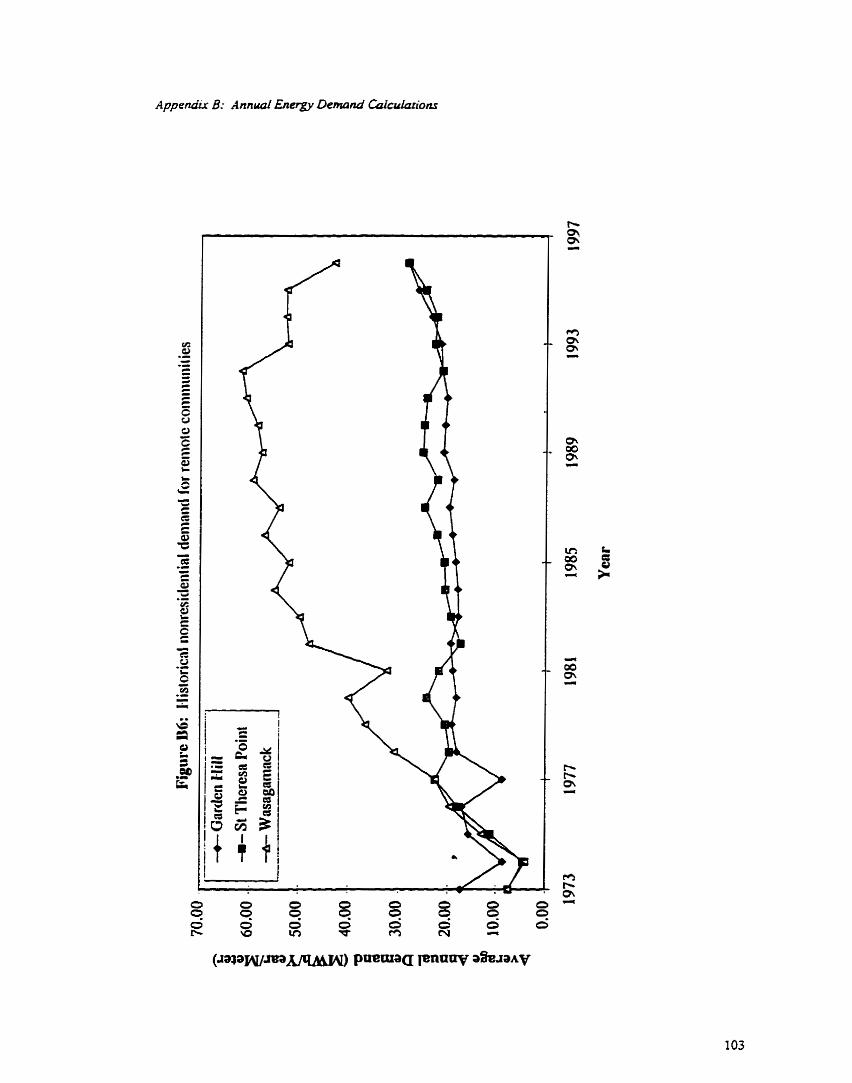
Appenarr 3: Annual Eneqp Dernand C4icuCorion.r

l'nblc D l : Anciual tiistorical eiiergy tleii1~ii0 d r h for Nelson 1-buse 1:iscnl Rctitlcntinl Vcninntl Gencrnl Scrvicc Ucninntl L i ~ l i t i n ~ I)cinrnd Total Dcmnnd Y cnr (Mclcrs) (KWkNcnr) (Mclcrd (KWLNcar) (Mdcis) (KWhNcni) (KWhNcnr) 197U73 92 3 10872.0 30 278 122.00 10 3523,OO 5925 17,ûû

Tnblc D2: Besi f i t of his~orical resideiiiiil e~iergy deiiin~id daln for Nelson 1 fouse A111wn\ Lincnr Dwt Fit Nnn#ncnr He4 Fit
Ycar (Mctcrs) (hl WlrNcar) (M WhlMcfcr) (M Wh/Mclcr) (M WhlMcler) J 973 92 31 l 3,379 3.379 3,379

1'fible I13: Best fit of Iiistorical nonresideniial energy deinmd dala for Nelson Ilouse Annucil Nundw Tatnl Annc~nl Annunl LInenr ilest IW Nonlincar 1)ml Fil
OC Ocncrril Non Nonrcsideiilld of Non Waiilcnllnl ot Non Residen(int Service Rcaidcntint Ilcmnird Ucmand Dcmand Mcttm Dciiiniwl pcr Mctcr pcr Mcter pcr Mcttr
Ycar (Mcicrs) (M WhNcar) (hl WtilMcicr) (MW h/Mcicr) (M WhfMctcr) 1973 30 278 9,271 9,271 9,271 1974 43 740 17,213 1 A97 1 10.467 1975 37 720 19,459 18.67 1 11.817 1976 30 775 25,84 1 23.371 i3.34!
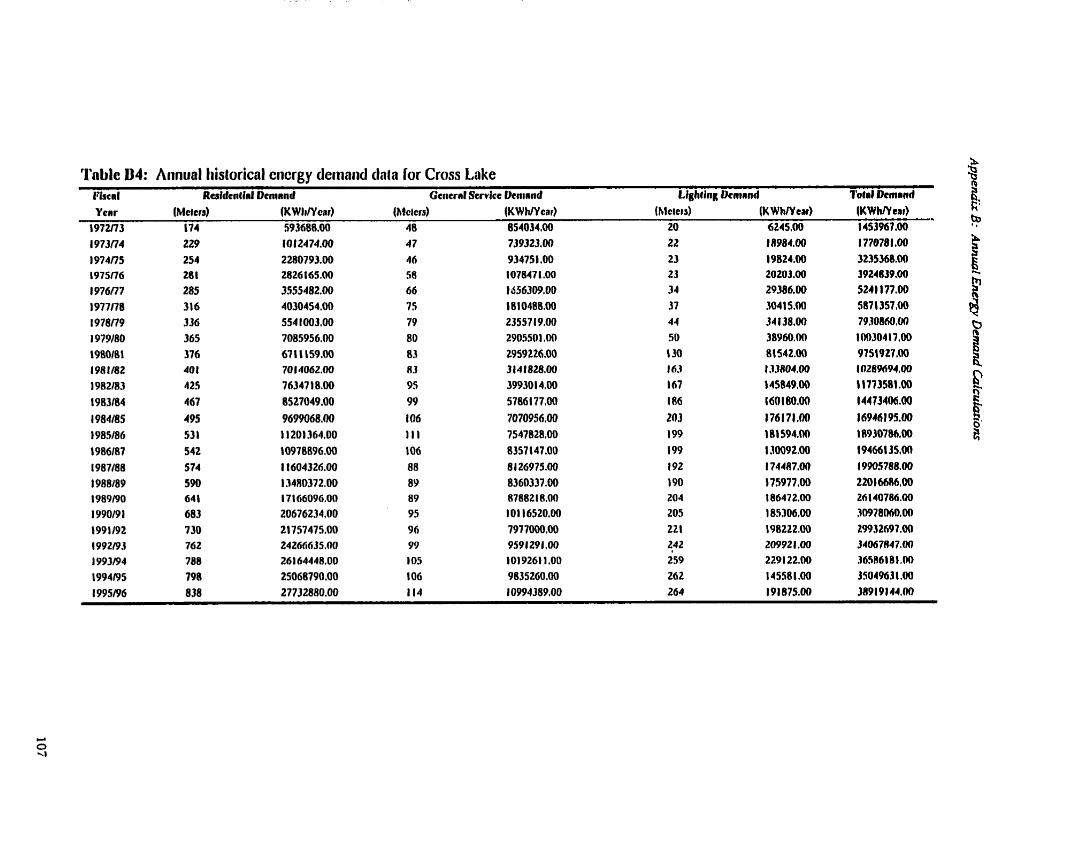
Table D4: Aiinual Iiistorical ciicrgy d e t n a i ~ d data for Cross Lake Flsc a l Rcsidciitfnl Dcniniid Gctrcrd Scrvicc Vcninnd Llghting Dcmnrid Ibial Demrrid Yenr (Mclcrs) (K WIdYcar) (hlclcrs) (KWWear) (hlcicrs) (K WhNcir) (KWhNear)
1972173 174 S93688.W 18 054034.00 20 6245,ûO 1 W967,ûû
1973//4 229 1012474.00 4 7 739323.M 22 18984.00 1 770781 ,O0 1974f75 254 2280793.00 46 934751 ,O0 23 19824.00 3233368,OO 1975176 28 1 2826 165.W 58 107847 1 .O0 23 20203,O 3924839.00 1 976/77 285 3555462.0 66 1656309.00 34 29386,ûû 5241 177,ûû 1977178 316 40304S4.ûO 7 5 18l0488.00 37 30415.W 5871 357,OO 1978/79 336 554 lûû3,ûû 79 2355719.00 44 34 138.W 79308150,01) 1979180 365 7085956.0 80 2905501 ,M) 50 38960.00 IIH)30417,00 1980181 376 67 1 1 159.M 83 29 59226.00 1 30 81542.00 9751927.0 1981/82 40 1 70 14062.00 R3 3 14 1828.00 163 1 35804,ûû 10289694,ûû 1982183 425 76347 18.00 95 399301 4,OO 167 1 +t%49,ûû \177$581 .O 1983184 467 8527049.00 99 57861 77,M I 86 ~60180,OO 144734û6,Oû
1 904/85 495 969W68.0 IO6 7070956,ûû 203 I76I71.0 16946 195,ûû 1985186 531 1 1201 364.00 11 1 7547828.00 1 99 1 81 594.0 18930786.00 t906187 542 10978896,ûû 1 06 8357 147.00 199 13ûû92.00 19466115,oO 1987188 574 11604326,ûû 88 8 126975.00 192 174487,QO 1 9905788,ûû 1908189 590 1 34flO372.00 89 8360331.00 190 175977,O 22016(586,00 1989190 641 1 7 1 fi609G.00 89 878821R.00 204 186472.0 261407M,O 1 99019 1 683 20676234.00 95 101 16520,M) 205 185506,ûû 31)978(M0,00
1991192 7 30 21757475.00 96 7977000.00 221 198222,ûû 29932fi97.W 1992/93 762 2426fi635.0 99 9591291 .O0 v 2 20992 1 .ûO 34047~47.0 1 993/94 788 261 6444B.00 1 05 101 9261 1 .O0 259 2291 22,ûû 36SR6181.1W) 1994195 798 25068790,OO 1 06 9835260.00 262 145581.W 35049631.00 1995#6 838 27732880.00 114 10994389.00 264 19 1875.ûû J8919144,O
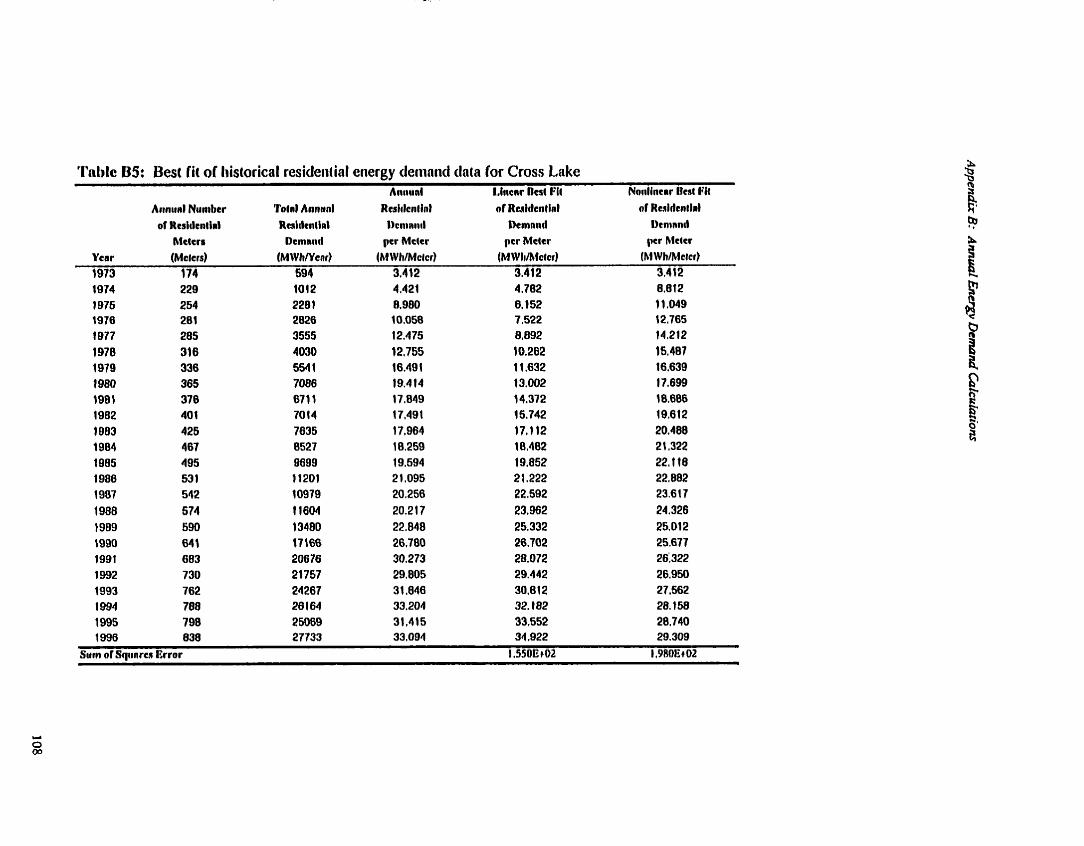
Table B5: Best fit of I~istorical resideiiticl energy deiiinnd data for Cross Lake Anriiinl Llncar Dcsl Fil Noiilincnr Ilcrt Fit
Alctcrr Dcirirncl pcr Mckr pcr Mclcr (KC ~(lcter Ycrr (Mclers) (MWhNcnr) (M WhlMclcr} (MW Iihbkr) thiWh/Mctcr) 1973 174 594 3.412 3.412 3.412

&SE0 8CÇL
l l.0L 99L9 E66E GClC 6562 9062 QÇCZ
LB6 1 000 1 çae L b86 4 €06 1 tS6 1 I 86 1 O06 1 6L6 1

'rablc 1)7: Antiual Iiistoriccl etiergy <lesiniid drln for Split Lnke Fiscnl Rcniclcniinl Dcmnnd Ge~rcrnl Servicc I)cmnncl Lighting Ucnmd rblal kninnd
Ycnr (Mcfcrs) (K WIiNcnr) (Mclcrs) (K W IiNcar) (Mcters) (KWhNcar) (KWhNcar) 1972lï3 71 227305.00 25 257925.00 13 6755.0 49 1985.00

Tnblc NB: Best fit of lhioricrl residentirl eiiergy denwd dafa for Split Lake Aitnt~nl Llncnr I1c.l 4% Nonliricnr Iks4 Fit
Annurl Ntiwlwr Tolnl Annwnl Rwltlcnlinl OC Rwldcntinl ot Rcsldcniirl
of Rc4dcnlinl Rwidcnlinl Dcnimrt Dcmnnd ncmnnrl
Mckrr I>cnannd pcr Mclcr pcr hlctcr pcr McW Y cnr (Mcicrs) (MW kNcai) (M WbtMcfcr) (M Wh/Mctcc) (MH1h/Mcicr)
1973 7 I 227 3.201 3,201 3,201

Tnblc B9: Best fit of bislorical nonrcsideniinl energy dcmrnd data for Split Lake Annirnl N u a b c r Ibid Aniiud Annunl Lincar Dcvt Fit Nonlincnr UCM Fit
of Qrncrd N o n Nnnrc,icleidinl of Non Ruidentir1 of Narr Rcsidcntinl
Mclcrs Vcninnd pcr Mc lc r pcr M c l c r pcr Metcr
Y cor (Mclcis) (MWhNcnr) (MWIi/Mcicr) (MWIiIMclcd (hl W hlMctcr) 1973 25 250 10.3 17 10.3 17 l0.317 1974 33 470 14.239 14,117 1 1,237

Tnblc I3 10: Anncinl Iiistorical energy deinand dnta for Oxlord Hoiise Piscnl Ra idcor l r l Ucnrnnd Gcircrnl Scrvicc Ucnrnnd L i ~ h t i n ~ Donnnd Tatnl Ucmnnd Y enr (Mcicrd (K WItTYcnr) (Mcfcrs) (K WItIY car) (Mclcrs) (K WhlYcar) (K WhNcnr)
1972173 83 261376.m 29 279600.00 9 853Z.W 552508.0
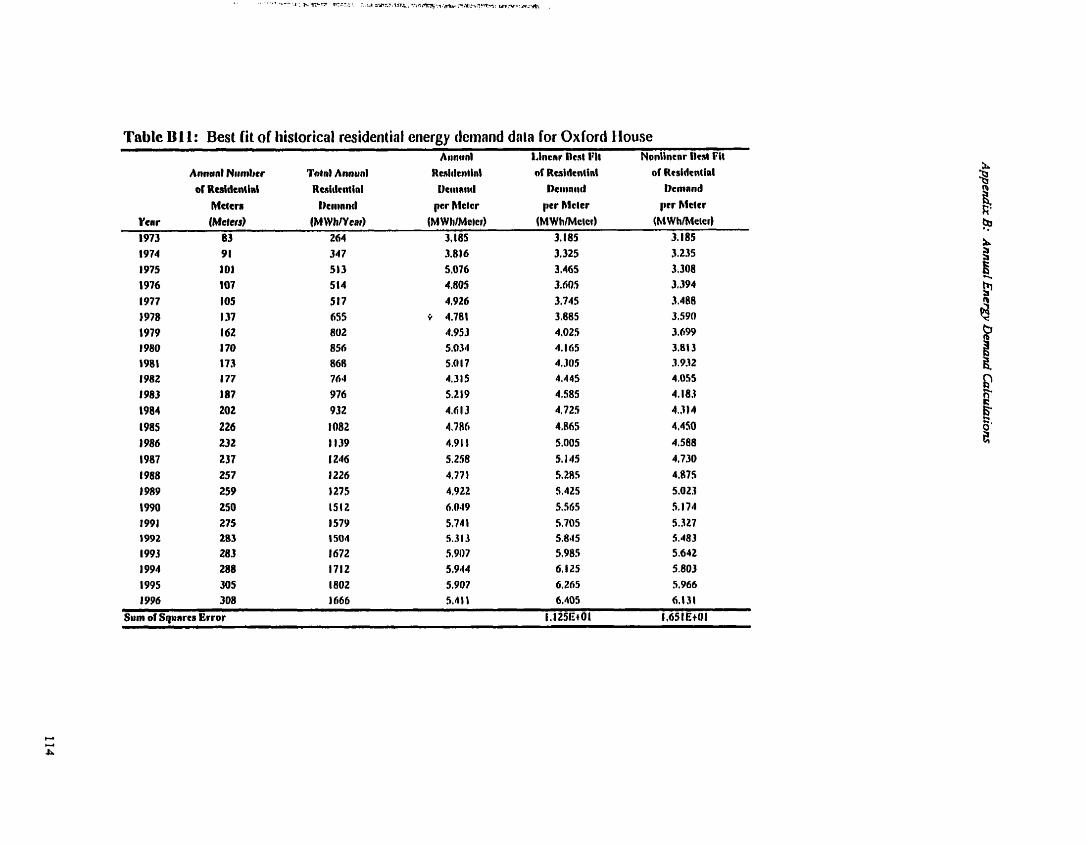
Table BI 1: Best lit of Iiisiorical residential energy deinand dnia for Oxford Ilouse Aiinml ~ l n c a r ncsi IVI Nonlhcnr Htsl Fit
Ycrr 1973 1974 1975
1976 1977 1978 1979 1980 1981
Metcm I)ciitnnd pcr hlctcr pcr hlclcr pcr Mckr (Mc) ers) (M WhNcar) (MW hlMclci) (MWIiIMckr) (MWhlMcicr)
83 264 3,185 3,185 3.185 9 1 347 3.816 3,325 3.235 101 513 5.076 3.465 3.308 1 07 514 4.805 3,605 3,394
105 5 17 4.926 3.745 3.488
157 655 0 4.781 3.885 3,590
162 802 4.953 4.025 3.699
1 70 856 5,934 4.165 3,81 3 173 868 5,017 4.305 3.932


TaMc B14: Best lit of tiistoricol resideiitirl ciiergy deinniid dala for Gods Lake (aiid Gods Lake Nanows) Anni id Liiicnr k i t Fit Nodkicnr D w t Ph
Anniinl Niimbcr Tolnl Aimiinl Rcildcnlinl of itcs\dcntin1 af Rcsii\cntin\
of Raiilcnlirl Rmidcnlial Uciirnid Uciiinnd Denrand Met t ra Dciiinntl occ hlcicr pcr Mc ïcr pcr hlcicr
Ycnr (Melers) (MW h/Ycer) (MW lrhlctcr) (MWklMclcr) (hl WhlMckr) 1973 60 209 3.480 3.480 3.480

Tnblc D15: Bas1 fit of l~islorical nociresi<lcii~inl ciwgy dcmnnd dnin for Gods Lake (aiid Gods Lake Narrows) Annunl Numbcr 'roinl Anniin1 Anniml LIncnr Dcst Fit Nodincnr Rcd Fit
af Gcncrnl Non NuwcsitlcnW nt Non RcdrlenîtnI of Non Resldcniinl Service Ncirlrlcr~tinl Deotnr10 1)cinnnd Dciiinntl
Mckm Dcnisntl pcr Mcter p w M c k r pcr htctcr
Ycnr (hlelers) (MWhNcilr) (M\VIi/Mctct) (M Wh/Mcicr) (M Wh/Mcicr) 1973 35 580 16,580 16,580 16.580

Table 816: Annurl Iiistorical energy demand data for Gods River Fkcnl RcdtlcnM Dcciiniid üccicrnl Scrvkc Dcmnnd Lighling 1)cmrnd Total Dcmand Ycnr (Mclcrs) (KWIiNcar) (Melcrs) (KWhNcsr) (Mclcis) IKWhlYoar) ( K W W c d
1972n3 O 0.00 O 0.00 O 0.00 0.00
b 3 X i: Ci'

Tnblc 0 17: Best fit of Iiistorical resicieiitinl energy <lemoiid data for Gods River Annurl Linear Ilest I7i4 Nnnlicicnr ilest Fit
Annunl Numhcr TOM A i w d of Rcsitkirlinl of Rcsltlcnliril
Mckrs pcr Mctcr pcr Mctcr pcr hicter
Ycnr (Mckrs) (MWhNcrr) (M WhlMclcr) (hl W hlMcicr) (MW hfi4cicr) t 973 O O 0 . m 0,000 0,000 1974 II 13 1,144 0,390 0.020
(1.9 20 6,073 6.352 fi. 135
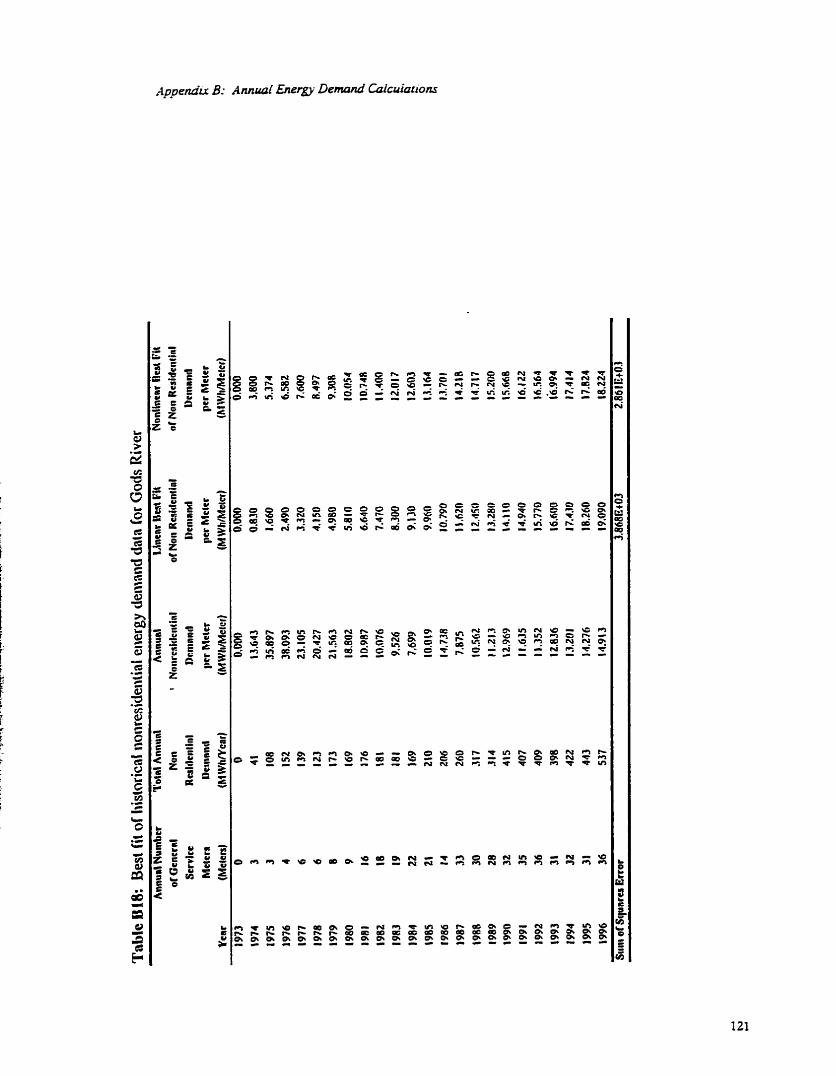

l'nble I119: Aiinun1 Iiistorical eiicrgy deiiiai~d dntn for Rcd Siccker Lnke l i rcn l Rc~lilcnlinl Vcnvnnd Ucncrnl Scrvicc Ilcntniid I , I~h( ic i~ Ilciiland Tald Ucrrnnd Ycnr (Mclcis) (KW hNcar) (Mcicrs) (KW W c n r ) IMeicrs) (KWhlYcar) (KWhNcar)
1972173 31 23498.00 7 26099,ûû 9 322,ûû 49919,W
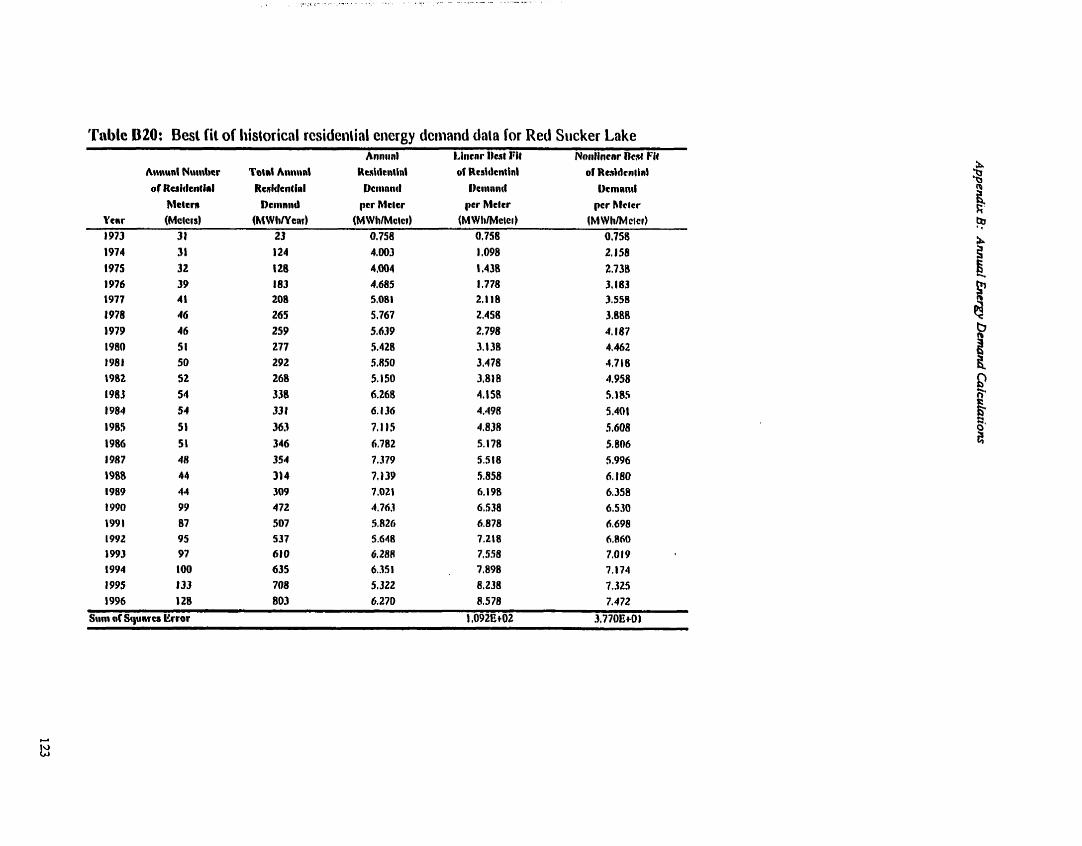
' M l c 020: Best fit of historicnl rcsideniial energy dciiiand dala for Red Siicker Lake Anniin! Liiicnr 1)c.q.tl Fil Noiilincar ncst Fit
Atrnunl Nuirrlwr Totnl Airirrinl Rriiilcntinl oT Rcsiilcntinl of Rc.drlcniid OC Rcsiclcntinl Rwltkntial Dcri~nntl I)ciiinnrl
Mclcrr Dcniniid pcr Mclcr per Mclcr Dcninnd
per htcicr
Y crr (Mclcrs) (MW h N a d (MWIiMcicr) {MWIi/Mc\cr) IMWhhicici) 1973 3 1 23 0.758 0,758 0,758 1974 31 124 4.003 1.098 2,158 1975 32 128 4.004 1,438 2.738 1976 39 183 4.685 1.778 3,183 1977 4 l 208 5.081 2.118 3,558
1978 16 265 5,767 2.458 3,888 1979 46 259 5,639 2.798 4.187 1980 5 1 277 5.428 3.138 4.462 1981 50 292 5,150 3,478 4,718 1982 52 268 5.150 3,818 4,958 1983 54 338 6.268 4. lSR S. 185 1984 54 33 I 6.136 4.498 5,401 1985 51 363 7.1 15 4.838 5,608 1986 5 1 346 6.782 5. 178 5.806 1987 48 354 7.379 5,518 5.996
1988 44 314 7,139 5.858 6.180 1989 44 309 7.021 fi. 198 6.358 1990 99 4 72 4.76.1 6.538 6,530 1991 87 507 5,R2fi 6.878 6.698 1992 95 537 5.616 7.218 ti,86fl 1993 97 610 6,28R 7,558 7.0 19 1994 100 635 6.35 1 7,898 7.174 1995 133 708 5.322 8,238 7.325 1996 128 803 6.270 8.578 7.472
Sum of Squnrcs llrror 1,092Et02 3,7708t01

'I'nblc B2L: Besl fit o l Listotical tioiiresidential eiiergy deiiiriid data for llcd Sucker Lake Annrin\ Nunhcr Totrl Aniiunl Ant~iinl Lincnr IJcd Fi t Nanltncnr Ilest Fk
OC Gencraf Non Nonruttletitinl of Non Rcsidc~iiinl ot Non RalilciitLnI Scrvicc Rtslilcnlirl Dcwnnti Ociiinnd Veoirntl
Mclcra Dcmrnd pcc blekr OC^ htctcr pcr hldcr \'car (Mclcrs) (M #'Wear) (MW ItIMcicr) (MWl~/hlctcr) (MWlirmcicr) 1973 7 26 3,728 3,728 3.720
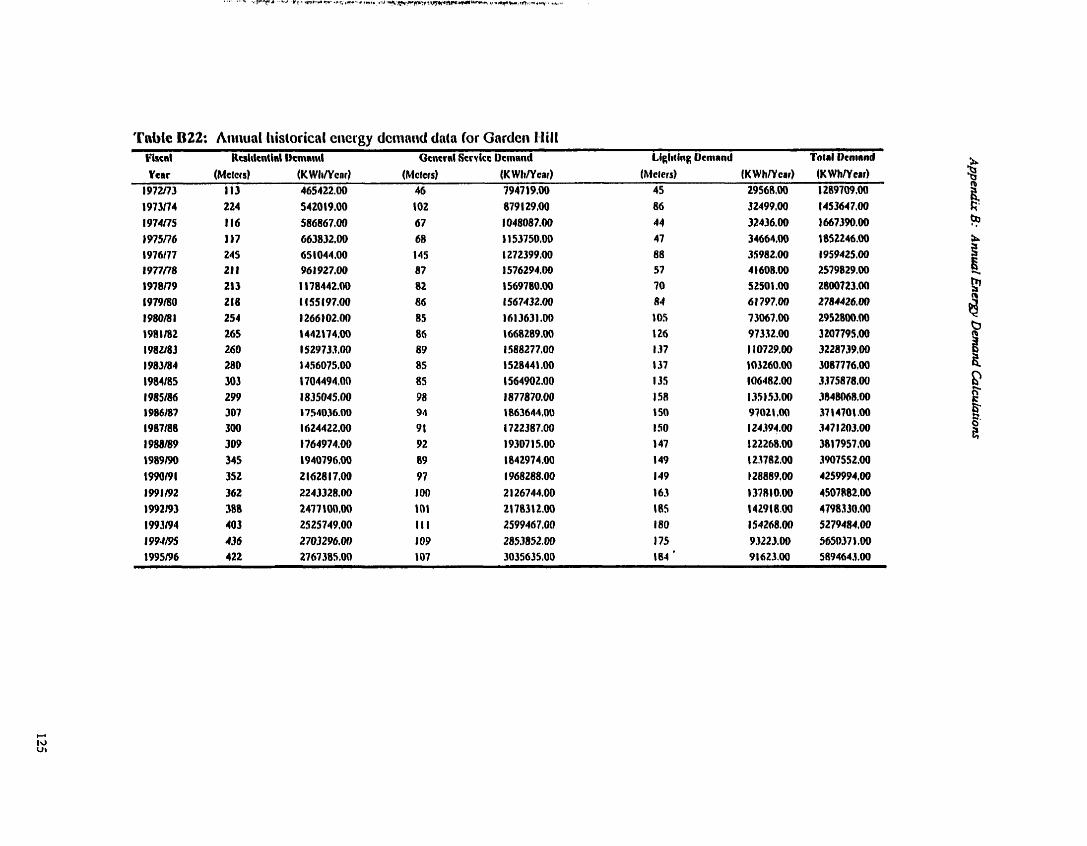
'K'ablc B22: Aiiiiual IiisloricaI eiiecgy dcmaid data (or Garden 1-lill Fiml Rcsidcntiirl I)cntnml Gcncral Scrvicc Ucrnrnd Cighcing Ucninnd Total Ilcnriind
Ycar (Mcicrs) (K WIiNcar) (Mctcrs) (K WIdYcar) (hlclers) (K WhTYcar) (KWhNcar) 1972173 113 465422.0 46 794719,ûû 45 2956R.00 1289709.W

z œ ù 5 = U H z 4 - e s z L 3 E2. t t n s 5 % = g -

Tnblc U24: Best fil of I~istoricnl nonresideiiiinl eiiergy deniand data for Nelson House AnnuJ Numhr 'Ihtnl Annunl hnnrinl Llncnr I h l Fi8 Nonllncnr Ucst Fil
of Gcncrnl Naii Nonrc..ltlcidhl aC Noii Ucsldcn(inl ot Non Rcsidcntirl
Service Rcdtle~iiinl Dcrnn~itl Vcninod Vcninnd
Mctcrs 1)cnlnnd pcr Mctcr pcr Mcltr pcr hlclcr Ycnr (Mcicrs) (M \VIiNcnr) (M WIi/Mcicr) (M WhlMctct ) (M WhlMcicr) 1973 16 795 17,277 17.277 17.277

Tnblc D25: Annual hisioricnl eiiergy (Icoiaiid O a h for Si. Theresn Point Iiiscnl Rcsttlci~lid Ue iw i t l Cicncrnt Scrvice DcntnnO I&l~Iing Dcrrirnd Tain1 Dtmnnd Y CR^ (Mcicrs) (K WIiNenr) (MC~CIS) (K\VIiNear) (hlclers) (KWhNear) (KWhNcar)
1972(73 98 345097.00 27 200603,OO 24 18141,OO 563811 ,O0

Tnblc B26: Best l i t of I~istorical residential ei~ergy deiiiaiid data for St. Tlieresa Point Annunt Llncar Uca Fit Nonlincrr ncst Fil
Mclcrs Dciiinnd pcr hlcicr pcr hlclcr pcr Alcter
Ycnr (Mcicrs) (M WhNcar) (M WIilMcicr) (MW IiIMekr) (M1Vhlhlckr) 1973 98 345 3.521 3.521 3,521

Tnldc 027: Des1 fil of Iiistoricrl i i~ i i resi~lei i l inl eiwrgy tlcinei~d dala for Si. 'iïicresr hiiii Annunl Niinibcr T o h l AI~WII! hnintn\ Lincnr Ucsi 1% Nnnlinc~r I k s i I:ii
aC Gcncrnt Nori Nocircsitlcrif inl
Mclcra Dcnimrl pcr h l c t c r ptr hlticr p c r M c i c r
Ycnr (Mcicrs) (MWIINCRO (M\VIiIMcicr) (hi W I M c fcr ) (hl Wh/hlc(crl 1973 27 201 7,430 7,430 7,430
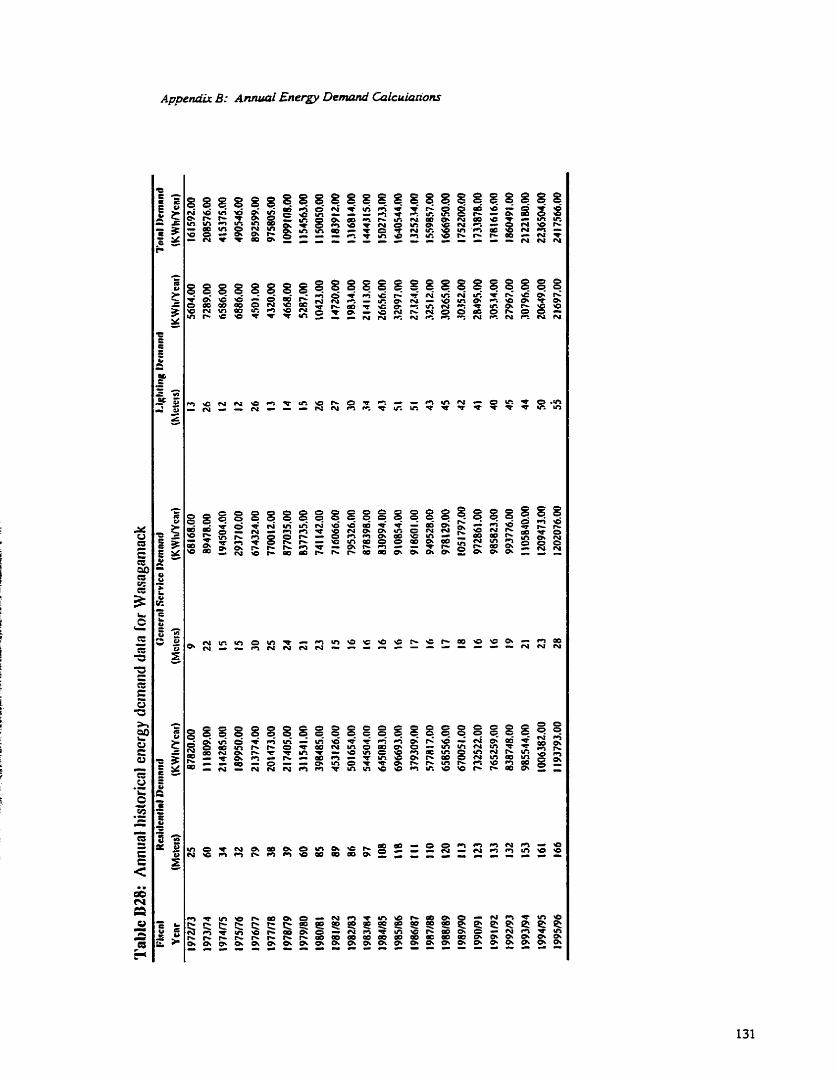

Tnl~lc R29: Dest fit of I~istorical resideritinl energy dcriiaiid data for Nelson I.loioe A t m m l Lincar Bert Fit Nonlincnr I l a t Fit
Annunl Numbcr Totnl Aiinunl H ~ d t l c ~ t i t i l of RcddcnilnI OC Rcsitlcniinl of R u i d c t ~ t h l Rcddci~t inl Vcoinnil Ociiinirtl ilcniniiil
hlclcrs Dcn~nntl pcr Mctcr pcr Metcr ptr hlctcr
Ycnr (Mctcrs) (MWIiNcnr) (MWIiIMcicr) (MWIiIMcicr) (M\Vh/Meicr) 197.1 25 88 3,s 13 3,513 3.513
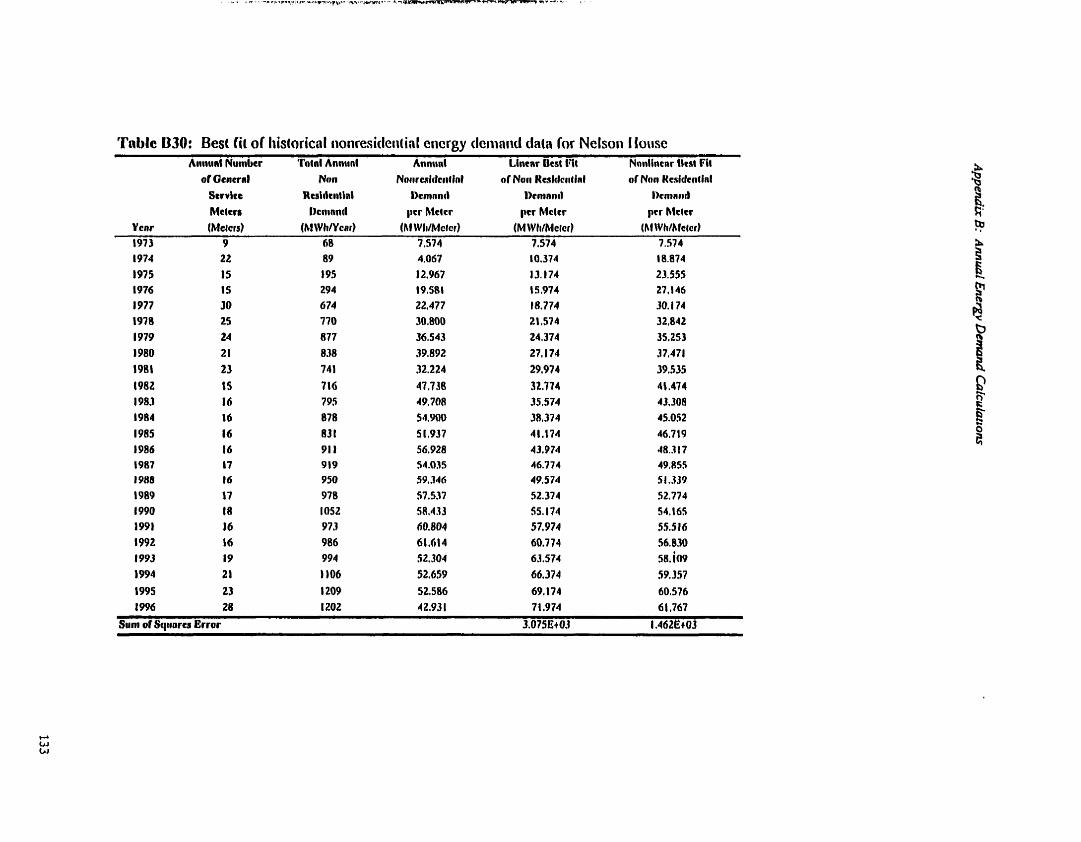
Table D30: Best l i t o l I~istarical i~onresi(leiitinl e t ic rg ( I c n ~ ~ i d (Inta for Nelso11 I loitse Aiintint Numkr 'i'otnl Annunt hniiunl Lincnr Ucst l'il Niiirllncnr ltcst Fit
of Q e n r r r l Non Nocircql(kiiiinl of Noii Rcdtlccitinl or Non k s i d c n t i ~ î
Mctcrr pcr M c t c r pcr M c l c r prr Mttcr Y cnr (Mclcis) (hl \VhNcrr) f hl WkiMc~cr) (M WIi/Mcicr) (hf Wlilhle~cr) 1973 9 68 7.574 7,574 7.574
!il ,339 52,774 54.165 55.5 16 56.030 se. io9
59.357

Table B31: Demand Coefficients from best fit to historical res. demand data r- COMMUNITY Nelson Ho- Cross Lake SpIi t Lake
Oxford House Gods Lake Narmws Gods River
Red Sucker Lake Garden Hi11 St. Theresa Point Wasagamac k
tAND LINE ALT.
Table B32: Demand Coefficients from best fit to historical nomes. demand data
COMMuNrrY Nelson House Cross Lake Split Lake
Oxford House Go& Lake Namows Go& River
Red Sucker Lake
Garden HiU SL Theresa Point
Wasagamack
LAND LINE ALT.
Appendix C:
Unit Energy Cost Calculations

Table Cl: Diesel Alt. - unit energy cosa in 1993SMWh for residential consumers R d St
Cross Nclsoa Split Odord Gads Gads Sucker Garden Thcresa Wasa- YEAR Lake Howe L k e House Lake River Lake Hiii Point gamack 1996 52.61 74-49 75.69 83.66 82.02 83-22

Table CZ: Diesel Ait - unit energy costs in 1993s lMWh for nonresidential consumers Red St.
Cros N h n Split Oxford G d Go& Su* Garden Tttvgs Wrcs- YEAR Lake House Lake House Lake River Lake Hill Point gamack
45.46 45.676 431.82 434.19 436.36 43431 434.09 432-79 428.67 1996 1997 1998 1999 2000 ZOO l 2002 2003 2004 2005 2006 2007 2008 2009 201 O 201 1 2012 2013 2014 2015 2016 201 7 2018 2019 2020 2021 2022 2023 2024 2025 2026 2027 2028 2029 2030 2031 2032 2033 2034 2035 2036

Table C3: Land line Alt. - unit energy costs in I993SMWh for residentiai consumers -- R d St.
Cross Nelson Split Oxford Gods Gods Sudrer Garden Tbvesa Wasa- YEAR takt Housc Lake Ha- Lake River Lake Hill Point gamack 1996 5261 5263 52.05 69-43 69.21 63.27 63.97 68.64 67.68

~ p p e d i z C: t i r ~ r E n e w Cosr Caicuhr~ons
Table C4: Land iine Ait - unit energy costs in 1 9 9 3 $ m for nonresidentia1 consumer Red St.
Cros NeboD Split Oflord Gock Go& Sucku Garden 'hersa Wasa- YEAR Lake House Lake House Lake Rivu Lake Ri11 Point gamack 1996 45.86 45.46 45.68 57.70 1997 1998 1999 ZOO0 ZOO 1 ZOO? 2003 2004 3005 2006 2007 ZOOS 2009 2010 201 1 2012 2013 2014 2015 2016 2017 2018 2019 2020 2021 2022 2023 2024 2025 2026 2027 2028 2029 2030 2031 2032 2033 2034 2035 2036

Table CS: Both Alternatives - unit energy costs for res. cons. in Cross Lake
YEAR Um'hhem) ( M W W h ) (1993Wm~1 (t 993S/MWhmeur)
1996 29.214 1537.01 52.61

Table C6: Both Alternatives - unit energy costs for nomes. cons. in Cross Lake Average h u d Erst Sccond Third Average Average Annual
Dcmand Block Block Block Annual Cost Unit En- Cost
YEAR t~wmcicr) ( ~ w h ) t~wh) ( M W ~ I t 1993~meiu1 (1993s /MWhlmerer)
107.492 20.000 74.412 4929.27 45.86

Table C7: Both Alts. - unit energy wsu for res. cons, in Nelson House Average A ~ u d Flrst second Avcragc Average Annuil

Table C8: Both Ais. - unit enetgy COSU for nomes. cons. in Nel. House Average Annual First Second Thid Average Average Amud
Demand Bloclc BIoek Block Annual Cost Unit Energy Cost

Table C9: Both Mis. - unit energy coss for res. cons. in Split Lake Average Annual Fim Second Average Average h u a i
Dcmruid Block Block Annud Cost Unit Eocrgy Cost YEAR (MWhhncw) &Wh) (MWit) 11993Shncla) (1~+93S/MWwmeter)
33.175 2.100 31.075 1726.72 52.05
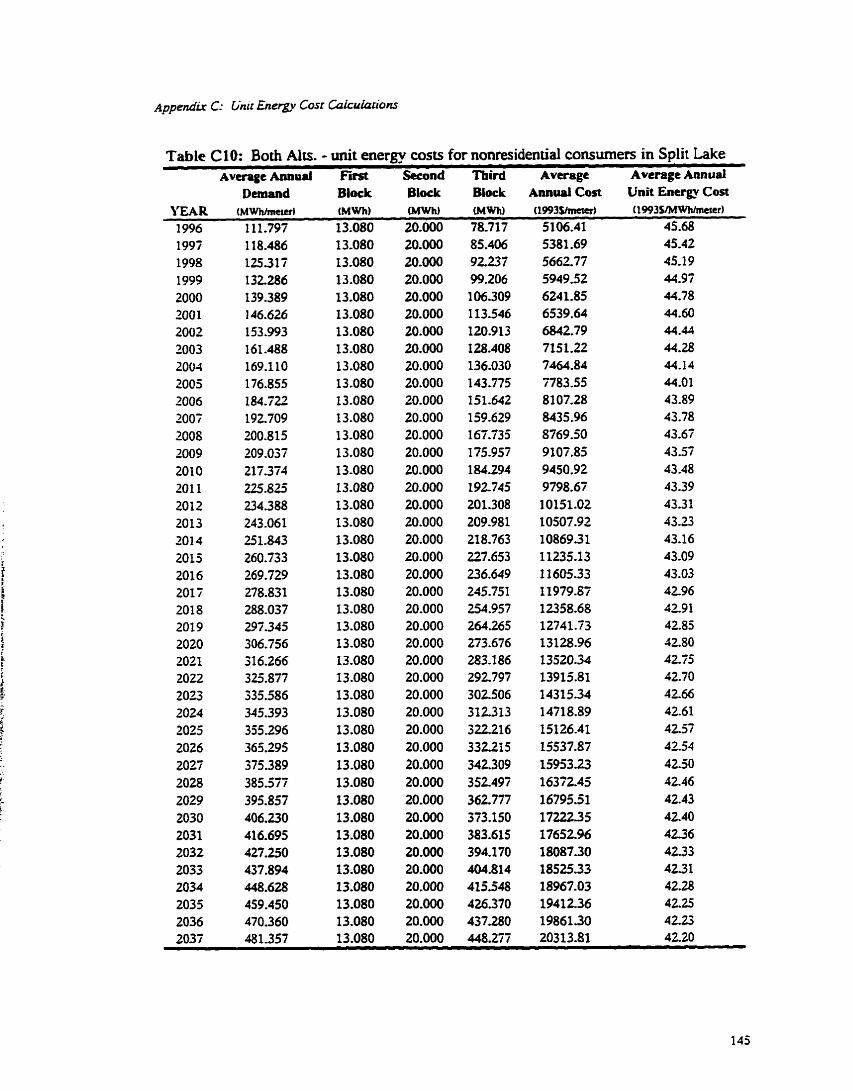
Table CIO: Both Alts. - unit energy costs for nonresidential consumers in Split Lake Average Aanual First Second niird Average Average Annual
Demand BI& Biock Blodc Annual Cost Unit En- C o s
1996 1997 1998 1999 2000 200 1 2002 2003 2004 2005 2006 ZOO7 ZOOS 2009 2010 201 1 2012 2013 201 4 2015 201 6 201 7 201 8 201 9 2020 2021 2022 2033 2024 2035 2026 2027 2028 2039 2030 2031 2032 2033 2034 2035 2036 2037

Appendir Cr (init Energy Cosr Coicu&~ions
Table Cl 1: Diesel Alt - unit energy cos& for res. cons-in Oxford House Average Annud Fimt Sccond Average Average Annual
Demand Biock Block Annual Cost Unit Energy COS

Table C12: Diesel Ait. - unit energy costs for noms. cons. in Ox- House ~verage hnual ~ v c k t Averagc Annual
Deanand Annual Cost Unit Encrgy Cost
1996 1997 19% 1999 2000 2001 2002 2003 2004 2005 2006 2007 2008 2009 201 O 201 1 2012 2013 201 4 2015 201 6 201 7 201 8 2019 ZOZO 2021 2022 2023 2024 2025 2026 2027 2028 2029 2030 203 1 2032 2033 2034 2035 2036 2037

Table C13: Land Iine alt - unit energy costs for res. cons. in Oxford House Average Amud Fim Second Avcrage Average Annuat
Dcmond Blodc Blocic Annual Cost Unit Energy Cost

Appendir C: h i & E n e w Cosr Colcuiaiconr
Table C14: Land iine alt - unit energy costs for nomes. m . i n Oxford House Average Annud Fiist Second Third Average Average Annual
Dunand Blodr Block BI& huai Cost Unit Energy Cost YEAR (MWhlmeter) (MHh) (MWh) (M'Wh) (19930metcr) (1993$/MWhlmeted
13.080 18.142 0.000 180151 57.70


iippendir C: Linii h e w Cosr C4Ic~iattonr
Table CM: Diesel Alt - unit energy wsts for nonresidential consumers in Gods La Avccagc Annuai Average Average Annuol
Dcm4nd AMuai Cost Unit Encrgy Cost YEAR (MWhlme(#) (t993Simtlul (1993SlMWhrmeicr)
22767 9884-94 434.19

Table C17: Land Iine Alt. - unit enernv costs for residentiai consuners in Gods Lak Average Annual' Fitst Second Average Avcragc Annual
Dcmand Bloclr Blocir Annual Cos Unit Eilcrgy Cost YEAR (MWhlmccal (MWh) (MWhl (1993f/metn) (1993YMWhhneter)

Table Cl8: Land Line Alt. - unit energy costs for nonresidential consumen in Go& Lak Average Annuai First Second Third Average Average Annuad
Dtmmd Blodc Block Wock ~nbual Cost Unit Energy Cost

Appendir C: Linif Energv Cost blcuiariom
- 1996 1997 1998 1 999 2000 ZOO 1 2002 2003 2004 2005 2006 2007 2008 2009 2010 201 1 2012 2013 201 4 2015 201 6 2017 2018 2019 2020 2021 2022 2023 2024 2025 2026 2027 2028 2029 2030 203 1 2032 2033 2034 2035 2036 2037
Table C19: Diesel Ait - unit energy cosu for residential consumers in Gods River Average A n n a Fi Second Avuagc Average Annual
Dtmaad Block Block Annual Cost Unit Energy Cost Y E A R . (Mwhlmcw) ~~ ~~~ (1993Ymetcr) (1993S/MWh/rncrcr)
668.14 74.49

.-ppendix C: Unir En- Cosr Gzlcufarionr
Table Cf O: Diesel Ait - unit energy cosrs for nomesidentid consumen in Go& River Average Annual Average Avenge Annual
Dcmand A~urlCost Unit hcrgy cost

Table CZI: Land line Ait - unit energy cos& for residential connimers in Gods River Average Annual First Second Avtrage Average Anoual
Dcmand Biock Biock Annual Cost Unit Encrgy Cost YEAR ( ~ ~ ~ i n c t d (MM) (1 993flmcier) (1993SMWrnercr)
1996 8,970

Table C22: Land Iine A ~ L - unit energy costs for nonresidential consumes in Go& Ri Average Anauai First Second Third Average Average Annual
Dcmmd Block Block BIock Annual Cost Unit Energy Cost
1997 1998 1999 2000 ZOO I 2002 2003 2004 2005 2006 2007 2008 2009 201 O 201 1 2012 2013 2014 2015 2016 2017 2018 2019 2020 2021 2022 2023 2024 2025 2026 2027 2028 2029 2030 2031 2032 2033 2034 2035 2036 2037

Appendir Cr Limz E n e w Cost Gdculnlrons
Table C23: Diesel Alt. - unit energy costs for res. cons-in Red S, Lake - - Average Annual F i i Second Average Average Annuat
DeInand Blodc Blodc Anauai Cost Unit Energy Cost YEAR (MWhlmaer) (MW) (MW)i) (1993ymuU1 (1993SIMWhlrnetrr)
8578 2.100 6.478 649.25 75.69
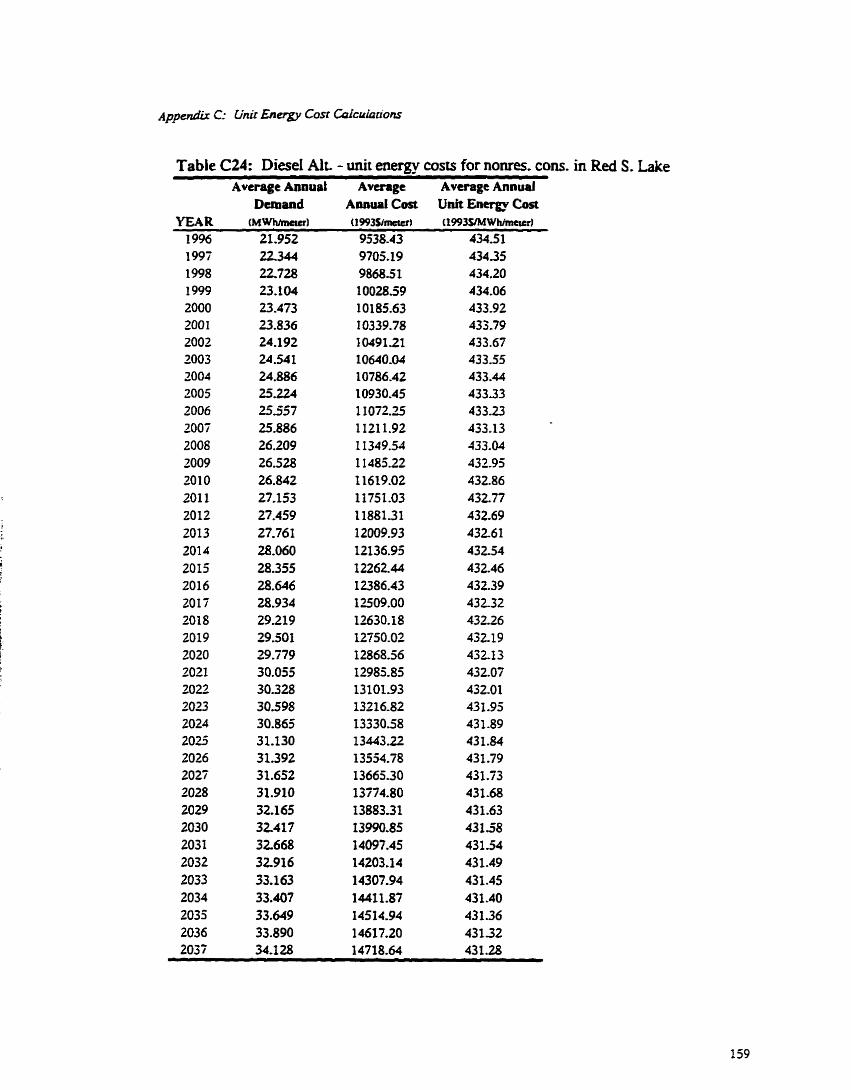
Table C24: Diesel Alt - unit energy cos& for nomes. cons. in Red S. Lake Average Annual Average A v q Annual
Dcmand Annual Cost Unit Energy Cost

A p p e d . C: Unir Ener&y Cost C4iculon'om
Table C23: Land line Alt - unit energy costs for res. cons. in Red S. Lake Average Anaud First Second Average Average Annual
mtnaad BI& Bloclt Annuai Cost Unit Energy Cost

Table C26: Land line Alt. - unit en. costs for nonres. cons. in Red S. Lake Average Annual Wrst Stcoad Third Average Average Annual
Demurd Block Block Block Annual Cost Unit Energy Cost YEAR (MWN~-) (MW)i) (MW) &¶Wh) (1993Simem) (1993S/M Whlmerer)
1996 21,952 8.872 0.000 1473.62 67.13
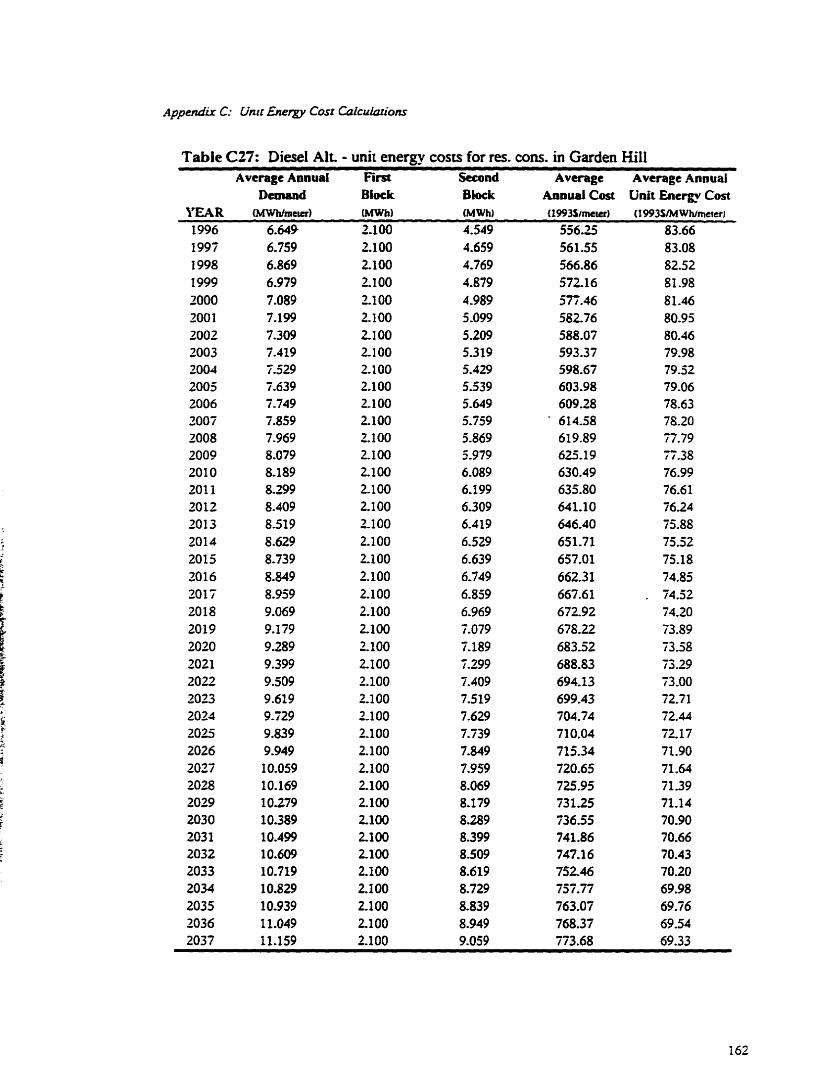
Table C37: Diesel Alt. - unit enernv costs for Tes. cons. in Garden Hill Average Annual FSrst Second Average Average ~ n u u d
Dcmand Biodc Block h ~ u a l Cost Unit Encrgy Cost l a (MWNmcur) [MWh) (MWh) (1993Srmeicr) (1993SM Whlmeterl
556.25 83.66
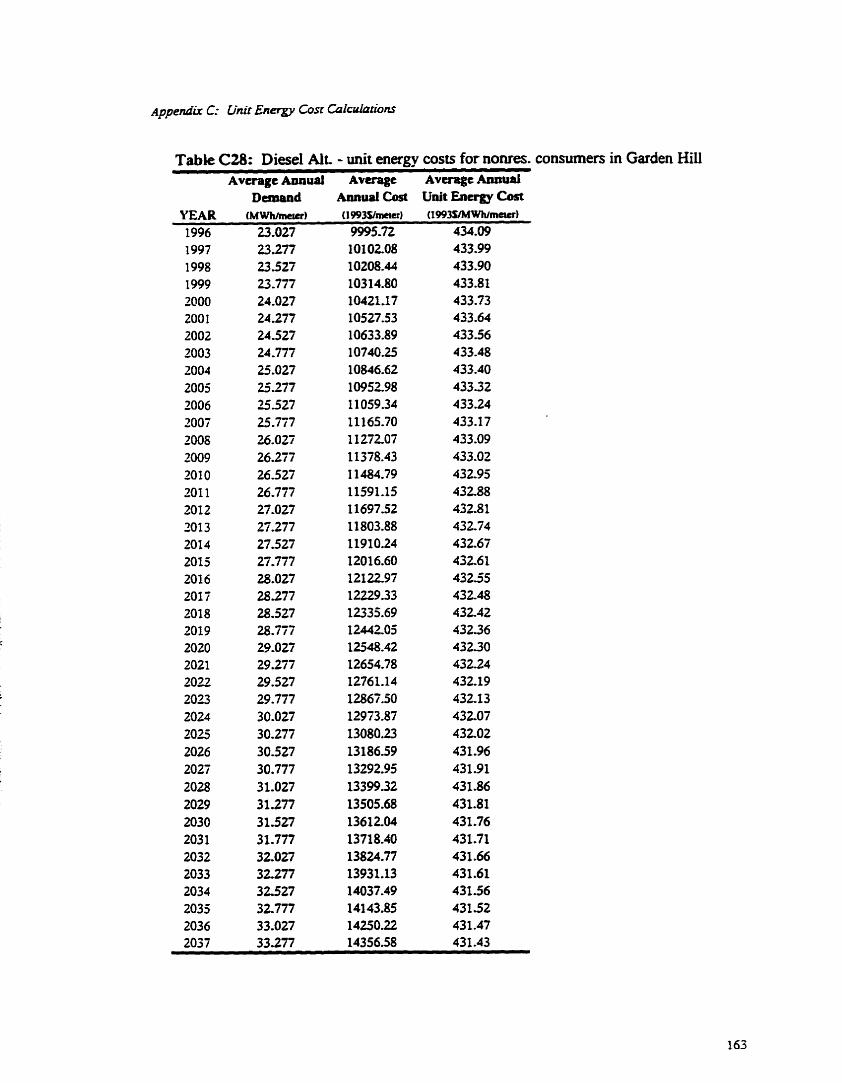
Table CU: Diesel A ~ L - unit enerm costs for nonres. consumers in Garden Hi11

Table C29: Land Iine Ait. - unit energy cosu for res. consumers in Garden Hill Average Annual First Second Average Average Annual
Demuid Block Block A n a d Cost Unit Encrgy Con

Table C30: Land h e Ait - unit energy costs for nomes. cons. in Garden Hiii AvuageAnud Fm Second Thid Average Average Annual
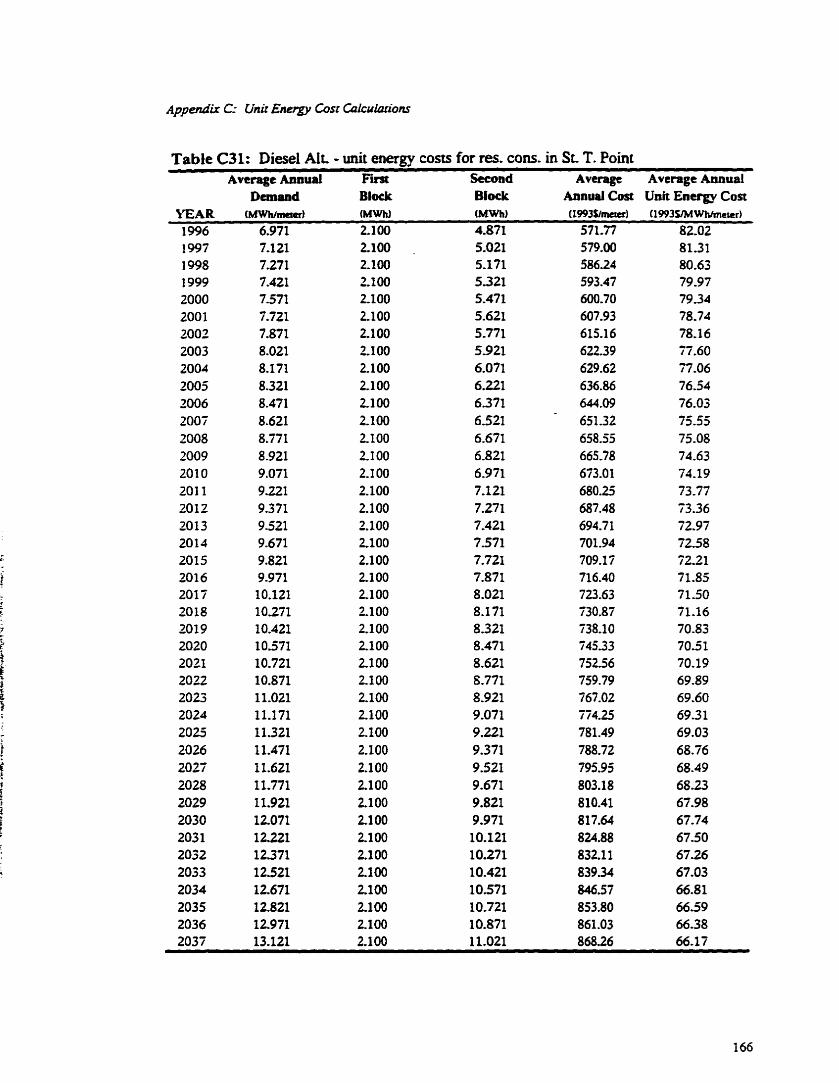
Table C31: Diesel Ait - unit energy costs for res. cons. in St T. Point Avctage Anaual Fim Second Average Average Annual
Dtmand Bloeir Block Annu ai Cost Unit En- Cost

Table C32: Diesel Ait. - unit energy costs for nonres. cons. in SL T. Point Average Aaouai A V ~ ~ C Average Annual
Dcmand A n a d Cost Unit Energy Cost

Appendir Cr Linil Energ)> Cost Cpicuiatiom
Table C33 : Land Iine Ait - unit energy wsts for res. cons. in St T. Point Average A ~ u d Frst second Average Average Annuaf
Demand Block Blo& Aonual Cost Unit Eaergy Cost YEAR [MWïimieia) (MWtr) (MWM (1993Shc~tr) ( ~ ~ 9 3 Y M ~ r n e c e r )
1996 2.100 4.871

Table C34: Land Iine Alt - unit en. costs for nonres. cons. in St. T. Point Average Amud First Second Thid A v q c Average Annual
Dunand Block Block Blodc Annual Cost Unit Energy Cost
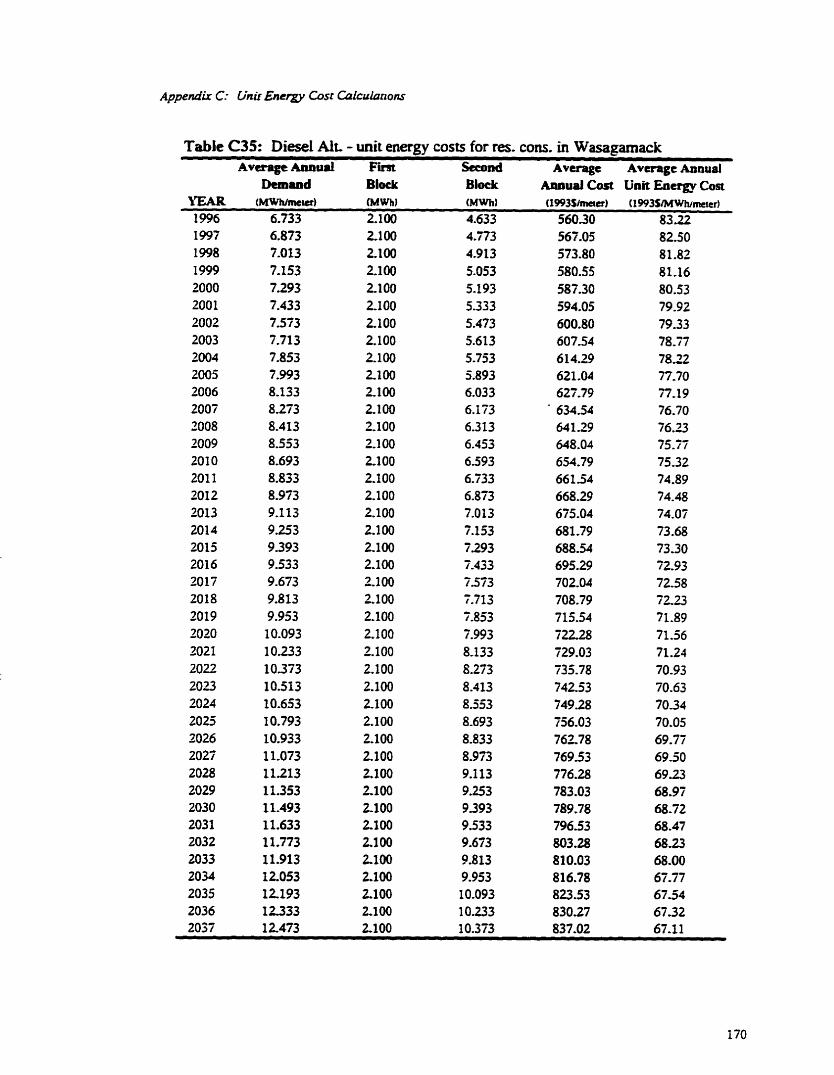
Table C35: Diesel Alt - unit energy COSU for res- cons. in Wasagamack AvtrageAnnud F i Second Average Average Annual
Dtmand Blotk Block h n u d Cost Unit Eacrgy Cos YEAR tMWnImcter) (MWh) ( M W ) (f 993Simcia) (1993S1MWt~meter)

Table C36: Diesel Alt. - unit energy costs for nomes. A v q t Annual Average Average Annual
Dtmmd AnnuaJ Cost Unit En- Cost
wns. in Wasagamack


A p p e h C: Unir E n e w Cost Cdcuhriom
Table C38: Land h e Ait. - unit en. costs for nonres. cons. in Wasagamack Average Annual First Second Third Average Average Annual
b a n d Block Blodr Blods Annual Cost Unit Energy Cost YEAR ( M W ) i h n e t a l (MWh) (MWh) (MM) (1993S1rnctd (l993SlMWhlmeud
1996 61.767 13.080 20.000 28.687 3047.68 49.34

Appendix D:
Distributive Fairness Measure

Red St. Cross Ndson Spüt Oxford G d Go& Sucker Garden Tbercsa Wara-
YEAR Lake Houst Lake House Lake River Lakt HiII Point gamack 201.02 200-89 20553 124.08 121.12 113.48 111.08 115.24 111.08 113.47

Tabie DZ: Diesel scenario - invatemporai SOAD of unit energy wsts for n o m . cons. Red St
Cross Nelson Split Oxford Gods Gods Sucker Garden Thcresa Wasa- YEAR Lake Home Inkt Hausc Lake River Lake Hill Point gamack
271 2-00 2714.81 2713.09 1174.45 1 l 7 f -44 119421 1179.38 l 177.04 1174.45 l180,tj

Table D3: Land Iine scenario - intratemporal SOAD of unit energy costs for res. cons. Red St.
Cross Nelson Split Oxford Gods Gods Sucker Garden Tiiercsa WM- YEAR Lake House Lake House Lake River Lake Hiil Point gamack 1996 102.89
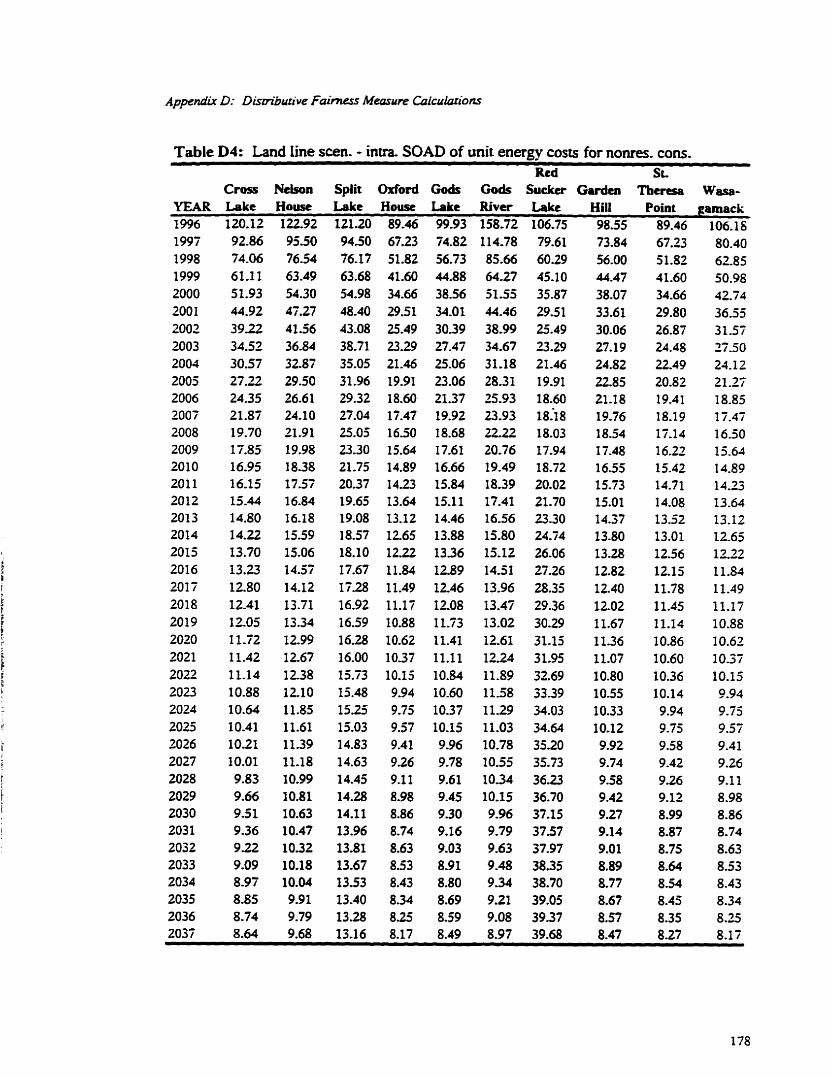
Table D4: Land Iine scen- - inm. SOAD of unit energy COSU for nomes. cons. Red Sc.
Cross Nelson Split Oxford Gods Go& Sucktr Garden Tberesa Wasa-
1996 1997 1998 1999 2000 ZOO 1 2002 2003 2004 ZOOS 2006 3007 2008 2009 2010 201 1 2012 202 3 2014 2015 2016 2017 2018 201 9 2020 2021 2022 2023 2024 2025 3026 2027 2028 2029 2030 203 1 2032 2033 2034 2035 2036 2036
YEAR Lake House Lake House Lake River takt Hill Point gamack 120.12 122.92 121.20 89-46 99-93 158.72 106.75 9855

- - - -
Table DS: Diesel scenario - inter. SOAD of unit energy costs for res. consumen Red SL
Cross Nelson Sptit Oxford Gods Gods Suckcr Garden Tbensa Wasa- YEAR Lake Housc Lake House Lake River Lake Hill Point gamack
1996 45.25 45-47 40.51 440.21 412.28 467-18 465.95 351-08

Table D6: Diesel scenario - htenemporai SOAD of unit energy costs for nomes. cons. Red SL
Cross Neka Split Oxford Gods Gods Sucker Garden Thcresa Wasa- YEAR Lake House Lake House Lake R i v u Lake HiU Point garnack
15006 15093 15666 15536 15069 15133

Tabie D7: Land iine scenario - intertemporai SOAD of unit energy costs for tes. cons- - - Red St.
Cross Nelson Spüt Oxford Gods Gods Sucktr Garden Tberesa Wasa- YEAR Lake House Lake House Lake River Lake Hill Point gamack 1996 45-25 45-47 40.51 229.80 241.31 164-33 16S.Z 279.69 1997 1998 1999 2000 ZOO 1 2002 2003 2004 2005 2006 2007 2008 2009 201 O 201 1 2012 2013 2014 2015 2016 2017 2018 2019 2020 2021 2022 2023 2024 2025 2026 2027 2028 2029 2030 2031 2032 2033 2034 2035 2036 203 7

Table DB: Land Iine scenario - inter. SOAD of unit enetgy cosu for nonres. cons. R d St.
Cross Nelson Split Odonl Gods Go& Sucker Garden Thetesa Wasa- YEAR Lake House Lakt House Lake River Lake HiU Point gamack
1996 238.49 255.79 227.16 706.81 370-89 432.74 200.85 405.45 478.24 1017.47

Table D9: Innatemporal disnibutive fairness measure magnitudes Diesel Alternative Land Liae Ahvaative
Non Non YEAR Residential nsideatial Residential nsidential 1996 0.10 026 0.06 0.10

Table DIO: htertemporal distributive fairness measure magnitudes .
D i d Aiternative Land Line Alternative Non Non
-- -
Cross Lake 0.01 0.01 0.01 0.01 Nelson House 0.01 0.01 0.01 0.01 Split Lake 0.01 0.0 1 0.01 0.01 Oxford House 0.01 0.0 1 0.01 0.01 Gods Lake 0.01 0.0 1 0.0 1 0.01 Gods River 0.01 0.0 1 0.0 1 0.01 Red Sucker Lake 0.01 0.01 0.01 0.01 Garden Hill 0.01 0.0 1 0.01 0.01 St Theresa Point 0.01 0.01 0.0 1 0.01 Wasagarnack 0.01 0.01 0.01 0.01 AVERAGE 0.01 0.01 0.01 0.01