m&a deal report - sparke helmore lawyers · reopening of china’s capital markets ... (slide...
TRANSCRIPT

1
M&A Deal Report May 2015
Contact: Nick Humphrey
Partner and Head of Corporate
Sparke Helmore Lawyers
tel + 61 2 9260 2747

Global activity in 2014
Australian activity in 2014
Sparke Helmore Deal
Trends Report

3
Global M&A highlights
Dramatic rebound in global M&A for
calendar year 2014 (only 11.8% by value
below 2007 peak levels)
Global 2014 saw a 44.7% increase by value
(US$3,230bn) on 2013’s total
(US$2,232.5bn)
US record levels with a 55.6% increase by
value (US$1,409bn) on 2013’s total
(US$900.1bn) and a 21.5% increase in deal
count (4,782)
Best year for Asia Pacific M&A on record
(62% increase on 2013 levels)
European M&A up 55%
Close to pre-GFC levels Global quarterly trend
Sources: Mergermarket 2014 M&A Deal Trend Report, Thomson Reuters Mergers and Acquisitions Review – Financial Advisors Full Year 2014

4
Australian M&A activity
Australian-announced M&A up 20% (US$119.8bn), the highest full year total since 2011
Large deals v mid-market
Source: Baker Tilly Pitcher Partners Dealmakers: Middle Market M&A in Australia 2015
16%
43%
18%
7%
7%
5% 4%
US$0m - US$9m
US$10m - US$50m
US$51m - US$150m
US$151m - US$250m
US$251m - US$500
US$501 - US$1,000m
>US$1,001m
Increase in large-value transactions
continued into Q1 2015 (e.g
Federation Centres/Novion Property
Group (US$8.2bn) and Japan Post /
Toll Holdings (US$6.3bn))
However, mid-market transactions
(US$10m to US$ 250m) still accounted
for 68% of all Australian M&A in 2014

5
Global private equity
Global record in private equity exits by both value
(to 21.4% above 2007's peak) and number of deals at
2,054
Strategic buyers bought 715 PE portfolio
companies (13% more than in 2013) for
US$303bn (a 91% jump) – led by the sale
of Alliance Boots by KKR to Walgreen
Global buy-out backed IPO’s numbered 210 (20%
more than in 2013) with a value of US$86bn (up
48%) – Asia Pacific IPO numbers buoyed by the
reopening of China’s capital markets (eg US$21.8bn
listing of Alibaba)
60% of assets sold had been held for more than five
years with fewer than 10% held for less than three
years. Fund-raising and investments remained steady
Record exits Global trend
Source: Bain & Company Global Private Equity Report 2015
6
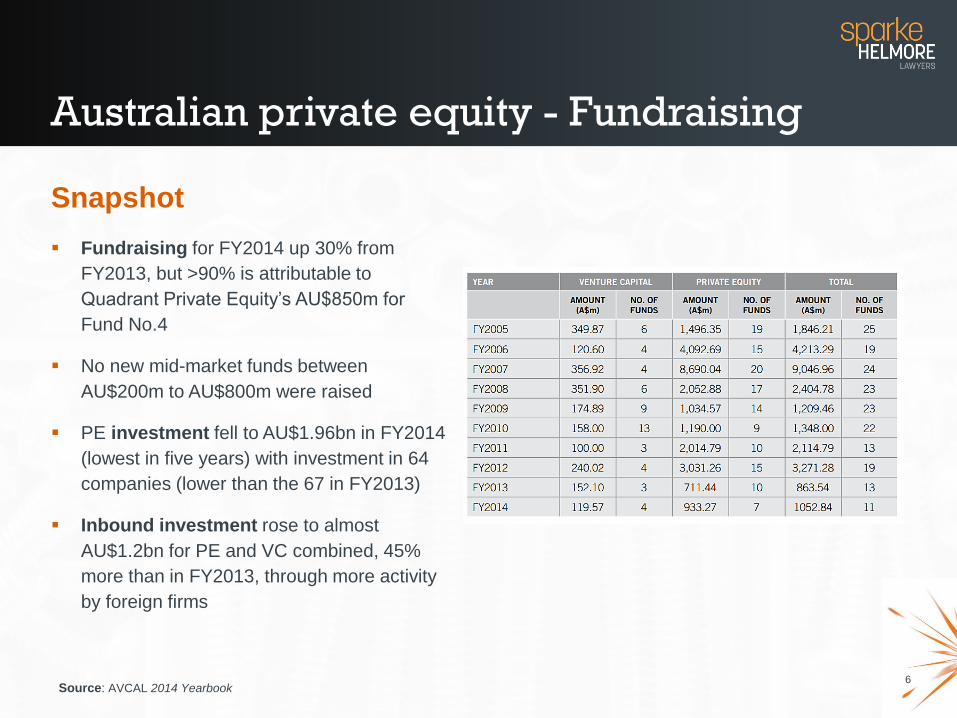
Australian private equity - Fundraising
Fundraising for FY2014 up 30% from
FY2013, but >90% is attributable to
Quadrant Private Equity’s AU$850m for
Fund No.4
No new mid-market funds between
AU$200m to AU$800m were raised
PE investment fell to AU$1.96bn in FY2014
(lowest in five years) with investment in 64
companies (lower than the 67 in FY2013)
Inbound investment rose to almost
AU$1.2bn for PE and VC combined, 45%
more than in FY2013, through more activity
by foreign firms
Snapshot
Source: AVCAL 2014 Yearbook

7
Australian private equity - Exits
FY14 exit proceeds were highest in five years, led by
upturn in Australian equity capital markets: 29% of portfolio
company exits and 63% of total divestment at cost
Source: AVCAL 2014 Yearbook

8
Other key statistics
IPO market was strong with 74 floats raising $26bn (56 in 2013
raising $11.9bn)
Australia saw considerable interest from overseas investors
including PE funds and Sovereign Wealth in financial services,
education, agriculture
Healthy tech sector with active angel groups and venture investors
Strong IPO market means private M&A having to compete on price
and terms (so high multiples, less warranty protection and less
earn-outs)

9
Sparke Helmore
Deal Trends
Report

10
We reviewed 79 share purchase agreements (SPA) over last 3 years
We focused on mid-market and excluded deals over $250m
Broad spectrum of deal sizes with average around $30m
We had mixture of roles (buyer, seller, management, insurer)
There were dozens of different law firms (so reasonable test of
market custom)
25% = total deals involving a PE fund, VC fund or sovereign wealth
fund
23.6% include a cross-border element
Sparke Helmore Deal Trends Report
11
Deal Trends Report - general
Broad range of structures used
When referring to what is “customary”, note:
Some mechanisms interrelated (if you have protection of W&I
insurance, parent guarantee or escrow may be less likely to
push other protections)
Depends on pricing, balance of power, regional differences
In competitive deals (auction situation) more likely to be seller
friendly
Depends on “house rules” (big difference between trade deal,
receiver sale and PE deal)

12
Warranties

13
Warranties – escrow
Escrow or retention amount for potential warranty
breaches
Of those deals that used an escrow amount, what
number also used W & I insurance?
Australia
12%
22%
US deals included an escrow or holdback
Size of escrow
Escrow period
US
97%
Avg 11.8%
Avg 18 months
Source: SRS Acquiom M&A Deal Terms Study
14
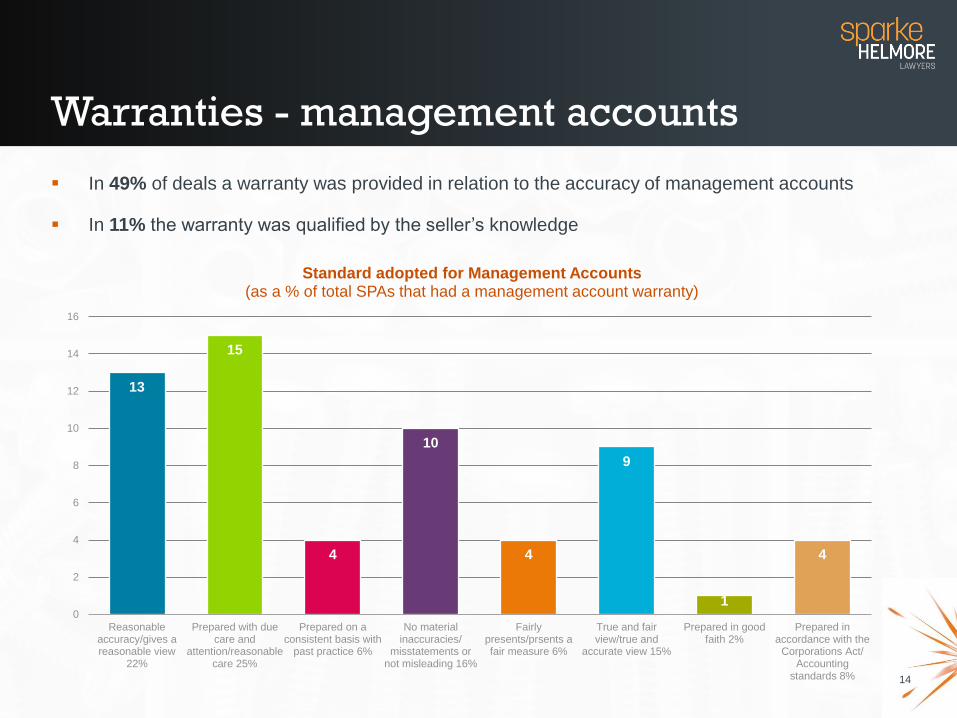
Warranties - management accounts
In 49% of deals a warranty was provided in relation to the accuracy of management accounts
In 11% the warranty was qualified by the seller’s knowledge
13
15
4
10
4
9
1
4
0
2
4
6
8
10
12
14
16
Reasonableaccuracy/gives areasonable view
22%
Prepared with duecare and
attention/reasonablecare 25%
Prepared on aconsistent basis with
past practice 6%
No materialinaccuracies/
misstatements ornot misleading 16%
Fairlypresents/prsents afair measure 6%
True and fairview/true and
accurate view 15%
Prepared in goodfaith 2%
Prepared inaccordance with the
Corporations Act/Accounting
standards 8%
Standard adopted for Management Accounts (as a % of total SPAs that had a management account warranty)

15
Warranties - general statistics
Australia US
Specific seller indemnities 44%
Disclosure letter/schedule 60% High
Seller was permitted to disclose data room generally against warranties 63% Low
Warranty provided for quality of data in data room 65%
‘No undisclosed liability’ warranty 32% 94%
Of those deals, the warranty was qualified by the seller’s knowledge 21% 5%
Right for the buyer to terminate prior to closing for breach of warranties 29%
Of those, the termination right could only be triggered if the breach had a
material adverse affect 50%
Source: Private Target Mergers & Acquisitions Deal Points Study (2013) (slide 47)

16
Warranties – time limits (other than tax and title)
US deals
Source: 2014 SRS Acquiom M&A Deal Terms Study
6%
27%
4%
36%
8%
16%
3%
24 months +
24 months
>18 months <24months
18 months
>12 months <18months
12 months
Less than 12 months
Australian deals
0%
13%
0%
52%
9%
26%
0%
24 months +
24 months
>18 months <24months
18 months
>12 months <18months
12 months
Less than 12 months

17
Warranties – Tax/Title Warranties
In 76% of our deals there was a cap on claims for breaches of title/tax warranties
3% 5%
5% 3%
16%
68%
Australian deals (% of purchase price)
0% - 25% 26% - 49% 50%
51% - 75% 76% - 99% 100%
0%
10%
20%
30%
40%
50%
60%
70%
80%
90%
100% more than7 years
7 years
5 years
Less than5 years
Australian deals (Time Limit in Tax Warranty claims)

18
Warranties - aggregate claim thresholds
Aggregate threshold for warranty claims: 68% of our deals 97% US deals
56%
25%
8%
11%
Australian deals
0.0% - 1.0% (56%) 1.1% - 2.0% (25%)
2.1% - 3% (8%) 3.1% + (11%)
89%
8%
2% 1%
US deals
0.0% - 1.0% (89%) 1.1% - 2.0% (8%)
2.1% - 3.0% (2%) 3.1% + (1%)
Source: SRS Acquiom M & A Deal Terms Study 2014 (slide 59)

19
Warranties - de minimus thresholds
Minimum claim threshold: 71% of our deals 20% US deals
45%
28%
10%
11%
6%
Minimum claim thresholds- Australian Deals (as % of purchase price)
0.0 - less than 0.1 (44%)
0.1 - less than 0.5 (27%)
0.5 - less than 1.0 (11%)
1.0 - less than 1.5 (11%)
1.5+ (7%)
Source: US data from SRS Acquiom M & A Deal Terms Study 2014 (slide 63)

20
Warranties - caps on claims (other than title and tax)
In 78% of our deals there was a cap on claims for breaches of seller warranties.
12%
12%
34%
17%
8%
17%
Australian deals (as % of purchase price)
0% - 25% 26% - 49% 50%
51% - 75% 76% - 99% >=100%
Source: SRS Acquiom M & A Deal Terms Study 2014 (slide 66)
Mean = 12.9%
Median = 10.00%
Minimum = 2.00%
Maximum = 53.2%
US deals (as % of purchase price)

21
Purchase price
adjustments
(other than earn-
outs)

22
Purchase price adjustments
Australian deals US deals
No AdjustmentProvision (48%)
IncludesAdjustmentProvision (52%)
Source: Private Target Mergers & Acquisitions Deal Points Study (2013) (slide 13)
No AdjustmentProvision (15%)
IncludesAdjustmentProvision (85%)

23
Purchase price adjustments – adjustment methodology
Australian deals US deals
Net Debt (10%)
CapitalExpenditure (7%)
Net Assets (27%)
Net WorkingCapital (68%)
Other (14%)
Net Debt (10%)
CapitalExpenditure…
Net Assets (3%)
Net WorkingCapital (91%)
Other (35%)
Purchase price adjustment paid only if exceeds threshold: 4% of our deals 9% US deals
Source: Private Target Mergers & Acquisitions Deal Points Study (2013) (slides 13; 19)

24
Locked Box Mechanisms
Source: ‘The ‘locked box’ mechanism - brings more certainty to M & A transactions’, PriceWaterhouseCoopers
Australian Deals UK Deals US Deals
In 5% of our deals, the
purchase price was
determined via a ‘locked
box’ mechanism
In 25% of deals with a
‘locked box’ mechanism
there was a private
equity, venture capital or
sovereign wealth fund
involved
In approximately 50% of
UK deals, the purchase
price is determined via a
‘locked box’ mechanism -
this figure is increasing
Locked Box Mechanisms
are very rare in US deals

25
Earnouts

26
Earnouts
Australian deals US deals
% of deals with earn-out 23% 13%
Earn-out was referrable to
EBITDA/earnings 80% 20%
Median earn-out duration 20 months 27 months
Source: SRS Acquiom M&A Deal Terms Study (slide 18)

27
Earnouts – period of earnout
48 months(5.5%)
36 months(17%)
>24 to <36 months (5.5%)
24 months(22.5%)
>12 to <24 months (5.5%)
12 months(16%)
<12 months(28%)
Source: Private Target Mergers & Acquisitions Deal Points Study (2013) (slide 21)
US deals Australian deals
not determinable(21%)
48 months(12%)
36 months(9%)
>24 to <36 months (3%)
24 months(18%)
>12 to <24 months (0%)
12 months(32%)
<12 months(6%)

28
Earn-outs – acceleration and covenants
Source: SRS Acquiom M&A Deal Terms Study 2014 (slide 19)
Of those deals with
earn-outs: Australia US
Covenant to run 17%
• 13% of US deals in 2013 had a
covenant to run in accordance with
seller’s past practices
• 20% of US deals in 2013 had a
covenant to run the business to
maximise earn-out payment clause
Acceleration clause 14%
• 13% of US deals had an acceleration
clause that accelerated payment
(fully or partially) on change in
control of earn-out assets
Lapsing clause 14%

29
Other key features
Non-cash consideration (scrip) was utilised in 20% of our deals.
In US deals, 21% of deals utilised scrip consideration.
Material adverse change (MAC) condition precedent more
commonly used than pre-GFC. 30% of our deals used a MAC
condition precedent; 94% of US deals in 2012.
In US in 2014:
only 11% of MAC include “prospects” (trending down from 24%
in 2010) - so more seller friendly;
95% of these conditions include “force majeure carve-outs”
(ie. material change other than due to change in economic
conditions, act of war or terrorism, change in law etc).
Source: SRS Acquiom M&A Deal Terms Study 2014 (slide 10); ABA Private Target Mergers & Acquisitions Deal Points Study 2013 (slide 67)

30
Warranty &
Indemnity (W&I)
Insurance

31
W&I Insurance
• W & I insurance was used in 9% of deals
• In 85% of deals that had W&I insurance it was taken out
by the buyer
• In 27% of deals where W&I insurance was used, the deal
also involved a private equity fund, venture capital fund
or sovereign wealth fund
• In 12% of deals that had W&I insurance, ‘new breach
cover’ was used in the policy

32
W&I Insurance
19% of deals that used W&I insurance had a foreign
buyer
19% of deals that used W&I insurance had multiple
sellers
7% of deals that used W&I insurance were a partial
sell-down of shares

33
About Sparke Helmore
Nick Humphrey Partner & Head of National Corporate Group
Sparke Helmore Lawyers
Tel: (02) 9260 2747
www.sparke.com.au
Sparke Helmore celebrated its 130 anniversary in 2012 and is an integrated, national full service law firm. Our
Corporate Group is dedicated to providing a boutique offering servicing mid-market M&A, banking and private equity,
delivering world class service and expertise. Our team combines senior partners and associates with experience
gained on some of the most iconic and cutting edge deals while working in top tier Australian and global law firms.
Sparke Helmore is a proud partner of the Australian Growth Company Awards, alongside Deloitte, Macquarie Capital,
Intralinks, MYOB, AVCAL, 2020 Exchange, The Australian and Private Equity Media.
Some of our key clients include Macquarie Bank, CHAMP Ventures, Anacacia Capital, Olympus Capital, Westpac
and AMP.
Nick Humphrey is the Head of Corporate and Head of Private Equity at Sparke Helmore. Nick chairs the annual
Australian Growth Company Awards and wrote the Australian Private Equity Handbook (CCH), a plain English guide
with step-by-step advice on implementing PE transactions. Nick has been recognised by a number of influential
awards as one of Australia's leading private equity and M&A lawyers, including PLC, Chambers & Partners Asia, The
Legal 500 Asia Pacific, IFLR, Euromoney’s Guide, AFR’s Best Lawyers and Global Private Equity Counsel. He was a
finalist for Dealmaker of the Year and The Partner Award in the Lawyers Weekly Australian Law Awards