m&a negotiations and lawyer expertise · 2017-02-16 · m&a negotiations and lawyer...
TRANSCRIPT

M&A Negotiations and Lawyer Expertise
Christel Karsten Strategy&
Ulrike Malmendier UC Berkeley and NBER
Zacharias Sautner Frankfurt School of Finance &
Management
March 2015
Abstract
We shed light on the effects of lawyer expertise on contract design in the context of M&A negotiations. Using proprietary data on 151 private transactions, we document that more lawyer expertise is associated with more beneficial contract outcomes in terms of risk allocation and prices. Higher legal expertise does not come with larger legal fees, as high‐expertise lawyers economize on transaction costs by reducing the length of negotiations. We address concerns about the endogenous allocation of lawyers by performing fixed‐effects analyses and by exploiting firms’ inclination to work with the same lawyer on subsequent deals. Our results help explain the importance of league tables and variation in legal fees within the M&A services industry.
__________________
Contact Details: Christel Karsten, PwC Strategy& (Netherlands) B.V., Apollolaan 151, 1077 AR Amsterdam, The Netherlands, [email protected]; Ulrike Malmendier, Department of Economics and Haas School of Business, University of California, Berkeley, CA 94720, USA, [email protected]; Zacharias Sautner, Frankfurt School of Finance & Management, Sonnemannstraße 9‐11, 60314 Frankfurt am Main, Germany, [email protected]. We would like to thank seminar participants at the NBER Organizational Economics Meeting, the Joint Berkeley‐Stanford Finance Seminar at Berkeley, EFA 2014 in Lugano, the Legal Innovation: Law, Economics and Governance Conference at Columbia University, Conference on the Future of Corporate Governance and Intellectual Property Protection in Rio de Janeiro, Northwestern University, Technical University Munich, University of Michigan, UCLA School of Law, and Peter Cziraki, David Denis, Rüdiger Fahlenbrach, Roman Inderst, Josh Lerner, Florencio Lopez‐de‐Silanes, Ron Masulis, Joe McCahery, Suresh Naidu, Daniel Paravisini, Urs Peyer, Marcos Pintos, Michael Schouten, Alan Schwartz, Denis Sosyura, Randall Thomas, Jaap Winter, and Bilge Yilmaz for helpful comments. All errors are our own. Comments are very welcome.

1
1. Introduction
Contracts play a fundamental role in markets. As MacLeod (2007) puts it, “The ability to enter
into binding agreements is […] an essential ingredient of economic growth.” Yet, the economic
analysis of contract design is still largely dominated by the traditional contract‐theory prediction of
optimal equilibrium contract design. While our standard models acknowledge the role of
informational asymmetries, financial constraints, and similar frictions, there is little room for “well‐
designed versus less well‐designed” contracts in these theories.
In this paper, we provide evidence on the effects of the negotiating parties on contracts. We
test whether empirical contract design reflects the experience or educational background of the
lawyers involved in the contract negotiations. If these factors partially influence contract design, this
may cause deviations from optimal contracting where contracts should primarily address the
economic environment of a transaction. Such effects are ignored under the standard paradigm of
“optimal contract design,” but are likely to be important in practice.
We investigate these questions in the context of acquisitions of private companies.1 The
traditional view, and null hypothesis, is that negotiation outcomes are driven by deal characteristics,
but are unaffected by the relative legal expertise of the negotiating lawyers. We test this null
hypothesis against the alternative view that lawyers affect negotiations and contractual outcomes in
a measurable way. In particular, we test whether lawyers with more expertise distribute value away
from the counterparties and towards their own clients (competitive‐advice hypothesis).
We test these hypotheses using contracts signed between buyers and sellers in 151
acquisitions of privately‐held targets. These unique and proprietary data were made available by one
of the largest law firms in The Netherlands. To test for the competitive‐advice hypothesis, we create
for each transaction an index that captures the expertise of the buyer lawyer relative to that of the
seller lawyer. We construct this index for the two parties’ lead lawyers, who are usually partners at
their law firms and oversee all legal aspects of negotiations for their clients. Our index spans different
dimensions of legal expertise, covering aspects of both experience and education.2
We start with an analysis of the effects of lawyers’ expertise on key contract clauses that
represent the diverging interests of buyers and sellers. A large legal literature discusses the
importance of getting the details of contract provisions right, “as big money can turn on how a
1 Acquisitions of privately‐held targets are important economic transactions and constitute the majority of all mergers and acquisitions (Erel, Liao, and Weisbach (2012); Betton, Eckbo, and Thorburn (2007)). 2 Our sample contains leading international law firms, including eight top 10 firms according to a ranking based on deal volume.
2
particular clause in the acquisition agreement is drafted” (Miller (2008), p.197). We focus on
provisions that have been identified by legal literature as being crucial in negotiations, in particular,
provisions that allocate risk. These provisions speak to the competitive‐advice hypothesis relative to
the null hypothesis as, for a given price, the buyer prefers to allocate a maximum level of risk to the
seller, while the seller prefers the opposite.
One crucial channel of risk allocation are guarantee statements by the seller about the
quality of the target (“representations and warranties” or simply “warranties”). Freund (1975, p.229)
argues that “I’m willing to bet my briefcase that lawyers spend more time negotiating
‘Representations and Warranties of the Seller’ than any other single article in the typical acquisition
agreement.” Martinius (2005, p.36) states that “representations and warranties […] often cover more
than 50% of the purchase agreement and are the primary means to protect the buyer.” While
warranties themselves are not necessarily used to allocate risk (but rather as a signaling tool to
overcome asymmetric information), risk allocation is negotiated through three clauses attached to
warranties, which affect their scope and enforceability.
First, warranties may come with the statement “so far as the seller is aware,” which renders
them unenforceable unless the buyer proves that the seller had knowledge of a warranty violation.
The buyer, therefore, prefers the inclusion of few knowledge qualifiers, whereas the seller prefers
many.3 Our first measure of risk allocation is the percentage of warranties without knowledge
qualifiers. As a refinement, we use the absence of a knowledge qualifier in one particular warranty
where risk allocation (but not signaling) is particularly likely, the legal compliance warranty. This
warranty states that the business of the target is conducted in compliance with all applicable laws. It
is highly unlikely that a seller has full information when providing this warranty; a knowledge
qualifier therefore primarily allocates risk. A second clause is the materiality qualifier, which is an
overarching qualifier that states that any warranty needs to be violated in “a material respect.” This
clause also reduces enforceability by the buyer who, as a result, prefers that warranty breaches do
not need to be material; the seller again prefers the opposite. Legal literature has identified these
qualifiers as the key provisions in negotiations over warranties (e.g., Freund (1975); Martinius (2005);
Miller (2008)).4 A third important clause concerns indemnification. Naturally, the buyer’s risk is larger
3 The difference between signalling and risk allocation can be illustrated with an example. Suppose the seller includes the warranty: “There is no breach of the target’s IP rights by another party.” If the seller is uncertain whether such a breach occurred, the warranty helps to overcome information asymmetry, but it leaves the risk with the seller. Suppose, to the contrary, that the seller adds a qualifier: “So far as the seller is aware, there is no breach of the target’s IP rights by another party.” The warranty now still helps to overcome information asymmetry, but it reallocates risk from the seller to the buyer. 4 Miller (2008, p.218) states that “it makes a significant difference to the potential economics if there are materiality and knowledge exceptions.” He argues that “[next to knowledge qualifiers] the other major battle that is fought in the

3
if the seller has insufficient funds to indemnify her as a result of a warranty misrepresentation. The
buyer can be protected against this risk by requiring that parts of the target price are put aside as
collateral. We measure what percentage of the price is secured as a source for indemnification.
After controlling for the acquisition price and deal characteristics, we find that more relative
legal expertise on the buyer side is associated with more risks allocated to the seller, consistent with
the competitive‐advice hypothesis. Specifically, more buyer lawyer expertise comes with more
warranties without knowledge qualifiers, a higher probability that the legal compliance warranty is
not qualified, and a higher probability that warranty breaches do not need to be material. Seemingly,
seller lawyers that face buyer lawyers with high expertise fail to follow the advice in Miller (2008,
p.240): “Add materiality and knowledge qualifiers wherever possible.”
Another important risk in acquisitions arises from adverse events between signing and
closing dates. As a default, this risk lies with the buyer, who contractually agrees to purchase the
target at a given price. Contracts can shift this risk to the seller by including a MAC clause, which
allows the buyer to cancel the deal if the target suffers a material adverse change (MAC). While the
buyer prefers the inclusion of such a clause, the seller favors not to carry this risk (e.g., Denis and
Macias (2013); Gilson and Schwartz (2005)). Consistent with the competitive‐advice hypothesis, more
relative expertise of the buyer lawyer increases the probability that a MAC clause is added. In
addition, more buyer legal expertise comes with shorter closing times, which benefits the buyer by
reducing agency problems at the target. (Long closing times allow the seller to extract private
benefits as she keeps control over the target.)
We then study the bargaining dynamics to understand the channels that high‐expertise
lawyers use to influence negotiations in their clients’ favor. In particular, we assess which party is
allowed to provide the first contract draft. This is a crucial element, as it creates a first‐mover
advantage by setting an anchor or reference point for the upcoming negotiations (Molod (1994);
Hart and Moore (2008)). Law firms usually have buyer‐ and seller‐friendly model contracts, which
they try to use as starting points when drafting contracts. Freund (1975, p.26) writes “in negotiating
acquisitions, the axiom is: If you have an opportunity to draft the documents, do so; you will jump into
the lead, and your opponent will never catch up completely.” Consistent with this advice, we find that
more expertise is associated with a higher probability that a party can deliver the first draft.
representation section is the extent to which the Target is permitted to make representations that are qualified by ‘materiality’.”

4
A challenge in interpreting our estimates is the question of endogenous lawyer matching. If
better lawyers predict better outcomes, does this reflect the causal impact of their expertise, or are
better lawyers simply able to associate themselves with more promising deals? Our two‐sided
approach, capturing both buyer‐lawyer and seller‐lawyer expertise, ameliorates part of this concern.5
Nevertheless, the concern remains that lawyers are endogenously assigned to deals or clients,
implying that relative lawyer expertise may spuriously reflect unobserved deal or target
characteristics. This concern is particularly relevant for the lawyers of the firm that provided the
data, as they advise a buyer or seller in each sample deal.
We follow Ackerberg and Botticini (2002) on how to address endogenous matching in
empirical analyses of contract design. We first show that our results are robust to using three fixed‐
effects estimations that account for different endogeneity concerns. We first employ drafting‐law‐
firm fixed‐effects that address the concern that law firms and deals are matched based on the model
contracts that law firms use as starting points when drafting contracts. These model contracts may
reflect law firms’ deal specialization or inherent deal expertise, which is a concern if deals are
assigned to law firms based on these “off‐the‐shelf” models. We next use client fixed‐effects to
address the concern that lawyers and clients are matched based on unobservable client
characteristics. For example, clients with high bargaining power may match with high‐expertise
lawyers; the relation between contract design and lawyer expertise may then reflect client
bargaining power. Third, we estimate for the law firm that provided the data individual lawyer fixed‐
effects to alleviate the concern that lawyers attract or select specific deals based on their personal
unobserved characteristics. As we estimate the effects of relative lawyer expertise, these fixed‐
effects identify the role of relative expertise from variation in the expertise of the counterparty.
To further strengthen our identification, we show that our results hold in two subsamples
where concerns over endogenous lawyer assignments are largely attenuated. The first subsample
contains only deals where neither the buyer nor the seller has switched from a previously‐used law
firm to a new one. This analysis hence excludes deals where clients are potentially reassigned to new
lawyers in response to unobserved deal characteristics that vary over time. The second subsample
contains only deals where we know that our law firm has established a client‐law firm relation prior
to the transaction. The idea behind this analysis is that the initial assignment of a client to a law firm
may be driven by unobservables, but these past variables are unlikely to bias estimates of legal
5 Our results indicate that, for example, a “medium degree” of risk‐shifting to the seller could reflect both high and low lawyer‐expertise on both sides. A “somewhat stronger” degree of risk‐shifting can stem from the combination of high‐expertise buyer lawyers and medium‐expertise seller lawyers, or medium‐expertise buyer lawyers and low‐expertise seller lawyers.

5
expertise in transactions over future targets.6 We complement these tests with evidence showing
that client‐lawyer relations are relatively sticky, and to a large degree determined by a one‐time law
firm selection. For example, we find no evidence that deals are assigned to lawyers in response to
the (anticipated) counter‐party expertise.
To corroborate that our results do not reflect spurious correlations, we perform placebo
tests for contract clauses where we predict relative expertise to be irrelevant; these are clauses that
align the incentives of buyers and sellers. We show that relative expertise is unrelated to the number
of warranties and covenants, which serve important signaling and commitment functions and
thereby facilitate deal completion. Similarly, relative expertise is unrelated to earnouts and purchase
price adjustments, which both reduce information asymmetry about target profitability (Datar,
Frankel, and Wolfson (2001); Cain, Denis, and Denis (2011)). Finally, we show that expertise is only
used to affect knowledge qualifiers among warranties that primarily allocate risk, but not among
those that mainly overcome information asymmetry. These findings support Sen (2000) and Inderst
and Müller (2004), who show theoretically that bargaining over less‐adversarial clauses is unlikely.
To evaluate the economic value implications of lawyer expertise, we analyze the prices paid
for the targets. In all of our previous analyses, we controlled for the acquisition price to capture the
trade‐off between risk allocation and prices. While lawyers are generally not the primary parties
bargaining over prices, they may nevertheless directly affect prices through their efforts during the
legal due diligence and contract drafting process. For example, buyer lawyer expertise can help to
achieve price adjustments if target quality issues are spotted. Indeed, we find that more relative legal
expertise on the buyer side is associated with lower prices. These results are obtained after
controlling for deal characteristics, financial advisors, and the contract design. Further, we cannot
detect that prices reflect the negotiated contract terms, which suggests that lawyer with high
expertise negotiate better terms and ensure that their clients do not have to pay for them.
Having demonstrated that legal expertise comes with positive negotiation outcomes along
several dimensions, we have not yet addressed whether the associated costs neutralize or even
exceed those benefits. Our data allow us to approximate legal fees as we know the time that law
firms spend negotiating. The duration of negotiations is a key ingredient of fees as lawyers are
remunerated on a per‐hour basis (e.g., Garoupa and Gomez‐Pomar (2008)). After accounting also for
legal team size and law firm rank, we show that more legal expertise does not come with higher fees.
The driver of this surprising result is that expertise helps to shorten negotiation times, resulting in a
6 Coates et al. (2011) and Gilson, Mnookin, and Pashigian (1985) argue that lawyer‐client relations are usually long‐lasting due to uncertainty about lawyer quality.

6
lower legal bill. This suggests that high‐expertise lawyers negotiate beneficial contracts and
economize on transaction costs.
Our analysis complements papers that study the relation between law firm characteristics
and M&A outcomes. Coates (2012) studies how law firm expertise affects earnouts, price
adjustments, and indemnification clauses. Krishnan and Masulis (2013) study how the rank of law
firms affects completion rates and takeover premiums, and Krishnan and Laux (2008) relate law firm
size to deal completions and acquirer returns. Krishnan et al. (2012) show that shareholder litigation
affects M&A outcomes. We also relate to studies that show how characteristics of buyers and sellers
affect M&A outcomes (e.g., Stulz, Walkling, and Song (1990); Lang, Stulz, and Walkling (1991);
Harford (1999); Moeller (2005); Masulis, Wang, and Xie (2007); Bargeron et al. (2008)). Finally, we
complement evidence on the role of investment banks in M&A deals (e.g., Rau (2000); Servaes and
Zenner (2000); Kale, Kini, and Ryan (2003); Bao and Edmans (2012); Golubov, Petmezas, and Travlos
(2012); Ertugul and Krishnan (2011); Wang, Xie, and Zhang (2014)).
2. Data
Our sample is built around the files of 151 acquisitions of privately‐held targets between
2005 and 2010. The files have been made available by one of the largest law firms in The
Netherlands. The law firm acted as advisor of either buyers (86 deals) or sellers (65 deals). The files
contain the original acquisition contracts, information on the involved lawyers, and details on the
bargaining and pricing. If missing, we complete information on the lawyers with data from
Mergermarket, which contains also information on the financial advisors. We focus for each deal on
the two lead lawyers that are advising the buyer and seller, respectively. These lawyers are usually
partners at their law firms and identified in our files and in Mergermarket as the lead lawyers on a
transaction. To measure lawyer expertise, we collect data on each lawyer from the webpages of their
law firms, internet searches, and Mergermarket. We complement these data with financial
information on the buyers, sellers, and targets from Amadeus, national trade registers, or financial
statements. All financial variables are based on the year preceding the closing of a transaction.
Across our sample, 112 lead lawyers of 49 different law firms are involved in the
negotiations. Out of those law firms, 25 are headquartered in The Netherlands. The average lead
lawyer advises on 2.3 sample deals.7 The sample contains 20 lead lawyers from the law firm that
provided the data, and these lawyers do not specialize on either buy‐ or sell‐side transactions, but
advice on both.
7 The buyers (seller) were advised by 30 (36) different law firms and 66 (70) different lead lawyers. 17 law firms and 24 lead lawyers advised both sellers and buyers in the sample.

7
Table 1 Panel A contains information on the deals. Variable definitions are provided in
Appendix A‐1. The average purchase price paid for a target is EUR 222m. Only 9% of the deals are
asset deals; the rest are share deals where the buyer acquires target shares. (Only 8 deals in our
sample use equity as acquisition currency.) Buyers and sellers are relatively equal in terms of size,
with a median book value of EUR 1.4bn and EUR 2.1bn, respectively. Both parties also have similar
levels of deal experience; the median party performed four M&A transactions over the past five
years. Buyers (sellers) use in 5% (11%) of the deals the services of the internal in‐house legal
departments (rather than the advice of an external law firm). 44% of all transactions are
international (target and buyer from different countries), and a quarter is executed as a controlled
auction. We also report the rank of the involved law firms and investment banks. As in Krishnan and
Masulis (2013) and Beatty and Welch (1996), we categorize them based on whether they are ranked
in the top 10 based on deal volume between 1995 and 2010. Negotiations take on average 170 days.
Table 1 Panel B shows that our sample contains a wide range of different types of buyers and
sellers, including strategic parties (e.g., conglomerates), wealthy families, private equity firms,
financial firms, and governments. Strategic buyers and sellers make up the majority of the sample.
Table 1 Panel C and D contain the sample’s country and industry distribution. By virtue of the
location of our law firm, the majority of targets, buyers, and sellers are from The Netherlands.
Nevertheless, a substantial fraction of the targets (15%), buyers (41%), and sellers (21%) are located
outside this country (Panel C). More than half of all deals have at least one transaction party located
outside of The Netherlands (Panel D).
To evaluate potential sample selection issues, Appendix A‐2 compares characteristics of the
deals in our sample with those of other private acquisitions during the same period. We include in
the comparison sample all Mergermarket deals where at least one party is located in The
Netherlands; we thereby capture transactions that our law firm could have potentially advised on.8
We find that transactions in our sample are larger than those in Mergermarket, and our sample
naturally contains more targets and sellers from The Netherlands. Our sample also contains a
relatively higher level of legal and financial expertise.
8 To ensure comparability, the statistics in Appendix A‐1 for transactions in our sample are restricted to those 119 deals that are included in Mergermarket. Thus, some of the reported means deviate from those in Table 1.

8
3. M&A Negotiations and Lawyer Expertise: Process and Measurement
3.1 M&A Negotiation Process
This section provides an overview of the steps that are typically taken in one‐on‐one
negotiations surrounding private acquisitions (Appendix A‐3 describes these steps for auctions).
Negotiations usually begin with one party communicating interest in a deal. If a buyer initiates a deal,
this can be a simple statement of interest, whereas a seller typically approaches potential buyers
with a few pages of target information (a “teaser”). From then until the signing, the seller faces a
trade‐off between providing information to attract or improve an offer, versus withholding sensitive
details in case the deal is cancelled. If there is mutual deal‐interest, both parties enter into a non‐
disclosure agreement (NDA) and commit to keep information confidential. The preparation of an
NDA is generally the moment where lawyers are called into the negotiations.
In spite of the NDA, the seller often does not yet provide open access to the target’s books.
The parties first evaluate whether they think along a similar target price range. To facilitate an initial
offer from the buyer, the seller provides additional information about the target in an information
memorandum (IM). Based on the IM, the buyer typically provides an initial non‐binding offer, which
is a high‐end estimate, i.e., a price that the buyer offers if “no skeletons appear in the closet.” If this
offer does not discourage the seller, the lawyers write down initial agreements in a letter of intent
(LOI). Most parts of the LOI are non‐binding and its main purpose is to provide a structure to the deal
to avoid miscommunication and to set a timeline for contract negotiations. In addition, the LOI
contains a binding exclusivity clause, which prohibits the seller from entering into negotiations with
other bidders for a specific period of time. After the signing of the LOI, the buyer is granted access to
the most relevant target data in a due diligence process. As a due diligence can be time‐consuming,
lawyers usually proceed simultaneously with contract negotiations.
Contract negotiations start with a draft contract provided by the lawyer of one of the two
parties. This first draft is a combination of a standard sample contract and deal specifics. Law firms
generally have different sample contracts, depending on whether they represent a buyer or seller,
and the first draft contract is usually biased towards the own party. The counter‐party lawyer then
prepares a mark‐up on this document and indicates preferred changes. The lawyers extensively
discuss these changes and send various mark‐ups of the contract back and forth. This exchange can
continue over months. If the due diligence is on‐going during negotiations, concerns emerging about
the target quality may affect the contract design (e.g., a buyer may demand additional warranties).
The target price is often not part of these negotiations and mostly not mentioned in the draft

9
contract until late in the negotiations. While there is no explicit interaction at this stage between
pricing and contract design, the final price can be adjusted downward if issues appear that are not
fully mitigated in the contract (e.g., through warranties).
If the transfer of control (closing) does not occur at the signing date, the contract stipulates
conditions that need to be met before the closing. If these conditions are satisfied, there is no further
contract renegotiation after the signing. However, if some conditions are violated, for example the
MAC conditions, then the contract can be annulled and parties may renegotiate.
3.2 Measuring Negotiation Outcomes
We test whether lawyers with more expertise negotiate more favorable outcomes for their
clients. Our assumption is that lawyer expertise improves the bargaining position, such that more
favorable outcomes can be negotiated. We revert to bargaining theory to guide our analysis and to
predict for which outcomes we expect the strongest effects. Generally, negotiation outcomes can be
separated into those that create value for both parties, and those that distribute value among them
(e.g., Gilson (1984)). Rubinstein (1982) shows that relative bargaining power is crucial for surplus
distribution if two trading parties negotiate over outcomes where incentives are opposite. To the
contrary, Sen (2000) and Inderst and Müller (2004) show that relative bargaining power does not
matter for provisions that create value for both parties, as incentives are aligned over them. Thus, we
expect that relative expertise is primarily used to direct negotiations over adversarial clauses.
3.2.1 Contract Design
Acquisition contracts contain provisions that facilitate legal actions, mitigate information
asymmetry or agency concerns, and allocate risk between buyers and sellers. Provisions facilitating
legal actions address legal formalities or definitions and rarely require negotiations. Clauses that
address information or agency concerns are usually instruments that create rather than distribute
value and incentives are relatively aligned over such clauses (we will also show this with our data). To
measure the impact of relative lawyer expertise, we focus on provisions that allocate risks between
buyers and sellers, and which are identified by legal literature as being subject to extensive
negotiations (e.g., Gilson and Schwartz (2005); Miller (2008); Martinius (2005); Freund (1975)).9
One channel of risk allocation are warranties, which are statements about the quality of the
target that sellers make with the commitment to repay parts of the purchase price if any of them are
violated. Warranties can serve as a signaling device if sellers are better informed about the target
9 Appendix A‐4 provides an overview of these outcomes and the associated buyer and seller objectives.

10
than buyers (Grossman (1981); Spence (1977)). As a result, they help to reduce information
asymmetry and are in the interest of both parties. If, however, warranties cover issues that also
sellers are not entirely sure about, they allocate risk to sellers and provide insurance to buyers.10
Sellers can circumvent this risk allocation by adding a knowledge qualifier, which states that
a warranty is only true “so far as the seller is aware.” A warranty qualified with such a statement
cannot be enforced unless the buyer can prove that the seller was aware of the breach at the time of
signing (e.g., Freund (1975)). As a result, warranties with knowledge qualifiers allocate risk to buyers,
while those without them allocate risk to sellers. Our measure of risk allocation is, thus, the fraction
of warranties that come without knowledge qualifiers (%Warranties w/o Qualifier).11 For any given
price, buyers prefer the inclusion of few qualifiers, while sellers have the opposite incentives. Table 2
Panel A shows that 86% of all warranties do not have a knowledge qualifier attached to them.
Correlations of the contract variables are in Table 2 Panel B.
As a refinement, we identify one specific warranty where risk allocation (but not signaling) is
particularly likely, namely the legal compliance warranty. This warranty states that the business of
the target is conducted in compliance with all applicable laws. It is highly unlikely that a seller has full
information when providing this warranty. A knowledge qualifier for this warranty is therefore
primarily used to allocate risk. Our measure of risk allocation, Legal Compliance Warranty w/o
Qualifier, equals one if a contract does not contain a knowledge‐qualified legal compliance warranty,
and zero otherwise. Most legal compliance warranties do not have a knowledge qualifier (83%).
Sellers can further reduce the enforceability of warranties by adding a materiality qualifier,
which is an overarching clause stating that warranty violations can only be claimed if they are
material. This provides sellers with a strong defense as buyers need to prove that a warranty is
violated and that the damage is material (see Kling, Simon, and Goldman (1996)). As such, sellers can
limit their risk exposure by adding this qualifier. Our measure of risk allocation takes the value one if
warranty breaches do not need to be material, and zero otherwise (Warranty Not Material). About
80% of all contracts specify that warranty breaches do not need to be material.
Another warranty‐related provision concerns indemnification and the availability of funds in
case of a warranty breach. If sellers have insufficient funds to pay for the resulting damages,
warranties are worthless. To prevent this scenario, parts of the purchase price can be collateralized
10 That statement that there is no third party infringing on the target’s IP rights is an example of a warranty where it is
unlikely that the seller has full knowledge about whether it is accurate or not. 11 We define all contract‐design variables such that higher (lower) values reflect more risk being allocated to sellers
(buyers).

11
by placing it in an escrow account, by a cash reserve, or by a bank guarantee. Such secured funds are
valuable for buyers, as they increase the value of warranties, while they are costly for sellers. Our
measure of risk allocation is the percentage of the price that is put aside for the buyer as a source of
indemnification (%Payment Secured). Funds are secured in 47 deals, with the average collateral
equaling 16% of the price; this corresponds to an unconditional average of 5% across the sample.
Another important risk in acquisitions arises from adverse events between signing and
closing dates. If such events substantially reduce the value of the target, buyers may prefer to cancel
a transaction. However, having signed a contract and fixed a price, theys are required to complete
the deal and have to bear this risk. Contracts can shift this risk back to sellers through inclusion of a
MAC clause, which stipulates that buyers can refuse deal completion if the target suffers a material
adverse change (MAC). While buyers prefer the inclusion of such a clause, sellers favor not to carry
this risk. Our measure is a dummy variable, which takes the value one if the contract contains a MAC
clause. MAC clauses are present in only 34% of our private sample deals; this compares with 99% of
transactions in public takeovers (Denis and Macias (2013)).
3.2.2 Bargaining Process
Lawyers have incentives to direct the bargaining process in a way that is favorable to their
own clients. In particular, they have incentives to provide the first contract draft to get a first mover
advantage and to set a reference or anchor point (e.g., Freund (1975); Molod (1994); Hart and Moore
(2008)). The reason is that law firms usually have a buyer‐ and a seller‐friendly model contract, so
they have an advantage in the negotiations if they can start with a draft that is friendly towards the
own party. Our data allow us to identify which law firm provided the first draft, as the layouts of the
signed contracts contain the business labels of the law firms that drafted the first versions. Table 2
Panel A shows that the first draft comes in 44% of the deals from the buyer law firm.
As an additional aspect of the bargaining process, we measure the duration of the closing
process, which is time between the signing of the contract and the target transfer. Closing times are
sometimes necessary to apply for regulatory or shareholder approvals. Whereas the length of this
period is largely affected by the number of required approvals, lawyers may influence it by filing
documents more quickly or lobbying for faster responses. Buyers prefer short closing times as—with
the transaction price fixed—sellers remain in control of the target before the closing and can exploit
this by acting opportunistically. Our data indicate a considerable time period—about 46 days—
between signing and closing, making opportunistic seller actions a realistic concern for buyers.

12
3.3 Measuring Relative Lawyer Expertise
We create an index, Relative Lawyer Expertise, to proxy for the expertise of the buyer lead
lawyer relative to the seller lead lawyer. The index is based on six index components that each
capture relative expertise along a different dimension: (i) years as partner; (ii) deal experience; (iii)
M&A specialization; (iv) listing as an M&A expert in the Chambers Expert Lawyer ranking; (v) law
school rank; and (vi) graduation from a US law school. We include graduation from US law schools as
their LL.M. programs have a stronger focus on negotiation skills compared to European programs.
The exact construction of each index component depends on the distribution of the
underlying biographic data. If the underlying data are continuous (e.g., years as partner), the
components are created by dividing the expertise value of the buyer lawyer by the expertise value of
the seller lawyer.12 This implies that a higher ratio indicates higher relative buyer lawyer expertise.
We standardize the resulting ratios such that they range between zero and one. A similar
methodology is used in Kale, Kini, and Ryan (2003). If the underlying data are binary (e.g., graduation
from US law school), the components can take three values: 0 if the seller lawyer has more expertise;
0.5 if both have the same expertise; and 1 if the buyer lawyer has more expertise.
Relative Lawyer Expertise is the average of the six index components that each proxy for
relative expertise. The index ranges between zero and one, as its components have been
standardized to lie in the same range. Table 3 Panel A contains summary statistics for the index and
its components.13 Table 3 Panel B shows that the index components are positively, but far from
perfectly correlated; they capture different aspects of expertise. For some of our tests we use the
legal expertise of the buyer and seller lawyer separately (rather than its ratio). Both of these indices,
Buyer Lawyer Expertise and Seller Lawyer Expertise, consist of the same six components and they also
range between zero and one; higher values of both indices indicate more expertise.
4. Empirical Results
4.1 Negotiation Outcomes and Relative Lawyer Expertise
We next turn to the question of whether higher relative lawyer expertise is associated with
more favorable contract outcomes. To this end, we regress in Columns 1 to 5 of Table 4 our proxies
for contract design on the index of relative lawyer expertise. The regressions control for different,
12 For the university rankings, we use inverse values of the underlying university rank.
13 Appendix A‐5 provides statistics of the data underlying the index components. As shown in Table 1 Panel A, sellers
(buyers) did not hire an external law firm and relied on internal in‐house lawyers in 11% (5%) of the deals. We assume that this reflects low legal expertise and code the relative expertise index with the value 1 (value 0) for these observations. This approach is similar to Yermack (1992) and Matsunaga, Shevling, and Shores (1992).

13
potentially important, determinants of contract design. We use three proxies to account for the
complexity or size of a transaction: (i) an indicator for whether a deal is cross‐border; (ii) the total
assets of the target; and (iii) an indicator for whether a deal is an asset or share deal. We further
control for the relative size of the buyer and seller to account for differences in bargaining power,
and for the expertise of the financial advisors. Importantly, we control for the acquisition price as
contract provisions and prices are likely to be interrelated. This allows us to account for the
possibility that higher expertise leads to certain favorable contractual outcomes, but that parties
eventually have to pay for these clauses via the price. We control for the number of warranties in
regressions that explain warranty‐related provisions.
As higher values of our contract design measures imply that more risk is allocated to sellers,
the competitive‐advice hypothesis implies a positive relation between relative lawyer expertise and
contract design. Supporting this view, we find in Table 3 that more relative buyer lawyer expertise is
associated with more warranties without a knowledge qualifier, a higher probability that the legal
compliance warranty does not contain a knowledge qualifier, and a higher probability that a
warranty breach does not need to be material. In terms of economic significance, an increase in the
relative expertise index from the first to the third quartile implies an increase in %Warranties w/o
Qualifier by 4%, which equals more than one third of the variable’s standard deviation. We further
find that more legal experience is associated with a higher likelihood that a MAC clause is included.
Column 6 in Table 3 looks more closely into the bargaining process to understand the
channels that high‐expertise lawyers use to influence contract outcomes in their clients’ favor. In
particular, we assess which party is allowed to provide the first contract draft. We find that more
legal experience on the buyer side is associated with a higher probability that the buyer can provide
the first contract draft. This suggests that the initial drafting phase is a crucial element, as it creates a
first‐mover advantage by setting an anchor or reference point for the upcoming negotiations. In
terms of the duration of the deal process, Column 7 of Table 3 shows that more expertise comes with
shorter closing times. The estimate suggests that moving from the first to the third quartile of the
relative experience index reduces closing times by a substantial 22 days. Appendix A‐6 reports these
regressions separately for each of the six index components.
4.2 Endogenous Assignments of Lawyers
Our evidence suggests that negotiation outcomes are more favorable for buyers if the
expertise of their lawyers exceeds the expertise of the seller lawyers, consistent with the
competitive‐advice hypothesis. A concern is that this relation may be spurious due to endogenous

14
assignments of lawyers to deals. In particular, lawyers with more expertise may be matched with
deals that are generally larger or more complex and require special buyer protection. Endogenous
lawyer matching is of particular concern for the lawyers of our law firm, as they drive a large part of
the variation of the relative expertise index. We address endogeneity concerns in three ways.
4.2.1 Fixed‐Effects Regressions
As a first approach we use three fixed‐effects estimations that account for the possibility that
lawyers and contracts are matched based on unobserved time‐invariant deal, client, or lawyer
characteristics. We first address the concern that law firms are assigned to deals based on the model
contracts that law firms use for drafting contracts. Law firms usually have two standardized model
contracts “off the shelf”, one buyer‐ and one seller‐friendly version, that are used as starting points
when providing first drafts. If law firms specialize in certain transactions or industries, it is possible
that these models reflect the underlying expertise of law firms. This is a concern to our analysis if (i)
law firms with high‐expertise lawyers have model contracts that systematically differ from those of
firms with low‐expertise lawyers, and (ii) deals are assigned to law firms based on these models. To
ensure that our results are not driven by this, the regressions in Table 5 Panel A control for drafting‐
law‐firm fixed‐effects. Ten law firms in our sample provided the first draft in more than one deal, and
the fixed‐effects estimations include dummy variables for each of them.
Second, we address the possibility that lawyers and clients are matched based on
unobserved client characteristics. For example, it is possible that clients with high bargaining power
systemically match with lawyers that offer high expertise. This is a potential concerns, as the
observed relation between contract design and lawyer expertise may then reflect client bargaining
power rather than lawyer expertise. The regressions in Table 5 Panel B therefore control for client
fixed‐effects and identify the effects of lawyer expertise from within‐client variation. We estimate
these fixed‐effects by including dummy variables for all 19 clients that are involved in at least three
sample transactions (a client can occur as a buyer or seller).
Third, we exploit in Table 5 Panel C that most lawyers of our law firm advised on more than
one transaction, allowing us to estimate lawyer fixed‐effects. These fixed‐effects alleviate the
concern that lawyers attract or select specific deals by accounting for unobserved time‐invariant
lawyer characteristics. As our analyses estimate the effects of relative expertise, lawyer fixed‐effects
identify the effect of expertise from variation in the expertise of the counterparty. (We study in Table
7 the two‐sided matching of buyer and seller lawyers to show that the expertise matching is largely

15
random.) We estimate lawyer fixed‐effects by including dummy variables for all 14 lawyers that
advised on at least three sample transactions.
The fixed‐effect estimations show across all three panels that our results are largely robust
once we account for the possibility of endogenous lawyer assignments.14
4.2.2 Client‐Law Firm Switches
The fixed‐effects analysis in Table 5 Panel B mitigates concerns with respect to the initial
assignment of lawyer to clients based on unobservable time‐invariant client characteristics. To
evaluate the role of potentially endogenous law‐firm changes, we next evaluate the prevalence and
drivers of such switches. As a starting point, Table 6 Panel A reports how frequently clients switch
law firms.15 We find that in only 18% (41%) of the deals where switches are possibly a concern,
sellers (buyers) have changed from a previously‐used law firm to a new one.16 Hence, in the majority
of cases, clients obtain advice from a law firm with which a prior relationship has been established.
This indicates that repeated counsel is widespread, consistent with Coates et al. (2011) and Gilson,
Mnookin, and Pashigian (1985).
We then study in more detail the variables that drive law‐firm switches. To this end, we run
in Table 6 Panel B regressions that relate switches to deal and client characteristics. We test in
particular whether deal complexity or size drive law‐firm changes. The regressions show that law‐
firm switches by sellers are generally not motivated by complexity or size. While buyers also do not
switch law firms in response to deal size, they do switch if an upcoming deal is cross‐border. This
possibly reflects the desire of buyers to obtain advice from a law firm in the target country. (We
show below that such switches are not a concern to our analysis, as they do not result in higher (or
lower) legal expertise.) Most importantly, we cannot detect that law‐firm switches are motivated by
an attempt to obtain systematically higher legal advice, as neither seller nor buyer legal expertise is
related to the switching variable. This observation is important, as it alleviates the concern that
switches are motivated by a quest for expertise.
Finally, we perform regressions on two subsets of deals where concerns over endogenous
lawyer changes are largely muted. In Table 6 Panel C we estimate regressions only for deals where
neither the buyer nor the seller has changed law firms. The idea behind this analysis is that it
14 Note that the number of observations in Table 5 is lower than in Table 4, as some observations are dropped if there is no
variation in the dependent variable within a fixed‐effects category. This also reduces the power of these tests. 15 We exclude clients that have not used external advice and or that have not undertaken prior M&A deals; endogenous
law‐firm changes are not a concern for these deals. 16 We evaluate whether prior client‐law firm relations have been established based on information from Mergermarket.

16
excludes cases where law‐firm switches, though not systemically related to legal expertise (Table 6
Panel B), may be motivated by unobserved deal characteristics that may bias the effect of expertise.
In Table 6 Panel D we estimate regressions only for deals where our law firm has established a client‐
law firm relation prior to the current transaction. In 51 (49) of the deals our law firm advises a seller
(buyer) with which a prior relation has been established, providing us with a sample of 100 deals in
total. Similarly to the first analysis, the idea is that the initial assignment of a client to a law firm may
be driven by unobservables, but these past variables are unlikely to bias the estimates of legal
expertise in transactions over future targets. The regressions in both panels show that our results are
largely present also in these two refined samples.
4.2.3 Two‐Sided Lawyer Matching and Analysis of Covariates
We have shown that it is unlikely that our results are driven by unobservables that drive the
allocation of lawyers to deals. Yet, to better understand the matching of lawyers to deals, we
examine correlations between lawyer expertise and different observables. We first analyze whether
expertise on one side of the negotiation tables is systematically related to expertise on the other
side, which would reflect a two‐sided matching. Figure 1 reports a scatter plot of buyer and seller
lawyer expertise. The striking observation emerging from the plot is that clients do not seem to
select lawyers so as to match the expertise of the counterparty; observations would otherwise
cluster along the 45 degree line. In fact, in Table 7 we cannot even detect a significant positive
relation between the two expertise variables. This finding is in line with our previous argument that
client‐lawyer relations are sticky and mainly determined by a one‐time law firm selection.
Though lawyers do not seem to match with deals based on the anticipated counter‐party
expertise, we do not intend to suggest that law firm assignments are purely random. In fact, the
regressions in Table 7 show that relatively larger clients tend to use lawyers with higher expertise,
and sellers of larger targets also tend to use higher expertise. Both observations confirm the
importance of directly controlling for these variables in our previous regressions. Note that neither
buyer nor seller expertise is statically related to cross‐country deals, indicating that the previously‐
documented client switches in cross‐country deals are not motivated by a quest for expertise.
4.3 Relative Lawyer Expertise: Placebo Tests
Theory predicts that bargaining power is not employed to affect outcomes that create value
for both parties (Sen (2000); Inderst and Müller (2004)). Contract outcomes can create joint value if
they facilitate deal completion by reducing information asymmetry or by mitigating agency problems
(Gilson (1984)). We use this prediction to perform placebo tests that mitigate concerns about

17
spurious correlations between lawyer expertise and contract outcomes. Table 8 contains regressions
for four contract outcomes that plausibly increase the joint surplus of both parties: number of
warranties; number of covenants; whether an earnout is included; and whether a purchase price
adjustment (PPA) is included.
We study warranties as they help to reduce information asymmetry by signaling target
quality (Grossman (1981); Spence (1977)). Thereby, they not only protect buyers against information
solely available to sellers, but they also increase the probability that the target is sold to begin with.
Warranties hence increase joint surplus, making them an area where incentives are aligned. Similar
arguments can be applied to covenants. Covenants are in the interest of both parties, as they are
commitment devices that mitigate opportunistic seller behavior between signing and closing.
Thereby, they facilitate deal completion and benefit both parties. Finally, earnouts and PPAs increase
the probability that a deal is completed by reducing information asymmetry related to target
profitability (Datar, Frankel, and Wolfson (2001); Cain, Denis, and Denis (2011)). Earnouts stipulate
that parts of the purchase price are contingent on target performance after the closing date, thereby
reducing uncertainty about future target performance. Similarly, PPAs are modifications to the price
based on target book values at the closing date. Such adjustments may be needed if signing and
closing dates differ substantially. PPAs retroactively adjust the price based on changes in accounting
performance and help to overcome information asymmetry about target performance.
The regressions in Columns 1 to 4 of Table 8 show that relative lawyer expertise is unrelated
to all four outcomes. This corroborates that legal expertise is primarily used to bargain for outcomes
that are favorable to the own clients, rather than to influence provisions that maximize joint surplus.
To further investigate the difference between provisions that mainly allocate risk and those
that mainly overcome information asymmetry, the remaining two columns of Table 8 contrast the
effects of lawyer expertise for two warranty categories. We separate warranties into those where it
is ex ante likely that the seller has sufficient information to be sure that a warranty breach is unlikely,
and those where this is unlikely. We then calculate for each of these categories the percentage of
warranties with a knowledge qualifier. Specifically, %Info Warranties w/o Qualifier is the percentage
of all warranties without a qualifier on the following topics: corporate records; financial accounts;
employees; and insurance matters. We contrast this variable with %Risk Warranties w/o Qualifier,
which is the percentage of all warranties without a qualifier on the following topics: legal; contracts;
intellectual property; assets; and business information. We assume that the warranties on the first
topics are more likely to reduce information asymmetry, while those on the second topics are more

18
likely to allocate risk. Thus, relative lawyer expertise should matter for the first, but not for the
second warranty type.17
Columns 5 and 6 of Table 8 show that relative lawyer expertise is unrelated to %Info
Warranties w/o Qualifier, but highly significantly related to %Risk Warranties w/o Qualifier. This
corroborates that expertise is primarily used for provisions that allocate risk.
4.4 Financial Benefits of Lawyer Expertise
We have shown that more legal expertise is associated with better a contract design and a
more favorable bargaining process. In all of our previous analyses, the acquisition price served as a
control variable that captured the trade‐off between risk allocation and price. Controlling for the
price allows us to address the concern that certain parties may be willing to carry more risk if they
are compensated accordingly. This leaves the question of whether lawyer expertise also directly
affects the financial outcome of a deal. Lawyers may affect the price through their efforts during the
legal due diligence and contract drafting process. As described above, the initial price in one‐on‐one
transactions is usually set prior to contract negotiations. However, lawyers can affect the final price
in different ways. For example, the initial price is usually an upper bound that is subject to issues that
arise during the negotiation process. Buyer lawyers with more expertise may be better able to
identify any “skeletons” during this process, and negotiate lower final prices as a result.
Table 9 studies the relationship between the acquisition premium and lawyer expertise. We
test whether more financial expertise on the buyer (seller) side is associated with a lower (higher)
price for the target.18 We control for variables that may also affect the acquisition price, for example
target size, whether or not a deal is cross‐border, target profitability, the relative size of buyers and
sellers, and the expertise of the involved investment banks. To account for the trade‐off between
contract design and the price, we further account for the previously studied contract clauses. The
regressions show that more legal experience is associated with more favorable prices. Specifically, if
the buyer lawyer has more experience, this is associated with a lower premium. With the exception
of the MAC clause, we cannot detect that the acquisition prices reflect the negotiated contract
17 This difference can be illustrated with two examples. Suppose the seller includes the following IP warranty: “There is no
breach of the IP rights of the target by another party.” If the seller is uncertain whether such a breach has occurred, the warranty helps to overcome information asymmetry, but it leaves the risk with the seller. Suppose now that the seller adds a knowledge qualifier: “So far as the seller is aware, there is no breach of the target’s IP rights by another party.” The warranty now still helps to overcome information asymmetry, but it reallocates risk from the seller to the buyer. Contrast this example with a warranty that states that the seller has disclosed all documents on the organization of the target, all bylaws, and all minutes of board meetings (a corporate record warranty). Here, it is likely that the seller can be certain about the statement she makes, so that a knowledge qualifier likely does not allocate risk. 18 We follow Masulis and Nahata (2011) and measure the acquisition premium as the price paid for the target (including
liabilities) divided by its book value. The average premium equals 2.4 (Table 2 Panel A).

19
clauses. This suggests that lawyer with high expertise are beneficial on two fronts: they negotiate
better contract provisions and ensure that their clients do not have to pay for them.
4.5 Financial Costs of Lawyer Expertise
While we have demonstrated that legal expertise comes with positive negotiation outcomes
along several dimensions, we have not yet addressed whether the associated costs neutralize or
even dominate these benefits. Our data allows us to approximate the legal fees paid by buyers and
seller. These estimates build on the overall time spent on the M&A negotiations, defined as the
number of days between the start of the negotiations and the signing of the contract.19 The duration
of negotiations is an important starting point for fee estimations, as lawyers are remunerated on a
per‐hour basis (e.g., Garoupa and Gomez‐Pomar (2008)). Negotiations take on average 170 days
(Table 1 Panel A). Next to negotiation times, we account for the legal team size (number of
associates and partners) and differences in hourly fees due to differences in law firm rank. There are
on average five (eight) lawyers in the teams of the sellers (buyers). We assume an average hourly fee
of EUR 400 for a top‐tier law firm and EUR 300 for all others.20 We then estimate fees by multiplying
the negotiation time with the team size and daily rate (8 times hourly rate). The median buyer in our
sample pays EUR 1.5m in legal fees, while the median seller pays EUR 0.9m (Table 1 Panel A).
Table 10 relates in Columns 1 to 4 these fee estimates with lawyer expertise. We use both
the absolute fee and the fee scaled by the purchase price. The regressions show that we cannot
detect that more legal expertise comes with a higher legal bill. To understand this surprising result,
we investigate more closely the time that lawyers spend negotiating. Interestingly, we find in Column
5 of Table 10 that more buyer expertise is associated with shorter negotiation times. This suggests
that high‐expertise lawyers not only negotiate beneficial outcomes, but that they also economize on
transaction costs. Overall, this makes it unlikely that legal costs outdo the benefits of expertise.
5. Conclusions
We study whether empirical contract design reflects the experience or educational
background of the lawyers involved in contract negotiations. The effects of legal advisors on contract
design are ignored under the standard paradigm of “optimal contract design,” but are likely to be
important in practice, as they may cause deviations from optimal contracting.
19 We can identify the start of negotiations as we know the date at which our law firm opened a file on a transaction. An
advantage of this information is that we do not need to rely on public deal announcements, which usually take place, if at all, after substantial negotiation time has passed. 20 A law firm is defined as top tier if it is ranked in the top 10 based on the number of deals advised on from 1995 to 2010.
20
Using private company acquisitions as a laboratory, we find that lawyers with more expertise
yield better contractual outcomes for their clients along several important dimensions. For example,
buyer lawyer with more relative expertise negotiate contracts that have fewer warranty qualifiers,
are more likely to require that any warranty breach can be claimed, and have a higher propensity to
include a MAC clause. Thus, buyer lawyers with more expertise than seller lawyers negotiate
contracts that allocate risk away from buyers and towards sellers. Placebo tests show that lawyer
expertise is less important for provisions that increase the joint surplus of both parties. We address
concerns about the endogenous allocation of lawyers by performing fixed‐effects analyses and by
exploiting firms’ inclination to work with the same lawyer on subsequent deals.
We then study the underlying bargaining dynamics to understand the channels that high‐
expertise lawyers use to influence contracts in their clients’ favor. We find that more legal expertise
is associated with a higher probability that a party can deliver the first contract draft. This helps in
contract negotiations, as it provides a first‐mover advantage by setting an anchor or reference point
for upcoming negotiations. Lastly, we study the financial benefits and costs of legal expertise. We
show that legal expertise is associated with more favorable target pricing, i.e., lower prices for buyers
and higher prices for sellers. Moreover, we cannot detect that acquisition prices reflect the
negotiated contract clauses, which implies that lawyer with high expertise negotiate better contract
clauses and ensure that their clients do not have to pay for them. More expertise does not come
with higher legal fees, as high‐expertise lawyers economize on transaction costs by shortening
negotiation times.

21
References
Ackerberg, D.A., and M. Botticini, 2002, Endogenous matching and the financial determinants of contract design, Journal of Political Economy 110, 564‐591.
Bao, J., and A. Edmans, 2011, Do investment banks matter for M&A returns?, Review of Financial Studies 24, 2286‐2315.
Bargeron, L.L., F.P. Schlingemann, R.M. Stulz, and C.J. Zutter, 2008, Why do private acquirers pay so little compared to public acquirers?, Journal of Financial Economics 89, 375‐390.
Beatty R., and I. Welch, 1996, Issuer expenses and legal liability in initial public offerings, Journal of Law and Economics 39, 545‐602.
Betton, S., B.E. Eckbo, and K.S. Thorburn, 2007, Corporate Takeovers, in B.E. Eckbo, ed. Handbook of Corporate Finance: Empirical Corporate Finance 2, Chapter 15 (Elsevier North‐Holland, Amsterdam, Netherlands).
Boone, A.L., and J.H. Mulherin, 2007, How are firms sold?, Journal of Finance 62, 847‐875.
Cain, M., D.J. Denis, and D.K. Denis, 2011, Earnouts: A study of financial contracting in acquisition agreements, Journal of Accounting and Economics 51, 151‐170.
Coates, J.C., 2012, Allocating risk through contract: Evidence from M&A and policy implications, Working Paper, Harvard Law School.
Coates, J.C., M.M. DeStefano, A. Nanda, and D.B. Wilkins, 2011, Hiring teams, firms, and lawyers: Evidence of the evolving relationships in the corporate legal market, Law & Social Inquiry 36, 999‐1031.
Datar, S, R. Frankel, and M. Wolfson, 2001, Earnouts: The effects of adverse selection and agency costs on acquisition techniques, Journal of Law, Economics & Organization 17,201–238.
Denis, D.J., and A.J. Macias, 2013, Material adverse change clauses and acquisition dynamics, Journal of Financial and Quantitative Analysis 48, 819‐847.
Erel, I., R.C. Liao, and M.S. Weisbach, 2012, Determinants of cross‐border mergers and acquisitions, Journal of Finance 67, 1045‐1082.
Ertugul, M., and K. Krishnan, 2011, Advisor skill and acquisition performance: Do investment bankers make a difference? Working Paper, Northeastern University.
Frankel, M.E.S., 2005, Mergers and Acquisitions Basics. The Key Steps of Acquisitions, Divestitures, and Investments (John Wiley & Sons, Inc., Hoboken, New Jersey).
Freund, J., 1975, Anatomy of a Merger: Strategies and Techniques for Negotiating Corporate Acquisitions (Law Journal Press, New York).
Garoupa, N., and F. Gomez‐Pomar, 2008, Cashing by the hour: Why large law firms prefer hourly fees over contingent fees, Journal of Law, Economics & Organization 24, 458‐475.
Gilson, R.J., 1984, Value creation by business lawyers: legal skills and asset pricing, Yale Law Journal 94, 239‐313.

22
Gilson, R.J., and A. Schwartz, 2005, Understanding MACs: Moral hazard in acquisitions, Journal of Law, Economics and Organization 21,330‐358.
Gilson, R.J., R.H. Mnookin, and B.P. Pashigian, 1985, Sharing among the human capitalists: An economic inquiry into the corporate law firm and how partners split profits, Stanford Law Review 37, 313‐397.
Golubov, A., D. Petmezas, and N. Travlos, 2012, It pays to pay your investment banker: New evidence on the role of financial advisors in M&As, Journal of Finance 67, 271‐311.
Grossman, S.J., 1981, The information role of warranties and private disclosure about product quality, Journal of Law and Economics 24, 461‐483.
Harford, J., 1999, Corporate cash reserves and acquisitions, Journal of Finance 54, 1969‐1997.
Hart, O. and J. Moore, 2008, Contracts as reference points, Quarterly Journal of Economics 73, 1‐48.
Inderst, R. and H. Müller, 2004, The effect of capital market characteristics on the value of start‐up firms, Journal of Financial Economics 72, 319‐356.
Kale, J.R., O. Kini, and H.E. Ryan, Jr., 2003, Financial advisors and shareholder wealth gains in corporate takeovers, Journal of Financial and Quantitative Analysis 38, 475‐501.
Kling, L.R, E.N. Simon, and M. Goldman, 1997, Summary of acquisition agreements, Miami Law Review 51, 779‐813.
Krishnan, C.N.V., and P.A. Laux, 2008, Legal advisors: Popularity versus economic performance in acquisitions, Journal of Corporate Ownership and Control 6, 475‐500.
Krishnan, C.N.V, R.W. Masulis, R.S. Thomas, and R.B. Thompson, 2012, Shareholder litigation in mergers and acquisitions, Journal of Corporate Finance 18, 1248‐1268.
Lang, L.H.P., R.M. Stulz, and R.A. Walkling, 1991, A test of the free cash flow hypothesis. The case of bidder returns, Journal of Financial Economics 29, 315‐335.
MacLeod, 2007, Reputations, relationships and contract enforcement, Journal of Economic Literature 45, 597‐630.
Martinius, P., 2005, M&A ‐ Protecting the purchaser, Chapter 1 in P. Martinius, ed.: (2nd ed.) M&A‐Protecting the Purchaser (Kluwer Law International, The Hague, Netherlands).
Masulis, R.W., C. Wang, and F. Xie, 2007, Corporate governance and acquirer returns, Journal of Finance 62, 1851‐1889.
Masulis, R.W., and R. Nahata, 2011, Venture capital conflicts of interest: Evidence from acquisitions of venture‐backed firms, Journal of Financial and Quantitative Analysis 46, 395‐430.
Matsunaga, S., T. Shevlin, and D. Shores, 1992, Disqualifying dispositions of incentive stock options: Tax benefits versus financial reporting, Journal of Accounting Research 30, 37‐68.
Miller, E.L. Jr., 2008, Mergers and Acquisitions: A Step‐by‐Step Legal and Practical Guide (John Wiley & Sons, Inc., Hoboken, New Jersey).

23
Moeller, T., 2005, Let’s make a deal! How shareholder control impacts merger payoffs, Journal of Financial Economics 76, 167‐190.
Molod, A.H., 1994, Forms and Paperwork, Chapter 30 in M.L. Rock, R.H. Rock and M. Sikora, eds.: (2nd ed.) The Mergers and Acquisitions Handbook (McGraw‐Hill, Inc, New York, USA).
Mnookin, R. H., S. Peppet, and A. Tulumello, 2000, Beyond Winning: Negotiating to Create Value in Deals and Disputes (Harvard University Press, Cambridge).
Rau, P.R., 2000, Investment bank market share, contingent fee payments, and the performance of acquiring firms, Journal of Financial Economics 56, 293‐324.
Rubinstein, A., 1982, Perfect equilibrium in a bargaining model, Econometrica 50, 97‐109.
Sen, A., 2000, Multidimensional bargaining under asymmetric information, International Economic Review 41, 425‐450.
Servaes, H., and M. Zenner, 1996, The role of investment banks in acquisitions, Review of Financial Studies 9, 787‐815.
Spence, M., 1977, Consumer misperception, product failure and producer liability, Review of Economic Studies 44, 561‐572.
Stulz, R.M., R.A. Walkling, and M.H. Song, 1990, The distribution of target ownership and the division of gains in successful acquisitions, Journal of Finance 45, 817‐833.
Yermack, D., 1992, Do corporations award CEO stock options effectively? Journal of Financial Economics 39, 237‐269.
Wang, C, F. Xie, and K. Zhang, 2014, Expert advice: Industry expertise of financial advisors in Mergers and Acquisitions, Working Paper, Clemson University.

Table 1 Sample Characteristics: Summary Statistics
Panel A provides summary statistics of target, buyer, seller, and deal characteristics. Panel B reports information on the types of buyers and sellers. Panel C provides geographic, advisor, and industry statistics. Panel D reports information on the geographic location of buyers and sellers. The sample consists of 151 acquisitions of private targets between 2005 and 2010. Not all variables are available for all deals. Statistics are reported at the deal level. Detailed variable definitions are provided in Appendix A‐1.
Panel A: Target, Buyer, Seller, and Deal Characteristics
Mean Median 25th 75
th Std. Dev. Obs.
Target
Purchase Price (mEUR) 222 34 10 174 795 151Target Book Value (mEUR) 318 45 8 147 990 146Target Market Value (mEUR) 434 80 20 232 1291 146 Target Leverage 59% 60% 36% 81% 30% 146 Target EBIT/Assets 14% 14% 5% 15% 15% 151 Asset Deal 9% 151
Buyer
Buyer Book Value (mEUR) 40028 1408 414 8645 138859 150Buyer Deal Experience 11 4 1 15 16 147 Buyer In‐house Lawyer 5% 151 Buyer Bank Top 10 15% 151 Buyer Law Firm Top 10 19% 151 Buyer Law Firm Switch 31% 147
Seller
Seller Book Value (mEUR) 90761 2079 42 23913 316029 147 Seller Deal Experience 12 4 0 21 16 151 Seller In‐house Lawyer 11% 151 Seller Bank Top 10 15% 151Seller Law Firm Top 10 12% 151Seller Law Firm Switch 11% 151
Deal
Cross‐Country Deal 44% 151 Approvals Required (Number) 1.0 0.0 0.0 1.0 1.8 151 Controlled Auction 23% 151 Negotiation Time 170 141 74 228 134 147Seller Fee Lawyer (mEUR) 2.9 0.9 0.4 3.1 5.5 131Buyer Fee Lawyer (mEUR) 3.8 1.5 0.6 4.5 5.9 139 Seller Fee Lawyer/Purchase Price 9% 2% 1% 7% 29% 130 Buyer Fee Lawyer/Purchase Price 9% 4% 1% 13% 79% 138
Panel B: Cross‐Table of Buyer and Seller Types
Seller Type
Strategic Family Private Equity Financial Government Total
Strategic 38% 13% 8% 3% 1% 64% Buyer Family 1% 0% 0% 1% 0% 1% Type Private Equity 11% 4% 6% 1% 0% 22%
Financial 3% 0% 1% 2% 0% 7% Government 5% 1% 0% 0% 1% 7%
Total 58% 18% 15% 7% 2% 100%

Table 1 (continued)
Panel C: Target, Buyer, and Seller Location and Industry
Location Target Buyer Seller
The Netherlands 85% 59% 79% Western Europe (excl. NL) 9% 26% 15% North America 2% 9% 3% Rest of World 3% 6% 3%
Industry Target Buyer Seller
Insurance & Real Estate 11% 37% 45% Manufacturing 28% 17% 23% Public Administration 0% 0% 1% Services 32% 16% 5% Transportation & Communication 9% 10% 7% Wholesale Trade 12% 13% 11% Other Industry 8% 7% 8%
Panel D: Cross‐Table Buyer and Seller Locations
Seller Location
The
Netherlands Europe (excl. NL)
North America Rest of World Total
The Netherlands 48% 10% 0% 1% 59% Buyer Location
Europe (excl. NL) 20% 3% 1% 2% 26% North America 7% 1% 1% 0% 9% Rest of World 4% 1% 1% 0% 6%
Total 79% 15% 3% 3% 100%

Table 2 Negotiation Outcomes: Summary Statistics
Panel A provides summary statistics of negotiation outcomes. Panel B reports correlation of these negotiation outcomes. The sample consists of 151 acquisitions of private targets between 2005 and 2010. Not all variables are available for all deals. Statistics are reported at the deal level. Detailed variable definitions are provided in Appendix A‐1. * indicates significance at the 5% level.
Panel A: Negotiation Outcomes
Mean Median 25th 75
th Std. Dev. Obs.
Contract Design
Warranties 98 100 27 152 49 150 %Warranties w/o Qualifier 86% 89% 76% 99% 12% 150%Info Warranties w/o Qualifier 75% 80% 51% 97% 20% 149%Risk Warranties w/o Qualifier 94% 96% 88% 100% 10% 150 Legal Compliance Warranty w/o Qualifier 83% 150
Warranties Not Material 81% 150%Payment Secured 5% 0% 0% 21% 9% 149 Covenants 14 14 0 31 13 151 MAC Clause 34% 151
Bargaining Process
First Draft By Buyer 44% 151Closing Time 46 24 0 123 66 151
Pricing
Acquisition Premium 2.4 1.6 1.0 5.1 2.3 146 Earnout 18% 151 Purchase Price Adjustment 52% 151
Panel B: Correlations
(1) (2) (3) (4) (5) (6) (7) (8) (9) (10) (11)
Warranties (1) 1.00%Warranties w/o Qual. (2) 0.02 1.00Legal Compliance Warranty w/o Qualifier (3) ‐0.01 0.35* 1.00 Warranties Not Material (4) 0.26* 0.21* 0.06 1.00 %Payment Secured (5) 0.26* 0.15 0.04 0.18* 1.00 Covenants (6) 0.23* 0.01 ‐0.07 0.22* ‐0.05 1.00
MAC Clause (7) 0.22* ‐0.02 0.01 0.08 0.05 0.34* 1.00 First Draft By Buyer (8) 0.24* 0.28* 0.19* 0.22* 0.31* ‐0.27* 0.10 1.00 Closing Time (9) ‐0.01 ‐0.12 ‐0.09 0.13 ‐0.12 0.48* 0.21* ‐0.29* 1.00Acquisition Premium (10) 0.19* 0.12 0.00 0.07 0.16 ‐0.10 ‐0.05 0.16 ‐0.09 1.00Earnout (11) 0.05 0.12 ‐0.07 0.05 0.12 ‐0.17* 0.03 0.11 ‐0.10 0.31* 1.00 Purchase Price Adjustment (12) 0.24* 0.03 ‐0.03 0.03 0.02 0.11 0.15 ‐0.11 0.06 ‐0.02 0.03

Table 3 Relative Lawyer Expertise: Summary Statistics
This tables reports summary statistics of Relative Lawyer Expertise, which is an index that measures relative lawyer expertise (Buyer Lawyer Expertise/Seller Lawyer Expertise). The table also reports summary statistics of the six components that are used to create the index. The index and its components have been standardized to range between 0 and 1. Higher (lower) values indicate more legal expertise on the side of the buyer (seller) lawyer. Relative Lawyer Expertise averages the following six index components that measure the specific expertise of the buyer lawyer relative to that of the seller lawyer: Years as Partner; Deal Experience; M&A Specialist; Chambers Recommendation; Law School Ranking; US Education. Panel A reports means and medians of Relative Lawyer Expertise and the six index components. It also reports for what percentage of the sample: (i) the seller lawyer has more expertise than the buyer lawyer; (ii) both have the same expertise; and (iii) the buyer lawyer has more expertise than the seller lawyer. Years as Partner, Deal Experience, and Law School Ranking are based on continuous variables and defined as the expertise value of the buyer lawyer divided by the expertise value of the seller lawyer. (We use inverse values of the ranking position for Law School Ranking to ensure that higher values reflect higher university quality). M&A Specialist, Chambers Recommendation, and US Education are based on dummy variables and can take three values: 0 if the seller lawyer has more expertise; 0.5 if both have the same expertise; and 1 if the buyer lawyer has more expertise. Panel B reports rank correlations of Relative Lawyer Expertise and the six index components. The sample consists of 151 acquisitions of private targets between 2005 and 2010. * indicates significance at the 5% level.
Panel A: Relative Lawyer Expertise
Summary Statistics Buyer Layer Expertise Relative to Seller Lawyer Expertise
Mean Median Buyer < Seller Buyer = Seller Buyer > Seller Obs.
Index Relative Lawyer Expertise 0.41 0.37 71% 0% 29% 111
Index Components Years as Partner 0.37 0.23 69% 6% 25% 121Deal Experience 0.25 0.08 80% 0% 20% 127M&A Specialist 0.55 0.50 9% 71% 20% 132
Chambers Recommendation 0.59 0.50 17% 48% 35% 151Law School Ranking 0.22 0.09 84% 0% 16% 125US Education 0.50 0.50 19% 62% 19% 129
Panel B: Spearman Rank Correlations
Relative Lawyer Expertise
Years as
Partner
Deal Experience
M&A Specialist
Chambers Recommend.
Law School Ranking
US Education
Relative Lawyer Expertise 1 Years as Partner 0.67* 1Deal Experience 0.64* 0.44* 1M&A Specialist 0.67* 0.49* 0.65* 1
Chambers Recommendation 0.65* 0.29* 0.62* 0.49* 1Law School Ranking 0.73* 0.42* 0.31* 0.36* 0.21* 1 US Education 0.67* 0.33* 0.09 0.25* 0.21* 0.76* 1

Table 4 Negotiation Outcomes and Relative Lawyer Expertise: Basic Results
This table reports OLS and logit regressions at the deal level to explain the relation between Relative Lawyer Expertise and different negotiation outcomes in M&A transactions. Relative Lawyer Expertise is an index that ranges between 0 and 1, where higher (lower) values indicate more legal expertise on the buyer side (seller side). The sample consists of 151 acquisitions of private targets between 2005 and 2010. Each column contains a regression with a different dependent variable (listed horizontally). The regression in Column 5 only contains deals where signing and closing where not on the same day as MAC clauses are otherwise not relevant. Detailed variable definitions are provided in Appendix A‐1. We report in parentheses t‐statistics, calculated using robust standard errors. The regressions have less than 151 observations because of missing data for some variables. *** indicates significance at 1%, ** at 5%, and * at 10%.
Contract Design Bargaining Process
Dependent Variable: %Warranties w/o Qualifier
Legal Compliance Warranty
w/o Qualifier
Warranties Not Material
%Payment Secured
MAC Clause First Draft By Buyer
Closing Time
(1) (2) (3) (4) (5) (6) (7)
Relative Lawyer Expertise 0.16*** 2.48* 4.62*** ‐0.00 3.06** 3.70** ‐77.85**(2.70) (1.77) (2.77) (‐0.03) (2.12) (2.46) (‐2.39)
Acquisition Premium 0.01 ‐0.08 ‐0.15 ‐0.01 ‐0.71** ‐0.25 0.71 (0.99) (‐0.39) (‐0.72) (‐1.02) (‐2.21) (‐0.90) (0.17)
Warranties 0.00 ‐0.01 0.01 0.00* (0.05) (‐1.02) (1.23) (1.91)
Cross‐Country Deal ‐0.04 ‐0.61 ‐0.85 ‐0.02 ‐0.02 ‐2.06*** 0.02(‐1.50) (‐1.03) (‐1.24) (‐1.18) (‐0.03) (‐3.96) (0.00)
Log(Target Book Value) ‐0.01 ‐0.07 ‐0.18 ‐0.01* ‐0.58** ‐0.57*** 5.01 (‐0.97) (‐0.42) (‐0.92) (‐1.89) (‐2.26) (‐2.77) (1.43)
Asset Deal 0.02 ‐0.59 ‐0.97 ‐0.02 ‐1.53 ‐1.42 39.39* (0.56) (‐0.51) (‐1.11) (‐1.07) (‐0.80) (‐0.90) (1.69)
Relative Size 0.00 0.06 0.14 0.01*** 0.10 0.23** 4.54*(0.07) (0.49) (0.87) (2.97) (0.70) (2.01) (1.73)
Seller Bank Top 10 ‐0.02 0.12 0.21 ‐0.02 ‐0.24 0.05 19.68 (‐0.40) (0.14) (0.21) (‐1.21) (‐0.37) (0.06) (1.08)
Buyer Bank Top 10 0.02 0.59 0.32 ‐0.01 1.66* 0.25 ‐20.02 (0.64) (0.73) (0.44) (‐0.25) (1.89) (0.29) (‐1.38)
Approvals Required 12.15***(2.99)
Constant 0.93*** 1.59 2.17 0.18* 8.67* 9.26** ‐67.43 (7.06) (0.42) (0.57) (1.67) (1.65) (2.14) (‐0.98)
Year Fixed‐Effects Yes Yes Yes Yes Yes Yes Yes
Obs. 105 98 105 104 74 105 105Adjusted/Pseudo R‐sq. 0.098 0.101 0.232 0.174 0.267 0.359 0.205

Table 5 Negotiation Outcomes and Relative Lawyer Expertise: Fixed‐Effects Regressions
This table reports OLS and logit regressions at the deal level to explain the relation between Relative Lawyer Expertise and different negotiation outcomes in M&A transactions. Relative Lawyer Expertise is an index that ranges between 0 and 1, where higher (lower) values indicate more legal expertise on the buyer side (seller side). Panel A reports regressions with drafting law firm fixed‐effects. Drafting law firms are law firms that provided the first contract draft for the takeover negotiations. Panel B reports regressions with client fixed‐effects. We account for client fixed‐effects by a including dummy variable for each client that was involved in at least three transactions in the sample. A client can be in involved in a transaction as a buyer, seller, or both. Out of all clients in our sample, a total of 19 were involved in at least three deals. Panel C reports regressions that contain lawyer fixed‐effects. We account for lawyer fixed‐effects by including a dummy variable for each lawyer of the law firm that provided the data that was involved in at least three transactions in the sample. These lawyers advised either buyer or sellers. Out of all 20 lawyers of our law firm, a total of 14 advised on at least three deals. Each column in each panel contains a regression with a different dependent variable (listed horizontally). The regression in Column 5 only contains deals where signing and closing where not on the same day as MAC clauses are otherwise not relevant. Detailed variable definitions are provided in Appendix A‐1. We report in parentheses t‐statistics, calculated using robust standard errors. *** indicates significance at 1%, ** at 5%, and * at 10%.
Contract Design Bargaining Process
Dependent Variable: %Warranties w/o
Qualifier
Legal Compliance Warranty
w/o Qualifier
Warranties Not
Material
%Payment Secured
MAC Clause
First Draft By Buyer
Closing Time
(1) (2) (3) (4) (5) (6) (7)
Panel A: Drafting‐Law‐Firm Fixed‐Effects
Relative Lawyer Expertise 0.13** 3.67* 5.40*** ‐0.02 4.79** 4.19*** ‐45.08 (2.44) (1.94) (2.87) (‐0.35) (2.21) (2.77) (‐1.45)
Controls as in Table 4 Yes Yes Yes Yes Yes Yes Yes Year Fixed‐Effects Yes Yes Yes Yes Yes Yes Yes Drafting‐Law‐Firm Fixed‐Effects Yes Yes Yes Yes Yes Yes Yes
Obs. 105 84 79 104 66 98 105 Adjusted/Pseudo R‐sq. 0.330 0.190 0.401 0.150 0.421 0.491 0.347
Panel B: Client Fixed‐Effects
Relative Lawyer Expertise 0.19** 0.91 7.93** 0.03 5.34* 7.06*** ‐76.75** (2.53) (0.46) (2.19) (0.63) (1.82) (2.84) (‐2.15)
Controls as in Table 4 Yes Yes Yes Yes Yes Yes YesYear Fixed‐Effects Yes Yes Yes Yes Yes Yes YesClient Fixed‐Effects Yes Yes Yes Yes Yes Yes Yes
Obs. 105 83 85 104 57 93 105Adjusted/Pseudo R‐sq. 0.067 0.332 0.368 0.143 0.391 0.424 0.297
Panel C: Lawyer Fixed‐Effects
Relative Lawyer Expertise 0.09* 2.00 3.49* ‐0.04 6.99*** 4.84*** ‐44.03 (1.80) (1.07) (1.80) (‐0.75) (2.65) (2.85) (‐1.19)
Controls as in Table 4 Yes Yes Yes Yes Yes Yes YesYear Fixed‐Effects Yes Yes Yes Yes Yes Yes Yes Lawyer Fixed‐Effects Yes Yes Yes Yes Yes Yes Yes
Obs. 96 71 77 95 64 92 96 Adjusted/Pseudo R‐sq. 0.090 0.160 0.438 0.174 0.352 0.417 0.323
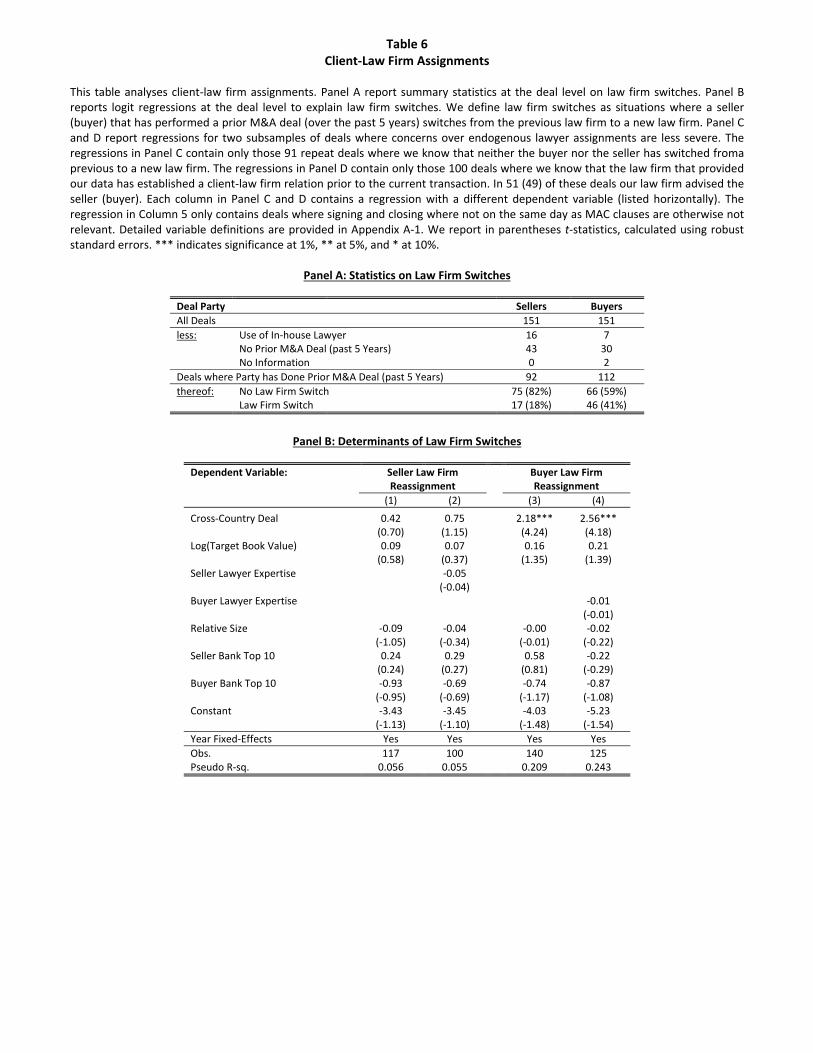
Table 6 Client‐Law Firm Assignments
This table analyses client‐law firm assignments. Panel A report summary statistics at the deal level on law firm switches. Panel B reports logit regressions at the deal level to explain law firm switches. We define law firm switches as situations where a seller (buyer) that has performed a prior M&A deal (over the past 5 years) switches from the previous law firm to a new law firm. Panel C and D report regressions for two subsamples of deals where concerns over endogenous lawyer assignments are less severe. The regressions in Panel C contain only those 91 repeat deals where we know that neither the buyer nor the seller has switched froma previous to a new law firm. The regressions in Panel D contain only those 100 deals where we know that the law firm that provided our data has established a client‐law firm relation prior to the current transaction. In 51 (49) of these deals our law firm advised the seller (buyer). Each column in Panel C and D contains a regression with a different dependent variable (listed horizontally). The regression in Column 5 only contains deals where signing and closing where not on the same day as MAC clauses are otherwise not relevant. Detailed variable definitions are provided in Appendix A‐1. We report in parentheses t‐statistics, calculated using robust standard errors. *** indicates significance at 1%, ** at 5%, and * at 10%.
Panel A: Statistics on Law Firm Switches
Deal Party Sellers Buyers
All Deals 151 151
less: Use of In‐house Lawyer 16 7 No Prior M&A Deal (past 5 Years) 43 30
No Information 0 2
Deals where Party has Done Prior M&A Deal (past 5 Years) 92 112
thereof: No Law Firm Switch 75 (82%) 66 (59%) Law Firm Switch 17 (18%) 46 (41%)
Panel B: Determinants of Law Firm Switches
Dependent Variable: Seller Law Firm Reassignment
Buyer Law Firm Reassignment
(1) (2) (3) (4)
Cross‐Country Deal 0.42 0.75 2.18*** 2.56*** (0.70) (1.15) (4.24) (4.18)
Log(Target Book Value) 0.09 0.07 0.16 0.21 (0.58) (0.37) (1.35) (1.39)
Seller Lawyer Expertise ‐0.05(‐0.04)
Buyer Lawyer Expertise ‐0.01 (‐0.01)
Relative Size ‐0.09 ‐0.04 ‐0.00 ‐0.02 (‐1.05) (‐0.34) (‐0.01) (‐0.22)
Seller Bank Top 10 0.24 0.29 0.58 ‐0.22 (0.24) (0.27) (0.81) (‐0.29)
Buyer Bank Top 10 ‐0.93 ‐0.69 ‐0.74 ‐0.87 (‐0.95) (‐0.69) (‐1.17) (‐1.08)
Constant ‐3.43 ‐3.45 ‐4.03 ‐5.23 (‐1.13) (‐1.10) (‐1.48) (‐1.54)
Year Fixed‐Effects Yes Yes Yes Yes
Obs. 117 100 140 125 Pseudo R‐sq. 0.056 0.055 0.209 0.243

Table 6 (continued)
Panel C: Subsample Analysis: Exclude Deals with Client‐Law Firm Switches
Contract Design Bargaining Process
Dependent Variable: %Warranties w/o Qualifier
Legal Compliance Warranty
w/o Qualifier
Warranties Not
Material
%Payment Secured
MAC Clause
First Draft By Buyer
Closing Time
(1) (2) (3) (4) (5) (6) (7)
Relative Lawyer Expertise 0.20*** 3.10 8.68** ‐0.00 7.48* 3.30** ‐67.76 (3.20) (1.33) (2.48) (‐0.01) (1.94) (2.01) (‐1.51)
Controls as in Table 4 Yes Yes Yes Yes Yes Yes YesYear Fixed‐Effects Yes Yes Yes Yes Yes Yes Yes
Obs. 63 59 63 63 40 63 63Adjusted/Pseudo R‐sq. 0.142 0.283 0.395 0.233 0.452 0.344 0.434
Panel D: Subsample Analysis: Repeat Deals with Our Law Firm
Contract Design Bargaining Process
Dependent Variable: %Warranties w/o Qualifier
Legal Compliance Warranty
w/o Qualifier
Warranties Not
Material
%Payment Secured
MAC Clause
First Draft By Buyer
Closing Time
(1) (2) (3) (4) (5) (6) (7)
Relative Lawyer Expertise 0.22** 3.81** 7.10** 0.04 4.50** 1.65 ‐115.13** (2.60) (2.19) (2.39) (0.73) (2.26) (0.78) (‐2.30)
Controls as in Table 4 Yes Yes Yes Yes Yes Yes Yes Year Fixed‐Effects Yes Yes Yes Yes Yes Yes Yes
Obs. 67 63 63 67 43 67 67 Adjusted/Pseudo R‐sq. 0.136 0.233 0.337 0.238 0.337 0.452 0.375
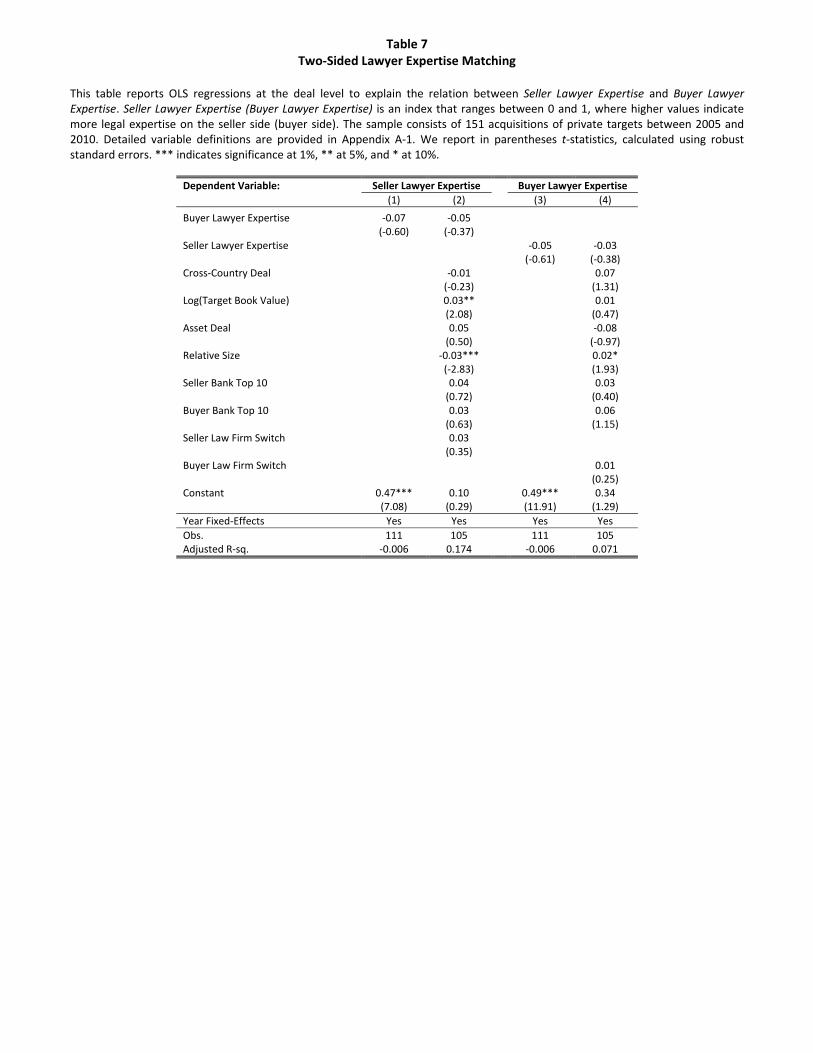
Table 7 Two‐Sided Lawyer Expertise Matching
This table reports OLS regressions at the deal level to explain the relation between Seller Lawyer Expertise and Buyer Lawyer Expertise. Seller Lawyer Expertise (Buyer Lawyer Expertise) is an index that ranges between 0 and 1, where higher values indicate more legal expertise on the seller side (buyer side). The sample consists of 151 acquisitions of private targets between 2005 and 2010. Detailed variable definitions are provided in Appendix A‐1. We report in parentheses t‐statistics, calculated using robust standard errors. *** indicates significance at 1%, ** at 5%, and * at 10%.
Dependent Variable: Seller Lawyer Expertise Buyer Lawyer Expertise
(1) (2) (3) (4)
Buyer Lawyer Expertise ‐0.07 ‐0.05(‐0.60) (‐0.37)
Seller Lawyer Expertise ‐0.05 ‐0.03 (‐0.61) (‐0.38)
Cross‐Country Deal ‐0.01 0.07 (‐0.23) (1.31)
Log(Target Book Value) 0.03** 0.01 (2.08) (0.47)
Asset Deal 0.05 ‐0.08 (0.50) (‐0.97)
Relative Size ‐0.03*** 0.02* (‐2.83) (1.93)
Seller Bank Top 10 0.04 0.03 (0.72) (0.40)
Buyer Bank Top 10 0.03 0.06 (0.63) (1.15)
Seller Law Firm Switch 0.03 (0.35)
Buyer Law Firm Switch 0.01 (0.25)
Constant 0.47*** 0.10 0.49*** 0.34 (7.08) (0.29) (11.91) (1.29)
Year Fixed‐Effects Yes Yes Yes Yes
Obs. 111 105 111 105 Adjusted R‐sq. ‐0.006 0.174 ‐0.006 0.071

Table 8 Relative Lawyer Expertise: Placebo Regressions and Warranty Categories
This table reports in Columns 1 to 4 OLS and logit regressions to explain the relation between Relative Lawyer Expertise and four measures of contract design for which incentives of buyers and sellers are likely to be aligned: Warranties; Covenants; Earnout; and Purchase Price Adjustment. Columns 5 and 6 report regressions for two contract variables that are based on separating %Warranties w/o Qualifier into %Info Warranties w/o Qualifier and %Risk Warranties w/o Qualifier. %Info Warranties w/o Qualifier identifies warranties that primarily overcome information asymmetry and measures the percentage of these warranties that are qualified with a knowledge qualifier. %Risk Warranties w/o Qualifier identifies warranties that primarily allocate risk and measures the percentage of these warranties that are qualified with a knowledge qualifier. Relative Lawyer Expertise is an index that ranges between 0 and 1, where higher (lower) values indicate more legal expertise on the buyer side (seller side). The sample consists of 151 acquisitions of private targets between 2005 and 2010. The regressions in Columns 2 and 4 only contain deals where signing and closing where not on the same day as covenants and purchase price adjustments are otherwise not relevant. The sample consists of 151 acquisitions of private targets between 2005 and 2010. Detailed variable definitions are provided in Appendix A‐1. We report in parentheses t‐statistics, calculated using robust standard errors. *** indicates significance at 1%, ** at 5%, and * at 10%.
Dependent Variable: Warranties Covenants Earnout Purchase Price
Adjustment
%Info Warranties
w/o Qualifier
%Risk Warranties
w/o Qualifier
(1) (2) (3) (4) (5) (6)
Relative Lawyer Expertise 0.94 ‐1.36 0.76 0.68 0.06 0.33***(0.04) (‐0.19) (0.43) (0.47) (1.13) (3.19)
Acquisition Premium 2.87 1.53 0.01 0.00 (1.03) (1.44) (1.20) (0.18)
Cross‐Country Deal 18.43* ‐0.59 1.12 0.69 ‐0.03* ‐0.05(1.79) (‐0.22) (1.36) (1.17) (‐1.73) (‐1.25)
Log(Target Book Value) ‐2.90 1.71* ‐1.05*** ‐0.11 ‐0.00 ‐0.02(‐1.09) (1.93) (‐4.34) (‐0.55) (‐0.14) (‐1.42)
Asset Deal ‐39.93*** ‐12.71*** 2.00 0.60 0.01 0.16** (‐2.77) (‐4.64) (1.61) (0.60) (0.45) (2.31)
Relative Size 0.89 0.66 0.00 0.04 0.00 0.00(0.40) (1.14) (0.00) (0.34) (0.16) (0.05)
Seller Bank Top 10 11.85 3.49 0.69 ‐0.61 ‐0.03 0.00(0.99) (1.30) (0.60) (‐0.78) (‐0.57) (0.04)
Buyer Bank Top 10 5.64 0.91 1.37 1.28 0.02 0.05 (0.55) (0.32) (1.37) (1.46) (0.87) (0.85)
Approvals Required 0.35** 0.10(2.23) (0.57)
Warranties 0.00 0.00(0.02) (1.31)
Constant 120.12** ‐15.38 15.68*** 1.86 0.96*** 0.86*** (2.28) (‐0.84) (3.51) (0.47) (7.56) (3.51)
Year Fixed‐Effects Yes Yes Yes Yes Yes Yes
Obs. 105 74 105 74 105 105Adjusted/Pseudo R‐sq. 0.114 0.152 0.339 0.141 ‐0.002 0.148

Table 9 Acquisition Prices and Relative Lawyer Expertise
This table reports OLS regressions to explain the relation between Relative Lawyer Expertise and the prices in M&A transactions. Relative Lawyer Expertise is an index that ranges between 0 and 1, where higher (lower) values indicate more legal expertise on the buyer side (seller side). The sample consists of 151 acquisitions of private targets between 2005 and 2010. Detailed variable definitions are provided in Appendix A‐1. We report in parentheses t‐statistics, calculated using robust standard errors. The regressions have less than 151 observations because of missing data for some variables. *** indicates significance at 1%, ** at 5%, and * at 10%.
Dependent Variable: Acquisition Premium
(1) (2) (3) (4) (5) (6) (7)
Relative Lawyer Expertise ‐2.01** ‐2.19** ‐2.00** ‐1.95** ‐1.99** ‐1.82** ‐1.96**(‐2.34) (‐2.36) (‐2.27) (‐2.15) (‐2.30) (‐2.29) (‐2.15)
Log(Target Book Value) ‐0.49*** ‐0.48*** ‐0.49*** ‐0.50*** ‐0.51*** ‐0.50*** ‐0.50*** (‐5.34) (‐5.07) (‐5.33) (‐5.62) (‐5.40) (‐5.42) (‐5.55)
Cross‐Country Deal 0.57 0.62* 0.57 0.55 0.56 0.57* 0.58 (1.62) (1.69) (1.54) (1.53) (1.53) (1.71) (1.52)
Asset Deal 0.70 0.67 0.69 0.65 0.64 0.60 0.46(1.03) (0.99) (1.04) (0.94) (0.96) (0.87) (0.68)
Target EBIT/Assets 1.76** 1.79** 1.76** 1.77** 1.78** 1.66** 1.67** (2.20) (2.21) (2.15) (2.17) (2.21) (2.27) (2.16)
Approvals Required 0.11* 0.11* 0.11* 0.12* 0.12* 0.14** 0.14** (1.82) (1.77) (1.83) (1.95) (1.83) (2.43) (2.36)
Relative Size 0.18** 0.18** 0.18** 0.18** 0.20*** 0.19** 0.21***(2.26) (2.27) (2.26) (2.31) (2.63) (2.39) (2.80)
Seller Bank Top 10 0.52 0.54 0.52 0.53 0.55 0.59 0.63* (1.31) (1.40) (1.30) (1.33) (1.29) (1.63) (1.67)
Buyer Bank Top 10 0.12 0.09 0.12 0.12 0.09 0.27 0.21 (0.36) (0.26) (0.37) (0.37) (0.26) (0.75) (0.56)
%Warranties w/o Qualifier 1.30 1.61(1.08) (1.42)
Legal Compliance Warranty w/o Qualifier ‐0.02 ‐0.16 (‐0.06) (‐0.37)
Warranties Not Material ‐0.19 ‐0.16 (‐0.57) (‐0.47)
%Payment Secured ‐1.96 ‐1.74(‐1.08) (‐0.93)
MAC Clause ‐0.65** ‐0.58** (‐2.45) (‐2.03)
Constant 9.85*** 8.51*** 9.87*** 10.11*** 10.17*** 9.80*** 8.75*** (5.44) (3.71) (5.26) (5.77) (5.33) (5.54) (4.12)
Year Fixed‐Effects Yes Yes Yes Yes Yes Yes Yes
Obs. 105 105 105 105 104 105 104 Adjusted R‐sq. 0.347 0.345 0.339 0.341 0.348 0.373 0.356

Table 10 The Costs of Lawyer Expertise
This table reports in Columns 1 to 4 OLS regressions to explain different measures of the costs of law firms to buyers and sellers. Fees Seller Lawyer and Fees Buyer Lawyer proxy for the legal fees paid by the seller or buyer to their law firms. We estimate these fees by multiplying four variables: (i) the number of days between the start of negotiations and the signing of a contract; (ii) the number of lawyers of the legal teams; (iii) the hourly fee rate; and (iv) eight working hours per day. We assume an hourly fee of EUR 400 per average lawyer for a top tier law firm and an hourly fee of EUR 300 for lawyers of all other law firms. A law firm is defined as being top tier if it is ranked in the top 10 based on a ranking that uses the number of transactions advised on between 1995 and 2010. We assume that a law firm bills on average eight hours a day. Fees Seller Lawyer/Purchase Price and Fees Buyer Lawyer/Purchase Price standardize the legal fees by the purchase price that is paid from the buyer to the seller. Column 5 reports OLS regressions that explain the duration of negotiations. Negotiation Time is the number of days between the start of negotiations over a transaction and the signing of a contract. The sample consists of 151 acquisitions of private targets between 2005 and 2010. Detailed variable definitions are provided in Appendix A‐1. We report in parentheses t‐statistics, calculated using robust standard errors. *** indicates significance at 1%, ** at 5%, and * at 10%.
Dependent Variable: Log(Seller Fee Lawyer)
Log(Buyer Fee Lawyer)
Seller Fee Lawyer/Purchase
Price
Buyer Fee Lawyer/Purchase
Price
Negotiation Time
(1) (2) (3) (4) (5)
Seller Lawyer Expertise 0.50 ‐0.12 52.75(1.46) (‐1.01) (0.96)
Buyer Lawyer Expertise ‐0.34 ‐0.23 ‐179.86** (‐0.82) (‐0.81) (‐2.45)
Log(Target Book Value) 0.14*** 0.18*** ‐0.04*** ‐0.01 7.68 (2.96) (4.95) (‐3.49) (‐0.47) (1.23)
Cross‐Country Deal 0.42** 0.16 0.06 0.02 72.51**(2.41) (1.02) (1.18) (0.17) (2.32)
Asset Deal 0.24 ‐0.09 0.23 ‐1.26 8.08 (1.22) (‐0.34) (1.14) (‐1.16) (0.28)
Relative Size ‐0.02 0.00 ‐0.00 ‐0.00 ‐6.09 (‐0.69) (0.08) (‐0.13) (‐0.27) (‐1.15)
Constant ‐1.97** ‐2.40*** 0.85*** 0.45 131.20 (‐2.24) (‐2.89) (3.21) (1.01) (1.05)
Year Fixed‐Effects Yes Yes Yes Yes Yes
Obs. 101 117 101 117 101 Adjusted R‐sq. 0.132 0.260 0.091 0.091 0.154
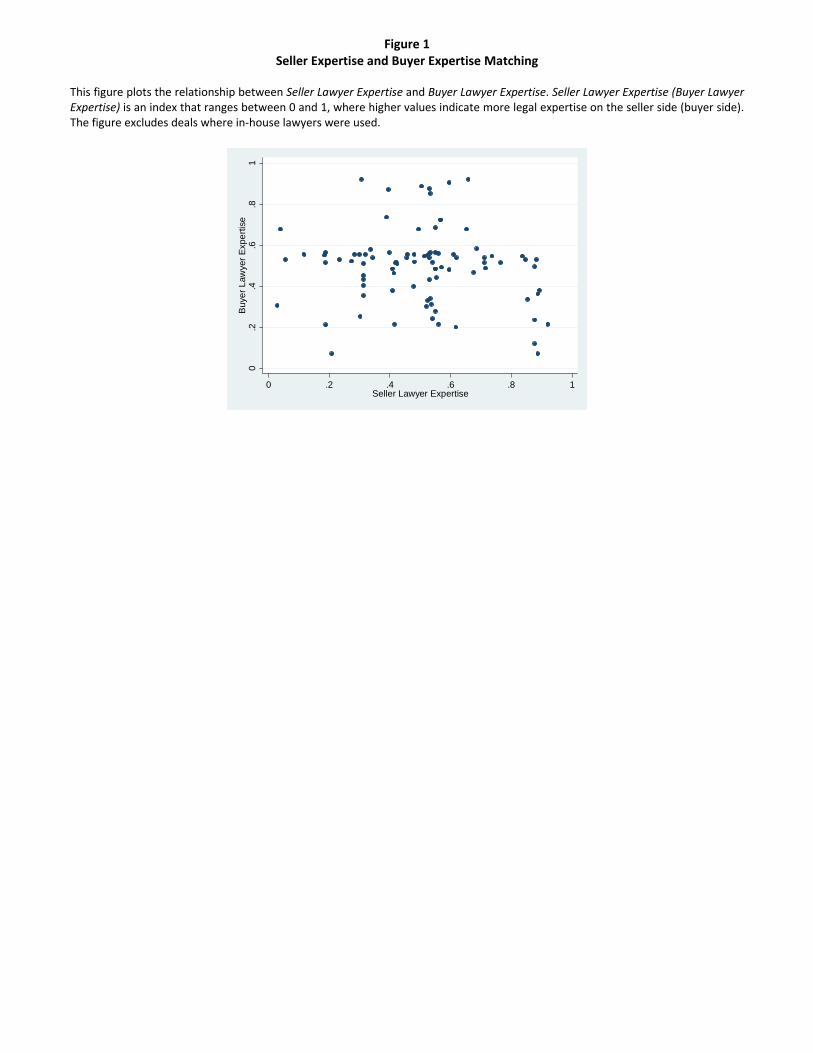
Figure 1 Seller Expertise and Buyer Expertise Matching
This figure plots the relationship between Seller Lawyer Expertise and Buyer Lawyer Expertise. Seller Lawyer Expertise (Buyer Lawyer Expertise) is an index that ranges between 0 and 1, where higher values indicate more legal expertise on the seller side (buyer side). The figure excludes deals where in‐house lawyers were used.
0.2
.4.6
.81
Buy
er
Law
yer
Exp
ert
ise
0 .2 .4 .6 .8 1Seller Lawyer Expertise
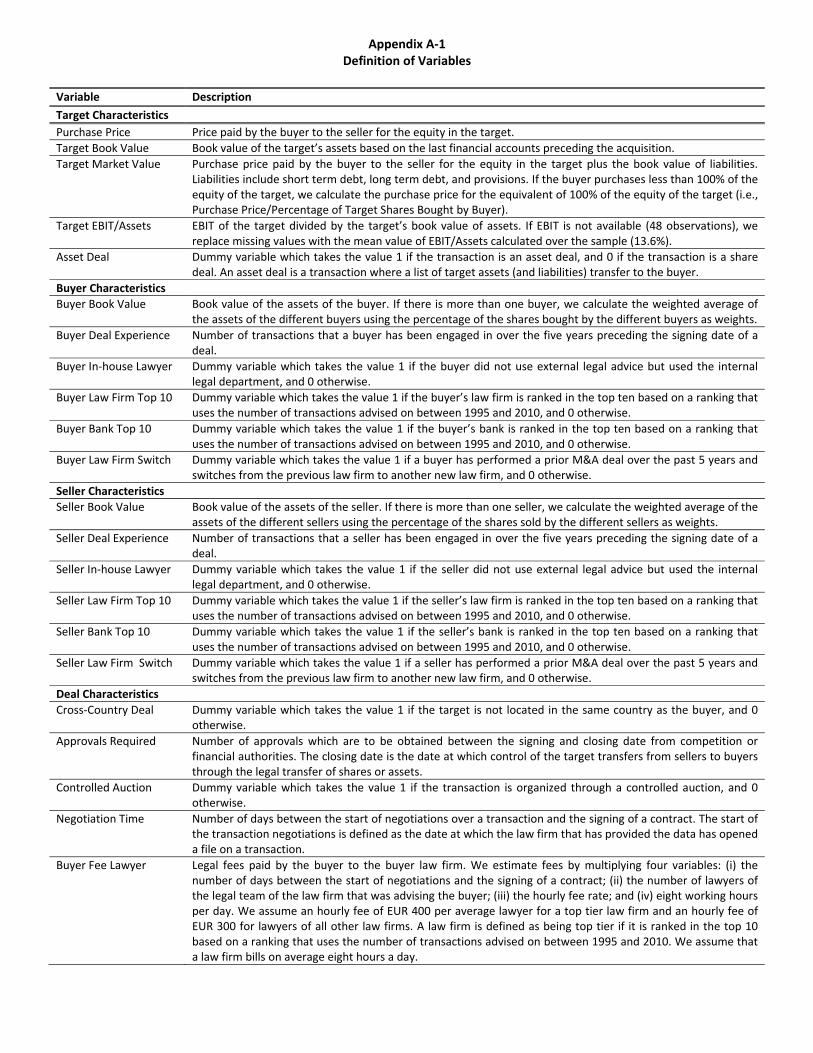
Appendix A‐1 Definition of Variables
Variable Description
Target Characteristics
Purchase Price Price paid by the buyer to the seller for the equity in the target.
Target Book Value Book value of the target’s assets based on the last financial accounts preceding the acquisition.
Target Market Value Purchase price paid by the buyer to the seller for the equity in the target plus the book value of liabilities. Liabilities include short term debt, long term debt, and provisions. If the buyer purchases less than 100% of the equity of the target, we calculate the purchase price for the equivalent of 100% of the equity of the target (i.e., Purchase Price/Percentage of Target Shares Bought by Buyer).
Target EBIT/Assets EBIT of the target divided by the target’s book value of assets. If EBIT is not available (48 observations), we replace missing values with the mean value of EBIT/Assets calculated over the sample (13.6%).
Asset Deal Dummy variable which takes the value 1 if the transaction is an asset deal, and 0 if the transaction is a share deal. An asset deal is a transaction where a list of target assets (and liabilities) transfer to the buyer.
Buyer Characteristics
Buyer Book Value Book value of the assets of the buyer. If there is more than one buyer, we calculate the weighted average of the assets of the different buyers using the percentage of the shares bought by the different buyers as weights.
Buyer Deal Experience Number of transactions that a buyer has been engaged in over the five years preceding the signing date of a deal.
Buyer In‐house Lawyer Dummy variable which takes the value 1 if the buyer did not use external legal advice but used the internal legal department, and 0 otherwise.
Buyer Law Firm Top 10 Dummy variable which takes the value 1 if the buyer’s law firm is ranked in the top ten based on a ranking that uses the number of transactions advised on between 1995 and 2010, and 0 otherwise.
Buyer Bank Top 10 Dummy variable which takes the value 1 if the buyer’s bank is ranked in the top ten based on a ranking that uses the number of transactions advised on between 1995 and 2010, and 0 otherwise.
Buyer Law Firm Switch Dummy variable which takes the value 1 if a buyer has performed a prior M&A deal over the past 5 years and switches from the previous law firm to another new law firm, and 0 otherwise.
Seller Characteristics
Seller Book Value Book value of the assets of the seller. If there is more than one seller, we calculate the weighted average of the assets of the different sellers using the percentage of the shares sold by the different sellers as weights.
Seller Deal Experience
Number of transactions that a seller has been engaged in over the five years preceding the signing date of a deal.
Seller In‐house Lawyer Dummy variable which takes the value 1 if the seller did not use external legal advice but used the internal legal department, and 0 otherwise.
Seller Law Firm Top 10 Dummy variable which takes the value 1 if the seller’s law firm is ranked in the top ten based on a ranking that uses the number of transactions advised on between 1995 and 2010, and 0 otherwise.
Seller Bank Top 10 Dummy variable which takes the value 1 if the seller’s bank is ranked in the top ten based on a ranking that uses the number of transactions advised on between 1995 and 2010, and 0 otherwise.
Seller Law Firm Switch Dummy variable which takes the value 1 if a seller has performed a prior M&A deal over the past 5 years and switches from the previous law firm to another new law firm, and 0 otherwise.
Deal Characteristics
Cross‐Country Deal Dummy variable which takes the value 1 if the target is not located in the same country as the buyer, and 0 otherwise.
Approvals Required Number of approvals which are to be obtained between the signing and closing date from competition or financial authorities. The closing date is the date at which control of the target transfers from sellers to buyers through the legal transfer of shares or assets.
Controlled Auction Dummy variable which takes the value 1 if the transaction is organized through a controlled auction, and 0 otherwise.
Negotiation Time Number of days between the start of negotiations over a transaction and the signing of a contract. The start of the transaction negotiations is defined as the date at which the law firm that has provided the data has opened a file on a transaction.
Buyer Fee Lawyer Legal fees paid by the buyer to the buyer law firm. We estimate fees by multiplying four variables: (i) the number of days between the start of negotiations and the signing of a contract; (ii) the number of lawyers of the legal team of the law firm that was advising the buyer; (iii) the hourly fee rate; and (iv) eight working hours per day. We assume an hourly fee of EUR 400 per average lawyer for a top tier law firm and an hourly fee of EUR 300 for lawyers of all other law firms. A law firm is defined as being top tier if it is ranked in the top 10 based on a ranking that uses the number of transactions advised on between 1995 and 2010. We assume that a law firm bills on average eight hours a day.

Seller Fee Lawyer Legal fees paid by the seller to the seller law firm. We estimate fees by multiplying four variables: (i) the number of days between the start of negotiations and the signing of a contract; (ii) the number of lawyers of the legal team of the law firm that was advising the seller; (iii) the hourly fee rate; and (iv) eight working hours per day. We assume an hourly fee of EUR 400 per average lawyer for a top tier law firm and an hourly fee of EUR 300 for lawyers of all other law firms. A law firm is defined as being top tier if it is ranked in the top 10 based on a ranking that uses the number of transactions advised on between 1995 and 2010. We assume that a law firm bills on average eight hours a day.
Relative Size Size of the buyer relative to the size of the seller. To create this variable, we first calculate the ratio of the assets of the buyer to the assets of the seller. We then divide this ratio into ten deciles such that the resulting variable ranges between 1 (buyer is small relative to the seller) and 10 (buyer is large relative to the seller).
Contract Design
%Warranties w/o Qualifier
Percentage of all warranties in a contract which are not qualified with a knowledge qualifier. A knowledge qualifier is the following statement that is attached to a warranty: “so far as the seller is aware” (or any equivalent thereof).
%Risk Warranties w/o Qualifier
Percentage of all warranties which are not qualified with a knowledge qualifier within warranty categories that primarily allocate risk. We define the following five warranty categories as categories that primarily allocate risk: (i) legal warranties (these warranties cover the following themes legal compliance, threatened or actual litigation, environmental compliance, etc.); (ii) contracts warranties (contracts, enforceability of contracts, contracts with suppliers and buyers, guarantees, etc.); (iii) intellectual property warranties (IP, patents, licenses, etc.) (iv) assets warranties (legal ownership of assets, quality of target assets, etc.); and (v) business information warranties.
%Info Warranties w/o Qualifier
Percentage of all warranties which are not qualified with a knowledge qualifier within warranty categories that primarily reduce information asymmetry. We define the following four warranty categories as categories that primarily reduce information asymmetry: (i) corporate records warranties (these warranties cover the following themes: organization of target, list of subsidiaries, bylaws, legal existence of target, minutes of past board meetings, capital, authorized decision makers, etc.); (ii) financial accounts warranties (financial accounts, internal financial statements, changes since the accounts date, taxes, etc.); (iii) employees warranties (employee pay, resumes of target management, agreements with unions, strikes, pensions, employee benefits, etc.); (iv) insurance matters warranties (insurance contracts, insurance coverage, indemnification agreements, etc.)
Legal Compliance Warranty w/o Qualifier
Dummy variable which takes the value 1 if the contract does not contain a legal compliance warranty that isqualified with a knowledge qualifier. A knowledge qualifier is the following statement that is attached to a warranty: “so far as the seller is aware” (or any equivalent thereof), and 0 otherwise. A legal compliance warranty states that the business of the target is being conducted in compliance with all applicable laws.
Warranties Not Material
Dummy variable which takes the value 1 if a contract contains a clause that states that warranty breaches do not need to be material, and 0 if the contract stipulates that warranty breaches need to be material.
%Payment Secured Percentage of the total purchase price which is secured to be available for warranty claims a buyer may have after the closing of a transaction towards a seller. This money is secured by placing it in an escrow account or through a bank guarantee. The variable is winsorized at 5%.
MAC Clause Dummy variable which takes the value 1 if the contract stipulates that the transaction does not have to be completed if a material adverse event occurs in the period between the signing date and the closing (transfer) date, and 0 otherwise. The closing date is the date at which control of the target transfers from sellers to buyers through the legal transfer of shares or assets.
Warranties Number of warranties in a contract. Warranties provide statements about target (or seller) quality. Each separate quality statement is considered as a separate warranty.
Covenants Number of covenants in a contract. Covenants prescribe the behavior of the target and the seller in the period between the signing date and the closing (transfer) date. Each separate prescription of behavior is considered a separate covenant. The closing date is the date at which control of the target transfers from sellers to buyers through the legal transfer of shares or assets.
Bargaining Process
First Draft By Buyer Dummy variable which takes the value 1 if the first draft of the contract was provided by the buyer lawyer, and 0 if it was provided by the seller lawyer.
Closing Time Number of days between the signing date and the closing date. The closing date is the date at which control of the target transfers from sellers to buyers through the legal transfer of shares or assets.
Pricing
Acquisition Premium Target Market Value divided by Target Book Value. The variable is winsorized at 2%.
Earnout Dummy variable which takes the value 1 if the contract stipulates that parts of the purchase price are conditional on target performance after the closing date, and 0 otherwise.
Purchase Price Adjustment
Dummy variable which takes the value 1 if the contract contains a purchase price adjustment, and 0 otherwise.A purchase price adjustment is an adjustment to the purchase price based on book values of the target on the

closing date. The closing date is the date at which control of the target transfers from sellers to buyers through the legal transfer of shares or assets.
Lawyer Expertise
Relative Lawyer Expertise
Index which measures relative lawyer expertise and reflects the legal expertise of the buyer’s lead lawyer relative to the legal expertise of the seller’s lead lawyer. The variable averages the following index components that measure different aspects of relative lawyer expertise: (i) Years as Partner; (ii) Deal Experience; (iii) M&A Specialist; (iv) Chambers Recommendation; (v) Law School Ranking; and (vi) US Education. The index ranges between 0 (more seller lawyer expertise) and 1 (more buyer lawyer expertise).
Years as Partner Variable which reflects the years of experience of the buyer’s lead lawyer relative to that of the seller’s lead lawyer. Years of experience is the number of years between the year in which the lead lawyer has been promoted to partner status and the year in which the contract is signed. The ratio is standardized such that it ranges between 0 (more seller lawyer experience) and 1 (more buyer lawyer experience). Transactions where the seller (buyer) has not requested legal advice are coded such that the variable takes the value 1 (0). The variable is winsorized at 5%.
Deal Experience Variable which reflects the deal experience of the buyer’s lead lawyer relative to that of the seller’s lead lawyer. Deal experience is the number of deals that a lawyer has advised on between 01/1995 and 05/2010. The ratio is standardized such that it ranges between 0 (more seller lawyer experience) and 1 (more buyer lawyer experience). Transactions where the seller (buyer) has not requested legal advice are coded such that the variable takes the value 1 (0). The variable is winsorized at 5%.
M&A Specialist Variable which takes three values: 0 if only the seller’s lead lawyer is an M&A specialist; 0.5 if both or neither lead lawyers are M&A specialists; and 1 if only the buyer’s lead lawyer is an M&A specialist. A lead lawyer is considered an M&A specialist if the corporate web‐profile of the lawyer explicitly specifies M&A law as the specialization of the lawyer (rather than other specializations such as tax law or competition law).
Chambers Recommendation
Variable which takes three values: 0 if only the seller’s lead lawyer is recommended in the Chambers Expert Lawyer ranking; 0.5 if both or neither lead lawyers are recommended in the ranking; and 1 if only the buyer’s lead lawyer is recommended in the ranking. The Chambers Expert Lawyer ranking provides information on “the world’s leading lawyers.”
Law School Ranking Variable which reflects the quality of the law school at which the buyer’s lead lawyer has studied relative to that of the seller’s lead lawyer. We employ the 2012 law school ranking from www.topuniversities.com. We use the inverse of the rank to ensure that higher values indicate higher quality. The ratio is standardized such that it ranges between 0 (seller lawyer from better university) and 1 (buyer lawyer from better university). The variable is winsorized at 5%.
US Education Variable which takes three values: 0 if only the seller’s lead lawyer has studied at a US law school; 0.5 if both or neither lead lawyers have studied at a US law school; and 1 if only the buyer’s lead lawyer has studied at a US law school.
Seller Lawyer Expertise Index which measures the legal expertise of the seller lawyer only. The variable average six expertise measures of the seller lawyer: (i) Years as Partner; (ii) Deal Experience; (iii) M&A Specialist; (iv) Chambers Recommendation; (v) Law School Ranking; and (vi) US Education. The variable ranges between 0 (low seller lawyer expertise) and 1 (high seller lawyer expertise).
Buyer Lawyer Expertise Index which measures the legal expertise of the buyer lawyer only. The variable average six expertise measures of the buyer lawyer: (i) Years as Partner; (ii) Deal Experience; (iii) M&A Specialist; (iv) Chambers Recommendation; (v) Law School Ranking; and (vi) US Education. The variable ranges between 0 (low buyer lawyer expertise) and 1 (high buyer lawyer expertise).

Appendix A‐2 Comparison of Sample with Mergermarket
This table compares characteristics of the transactions in our sample with those of other transactions reported in Mergermarket. Our comparison group consists of other private transactions where at least one of the involved parties is located in The Netherlands (2,601 deals). The panels compare mean values and report difference‐in‐means tests that compare our sample with the Mergermarket sample. To ensure comparability, this analysis uses only those 119 deals in our sample that are also reported in Mergermarket. Summary statistics may therefore differ from those reported in Table 1 and Appendix A‐2. *** indicates significance at 1%, ** indicates significance at 5% and * indicates significance at 10%.
Panel A: Comparison of Deal Characteristics
This Study
Merger‐ market
Difference
Purchase Price (mEUR) 555 242 314** Value Announced 52% 39% 13%** Equity Payment 2% 2% 0% Percentage Equity Payment 2% 2% 0%
EBIT Multiple 15.8 36 ‐20.2 EBITDA Multiple 10 44.9 ‐34.9 Cross‐Country Deal 51% 66% ‐15%*** Controlled Auction 3% 2% 1%
Management Buyout 15% 11% 4%* Private Equity 11% 11% 0%
Panel B: Comparison of Target, Seller, and Buyer Characteristics
Location Target Buyer Seller
This Study
Merger‐ market
Diff. This Study
Merger‐ market
Diff. This Study
Merger‐ market
Diff.
The Netherlands 86% 57% 29%*** 57% 66% ‐9%** 83% 43% 39%*** Europe (excl. NL) 12% 29% ‐17%*** 26% 21% 5% 12% 35% ‐23%*** North America 2% 6% ‐4%** 11% 9% 0.02 3% 14% ‐11%** Rest of World 1% 5% ‐4%** 5% 4% 0.01 2% 6% ‐4%**
Advisors Target Buyer Seller
This Study
Merger‐ market
Diff. This Study
Merger‐ market
Diff. This Study
Merger‐ market
Diff.
Advised by Our Law Firm n/a n/a n/a 50% 2% 48%*** 36% 2% 34%*** Law Firm Top 10 n/a n/a n/a 10% 15% ‐5% 18% 11% 7%** Bank Involved n/a n/a n/a 43% 30% 13%*** 63% 38% 25%***Bank Top 10 n/a n/a n/a 18% 9% 9%*** 17% 11% 6%**

Appendix A‐3 Overview of Negotiation Process
This table provides an overview of the negotiation process for the acquisitions of privately targets, based on the acquisition files and interviews with 14 lead lawyers (partners) of our law firm. It is complemented with information from Freund (1975), Frankel (2005), and Clifford Chance (2011). We report the negotiation process separately for acquisitions organized with and without auctions.
Step Issue One‐on‐One Negotiations Auction
Step 1 Signaling Interest
Buyer or seller initiates the contact, either directly or via advisors.
If seller initiates the sale, often a “teaser” is provided: a two‐page document with initial information on the target.
Seller initiates negotiations and searches (via banks) for potentially interested buyers.
Bidders are contacted with a “teaser”: a two‐page document with initial information on the target.
Step 2 Non‐Disclosure Agreement
Parties sign a non‐disclosure agreement (NDA), where they commit to keep information confidential.
Interested bidders sign a non‐disclosure agreement.
Step 3 Information Memorandum
Seller provides more detailed information about the target, often in a formal information memorandum (IM).
Seller provides more detailed information about target financials and performance.
Step 4 Letter of Intent Buyer indicates an initial (non‐binding) offer price.
Parties may sign a Letter of Intent (LOI), which outlines the initial price, the structure of the deal, and exclusivity during negotiations. Usually prepared by a law firm.
Bidders indicate their initial offers through (i) an offer LOI, or (ii) an offer mark‐up of a seller‐provided contract draft (which includes the price).
Seller selects a few bidders and continues negotiations with them.
Step 5 Due Diligence Buyer engages in an in‐depth due diligence investigation of the target, usually with the help of an investment bank.
Seller provides a due diligence report containing detailed target information.
Step 6 Contract Negotiation
One party provides a first draft of an initial acquisition contract, based on a sample provided by the advising law firms.
Negotiations take place and are reflected in the contract through mark‐ups of the draft.
This can continue for many rounds of mark‐ups.
Adjustments to the initial offer price are typically only downwards as new information arises and warranties or covenants are not granted to the buyer.
Unless done in Step 4, the seller provides a draft acquisition contract.
Bidders provide a binding offer, which contains a combination of a price and a mark‐up of the draft acquisition contract.
Price and contract provisions are determined jointly in the offers that bidders make.
Seller selects the final bidder(s) to finalize negotiations.
Step 7 Signing Parties sign the acquisition contract, specifying the conditions that need to be fulfilled before the closing.
Closing conditions may also allow for renegotiations if information arises and/or adverse events occur.
After final negotiations, the seller chooses the winning bidder and both parties sign the contract.
A set of closing conditions may apply as in the one‐on‐one negotiations.
Step 8 Closing Transfer of control of the target from the seller to the buyer.
Transfer of control of the target from the seller to the buyer.

Appendix A‐4 Negotiating Outcomes: Buyer and Seller Interests
This table provides an overview of the negotiation outcomes considered in our analysis and the economic interests of buyers and sellers, respectively.
Buyers Sellers
Prefer Reason Prefer Reason
Contract Design
%Warranties w/o Qualifier
High Warranties can come with the statement: “so far as the seller is aware”. Without such a knowledge qualifier, warranties also cover issues that sellers are unaware of (i.e., sellers provides insurance). So buyers prefermore warranties without knowledge qualifiers.
Low Warranties can come with the statement: “so far as the seller is aware”. This implies that the sellers do not provide insurance for issues they are unaware of. So sellers prefer more warranties with a knowledge qualifier.
Legal Compliance Warranty w/o Qualifier
Yes Warranty on legal compliance can come with the statement: “so far as the seller is aware”. Without such a knowledge qualifier,the warranty also covers issues that sellers are unaware of (i.e., sellers provides insurance). So buyers prefer this warranty without a knowledge qualifier.
No Warranty on legal compliance can come with the statement: “so far as the seller is aware”. Without such a qualifier, the warranty also covers issues that sellers are unaware of (i.e., sellers provides insurance). So sellers prefer this warranty with a knowledge qualifier.
Warranties Not Material
Yes If warranties breaches need to be material, they are more difficult to enforce. Buyers prefer that this provision is not included as warranty breaches can then be enforced more easily.
No If warranties breaches need to be material, they are more difficult to enforce. Sellers prefer that this provision is included as warranty breaches are then more difficult to enforce.
%Payment Secured High Buyers want to secure as much money as possible to ensure that sellers can pay any damage claims related to warranty violations that may come up.
Low Sellers want to place as little money as possible in a secured account as this implies that sellers cannot yet have access to this money. Moreover, this money may be seized to cover damage claims related to warranty violations.
MAC Clause Yes A MAC clause allows buyers to cancel a deal if an adverse event occurs between signing and closing. Buyers prefer to include a MAC clause as this places the risk of such events on sellers.
No Sellers prefer not to include a MAC clause as this places the risk of adverse events on sellers and reduces deal certainty.
Bargaining Process
First Draft By Buyer Yes Buyers prefer to deliver the first draft contract as this provides a first‐mover advantage due to path dependence in negotiations.
No Sellers prefer to deliver the first draft contract as this provides a first‐mover advantage due to path dependence in negotiations.
Closing Time Short Buyers prefer short closing times (time between signing and closing) as sellers still control the targets until closing even though the price has been fixed. Until closing, sellers can act opportunistically and extract private benefits from targets.
Long
Sellers prefer long closing times (time between signing and closing) as sellers keep control over the target until closing whereas the prices have been fixed. Until closing, sellers can act opportunistically and extract private benefits from targets.
Pricing
Acquisition Premium
Low Buyers prefer to pay a low price. High Sellers prefer to receive a high price.

Appendix A‐5 Underlying Lawyer Expertise Variables: Summary Statistics
This table provides an overview of the legal expertise of the lead lawyers representing the buyer and seller, respectively. This data is used to create the relative legal expertise variables. Note that the variables reported in this panel are not yet standardized to range between 0 and 1. Statistics are reported at the transaction level.
Advisor of Buyer Advisor of Seller
Mean Median Std. Dev. Obs. Mean Median Std. Dev. Obs.
Years as Partner (in years) 7.9 7.0 6.2 139 6.7 6.0 5.7 132Deal Experience (number of deals) 34.5 32.0 25.4 144 32.7 30.5 28.3 134M&A Specialist 89% 143 79% 140
Chambers Recommendation 64% 151 46% 151Law School Ranking (inverse of rank) 0.07 0.02 0.17 140 0.07 0.02 0.18 135US Education 25% 143 21% 136

Appendix A‐6 Negotiation Outcomes: Separate Effects of Index Components
This table reports OLS and logit regressions to explain negotiation outcomes in M&A transactions. The sample consists of 151 acquisitions of private targets between 2005 and 2010. We report the coefficients (t‐statistics) of the six individual relative expertise components (reported vertically) that make up the index Relative Lawyer Expertise. The six relative expertise variables range between 0 and 1, where higher values indicate more legal expertise on the buyer side. The regressions use the same control variables as those in Table 4 (not reported). The regression in Column 5 only contains deals where signing and closing where not on the same day as MAC clauses are otherwise not relevant. Detailed variable definitions are provided in Appendix A‐1. We report t‐statistics in parentheses, calculated using robust standard errors. *** indicates significance at 1%, ** at 5%, and * at 10%.
Contract Design Bargaining Process
Dependent Variable: %Warranties w/o
Qualifier
Legal Compliance Warranty
w/o Qualifier
Warranties Not Material
%Payment Secured
MAC Clause First Draft By Buyer
Closing Time
(1) (2) (3) (4) (5) (6) (7)
Years as Partner 0.05* 0.94 1.63* 0.03 0.06 0.07 ‐47.26*** (1.72) (0.97) (1.69) (1.22) (0.07) (0.09) (‐2.84)
Deal Experience 0.08** 1.46 3.42** ‐0.02 0.77 1.72** ‐33.97** (2.40) (1.34) (2.23) (‐0.71) (0.77) (2.33) (‐2.11)
M&A Specialist 0.13* ‐1.39 1.89* 0.00 1.24 2.36** ‐52.35** (1.83) (‐1.44) (1.79) (0.07) (0.95) (2.00) (‐2.28)
Chambers Recommendation 0.03 ‐0.59 1.10 0.03 1.23* 0.62 ‐6.13 (1.14) (‐0.71) (1.54) (1.49) (1.67) (0.83) (‐0.31)
Law School Ranking 0.06 4.13 1.56 ‐0.04* 1.15 1.05 ‐17.20 (1.24) (1.55) (1.18) (‐1.67) (1.42) (1.10) (‐0.70)
US Education 0.12*** 2.57*** 2.61** ‐0.01 1.63** 1.76** ‐8.16 (2.87) (2.76) (2.49) (‐0.33) (2.26) (2.10) (‐0.31)