m&a review - global, 2016 - bvdinfo.com · you are free to use any data or commentary from this...
TRANSCRIPT

M&A Review
Global
Full year 2016
Zephyr Quarterly M&A ReportGlobal, Q3 2015

+44 161 838 9554 [email protected]
M&A ReviewGlobal, Full Year 2016
Page 1 © Bureau van Dijk Bureau van Dijk is the leading provider of private company, corporate ownership and deal information www.bvdinfo.com
The following report details mergers and acquisitions activity in Full Year 2016 using data from the Zephyr database.
It focuses on deal activity by target company.
Click here to access the raw data in an Excel spreadsheet.
Section 1: Global Deals Page 1
Section 2: Western Europe Page 17
Section 3: North America Page 28
Section 4: Asia/Asia Pacific Page 38
Section 5: MENA Page 49
Section 5: Russia/CEE Page 60
Global M&A down year-on-year
Both the volume and value of global mergers and acquisitions (M&A) declined in 2016 after a record breaking year on both fronts in 2015. In all there were 96,665 deals worth a combined USD 4,734,165 million announced over the course of the 12 months.
Value declined 21 per cent on 2015, when dealmaking of USD 6,011,581 million was signed off, while volume fell 10 per cent from 107,182 over the same timeframe. Both volume and value were also surpassed by the 102,176 deals worth USD 4,802,023 million signed off in 2014. However, despite the relatively disappointing showing when compared with 2014 and 2015, the latter of which was a record-breaking year, 2016’s value is still significantly higher than any other year since 2007.
Private equity and venture capital (PE and VC) followed a similar pattern to M&A as both volume and value declined on 2015. In all there were 21,580 PE and VC deals worth a combined USD 558,008 million, compared to 25,855 worth USD 766,691 million in 2015.
Global deals by volume and value
Announced date No of dealsTotal deal value (mil USD)
2016 96,665 4,734,165
2015 107,182 6,011,581
2014 102,176 4,802,023
2013 92,391 3,691,926
2012 85,238 3,327,268
2011 84,382 3,477,727
You are free to use any data or commentary from this report in your articles as long as the source is cited as “Zephyr published by Bureau van Dijk”
The most comprehensive deal database
The world’s most powerful comparable data resource on private companies
Combining deal and company dataWelcome to the business of certainty.
We capture and treat private company and M&A information for better decision making and increased efficiency.

You are free to use any data or commentary from this report in your articles as long as the source is cited as “Zephyr published by Bureau van Dijk”
+44 161 838 9554 [email protected]
M&A ReviewGlobal, Full Year 2016
Page 2 © Bureau van Dijk Bureau van Dijk is the leading provider of private company, corporate ownership and deal information www.bvdinfo.com
Global deals by volume and value
0
20,000
40,000
60,000
80,000
100,000
120,000
0
1,000,000
2,000,000
3,000,000
4,000,000
5,000,000
6,000,000
7,000,000
2011 2012 2013 2014 2015 2016
Dea
l val
ue (m
il U
SD
)
Total deal value (mil USD) Number of deals

You are free to use any data or commentary from this report in your articles as long as the source is cited as “Zephyr published by Bureau van Dijk”
+44 161 838 9554 [email protected]
M&A ReviewGlobal, Full Year 2016
Page 3 © Bureau van Dijk Bureau van Dijk is the leading provider of private company, corporate ownership and deal information www.bvdinfo.com
US leads the way in 2016
US targets once again topped the rankings by both volume and value in 2016. In terms of the latter, companies based in the country were targeted in deals worth a combined USD 1,617,652 million. In keeping with the overall trend for the year, this represented a decline on the USD 1,994,398 million recorded in 2015. However, the country placed well ahead of its nearest rivals in 2016; China was second with USD 788,868 million while the UK placed third with USD 419,990 million.
The US’s performance has once again been boosted by a significant number of large deals; 12 of the year’s 20 largest deals by value featured targets in the country.
Many countries followed the overall pattern for M&A; in terms of value a year-on-year decline was recorded for the top eight countries, while volume was also down across many countries. However, exceptions include Canada, which increased from 4,288 deals in 2015 to 4,443, while Germany climbed from 3,263 to 4,156 over the same timeframe.
Most world regions declined in terms of value year-on-year, with the Middle East proving to be the only exception as dealmaking there rocketed from USD 37,413 million in 2015 to USD 62,576 million. A similar pattern was evident in terms of volume; only Western Europe and the Middle East improved on 2015.
One other deal broke the USD 50,000 million barrier as German chemicals and pharmaceuticals giant Bayer agreed to pick up US agrochemical and agricultural biotechnology player Monsanto for USD 66,000 million.
2016’s largest private equity transaction was worth USD 11,943 million and featured Apollo Global Management, via its Prime Security Services Borrower vehicle, acquiring electronic security, fire protection and alarm monitoring services provider ADT.
Machinery, equipment, furniture and recycling is top sector by value in 2016
Deals targeting companies in the machinery, equipment, furniture and recycling sector were worth a combined USD 659,979 million in 2016, making it the most valuable sector over the 12 months. The industry’s largest deal of the year placed fourth overall and was Qualcomm’s USD 47,000 million acquisition of Dutch semiconductor maker NXP Semiconductors. There were also sizeable transactions featuring the likes of ARM Holdings and St Jude Medical announced within the industry in 2016.
Second place was taken by the chemicals, rubber and plastics sector, which was targeted in deals worth USD 486,540 million. Other industries which attracted significant levels of investment include the primary sector (USD 269,607 million), gas, water and electricity (USD 246,810 million) and food, beverages and tobacco (USD 233,741 million). The latter two industries bucked the underlying trend for 2016 and actually improved on 2015’s results (USD 230,819 million and USD 195,363 million, respectively).
UK boosted by year’s largest deal
Despite placing third by value in terms of countries, the UK was targeted in the year’s most valuable transaction as Anheuser-Busch InBev acquired beer manufacturer SABMiller for USD 124,444 million via its Newbelco vehicle. That deal accounted for 30 per cent of total UK investment (USD 419,990 million) and 3 per cent of global value in 2016.
Second place was taken by AT&T’s USD 108,700 million purchase of US media and entertainment conglomerate Time Warner, which was announced in October and is expected to close by the end of 2017. This deal represents 7 per cent of total US investment in 2016 (USD 1,617,652 million) and 2 per cent of global dealmaking for the year.

You are free to use any data or commentary from this report in your articles as long as the source is cited as “Zephyr published by Bureau van Dijk”
+44 161 838 9554 [email protected]
M&A ReviewGlobal, Full Year 2016
Page 4 © Bureau van Dijk Bureau van Dijk is the leading provider of private company, corporate ownership and deal information www.bvdinfo.comZephyr is a database of M&A, IPO, private equity and venture capital deals with links to detailed financial information on companies. For more information visit www.zephyrdealdata.com.
Top 20 global deals by value
Deal value (mil USD) Deal type Target Target
country Acquiror Acquiror country
Announced date
1. 124,444 Acquisition 100% SABMiller plc GB Newbelco SA/NV BE 26/07/2016
2. 108,700 Acquisition 100% Time Warner Inc. US AT&T Inc. US 22/10/2016
3. 66,000 Acquisition 100% Monsanto Company US Bayer AG DE 14/09/2016
4. 47,000 Acquisition 100% NXP Semiconductors NV NL Qualcomm Inc. US 27/10/2016
5. 43,000 Acquisition 100% Syngenta AG CH CNAC Saturn (NL) BV NL 03/02/2016
6. 34,000 Acquisition 100% Level 3 Communications Inc. US WWG Merger Sub LLC US 31/10/2016
7. 32,364 Acquisition 100% ARM Holdings plc GB Softbank Group Corporation JP 18/07/2016
8. 32,000 Acquisition 100% Baxalta Inc. US Shire plc GB 11/01/2016
9. 30,700 Acquisition 100% St Jude Medical Inc. US Vault Merger Sub LLC US 28/04/2016
10. 28,315 Acquisition 100% Johnson Controls Inc. US Tyco International plc IE 25/01/2016
11. 28,000 Acquisition 100% Spectra Energy Corporation US Enbridge Inc. CA 06/09/2016
12. 26,200 Acquisition 100% LinkedIn Corporation US Microsoft Corporation US 13/06/2016
13. 22,550 Acquisition increased 39% to 100% Sky plc GB Twenty-First Century Fox Inc. US 15/12/2016
14. 21,319 Acquisition 100% Energy Transfer Partners LP US Sunoco Logistics Partners LP US 21/11/2016
15. 18,400 Acquisition 100% Energy Future Holdings Corporation US EFH Merger Company LLC US 29/07/2016
16. 17,601 Acquisition 100% BlackRock Inc.'s defined contribution pension platform and administration business GB Aegon NV NL 03/05/2016
17. 14,841 Acquisition 100% First Gulf Bank PJSC AE National Bank of Abu Dhabi AE 03/07/2016
18. 14,800 Acquisition 100% Linear Technology Corporation US Analog Devices Inc. US 26/07/2016
19. 14,767 Acquisition 100% London Stock Exchange Group plc GB HLDCO123 plc GB 16/03/2016
20. 14,000 Acquisition 100% Medivation Inc. US Pfizer Inc. US 22/08/2016

You are free to use any data or commentary from this report in your articles as long as the source is cited as “Zephyr published by Bureau van Dijk”
+44 161 838 9554 [email protected]
M&A ReviewGlobal, Full Year 2016
Page 5 © Bureau van Dijk Bureau van Dijk is the leading provider of private company, corporate ownership and deal information www.bvdinfo.com
Target country by volume - global deals
Target country 2014 2015 2016
US 26,297 25,597 21,335
China 7,018 11,563 11,499
UK 6,624 7,564 6,718
Canada 4,622 4,288 4,443
Germany 2,063 3,263 4,156
Australia 4,481 4,358 3,526
Spain 2,804 3,232 3,197
France 2,243 3,044 3,176
Japan 4,043 3,829 2,788
South Korea 3,392 3,677 2,659
Poland 1,830 2,357 2,649
India 3,208 3,467 2,644
Netherlands 1,507 2,025 2,153
Sweden 1,390 1,554 1,937
Russia 3,050 2,074 1,872
Italy 1,408 1,379 1,766
Taiwan 2,342 2,465 1,659
Czech Republic 230 354 1,405
Switzerland 525 941 1,269
Malaysia 1,383 1,300 1,108
Target country by value - global deals
Target country 2014 (mil USD)
2015 (mil USD)
2016 (mil USD)
US 1,733,730 1,994,398 1,617,652
China 533,750 1,037,645 788,868
UK 264,853 423,301 419,990
Netherlands 91,194 171,021 143,234
France 117,093 143,903 137,006
Canada 178,474 146,525 123,723
Australia 140,716 158,654 108,038
Germany 123,821 111,892 105,969
Switzerland 70,785 57,642 103,675
Japan 149,881 146,682 102,004
India 72,720 86,527 97,229
South Korea 112,870 108,759 89,709
Spain 90,889 91,432 82,104
Russia 122,086 92,107 78,089
Italy 100,791 131,829 77,060
Cayman Islands 65,972 116,406 68,850
Taiwan 56,231 75,061 46,580
Sweden 31,931 31,528 44,241
British Virgin Islands 27,861 49,621 41,654
Bermuda 41,146 67,572 41,250

You are free to use any data or commentary from this report in your articles as long as the source is cited as “Zephyr published by Bureau van Dijk”
+44 161 838 9554 [email protected]
M&A ReviewGlobal, Full Year 2016
Page 6 © Bureau van Dijk Bureau van Dijk is the leading provider of private company, corporate ownership and deal information www.bvdinfo.com
Top five global target countries by deal volume in 2016 Top five global target countries by deal value in 2016
22%
12%
7%
5%4%
50%
US
China
UK
Canada
Germany
All other countries
33%
17%9%
3%2%
36%
US
China
UK
Netherlands
France
All other countries

You are free to use any data or commentary from this report in your articles as long as the source is cited as “Zephyr published by Bureau van Dijk”
+44 161 838 9554 [email protected]
M&A ReviewGlobal, Full Year 2016
Page 7 © Bureau van Dijk Bureau van Dijk is the leading provider of private company, corporate ownership and deal information www.bvdinfo.com
Top five global target countries by deal volume in 2016 Deal volume between 2011 and 2016
Top five global target countries by deal value in 2016 Deal value between 2011 and 2016
0
5,000
10,000
15,000
20,000
25,000
30,000
2011 2012 2013 2014 2015 2016
Nu
mb
er
of
de
als
US China UK Canada Germany
0
500,000
1,000,000
1,500,000
2,000,000
2,500,000
2011 2012 2013 2014 2015 2016
De
al va
lue
(m
il U
SD
)US China UK Netherlands France

You are free to use any data or commentary from this report in your articles as long as the source is cited as “Zephyr published by Bureau van Dijk”
+44 161 838 9554 [email protected]
M&A ReviewGlobal, Full Year 2016
Page 8 © Bureau van Dijk Bureau van Dijk is the leading provider of private company, corporate ownership and deal information www.bvdinfo.com
Target sector by volume - global deals
Target sector 2014 2015 2016
Other services 39,264 39,492 34,626
Machinery, equipment, furniture, recycling 11,548 12,737 10,803
Wholesale & retail trade 7,159 6,947 5,929
Chemicals, rubber, plastics 5,627 6,050 5,388
Metals & metal products 5,177 5,501 5,355
Publishing, printing 4,592 6,076 5,252
Construction 4,128 4,319 3,473
Primary sector 3,746 3,319 3,063
Food, beverages, tobacco 2,523 2,713 2,157
Banks 1,941 1,911 2,118
Transport 2,074 2,241 2,006
Gas, water, electricity 2,008 2,105 1,764
Education, health 1,682 1,744 1,537
Hotels & restaurants 1,537 1,509 1,336
Insurance companies 1,438 1,539 1,276
Post and telecommunications 1,161 1,489 1,121
Textiles, wearing apparel, leather 1,130 1,159 904
Wood, cork, paper 683 727 563
Public administration and defence 66 67 65
Target sector by value - global deals
Target sector 2014 (mil USD)
2015 (mil USD)
2016 (mil USD)
Other services 1,356,050 1,537,298 1,395,219
Machinery, equipment, furniture, recycling 618,640 728,289 659,979
Chemicals, rubber, plastics 484,162 606,390 486,540
Primary sector 320,556 330,649 269,607
Gas, water, electricity 207,067 230,819 246,810
Food, beverages, tobacco 169,391 195,363 233,741
Wholesale & retail trade 258,822 322,687 227,223
Banks 352,297 361,124 203,884
Construction 175,259 333,958 196,574
Transport 246,278 258,612 157,741
Metals & metal products 140,365 155,129 155,975
Publishing, printing 90,221 144,029 138,940
Post and telecommunications 182,805 339,492 113,858
Insurance companies 98,979 268,721 77,447
Hotels & restaurants 68,226 55,977 65,668
Education, health 45,230 69,955 43,109
Textiles, wearing apparel, leather 34,198 36,870 24,096
Wood, cork, paper 22,424 41,615 19,410
Public administration and defence 3,504 6,556 1,328

You are free to use any data or commentary from this report in your articles as long as the source is cited as “Zephyr published by Bureau van Dijk”
+44 161 838 9554 [email protected]
M&A ReviewGlobal, Full Year 2016
Page 9 © Bureau van Dijk Bureau van Dijk is the leading provider of private company, corporate ownership and deal information www.bvdinfo.com
Global private equity deals by volume and value
Announced date No of deals Total deal value (mil USD)
2016 21,580 558,008
2015 25,855 766,691
2014 25,273 570,172
2013 21,440 488,992
2012 19,747 379,216
2011 18,649 378,910

You are free to use any data or commentary from this report in your articles as long as the source is cited as “Zephyr published by Bureau van Dijk”
+44 161 838 9554 [email protected]
M&A ReviewGlobal, Full Year 2016
Page 10 © Bureau van Dijk Bureau van Dijk is the leading provider of private company, corporate ownership and deal information www.bvdinfo.com
Global private equity deals by volume and value
0
5,000
10,000
15,000
20,000
25,000
30,000
0
100,000
200,000
300,000
400,000
500,000
600,000
700,000
800,000
900,000
2011 2012 2013 2014 2015 2016
Dea
l val
ue (m
il U
SD
)
Total deal value (mil USD) Number of deals

You are free to use any data or commentary from this report in your articles as long as the source is cited as “Zephyr published by Bureau van Dijk”
+44 161 838 9554 [email protected]
M&A ReviewGlobal, Full Year 2016
Page 11 © Bureau van Dijk Bureau van Dijk is the leading provider of private company, corporate ownership and deal information www.bvdinfo.com
Top 20 global private equity deals by value
Deal value (mil USD) Deal type Target Target
country Fund Manager/General Partner Announced date
1. 11,943 IBO 100% The ADT Corporation US Koch Equity Development LLC 16/02/2016
2. 10,629 Acquisition 61% National Grid plc's regional gas distribution business GB Allianz Capital Partners GmbH; Macquarie Infrastructure and Real Assets (Europe) Ltd 08/12/2016
3. 9,238 IBO 100% Asciano Ltd AU Canada Pension Plan Investment Board; Global Infrastructure Management LLC 21/04/2016
4. 7,500 IBO majority stake MultiPlan Inc. US Hellman & Friedman LLC; Leonard Green & Partners LP 05/05/2016
5. 7,181 Acquisition 100% Government of Victoria’s Port of Melbourne operating project company
AU Global Infrastructure Management LLC 19/09/2016
6. 6,100 IBO 100% TeamHealth Holdings Inc. US The Blackstone Group LP 31/10/2016
7. 5,500 Acquisition 100% Cabela's Inc. US Goldman Sachs & Co 03/10/2016
8. 5,200 IBO 65% Talen Energy Corporation US Riverstone Holdings LLC 03/06/2016
9. 5,194 Acquisition 90% Nova Transportadora do Sudeste SA BR Brookfield Infrastructure Partners LP 23/09/2016
10. 4,500 Capital Increase Zhejiang Ant Small and Micro Financial Services Group Co., Ltd CN Primavera Capital Management Ltd; China Development Bank Capital Corporation Ltd 26/04/2016
11. 4,441 Acquisition increased 44% to 58% Dalian Wanda Commercial Properties Co., Ltd CN Pohua JT Capital Partners Ltd 30/06/2016
12. 4,400 Acquisition 100% New CIE US Hony Capital Co., Ltd; Yunfeng Capital Ltd 30/07/2016
13. 4,348 Minority stake 50% Reseau de Transport d'Electricite SA FR Caisse des Dépôts Developpement SA 14/12/2016
14. 4,300 IBO 100% Rackspace Hosting Inc. US Apollo Global Management LLC; Searchlight Capital Partners LP 26/08/2016
15. 4,241 Minority stake 20% Gas Natural SDG SA ES Global Infrastructure Management LLC 12/09/2016
16. 4,000 IBO majority stake Ultimate Fighting Championship US KKR & Co LP; MSD Capital LP; Silver Lake Technology Management LLC 11/07/2016
17. 4,000 IBO majority stake Emerson Network Power US Platinum Equity LLC 02/08/2016
18. 4,000 Acquisition 100% Lexmark International Inc. US Beijing Legend Capital Management Co., Ltd 19/04/2016
19. 3,906 IBO 100% Vattenfall Europe Mining AG; Vattenfall Europe Generation AG DE; DE PPF Group NV 18/04/2016
20. 3,652 Acquisition 100% Propertize BV NL Lone Star Global Acquisitions Ltd 28/06/2016

You are free to use any data or commentary from this report in your articles as long as the source is cited as “Zephyr published by Bureau van Dijk”
+44 161 838 9554 [email protected]
M&A ReviewGlobal, Full Year 2016
Page 12 © Bureau van Dijk Bureau van Dijk is the leading provider of private company, corporate ownership and deal information www.bvdinfo.com
Target country by volume - global private equity deals
Target country 2014 2015 2016
US 16,918 15,819 13,027
China 1,136 2,467 1,635
India 487 1,000 996
UK 1,099 1,020 867
France 635 728 629
Canada 856 665 575
Germany 452 505 496
Sweden 184 171 309
Japan 205 190 279
Spain 321 338 253
Netherlands 240 258 206
Russia 255 194 203
Israel 173 209 203
Italy 183 200 166
South Korea 75 139 153
Finland 195 183 145
Australia 93 120 108
Switzerland 72 77 83
Denmark 83 82 80
Singapore 75 88 79
Target country by value - global private equity deals
Target country 2014 (mil USD)
2015 (mil USD)
2016 (mil USD)
US 292,285 441,957 268,152
China 40,454 53,570 47,030
UK 45,905 62,803 36,802
Australia 8,506 14,557 23,006
France 25,814 13,023 22,921
Germany 21,580 18,868 22,307
Netherlands 9,293 14,802 17,917
Spain 10,941 16,342 12,142
Italy 6,230 6,146 11,253
India 7,737 14,345 9,355
South Korea 9,390 15,942 8,474
Canada 7,451 11,534 7,194
Cayman Islands 6,636 20,868 6,607
Sweden 3,023 2,972 6,235
Brazil 3,432 7,092 6,233
Luxembourg 4,194 2,660 4,675
Israel 1,622 2,537 4,502
Japan 6,132 2,237 4,402
Poland 200 914 3,974
Switzerland 8,567 2,633 3,830

You are free to use any data or commentary from this report in your articles as long as the source is cited as “Zephyr published by Bureau van Dijk”
+44 161 838 9554 [email protected]
M&A ReviewGlobal, Full Year 2016
Page 13 © Bureau van Dijk Bureau van Dijk is the leading provider of private company, corporate ownership and deal information www.bvdinfo.com
Target sectors by volume - global private equity deals
Target sector 2014 2015 2016
Other services 12,566 12,005 9,594
Publishing, printing 1,976 2,669 1,982
Machinery, equipment, furniture, recycling 1,902 1,952 1,380
Wholesale & retail trade 729 705 508
Chemicals, rubber, plastics 621 603 431
Education, health 363 383 339
Food, beverages, tobacco 297 298 244
Gas, water, electricity 259 234 211
Metals & metal products 259 221 162
Hotels & restaurants 169 156 144
Construction 192 160 121
Primary sector 205 156 115
Post and telecommunications 147 149 111
Transport 116 152 108
Textiles, wearing apparel, leather 145 157 93
Banks 138 103 71
Insurance companies 72 81 64
Wood, cork, paper 71 69 54
Public administration and defence 21 18 18
Target sectors by value - global private equity deals
Target sector 2014 (mil USD)
2015 (mil USD)
2016 (mil USD)
Other services 209,123 284,834 224,723
Machinery, equipment, furniture, recycling 45,040 102,608 52,392
Gas, water, electricity 25,038 13,278 46,941
Publishing, printing 35,679 66,274 45,447
Transport 12,627 28,948 28,172
Wholesale & retail trade 59,746 42,533 27,974
Chemicals, rubber, plastics 45,233 27,725 24,914
Primary sector 25,258 21,174 22,464
Hotels & restaurants 14,063 6,282 9,714
Education, health 8,531 17,350 9,677
Construction 10,634 9,293 8,676
Post and telecommunications 9,262 23,704 8,046
Metals & metal products 11,534 4,220 7,660
Textiles, wearing apparel, leather 4,954 4,912 4,002
Insurance companies 10,805 10,403 3,889
Food, beverages, tobacco 5,618 59,272 3,717
Banks 3,494 6,466 3,693
Wood, cork, paper 3,755 1,205 1,204
Public administration and defence 56 31 36

M&A ReportGlobal League Tables, Full Year 2016
Top 20 financial advisors global deals
Financial advisor Number of deals Number with consideration Total deal value (mil USD) Average deal value (mil USD)
1 Morgan Stanley 204 177 725,311 4,098
2 JP Morgan 267 238 711,551 2,990
3 Goldman Sachs Group Inc. 174 160 699,622 4,373
4 Bank of America Corporation 170 151 638,899 4,231
5 Credit Suisse 169 145 534,593 3,687
6 Barclays plc 155 132 533,573 4,042
7 Citigroup Inc. 226 211 501,442 2,377
8 Lazard 182 134 405,618 3,027
9 Deutsche Bank AG 103 81 300,379 3,708
10 Perella Weinberg Partners LP 23 20 264,060 13,203
11 Rothschild & Co. 258 194 233,575 1,204
12 Evercore Partners Inc. 109 83 216,113 2,604
13 UBS 85 74 210,833 2,849
14 Robey Warshaw LLP 4 4 182,204 45,551
15 Centerview Partners LLC 29 29 167,701 5,783
16 BNP Paribas SA 91 63 165,550 2,628
17 RBC Capital Markets Corporation 71 58 120,660 2,080
18 China International Capital Corporation Ltd 55 53 105,247 1,986
19 Qatalyst Partners LLP 10 10 96,827 9,683
20 Guggenheim Securities LLC 25 18 82,256 4,570
These advisor rankings have been introduced to the Global report based on the most current data available at the time of writing. If you feel any of the above information is incorrect or you have not been accurately represented please get in touch with our advisors team at [email protected]

M&A ReportGlobal League Tables, Full Year 2016
Top 20 legal advisors global deals
Legal advisor Number of deals Number with consideration Total deal value (mil USD) Average deal value (mil USD)
1 Sullivan & Cromwell 83 66 427,510 6,477
2 Latham & Watkins LLP 311 218 379,449 1,741
3 Cravath Swaine & Moore LLP 42 36 376,278 10,452
4 Simpson Thacher & Bartlett LLP 132 105 364,105 3,468
5 Skadden Arps Slate Meagher & Flom LLP 197 154 349,738 2,271
6 Allen & Overy 188 114 281,044 2,465
7 Wachtell Lipton Rosen & Katz LLP 50 47 266,911 5,679
8 Freshfields Bruckhaus Deringer 72 54 253,565 4,696
9 Paul Weiss Rifkind Wharton & Garrison LLP 124 69 224,507 3,254
10 Jones Day 347 170 209,765 1,234
11 Linklaters 82 60 200,317 3,339
12 Clifford Chance LLP 163 103 195,512 1,898
13 Davis Polk & Wardwell LLP 105 88 190,064 2,160
14 Weil Gotshal & Manges LLP 181 102 189,712 1,860
15 Kirkland & Ellis LLP 278 120 183,483 1,529
16 Hogan Lovells 150 87 178,994 2,057
17 AZB & Partners 116 79 176,087 2,229
18 Morgan Lewis & Bockius LLP 187 85 147,919 1,740
19 Shearman & Sterling LLP 119 85 140,383 1,652
20 Macfarlanes LLP 36 21 137,085 6,528
These advisor rankings have been introduced to the Global report based on the most current data available at the time of writing. If you feel any of the above information is incorrect or you have not been accurately represented please get in touch with our advisors team at [email protected]

M&A ReportGlobal League Tables, Full Year 2016
Top 20 private equity firms global deals
Private equity firm Number of deals Number with consideration Total deal value (mil USD) Average deal value (mil USD)
1 The Blackstone Group LP 42 39 44,515 1,141
2 KKR & Co LP 61 50 33,598 672
3 TPG Capital Advisors LLC 30 24 31,447 1,310
4 Canada Pension Plan Investment Board 22 20 25,989 1,299
5 CVC Capital Partners Ltd 24 21 24,645 1,174
6 Global Infrastructure Management LLC 6 5 23,472 4,694
7 Sequoia Capital Operations LLC 112 93 23,179 249
8 Goldman Sachs & Co 38 31 21,920 707
9 Bain Capital Private Equity LP 25 21 19,804 943
10 Leonard Green & Partners LP 6 5 19,664 3,933
11 Carlyle Group LP 55 27 19,420 719
12 EQT Partners AB 49 34 17,581 517
13 Permira Advisers LLP 13 11 17,194 1,563
14 Apollo Global Management LLC 15 9 14,702 1,634
15 Advent International Corporation 32 22 14,559 662
16 Koch Equity Development LLC 3 2 14,443 7,222
17 Macquarie Infrastructure and Real Assets (Europe) Ltd 5 4 12,359 3,090
18 Hony Capital Co., Ltd 11 9 11,823 1,314
19 Oaktree Capital Management LP 22 13 11,310 870
20 Allianz Capital Partners GmbH 6 2 11,262 5,631
These advisor rankings have been introduced to the Global report based on the most current data available at the time of writing. If you feel any of the above information is incorrect or you have not been accurately represented please get in touch with our advisors team at [email protected]

M&A ReportWestern Europe, Full Year 2016
Page 17 You are free to use any data or commentary from this report in your articles as long as the source is cited as “Zephyr published by Bureau van Dijk”
+44 161 838 9554 [email protected]
© Bureau van Dijk Bureau van Dijk is the leading provider of private company, corporate ownership and deal information www.bvdinfo.com
Western Europe M&A volume increases against a decline by value
There were 27,454 deals worth a combined USD 1,199,313 million targeting Western European companies announced during 2016, representing 28 per cent of total global volume (96,665 deals) recorded for the 12 months under review, and a quarter of global value (USD 4,734,165 million).
While volume advanced year-on-year from 27,001 deals in 2015, value slipped 12 per cent from USD 1,369,548 million, indicating investors were carrying out more deals with lower aggregate valuations during the 12 months. On a positive note, volume was the highest recorded since 2006, when 31,047 deals were signed off, while value hit its second-highest level since 2008 as dealmaking was supported by one acquisition worth USD 124,444 million.
The volume of PE and VC investment targeting companies based in Western Europe fell back 10 per cent to 3,506 deals in 2016, bringing an end to six consecutive years of growth. Meanwhile value slipped for the second successive year to USD 146,819 million, but despite the decline, the figure still represents 26 per cent of overall global PE and VC value (USD 558,008 million) for 2016.
Western Europe deals by volume and value
Announced date No of deals Total deal value (mil USD)
2016 27,454 1,199,313
2015 27,001 1,369,548
2014 22,899 1,135,600
2013 23,505 942,103
2012 21,318 831,875
2011 21,384 847,209

M&A ReportWestern Europe, Full Year 2016
Page 18 You are free to use any data or commentary from this report in your articles as long as the source is cited as “Zephyr published by Bureau van Dijk”
+44 161 838 9554 [email protected]
© Bureau van Dijk Bureau van Dijk is the leading provider of private company, corporate ownership and deal information www.bvdinfo.com
Western Europe deals by volume and value
0
5,000
10,000
15,000
20,000
25,000
30,000
0
200,000
400,000
600,000
800,000
1,000,000
1,200,000
1,400,000
1,600,000
2011 2012 2013 2014 2015 2016
Dea
l val
ue (m
il U
SD
)
Total deal value (mil USD) Number of deals

M&A ReportWestern Europe, Full Year 2016
Page 19 You are free to use any data or commentary from this report in your articles as long as the source is cited as “Zephyr published by Bureau van Dijk”
+44 161 838 9554 [email protected]
© Bureau van Dijk Bureau van Dijk is the leading provider of private company, corporate ownership and deal information www.bvdinfo.com
SABMiller deal boosts Western European value
The largest deal by value to target a company based in Western Europe was also the largest globally and involved Anheuser-Busch InBev completing its USD 124,444 million acquisition of UK-based brewing and beverage player SABMiller through its Newbelco vehicle.
This deal was worth more than the next three deals by value combined, all of which featured acquirors based outside the region. US-based Qualcomm announced plans to acquire NXP Semiconductors of the Netherlands for USD 47,000 million while China National Chemical, through a local subsidiary, is taking over Syngenta of Switzerland for USD 43,000 million.
National Grid accounts for largest PE and VC deal of 2016
The largest PE and VC deal by value targeting a company based in Western Europe involved the sale of a 61 per cent stake in UK-based National Grid’s regional gas distribution business to a consortium known as Quad Gas Group for USD 10,629 million. Completion of the deal is expected to follow by the end of March 2017.
This deal was worth significantly more than the second-largest PE and VC deal by value as Caisse des Depots Developpement and CNP Assurances agreed to pick up French electricity transmission company Reseau de Transport d’Electricite for USD 4,348 million. Others targeted in notable PE and VC deals in 2016 included Gas Natural SDG, Vattenfall Europe and Propertize.
UK companies lead by volume and value once again
Companies based in the UK were targeted in 6,718 deals worth a combined USD 419,990 million in 2016, compared to 7,564 deals valued at a total USD 423,301 million in 2015. While this represented a decline year-on-year, dealmaking was still higher than in 2014 (6,624 deals worth USD 264,853 million).
In monetary terms, M&A targeting UK companies was almost three times higher than dealmaking in second-placed Netherlands (USD 143,233 million; 2015: USD 170,985 million). Increased investment in companies based in Switzerland, Sweden, Finland, Norway and Austria year-on-year came at the expense of those in France, Germany, Spain and Italy, among others.

M&A ReportWestern Europe, Full Year 2016
Page 20 You are free to use any data or commentary from this report in your articles as long as the source is cited as “Zephyr published by Bureau van Dijk”
+44 161 838 9554 [email protected]
© Bureau van Dijk Bureau van Dijk is the leading provider of private company, corporate ownership and deal information www.bvdinfo.com
Top 20 Western Europe deals by value
Deal value (mil USD) Deal type Target Target
country Acquiror Acquiror country
Announced date
1. 124,444 Acquisition 100% bid 2 - increased bid SABMiller plc GB Newbelco SA/NV BE 26/07/2016
2. 47,000 Acquisition 100% NXP Semiconductors NV NL Qualcomm Inc. US 27/10/2016
3. 43,000 Acquisition 100% Syngenta AG CH CNAC Saturn (NL) BV NL 03/02/2016
4. 32,364 Acquisition 100% ARM Holdings plc GB Softbank Group Corporation JP 18/07/2016
5. 22,550 Acquisition 39% to 100% Sky plc GB Twenty-First Century Fox Inc. US 15/12/2016
6. 17,601 Acquisition 100% BlackRock Inc.'s defined contribution pension platform and administration business GB Aegon NV NL 03/05/2016
7. 14,767 Acquisition 100% London Stock Exchange Group plc GB HLDCO123 plc GB 16/03/2016
8. 11,996 Acquisition 100% Merial SAS FR Boehringer Ingelheim GmbH DE 27/06/2016
9. 10,629 Acquisition 61% National Grid plc's regional gas distribution business GB Quad Gas Group 08/12/2016
10. 9,985 Acquisition 100% Meda AB SE Mylan NV NL 10/02/2016
11. 7,844 Acquisition 77% Supercell Oy FI Halti SA LU 21/06/2016
12. 7,766 Acquisition 100% SABMiller Poland BV; SABMiller Europe AG; among other international assets NL; CH Asahi Group Holdings Ltd JP 13/12/2016
13. 7,413 Acquisition 100% Siemens Wind HoldCo SL ES Gamesa Corporacion Tecnologica SA ES 17/06/2016
14. 6,504 Acquisition 19% to 100% Delta Topco Ltd GB Liberty GR Cayman Acquisition Company KY 07/09/2016
15. 6,426 Acquisition 100% IDCSalud Holding SL ES Helios Kliniken GmbH DE 05/09/2016
16. 6,346 Acquisition 100% Technip SA FR Technipfmc Ltd GB 16/06/2016
17. 6,074 Minority stake 18% NXP Semiconductors NV NL Undisclosed acquirors 29/07/2016
18. 5,181 Acquisition 14% to 100% KUKA AG DE Mecca International (BVI) Ltd VG 16/06/2016
19. 4,981 Acquisition 100% Hamburg Sudamerikanische Dampfschifffahrts-Gesellschaft KG DE Maersk Line A/S DK 01/12/2016
20. 4,900 Acquisition 100% Allied World Assurance Company Holdings AG CH Fairfax Financial Holdings Ltd CA 18/12/2016

M&A ReportWestern Europe, Full Year 2016
Page 21 You are free to use any data or commentary from this report in your articles as long as the source is cited as “Zephyr published by Bureau van Dijk”
+44 161 838 9554 [email protected]
© Bureau van Dijk Bureau van Dijk is the leading provider of private company, corporate ownership and deal information www.bvdinfo.com
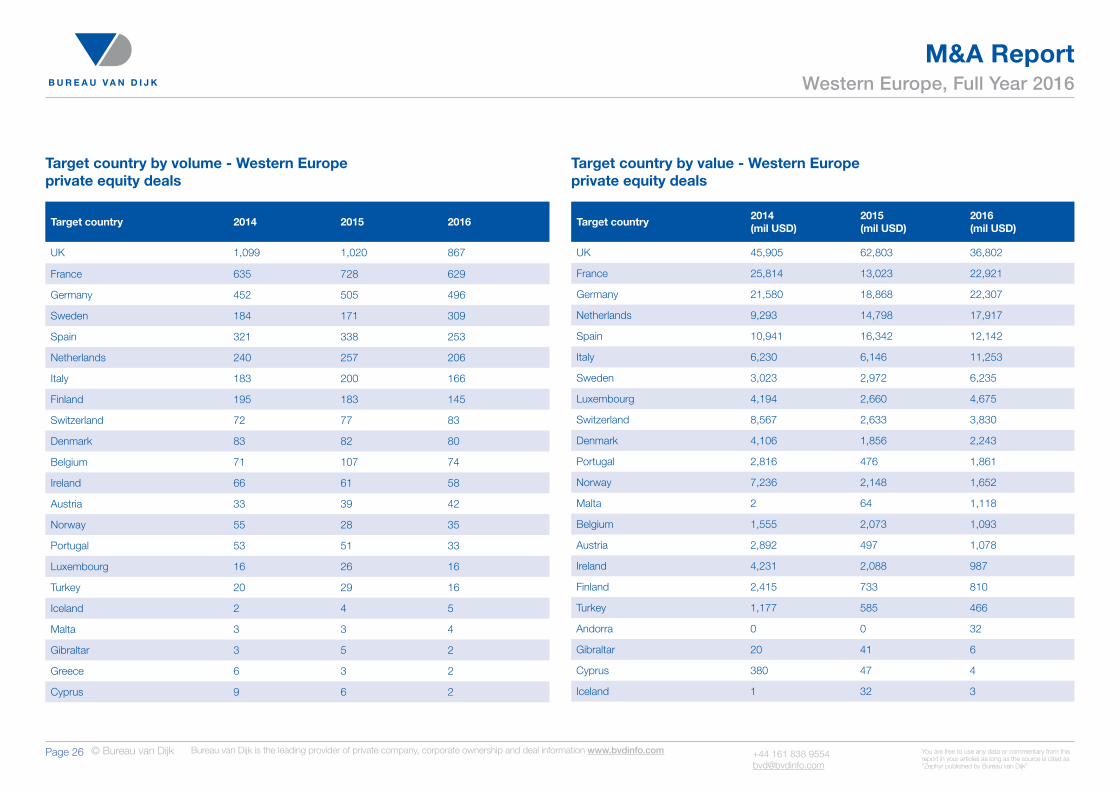
Target country by volume - Western Europe deals
Target country 2014 2015 2016
UK 6,624 7,564 6,718
Germany 2,063 3,263 4,156
Spain 2,804 3,232 3,197
France 2,243 3,044 3,176
Netherlands 1,505 2,019 2,150
Sweden 1,390 1,554 1,937
Italy 1,408 1,379 1,766
Switzerland 525 941 1,269
Finland 1,100 1,052 609
Belgium 512 570 536
Norway 622 430 387
Denmark 540 363 312
Austria 215 239 287
Luxembourg 144 223 259
Turkey 553 439 257
Ireland 294 331 242
Portugal 260 258 158
Cyprus 88 88 66
Greece 55 62 51
Malta 30 27 23
Target country by value - Western Europe deals
Target country 2014 (mil USD)
2015 (mil USD)
2016 (mil USD)
UK 264,853 423,301 419,990
Netherlands 91,194 170,985 143,233
France 117,093 143,903 137,006
Germany 123,821 111,892 105,969
Switzerland 70,785 57,642 103,675
Spain 90,889 91,432 82,104
Italy 100,791 131,829 77,060
Sweden 31,931 31,528 44,241
Luxembourg 21,531 82,358 30,380
Finland 18,710 9,118 15,222
Norway 33,409 11,066 14,567
Austria 16,304 4,071 13,870
Belgium 17,719 28,599 11,699
Ireland 62,797 32,932 10,482
Portugal 29,604 11,124 10,365
Denmark 19,723 14,357 9,388
Greece 13,551 13,217 4,722
Turkey 13,265 20,792 4,575
Cyprus 4,678 2,134 2,805
Malta 1,085 1,160 1,800

M&A ReportWestern Europe, Full Year 2016
Page 22 You are free to use any data or commentary from this report in your articles as long as the source is cited as “Zephyr published by Bureau van Dijk”
+44 161 838 9554 [email protected]
© Bureau van Dijk Bureau van Dijk is the leading provider of private company, corporate ownership and deal information www.bvdinfo.com
Target sector by volume - Western Europe deals
Target sector 2014 2015 2016
Other services 9,972 10,675 10,255
Machinery, equipment, furniture, recycling 2,315 3,123 3,396
Wholesale & retail trade 2,068 2,220 2,161
Chemicals, rubber, plastics 1,083 1,261 1,511
Publishing, printing 1,054 1,460 1,376
Metals & metal products 696 1,142 1,130
Construction 990 1,232 1,030
Transport 576 762 940
Banks 453 432 884
Primary sector 576 700 796
Food, beverages, tobacco 716 864 762
Post and telecommunications 407 731 595
Gas, water, electricity 477 643 581
Hotels & restaurants 483 511 506
Insurance companies 341 411 454
Education, health 421 446 357
Textiles, wearing apparel, leather 266 304 338
Wood, cork, paper 214 226 173
Public administration and defence 18 23 15
Target sector by value - Western Europe deals
Target sector 2014 (mil USD)
2015 (mil USD)
2016 (mil USD)
Other services 289,172 312,633 305,972
Machinery, equipment, furniture, recycling 155,021 113,169 190,665
Food, beverages, tobacco 25,515 48,895 155,270
Chemicals, rubber, plastics 119,755 123,028 128,343
Wholesale & retail trade 70,514 90,517 57,999
Banks 134,030 120,508 56,728
Gas, water, electricity 50,090 68,389 55,060
Publishing, printing 15,075 25,205 34,826
Metals & metal products 20,278 34,857 33,410
Primary sector 36,797 90,834 32,513
Transport 21,340 41,009 31,320
Construction 37,792 35,528 29,904
Post and telecommunications 75,342 186,575 28,686
Insurance companies 32,634 40,116 26,559
Education, health 12,370 11,375 15,841
Hotels & restaurants 15,848 18,060 12,137
Textiles, wearing apparel, leather 15,813 8,871 8,009
Wood, cork, paper 5,820 4,574 4,653
Public administration and defence 30 925 733

M&A ReportWestern Europe, Full Year 2016
Page 23 You are free to use any data or commentary from this report in your articles as long as the source is cited as “Zephyr published by Bureau van Dijk”
+44 161 838 9554 [email protected]
© Bureau van Dijk Bureau van Dijk is the leading provider of private company, corporate ownership and deal information www.bvdinfo.com
Western Europe private equity deals by volume and value
Announced date No of deals Total deal value (mil USD)
2016 3,506 146,819
2015 3,910 147,269
2014 3,786 157,906
2013 3,108 128,263
2012 2,833 88,241
2011 2,658 92,387

M&A ReportWestern Europe, Full Year 2016
Page 24 You are free to use any data or commentary from this report in your articles as long as the source is cited as “Zephyr published by Bureau van Dijk”
+44 161 838 9554 [email protected]
© Bureau van Dijk Bureau van Dijk is the leading provider of private company, corporate ownership and deal information www.bvdinfo.com
Western Europe private equity deals by volume and value
0
500
1,000
1,500
2,000
2,500
3,000
3,500
4,000
4,500
0
20,000
40,000
60,000
80,000
100,000
120,000
140,000
160,000
180,000
2011 2012 2013 2014 2015 2016
Dea
l val
ue (m
il U
SD
)
Total deal value (mil USD) Number of deals

M&A ReportWestern Europe, Full Year 2016
Page 25 You are free to use any data or commentary from this report in your articles as long as the source is cited as “Zephyr published by Bureau van Dijk”
+44 161 838 9554 [email protected]
© Bureau van Dijk Bureau van Dijk is the leading provider of private company, corporate ownership and deal information www.bvdinfo.com
Top 20 Western Europe private equity deals by value
Deal value (mil USD) Deal type Target Target
country Fund Manager/General Partner Announced date
1. 10,629 Acquisition 61% National Grid plc's regional gas distribution business GB Allianz Capital Partners GmbH; Macquarie Infrastructure and Real Assets (Europe) Ltd 08/12/2016
2. 4,348 Minority stake 50% Reseau de Transport d'Electricite SA FR Caisse des Dépôts Developpement SA 14/12/2016
3. 4,241 Minority stake 20% Gas Natural SDG SA ES Global Infrastructure Management LLC 12/09/2016
4. 3,906 IBO 100% Vattenfall Europe Mining AG; Vattenfall Europe Generation AG DE; DE PPF Group NV 18/04/2016
5. 3,652 Acquisition 100% Propertize BV NL Lone Star Global Acquisitions Ltd 28/06/2016
6. 3,644 IBO 100% OfficeFirst Immobilien AG & Co. KG DE The Blackstone Group LP 08/11/2016
7. 3,200 IBO 100% Atotech BV NL Carlyle Group LP 07/10/2016
8. 2,800 IBO 100% Cryptzone Group AB; among other international assets SE Longview Asset Management LLC; Medina Capital Partners Inc; BC Partners LLP 04/11/2016
9. 2,792 IBO 100% London City Airport Ltd GB Ontario Teachers' Pension Plan; Alberta Investment Management Corporation; OMERS Private Equity Inc.
26/02/2016
10. 2,750 Acquisition 100% NXP Semiconductors NV's standard products business NL Wise Road Capital Ltd 13/06/2016
11. 2,720 IBO 100% Morpho SASU FR Advent International Corporation; BPI Groupe SA 29/09/2016
12. 2,331 IBO 100% Xella International SA LU Lone Star Global Acquisitions Ltd 01/12/2016
13. 2,227 IBO 100% Punch Taverns plc GB Patron Capital Advisers LLP 15/12/2016
14. 2,006 IBO 100% Foncia Groupe SA FR La Caisse de depot et placement du Quebec; Partners Group AG 05/07/2016
15. 1,685 IBO 100% Parkdean Resorts UK Ltd GB Onex Corporation 19/12/2016
16. 1,602 IBO 80% Lumileds Holding BV NL Apollo Global Management LLC 12/12/2016
17. 1,574 IBO and IBO 100% Bilfinger Real Estate Solutions GmbH; Bilfinger Efficiency GmbH DE; DE EQT Partners AB 02/06/2016
18. 1,412 IBO 98% acting in concert Kuoni Reisen Holding AG CH EQT Partners AB 02/02/2016
19. 1,351 IBO 60% Artsana SpA IT Bi-Invest Holdings SA 12/04/2016
20. 1,311 IBO majority stake Argus Media Ltd GB General Atlantic LLC 23/05/2016
M&A ReportWestern Europe, Full Year 2016
Page 26 You are free to use any data or commentary from this report in your articles as long as the source is cited as “Zephyr published by Bureau van Dijk”
+44 161 838 9554 [email protected]
© Bureau van Dijk Bureau van Dijk is the leading provider of private company, corporate ownership and deal information www.bvdinfo.com
Target country by volume - Western Europe private equity deals
Target country 2014 2015 2016
UK 1,099 1,020 867
France 635 728 629
Germany 452 505 496
Sweden 184 171 309
Spain 321 338 253
Netherlands 240 257 206
Italy 183 200 166
Finland 195 183 145
Switzerland 72 77 83
Denmark 83 82 80
Belgium 71 107 74
Ireland 66 61 58
Austria 33 39 42
Norway 55 28 35
Portugal 53 51 33
Luxembourg 16 26 16
Turkey 20 29 16
Iceland 2 4 5
Malta 3 3 4
Gibraltar 3 5 2
Greece 6 3 2
Cyprus 9 6 2
Target country by value - Western Europe private equity deals
Target country 2014 (mil USD)
2015 (mil USD)
2016 (mil USD)
UK 45,905 62,803 36,802
France 25,814 13,023 22,921
Germany 21,580 18,868 22,307
Netherlands 9,293 14,798 17,917
Spain 10,941 16,342 12,142
Italy 6,230 6,146 11,253
Sweden 3,023 2,972 6,235
Luxembourg 4,194 2,660 4,675
Switzerland 8,567 2,633 3,830
Denmark 4,106 1,856 2,243
Portugal 2,816 476 1,861
Norway 7,236 2,148 1,652
Malta 2 64 1,118
Belgium 1,555 2,073 1,093
Austria 2,892 497 1,078
Ireland 4,231 2,088 987
Finland 2,415 733 810
Turkey 1,177 585 466
Andorra 0 0 32
Gibraltar 20 41 6
Cyprus 380 47 4
Iceland 1 32 3

M&A ReportWestern Europe, Full Year 2016
Page 27 You are free to use any data or commentary from this report in your articles as long as the source is cited as “Zephyr published by Bureau van Dijk”
+44 161 838 9554 [email protected]
© Bureau van Dijk Bureau van Dijk is the leading provider of private company, corporate ownership and deal information www.bvdinfo.com
Target sectors by volume - Western Europe private equity deals
Target sector 2014 2015 2016
Other services 1,960 1,886 1,757
Machinery, equipment, furniture, recycling 443 467 432
Publishing, printing 344 496 429
Wholesale & retail trade 266 274 221
Chemicals, rubber, plastics 170 151 126
Food, beverages, tobacco 77 82 80
Education, health 47 51 55
Hotels & restaurants 71 61 54
Gas, water, electricity 47 65 54
Metals & metal products 64 71 54
Construction 77 60 47
Transport 41 53 42
Textiles, wearing apparel, leather 55 55 37
Post and telecommunications 30 38 37
Wood, cork, paper 37 26 24
Insurance companies 21 26 20
Primary sector 21 21 15
Banks 10 7 10
Public administration and defence 1 0 1
Target sectors by value - Western Europe private equity deals
Target sector 2014 (mil USD)
2015 (mil USD)
2016 (mil USD)
Other services 56,574 64,238 49,708
Gas, water, electricity 8,004 7,675 23,882
Machinery, equipment, furniture, recycling 15,574 9,841 16,963
Chemicals, rubber, plastics 27,837 9,112 12,948
Publishing, printing 2,710 3,615 10,201
Primary sector 1,200 2,431 8,912
Transport 4,727 9,382 7,316
Wholesale & retail trade 8,604 19,629 6,970
Hotels & restaurants 6,869 2,605 3,773
Post and telecommunications 4,753 3,389 3,117
Textiles, wearing apparel, leather 1,338 1,608 2,957
Construction 3,444 2,602 2,471
Insurance companies 1,037 2,408 1,563
Food, beverages, tobacco 941 2,562 1,495
Education, health 1,975 4,363 1,250
Metals & metal products 2,691 906 667
Banks 2,181 38 653
Wood, cork, paper 2,939 179 643
Public administration and defence 30 0 0

M&A ReportNorth America, Full Year 2016
Page 28 You are free to use any data or commentary from this report in your articles as long as the source is cited as “Zephyr published by Bureau van Dijk”
+44 161 838 9554 [email protected]
© Bureau van Dijk Bureau van Dijk is the leading provider of private company, corporate ownership and deal information www.bvdinfo.com
North America M&A and PE value down year-on-year
The value of deals targeting companies based in North America fell 19 per cent to USD 1,740,297 million in 2016, compared to USD 2,139,657 million in 2015. Volume declined 14 per cent from 29,881 to 25,772 deals over the 12 months, representing the second consecutive yearly decrease by volume. North American value accounted for 37 per cent of total global value for 2016 (USD 4,734,165 million).
In keeping with the same pattern, the value of deals involving US targets slipped 19 per cent to USD 1,617,643 million in 2016, putting an end to three consecutive yearly increases. The value of deals targeting Canadian businesses also declined year-on-year from USD 146,525 million in 2015 to USD 123,732 million in 2016; however, bucking the overall trend, the volume of Canadian deals increased 4 per cent to 4,443 in the 12 months under review.
PE and VC investment in companies based in North America in 2016 was the lowest recorded since 2012, as value fell 39 per cent over the 12 months to USD 275,431 million across 13,607 deals.
PE and VC activity in the US and Canada followed the same trend as both volume and value fell in 2016: USD 268,152 million was invested across 13,027 deals in the former, while the latter had 575 deals worth USD 7,194 million.
North America deals by volume and value
Announced date No of deals Total deal value (mil USD)
2016 25,772 1,740,297
2015 29,881 2,139,657
2014 30,908 1,906,521
2013 26,679 1,393,860
2012 26,348 1,102,641
2011 24,951 1,177,514
Bureau van Dijk recently expanded its reach to cover an additional number of smaller development capital deals. This expansion has resulted in increased deal volumes and aggregated deal values across the North American data.

M&A ReportNorth America, Full Year 2016
Page 29 You are free to use any data or commentary from this report in your articles as long as the source is cited as “Zephyr published by Bureau van Dijk”
+44 161 838 9554 [email protected]
© Bureau van Dijk Bureau van Dijk is the leading provider of private company, corporate ownership and deal information www.bvdinfo.com
US deals by volume and value
Announced date No of deals Total deal value (mil USD)
2016 21,330 1,617,643
2015 25,596 1,994,398
2014 26,294 1,733,718
2013 22,246 1,275,477
2012 21,667 950,985
2011 19,940 1,037,394
Canada deals by volume and value
Announced date No of deals Total deal value (mil USD)
2016 4,443 123,723
2015 4,288 146,525
2014 4,622 178,474
2013 4,430 118,020
2012 4,681 151,510
2011 5,012 140,900

M&A ReportNorth America, Full Year 2016
Page 30 You are free to use any data or commentary from this report in your articles as long as the source is cited as “Zephyr published by Bureau van Dijk”
+44 161 838 9554 [email protected]
© Bureau van Dijk Bureau van Dijk is the leading provider of private company, corporate ownership and deal information www.bvdinfo.com
North America deals by volume and value
0
5,000
10,000
15,000
20,000
25,000
30,000
35,000
0
500,000
1,000,000
1,500,000
2,000,000
2,500,000
2011 2012 2013 2014 2015 2016
Dea
l val
ue (m
il U
SD
)
Total deal value (mil USD) Number of deals

M&A ReportNorth America, Full Year 2016
Page 31 You are free to use any data or commentary from this report in your articles as long as the source is cited as “Zephyr published by Bureau van Dijk”
+44 161 838 9554 [email protected]
© Bureau van Dijk Bureau van Dijk is the leading provider of private company, corporate ownership and deal information www.bvdinfo.com
Time Warner targeted in largest deal North American deal of 2016
Despite both volume and value declining over the 12 months, there were a large number of sizeable transactions signed off in North America in 2016 as five deals broke the USD 30,000 million barrier and all of the top 20 had values over USD 10,000 million.
The largest of these transactions was telecommunication company AT&T’s USD 108,700 million acquisition of diversified publisher Time Warner, an acquisition that was also the second largest M&A deal globally in 2016 and one of two global deals to be worth over USD 100,000 million during the year.
Pharmaceuticals manufacturer Bayer agreed to buy pesticides product developer Monsanto Company for USD 66,000 million in what was the second-largest North American deal and third-largest global transaction of 2016.
Companies based in the US dominated the top 20 in 2016, with just one Canadian target featuring as Potash Corporation of Saskatchewan agreed to acquire Agirum, an agricultural products company, through a new entity for USD 13,213 million.
Machinery, equipment, furniture and recycling top by value
The machinery, equipment, furniture and recycling sector led the way by value in 2016, bringing in USD 224,396 million; however, this represents a 29 per cent decrease on the USD 314,511 million invested in the sector in 2015.
Chemicals, rubber and plastics closely followed with USD 214,784 million; however, it was businesses operating in the gas, water and electricity, publishing and printing, hotels and restaurants, metals and metal products, and textiles, wearing apparel and leather sectors that stood out as these were the only industries to increase by value year-on-year in North America.
In terms of volume metals and metal products led the way with 1,937 deals, up 18 per cent from 1,641 deals in 2015, while the machinery, equipment, furniture and recycling and the publishing and printing sectors also performed well with volumes of 1,808 and 1,611, respectively.

M&A ReportNorth America, Full Year 2016
Page 32 You are free to use any data or commentary from this report in your articles as long as the source is cited as “Zephyr published by Bureau van Dijk”
+44 161 838 9554 [email protected]
© Bureau van Dijk Bureau van Dijk is the leading provider of private company, corporate ownership and deal information www.bvdinfo.com
Top 20 North America deals by value
Deal value (mil USD) Deal type Target Target
country Acquiror Acquiror country
Announced date
1. 108,700 Acquisition 100% Time Warner Inc. US AT&T Inc. US 22/10/2016
2. 66,000 Acquisition 100% Monsanto Company US Bayer AG DE 14/09/2016
3. 34,000 Acquisition 100% Level 3 Communications Inc. US WWG Merger Sub LLC US 31/10/2016
4. 32,000 Acquisition 100% Baxalta Inc. US Shire plc GB 11/01/2016
5. 30,700 Acquisition 100% St Jude Medical Inc. US Vault Merger Sub LLC US 28/04/2016
6. 28,315 Acquisition 100% Johnson Controls Inc. US Tyco International plc IE 25/01/2016
7. 28,000 Acquisition 100% Spectra Energy Corporation US Enbridge Inc. CA 06/09/2016
8. 26,200 Acquisition 100% LinkedIn Corporation US Microsoft Corporation US 13/06/2016
9. 21,319 Acquisition 100% Energy Transfer Partners LP US Sunoco Logistics Partners LP US 21/11/2016
10. 18,400 Acquisition 100% Energy Future Holdings Corporation US EFH Merger Company LLC US 29/07/2016
11. 14,800 Acquisition 100% Linear Technology Corporation US Analog Devices Inc. US 26/07/2016
12. 14,000 Acquisition 100% Medivation Inc. US Pfizer Inc. US 22/08/2016
13. 13,600 Acquisition 100% - Bid 2 - Increased bid Starwood Hotels & Resorts Worldwide Inc. US Solar Merger Sub 1 Inc. US 21/03/2016
14. 13,213 Acquisition 100% Agrium Inc. CA NewCo CA 12/09/2016
15. 13,000 Acquisition 100% Columbia Pipeline Group Inc. US TransCanada Corporation CA 17/03/2016
16. 12,500 Acquisition 100% The WhiteWave Foods Company US Danone SA FR 07/07/2016
17. 12,200 Acquisition 100% Westar Energy Inc. US Great Plains Energy Inc. US 31/05/2016
18. 11,943 IBO 100% The ADT Corporation US Prime Security Services Borrower LLC US 16/02/2016
19. 11,300 Acquisition 100% The Valspar Corporation US The Sherwin-Williams Company US 20/03/2016
20. 11,300 Acquisition 100% ITC Holdings Corporation US Fortis Inc. CA 09/02/2016

M&A ReportNorth America, Full Year 2016
Page 33 You are free to use any data or commentary from this report in your articles as long as the source is cited as “Zephyr published by Bureau van Dijk”
+44 161 838 9554 [email protected]
© Bureau van Dijk Bureau van Dijk is the leading provider of private company, corporate ownership and deal information www.bvdinfo.com
Target sector by volume - North America deals
Target sector 2014 2015 2016
Other services 13,581 12,141 9,419
Metals & metal products 1,768 1,641 1,937
Machinery, equipment, furniture, recycling 2,458 2,323 1,808
Publishing, printing 1,573 2,053 1,611
Chemicals, rubber, plastics 1,047 965 893
Primary sector 1,211 871 879
Wholesale & retail trade 1,001 952 776
Education, health 550 567 441
Insurance companies 406 450 405
Food, beverages, tobacco 392 431 321
Banks 430 412 318
Gas, water, electricity 367 391 300
Transport 256 295 205
Construction 245 203 189
Hotels & restaurants 200 214 166
Post and telecommunications 202 208 160
Textiles, wearing apparel, leather 151 137 95
Wood, cork, paper 114 86 79
Public administration and defence 28 27 26
Target sector by value - North America deals
Target sector 2014 (mil USD)
2015 (mil USD)
2016 (mil USD)
Other services 643,188 603,465 585,123
Machinery, equipment, furniture, recycling 254,696 314,511 224,396
Chemicals, rubber, plastics 238,602 233,518 214,784
Primary sector 181,886 160,005 145,763
Gas, water, electricity 77,267 73,321 106,844
Wholesale & retail trade 85,111 97,376 78,659
Publishing, printing 44,241 63,577 66,173
Transport 145,223 83,204 58,624
Post and telecommunications 21,287 73,733 52,560
Hotels & restaurants 37,279 17,540 34,757
Food, beverages, tobacco 91,236 99,209 34,418
Metals & metal products 37,223 26,278 33,971
Banks 38,374 36,577 31,028
Insurance companies 27,591 164,112 19,422
Construction 17,654 12,383 11,029
Education, health 16,460 31,242 10,095
Wood, cork, paper 7,415 26,285 6,233
Textiles, wearing apparel, leather 5,105 5,692 5,874
Public administration and defence 84 5,571 347

M&A ReportNorth America, Full Year 2016
Page 34 You are free to use any data or commentary from this report in your articles as long as the source is cited as “Zephyr published by Bureau van Dijk”
+44 161 838 9554 [email protected]
© Bureau van Dijk Bureau van Dijk is the leading provider of private company, corporate ownership and deal information www.bvdinfo.com
North America private equity deals by volume and value
Announced date No of deals Total deal value (mil USD)
2016 13,607 275,431
2015 16,488 453,566
2014 17,780 299,747
2013 15,627 283,353
2012 14,647 218,108
2011 13,878 204,675
US private equity deals by volume and value
Announced date No of deals Total deal value (mil USD)
2016 13,027 268,152
2015 15,819 441,957
2014 16,918 292,285
2013 14,720 270,389
2012 13,779 210,089
2011 12,888 189,965
Canada private equity deals by volume and value
Announced date No of deals Total deal value (mil USD)
2016 575 7,194
2015 665 11,534
2014 856 7,451
2013 901 12,958
2012 867 8,019
2011 989 14,631

M&A ReportNorth America, Full Year 2016
Page 35 You are free to use any data or commentary from this report in your articles as long as the source is cited as “Zephyr published by Bureau van Dijk”
+44 161 838 9554 [email protected]
© Bureau van Dijk Bureau van Dijk is the leading provider of private company, corporate ownership and deal information www.bvdinfo.com
North America private equity deals by volume and value
0
2,000
4,000
6,000
8,000
10,000
12,000
14,000
16,000
18,000
20,000
0
50,000
100,000
150,000
200,000
250,000
300,000
350,000
400,000
450,000
500,000
2011 2012 2013 2014 2015 2016
Dea
l val
ue (m
il U
SD
)
Total deal value (mil USD) Number of deals

M&A ReportNorth America, Full Year 2016
Page 36 You are free to use any data or commentary from this report in your articles as long as the source is cited as “Zephyr published by Bureau van Dijk”
+44 161 838 9554 [email protected]
© Bureau van Dijk Bureau van Dijk is the leading provider of private company, corporate ownership and deal information www.bvdinfo.com You are free to use any data or commentary from this report in your articles as long as the source is cited as “Zephyr published by BvD”
Top 20 North America private equity deals by value
Deal value (mil USD) Deal type Target Target
country Fund Manager/General Partner Announced date
1. 11,943 IBO 100% The ADT Corporation US Koch Equity Development LLC 16/02/2016
2. 7,500 IBO majority stake MultiPlan Inc. US Hellman & Friedman LLC; Leonard Green & Partners LP 05/05/2016
3. 6,100 IBO 100% TeamHealth Holdings Inc. US The Blackstone Group LP 31/10/2016
4. 5,500 Acquisition 100% Cabela's Inc. US Goldman Sachs & Co 03/10/2016
5. 5,200 IBO 65% Talen Energy Corporation US Riverstone Holdings LLC 03/06/2016
6. 4,400 Acquisition 100% New CIE US Hony Capital Co., Ltd; Yunfeng Capital Ltd 30/07/2016
7. 4,300 IBO 100% Rackspace Hosting Inc. US Apollo Global Management LLC; Searchlight Capital Partners LP 26/08/2016
8. 4,000 IBO majority stake Ultimate Fighting Championship US KKR & Co LP; MSD Capital LP; Silver Lake Technology Management LLC 11/07/2016
9. 4,000 IBO majority stake Emerson Network Power US Platinum Equity LLC 02/08/2016
10. 4,000 Acquisition 100% Lexmark International Inc. US Beijing Legend Capital Management Co., Ltd 19/04/2016
11. 3,300 IBO 100% Epicor Software Corporation US KKR & Co LP 05/07/2016
12. 3,000 IBO 100% Qlik Technologies Inc. US Thoma Bravo LLC 02/06/2016
13. 2,900 IBO remaining stake Neustar Inc. US GIC Special Investments Pte Ltd; Golden Gate Private Equity Inc. 14/12/2016
14. 2,810 IBO 100% Nortek Inc. US Melrose Industries plc 06/07/2016
15. 2,800 IBO 100% Catbird Networks Inc.; Easy Solutions Inc.; CenturyLink Inc.'s data centres and colocation business; Brainspace Corporation; among other international assets
US Longview Asset Management LLC; Medina Capital Partners Inc; BC Partners LLP 04/11/2016
16. 2,700 IBO 100% Vertafore Inc. US Vista Equity Partners Management LLC; Bain Capital Private Equity LP 02/05/2016
17. 2,500 IBO 100% HLX PLY Holdings Inc. US Carlyle Group LP 28/11/2016
18. 2,500 Minority stake Infor Inc. US Koch Equity Development LLC 16/11/2016
19. 2,400 IBO 100% BWAY Parent Company Inc. US Stone Canyon Industries LLC 13/06/2016
20. 2,350 IBO 100% Press Ganey Holdings Inc. US EQT Partners AB 09/08/2016

M&A ReportNorth America, Full Year 2016
Page 37 You are free to use any data or commentary from this report in your articles as long as the source is cited as “Zephyr published by Bureau van Dijk”
+44 161 838 9554 [email protected]
© Bureau van Dijk Bureau van Dijk is the leading provider of private company, corporate ownership and deal information www.bvdinfo.com You are free to use any data or commentary from this report in your articles as long as the source is cited as “Zephyr published by BvD”
Target sectors by volume - North America private equity deals
Target sector 2014 2015 2016
Other services 8,456 7,125 5,245
Publishing, printing 1,073 1,239 820
Machinery, equipment, furniture, recycling 1,189 1,010 601
Chemicals, rubber, plastics 363 271 199
Education, health 227 219 164
Wholesale & retail trade 285 226 154
Gas, water, electricity 180 137 130
Food, beverages, tobacco 166 146 109
Metals & metal products 176 88 74
Primary sector 155 92 73
Post and telecommunications 93 80 58
Banks 115 81 52
Construction 68 39 40
Hotels & restaurants 51 48 37
Textiles, wearing apparel, leather 78 65 36
Transport 41 45 32
Insurance companies 39 37 30
Wood, cork, paper 24 20 16
Public administration and defence 18 16 15
Target sectors by value - North America private equity deals
Target sector 2014 (mil USD)
2015 (mil USD)
2016 (mil USD)
Other services 114,495 146,717 125,686
Publishing, printing 24,400 40,559 29,058
Machinery, equipment, furniture, recycling 17,917 85,164 23,097
Gas, water, electricity 14,435 3,683 14,487
Wholesale & retail trade 29,282 12,053 13,432
Primary sector 20,073 15,008 9,025
Chemicals, rubber, plastics 15,966 7,768 7,458
Education, health 4,307 9,143 5,376
Hotels & restaurants 6,205 2,171 5,083
Post and telecommunications 2,077 18,252 3,649
Metals & metal products 7,056 1,189 2,964
Transport 2,972 11,258 2,582
Insurance companies 5,902 3,143 1,892
Food, beverages, tobacco 3,121 55,070 1,477
Construction 2,421 3,457 990
Textiles, wearing apparel, leather 3,510 1,969 669
Banks 1,093 810 475
Wood, cork, paper 571 19 97
Public administration and defence 20 23 21

M&A ReportAsia and Asia Pacific, Full Year 2016
Page 38 You are free to use any data or commentary from this report in your articles as long as the source is cited as “Zephyr published by Bureau van Dijk”
+44 161 838 9554 [email protected]
© Bureau van Dijk Bureau van Dijk is the leading provider of private company, corporate ownership and deal information www.bvdinfo.com
Asia-Pacific M&A volume and value down on 2015
Both the volume and value of M&A deals targeting companies based in Asia-Pacific in 2016 fell for the first time since 2012, ending a run of three consecutive yearly increases. In all there were 30,437 deals valued at USD 1,385,995 million, compared to 35,597 transactions worth USD 1,900,968 million in 2015. Despite the decline 2015’s result is still higher than 2014’s in terms of both volume and value.
The value of PE and VC investment in companies based in Asia-Pacific weakened 10 per cent to USD 97,573 million in 2016, down from USD 108,135 million in 2015. PE and VC volume followed a similar pattern, falling from 4,212 deals in 2015 to 3,434 in 2016.
Asia and Asia Pacific deals by volume and value
Announced date No of deals Total deal value (mil USD)
2016 30,437 1,385,995
2015 35,597 1,900,968
2014 30,401 1,228,967
2013 25,937 837,813
2012 25,045 813,538
2011 25,563 885,911

M&A ReportAsia and Asia Pacific, Full Year 2016
Page 39 You are free to use any data or commentary from this report in your articles as long as the source is cited as “Zephyr published by Bureau van Dijk”
+44 161 838 9554 [email protected]
© Bureau van Dijk Bureau van Dijk is the leading provider of private company, corporate ownership and deal information www.bvdinfo.com
Asia and Asia Pacific deals by volume and value
0
5,000
10,000
15,000
20,000
25,000
30,000
35,000
40,000
0
200,000
400,000
600,000
800,000
1,000,000
1,200,000
1,400,000
1,600,000
1,800,000
2,000,000
2011 2012 2013 2014 2015 2016
Dea
l val
ue (m
il U
SD
)
Total deal value (mil USD) Number of deals

M&A ReportAsia and Asia Pacific, Full Year 2016
Page 40 You are free to use any data or commentary from this report in your articles as long as the source is cited as “Zephyr published by Bureau van Dijk”
+44 161 838 9554 [email protected]
© Bureau van Dijk Bureau van Dijk is the leading provider of private company, corporate ownership and deal information www.bvdinfo.com
Electricity distributor targeted in region’s largest deal of 2016
Asia-Pacific’s largest deal by value in 2016 involved Australia-based New South Wales State Government selling its electricity transmission and distribution network assets to IFM Investors and AustralianSuper for USD 12,512 million, via a privatisation proposal which was announced in October.
This was followed by the takeover of Beijing-headquartered China National Petroleum Corporation Capital by Jinan Diesel Engine in a reverse takeover worth USD 10,861 million in December.
While the largest deal by value involved an Australian target, Chinese companies featured in ten of the top 20 deals in Asia-Pacific in 2016. Of these deals, two had buyers from outside Asia Pacific, namely UK-based Vodafone Group investing USD 7,147 million in Vodafone India and Russia’s Rosneft acquiring a minority stake in India-based Essar Oil for USD 5,007 million.
China leads the way in terms of volume and value
The value of M&A deals targeting companies in China in 2016 totalled USD 788,868 million, representing a 24 per cent decrease on USD 1,037,645 million in 2015. However, despite the year-on-year decline, China received aggregate dealmaking worth over seven times more than Australia (USD 108,038 million). Australia was closely followed by Japan (USD 102,004 million), India (USD 97,229 million) and South Korea (USD 89,709 million).
The value of M&A deals recorded for companies based in Hong Kong was stripped away year-on-year, falling to USD 33,079 million in 2016, from USD 163,530 million in 2015.
In terms of volume, Chinese companies were targeted in a total of 11,499 deals in 2016, more than three times the 3,526 deals recorded for Australian targets. Japan, South Korea and India followed with 2,788, 2,659 and 2,644 deals, respectively.
PE and VC investment falls back in 2016
PE and VC investment targeting companies based in Asia Pacific declined in 2016 to 3,434 deals worth an aggregate USD 97,573 million, compared to the 4,212 deals worth USD 108,135 million announced in 2015.
The largest PE and VC investment in 2016 was the USD 9,238 million acquisition of Australian rail freight operator Asciano by a consortium led by Global Infrastructure Partners and Canada Pension Plan Investment Board through wholly-owned Australian Logistics Acquisition Holdings in August.

M&A ReportAsia and Asia Pacific, Full Year 2016
Page 41 You are free to use any data or commentary from this report in your articles as long as the source is cited as “Zephyr published by Bureau van Dijk”
+44 161 838 9554 [email protected]
© Bureau van Dijk Bureau van Dijk is the leading provider of private company, corporate ownership and deal information www.bvdinfo.com
Top 20 Asia and Asia Pacific deals by value
Deal value (mil USD) Deal type Target Target
country Acquiror Acquiror country
Announced date
1. 12,512 Acquisition 100% Government of New South Wales' Ausgrid project holding company AU AustralianSuper Pty Ltd; IFM Investors Pty Ltd AU; AU 20/10/2016
2. 10,861 Acquisition 100% China National Petroleum Corporation Capital Co., Ltd CN Jinan Diesel Engine Co., Ltd CN 06/09/2016
3. 10,713 Acquisition 98% Essar Oil Ltd IN Petrol Complex Pte Ltd; Kesani Enterprises Co., Ltd SG 15/10/2016
4. 9,238 IBO 100% Asciano Ltd AU Australian Logistics Acquisition Investments Pty Ltd AU 21/04/2016
5. 7,766 Acquisition 100% SABMiller Brands Korea Yuhan Hoesa, among other international assets KR Asahi Group Holdings Ltd JP 13/12/2016
6. 7,181 Acquisition 100% Government of Victoria’s Port of Melbourne operating project company AU QIC Ltd; Borealis Infrastructure Management Inc.; Global Infrastructure Management LLC; Future Fund Board of Guardians
AU; CA; US; AU
19/09/2016
7. 7,147 Capital Increase Vodafone India Ltd IN Vodafone Group plc GB 22/09/2016
8. 6,234 Acquisition 100% SF Holding (Group) Co., Ltd CN Maanshan Dingtai Rare Earth & New Material Co., Ltd CN 23/05/2016
9. 6,151 Acquisition 60% Lanco Infratech Ltd IN Lenders 20/07/2016
10. 6,006 Capital Increase China CITIC Bank Corporation Ltd CN 26/08/2016
11. 5,711 Acquisition 100% Wanda Pictures Media Co., Ltd CN Wanda Cinema Line Co., Ltd CN 13/05/2016
12. 5,644 Acquisition 100% Toshiba Medical Systems Corporation JP Canon Inc. JP 17/03/2016
13. 5,617 Acquisition 100% Anhui Construction Engineering Group Co., Ltd CN Anhui Water Resources Development Co., Ltd CN 31/03/2016
14. 5,077 Minority stake 49% Essar Oil Ltd IN Neftyanaya Kompaniya Rosneft OAO RU 16/03/2016
15. 4,599 Capital Increase China Minsheng Banking Co., Ltd CN Foreign investors; Undisclosed investor 07/01/2016
16. 4,569 Capital Increase China Everbright Bank Co., Ltd CN 07/06/2016
17. 4,547 Acquisition 100% The Joyo Bank Ltd JP Ashikaga Holdings Co., Ltd JP 25/04/2016
18. 4,500 Capital Increase Zhejiang Ant Small and Micro Financial Services Group Co., Ltd CN Investors; China Life Insurance Co., Ltd; Primavera Capital Management Ltd; China Post Group Corporation; CCB Trust Co., Ltd; China Development Bank Capital Corporation Ltd; China Investment Overseas (Beijing) Management Consulting Co., Ltd
CN 26/04/2016
19. 4,464 Acquisition 100% CITIC Real Estate Co., Ltd CN China Overseas Land & Investment Ltd HK 14/03/2016
20. 4,441 Acquisition 44% to 58% Dalian Wanda Commercial Properties Co., Ltd CN WD Knight I; WD Knight II; WD Knight IV; WD Knight V; WD Knight VII; Red Fortune Global Ltd
KY; KY; KY; KY; KY; VG
30/06/2016

M&A ReportAsia and Asia Pacific, Full Year 2016
Page 42 You are free to use any data or commentary from this report in your articles as long as the source is cited as “Zephyr published by Bureau van Dijk”
+44 161 838 9554 [email protected]
© Bureau van Dijk Bureau van Dijk is the leading provider of private company, corporate ownership and deal information www.bvdinfo.com You are free to use any data or commentary from this report in your articles as long as the source is cited as “Zephyr published by BvD”
Target country by volume - Asia and Asia Pacific deals
Target country 2014 2015 2016
China 7,018 11,563 11,499
Australia 4,481 4,358 3,526
Japan 4,043 3,829 2,788
South Korea 3,392 3,677 2,659
India 3,208 3,467 2,644
Taiwan 2,342 2,465 1,659
Malaysia 1,383 1,300 1,108
Vietnam 1,128 1,231 1,011
Singapore 721 817 872
Hong Kong 500 524 519
Indonesia 432 453 478
Thailand 489 621 464
New Zealand 471 488 346
Kazakhstan 190 223 257
Uzbekistan 17 67 166
Philippines 193 198 136
Sri Lanka 140 98 96
Kyrgyzstan 62 52 48
Samoa 50 42 31
Marshall Islands 60 20 30
Target country by value - Asia and Asia Pacific deals
Target country 2014 (mil USD)
2015 (mil USD)
2016 (mil USD)
China 533,750 1,037,645 788,868
Australia 140,716 158,654 108,038
Japan 149,881 146,682 102,004
India 72,720 86,527 97,229
South Korea 112,870 108,759 89,709
Taiwan 56,231 75,061 46,580
Hong Kong 40,312 163,530 33,079
Singapore 38,329 31,181 29,117
Indonesia 15,501 13,161 22,096
Thailand 17,135 14,849 20,907
Malaysia 27,597 20,162 14,773
Philippines 10,057 18,677 11,365
New Zealand 14,494 22,703 11,297
Vietnam 6,768 5,630 8,091
Pakistan 499 4,775 2,923
Kazakhstan 5,239 4,802 2,467
Bangladesh 350 157 2,320
Marshall Islands 7,323 1,967 2,045
Macao 174 31 1,043
Brunei Darussalam 56 390 904

M&A ReportAsia and Asia Pacific, Full Year 2016
Page 43 You are free to use any data or commentary from this report in your articles as long as the source is cited as “Zephyr published by Bureau van Dijk”
+44 161 838 9554 [email protected]
© Bureau van Dijk Bureau van Dijk is the leading provider of private company, corporate ownership and deal information www.bvdinfo.com
Target sector by volume - Asia and Asia Pacific deals
Target sector 2014 2015 2016
Other services 8,811 11,344 10,605
Machinery, equipment, furniture, recycling 5,542 6,256 4,771
Chemicals, rubber, plastics 2,772 3,122 2,349
Wholesale & retail trade 2,080 2,297 2,007
Metals & metal products 2,195 2,228 1,936
Publishing, printing 1,528 2,077 1,877
Construction 1,831 1,982 1,623
Primary sector 1,083 1,111 935
Food, beverages, tobacco 806 885 669
Transport 673 740 567
Gas, water, electricity 552 643 532
Education, health 436 476 491
Banks 420 443 382
Hotels & restaurants 445 436 380
Textiles, wearing apparel, leather 504 560 342
Post and telecommunications 276 364 221
Insurance companies 273 319 220
Wood, cork, paper 220 275 213
Public administration and defence 8 15 21
Target sector by value - Asia and Asia Pacific deals
Target sector 2014 (mil USD)
2015 (mil USD)
2016 (mil USD)
Other services 318,701 509,099 399,660
Machinery, equipment, furniture, recycling 184,877 253,036 225,536
Construction 86,846 205,772 136,383
Chemicals, rubber, plastics 110,074 169,671 112,312
Wholesale & retail trade 74,687 101,939 78,495
Banks 137,942 167,653 75,130
Metals & metal products 50,023 70,806 71,145
Transport 52,588 109,713 56,390
Gas, water, electricity 32,153 71,667 53,569
Food, beverages, tobacco 35,718 36,441 37,915
Primary sector 51,593 33,758 37,788
Publishing, printing 22,124 35,127 31,977
Post and telecommunications 23,538 60,764 27,136
Insurance companies 25,655 39,154 15,805
Education, health 8,763 11,712 11,579
Hotels & restaurants 11,220 13,353 10,681
Textiles, wearing apparel, leather 7,887 19,371 9,471
Wood, cork, paper 7,330 7,692 6,199
Public administration and defence 783 60 248

M&A ReportAsia and Asia Pacific, Full Year 2016
Page 44 You are free to use any data or commentary from this report in your articles as long as the source is cited as “Zephyr published by Bureau van Dijk”
+44 161 838 9554 [email protected]
© Bureau van Dijk Bureau van Dijk is the leading provider of private company, corporate ownership and deal information www.bvdinfo.com
Asia and Asia Pacific private equity deals by volume and value
Announced date No of deals Total deal value (mil USD)
2016 3,434 97,573
2015 4,212 108,135
2014 2,252 81,160
2013 1,345 34,604
2012 1,253 32,449
2011 1,302 44,204

M&A ReportAsia and Asia Pacific, Full Year 2016
Page 45 You are free to use any data or commentary from this report in your articles as long as the source is cited as “Zephyr published by Bureau van Dijk”
+44 161 838 9554 [email protected]
© Bureau van Dijk Bureau van Dijk is the leading provider of private company, corporate ownership and deal information www.bvdinfo.com
Asia and Asia Pacific private equity deals by volume and value
0
500
1,000
1,500
2,000
2,500
3,000
3,500
4,000
4,500
0
20,000
40,000
60,000
80,000
100,000
120,000
2011 2012 2013 2014 2015 2016
Dea
l val
ue (m
il U
SD
)
Total deal value (mil USD) Number of deals

M&A ReportAsia and Asia Pacific, Full Year 2016
Page 46 You are free to use any data or commentary from this report in your articles as long as the source is cited as “Zephyr published by Bureau van Dijk”
+44 161 838 9554 [email protected]
© Bureau van Dijk Bureau van Dijk is the leading provider of private company, corporate ownership and deal information www.bvdinfo.com
Top 20 Asia and Asia Pacific private equity deals by value
Deal value (mil USD) Deal type Target Target
country Fund Manager/General Partner Announced date
1. 9,238 IBO 100% Asciano Ltd AU Canada Pension Plan Investment Board; Global Infrastructure Management LLC 21/04/2016
2. 7,181 Acquisition 100% Government of Victoria’s Po rt of Melbourne operating project company AU Global Infrastructure Management LLC 19/09/2016
3. 4,500 Capital Increase Zhejiang Ant Small and Micro Financial Services Group Co., Ltd CN Primavera Capital Management Ltd; China Development Bank Capital Corporation Ltd 26/04/2016
4. 4,441 Acquisition 44% to 58% Dalian Wanda Commercial Properties Co., Ltd CN Pohua JT Capital Partners Ltd 30/06/2016
5. 2,400 Capital increase acquired 27%, to hold 100%
Semiconductor Manufacturing North China (Beijing) Corporation CN China Grand Prosperity Investment Co., Ltd 10/05/2016
6. 2,026 Minority stake 30% Woori Bank KR IMM Private Equity Inc. 01/12/2016
7. 1,541 Minority stake Cainiao Smart Logistics Network Ltd CN Primavera Capital Management Ltd 14/03/2016
8. 1,332 IBO 100% Accordia Golf Co., Ltd JP MBK Management Inc. 29/11/2016
9. 1,231 Minority stake 46% Ssangyong Cement Industrial Co., Ltd KR Hahn & Company 22/01/2016
10. 1,230 IBO 100% Arrium Ltd's mining consumables division AU AIP LLC 04/11/2016
11. 1,225 IBO 100% Wharf T&T Ltd HK TPG Capital Advisors LLC; MBK Management Inc. 04/10/2016
12. 1,200 Minority stake Letv Sports Culture Develop (Beijing) Co., Ltd CN HNA Group Co., Ltd; CCB International (Holdings) Co., Ltd; Hillhouse Capital Management Ltd; China Development Bank Capital Corporation Ltd
15/02/2016
13. 1,080 Capital Increase Leshi Intelligent Car (China) Co., Ltd CN Shenzhen Capital Group Co., Ltd; Shenzhen Qianhai Hongzhao Fund Management Co., Ltd
20/09/2016
14. 1,001 Minority stake JD Finance Group CN Sequoia Capital Operations LLC; China Taiping Insurance Holdings Co., Ltd; Harvest Capital Management Co., Ltd
16/01/2016
15. 1,000 Minority stake WM Motor Technology Co., Ltd CN 02/08/2016
16. 994 IBO 100% Doosan Infracore Co., Ltd's machine tools manufacturing business KR MBK Management Inc. 02/03/2016
17. 939 Acquisition 74% Genesis Care Ltd AU Macquarie Capital Group Ltd 21/07/2016
18. 926 Minority stake Beijing Lianjia Real Estate Brokerage Co., Ltd CN Tencent Holdings Ltd; Baidu Inc.; China Renaissance Partners 06/04/2016
19. 854 IBO 96% SAI Global Ltd AU Baring Private Equity Asia Group Ltd 01/11/2016
20. 816 IBO 60% MphasiS Ltd IN The Blackstone Group LP 04/04/2016

M&A ReportAsia and Asia Pacific, Full Year 2016
Page 47 You are free to use any data or commentary from this report in your articles as long as the source is cited as “Zephyr published by Bureau van Dijk”
+44 161 838 9554 [email protected]
© Bureau van Dijk Bureau van Dijk is the leading provider of private company, corporate ownership and deal information www.bvdinfo.com
Target country by volume - Asia and Asia Pacific private equity deals
Target country 2014 2015 2016
China 1,136 2,467 1,635
India 487 1,000 996
Japan 205 190 279
South Korea 75 139 153
Australia 93 120 108
Singapore 75 88 79
Malaysia 20 40 39
Indonesia 31 38 31
Vietnam 16 12 28
Hong Kong 37 33 21
Taiwan 13 13 15
Philippines 7 16 14
Thailand 12 11 12
New Zealand 24 23 6
Pakistan 3 6 6
Sri Lanka 2 0 2
Kazakhstan 3 4 2
Macao 0 0 1
Cook Islands 0 0 1
Bangladesh 1 0 1
Target country by value - Asia and Asia Pacific private equity deals
Target country 2014 (mil USD)
2015 (mil USD)
2016 (mil USD)
China 40,454 53,570 47,030
Australia 8,506 14,557 23,006
India 7,737 14,345 9,355
South Korea 9,390 15,942 8,474
Japan 6,132 2,237 4,402
Hong Kong 3,010 2,791 2,148
Singapore 2,642 2,669 1,502
Indonesia 151 86 874
Malaysia 1,521 181 223
New Zealand 951 6,647 222
Thailand 16 11 200
Vietnam 207 121 183
Taiwan 147 912 128
Pakistan 4 80 32
Kazakhstan 15 10 11
Sri Lanka 19 0 9
Philippines 4 6 7

M&A ReportAsia and Asia Pacific, Full Year 2016
Page 48 You are free to use any data or commentary from this report in your articles as long as the source is cited as “Zephyr published by Bureau van Dijk”
+44 161 838 9554 [email protected]
© Bureau van Dijk Bureau van Dijk is the leading provider of private company, corporate ownership and deal information www.bvdinfo.com
Target sectors by volume - Asia and Asia Pacific private equity deals
Target sector 2014 2015 2016
Other services 1,232 2,295 2,037
Publishing, printing 408 784 608
Machinery, equipment, furniture, recycling 191 391 271
Education, health 63 76 97
Wholesale & retail trade 102 154 88
Chemicals, rubber, plastics 62 146 76
Hotels & restaurants 38 39 41
Food, beverages, tobacco 30 42 37
Transport 17 45 27
Metals & metal products 14 52 27
Construction 22 39 25
Primary sector 11 33 11
Textiles, wearing apparel, leather 10 28 11
Insurance companies 2 6 8
Gas, water, electricity 16 19 7
Wood, cork, paper 6 17 7
Post and telecommunications 11 11 5
Banks 4 5 2
Public administration and defence 0 2 1
Target sectors by value - Asia and Asia Pacific private equity deals
Target sector 2014 (mil USD)
2015 (mil USD)
2016 (mil USD)
Other services 30,951 56,599 41,459
Transport 2,971 7,119 18,137
Machinery, equipment, furniture, recycling 9,969 5,786 8,180
Publishing, printing 4,464 7,968 6,502
Construction 1,714 2,133 5,151
Chemicals, rubber, plastics 2,811 5,441 3,887
Wholesale & retail trade 19,204 8,610 2,897
Metals & metal products 1,755 967 2,804
Education, health 829 1,603 2,689
Banks 85 1,835 2,026
Post and telecommunications 1,035 1,646 1,249
Food, beverages, tobacco 1,232 1,224 547
Insurance companies 143 1,256 421
Hotels & restaurants 988 1,223 340
Gas, water, electricity 1,089 729 258
Textiles, wearing apparel, leather 106 1,324 250
Wood, cork, paper 57 507 150
Primary sector 1,871 2,455 72
Public administration and defence 0 8 15

M&A ReportMENA, Full Year 2016
Page 49 You are free to use any data or commentary from this report in your articles as long as the source is cited as “Zephyr published by Bureau van Dijk”
+44 161 838 9554 [email protected]
© Bureau van Dijk Bureau van Dijk is the leading provider of private company, corporate ownership and deal information www.bvdinfo.com
MENA value rises
The value of M&A targeting companies based in the Middle East and North Africa (MENA) more than doubled to USD 49,358 million in 2016 from USD 24,645 million in 2015. This represented the highest value recorded since 2008 (USD 74,023 million). Overall value was supported by seven large deals each worth more than USD 1,000 million.
While volume fell marginally year-on-year from 689 deals in 2015 to 682 in 2016, it was still one of the highest recorded since 2010 (1,114 deals).
Conversely the value of PE and VC investment in the MENA region was stripped away in 2016 to USD 1,469 million from USD 3,293 million in 2015 (2014: USD 2,396 million), despite volume rising 9 per cent to 81 deals from 74 in 2015.
MENA deals by volume and value
Announced date No of deals Total deal value (mil USD)
2016 682 49,358
2015 689 24,645
2014 529 34,034
2013 535 38,400
2012 519 35,764
2011 652 20,592

M&A ReportMENA, Full Year 2016
Page 50 You are free to use any data or commentary from this report in your articles as long as the source is cited as “Zephyr published by Bureau van Dijk”
+44 161 838 9554 [email protected]
© Bureau van Dijk Bureau van Dijk is the leading provider of private company, corporate ownership and deal information www.bvdinfo.com
MENA deals by volume and value
0
100
200
300
400
500
600
700
800
0
10,000
20,000
30,000
40,000
50,000
60,000
2011 2012 2013 2014 2015 2016
Dea
l val
ue (m
il U
SD
)
Total deal value (mil USD) Number of deals

M&A ReportMENA, Full Year 2016
Page 51 You are free to use any data or commentary from this report in your articles as long as the source is cited as “Zephyr published by Bureau van Dijk”
+44 161 838 9554 [email protected]
© Bureau van Dijk Bureau van Dijk is the leading provider of private company, corporate ownership and deal information www.bvdinfo.com
UAE bank deal tops the table
The largest deal to take place in the MENA region in 2016 involved National Bank of Abu Dhabi’s agreement to purchase United Arab Emirates-based First Gulf Bank for around USD 14,841 million, representing 30 per cent of total MENA value for 2016 (USD 49,358 million).
The second-largest deal by value involved Adeptio buying a 67 per cent stake in Kuwait Food Company for USD 3,689 million. This was followed by Danah Al Safat Foodstuff Company’s USD 2,029 million agreement to sell an 11 per cent interest in Al Safat Energy Holding Company in one of three MENA deals to break the USD 2,000 million barrier in 2016.
UAE tops country rankings by value
The value of M&A targeting companies based in the UAE was more than double the USD 10,250 million recorded in 2015, jumping to a new high of USD 20,915 million in 2016. Iranian companies were the next most valuable targets with USD 8,799 million across 110 deals.
While companies based in the UAE led by value, in terms of volume they fell behind those based in Egypt, which were targeted in 132 deals, and Jordan (119 deals).
Banks lead the way by value
Companies operating in the banking industry were the most valuable in 2016, with 24 deals worth an aggregate USD 19,393 million, compared to 23 deals totalling USD 1,950 million in 2015. Dealmaking within the sector was supported by National Bank of Abu Dhabi’s agreement to buy First Gulf Bank, which accounted for 77 per cent of the sector’s total value.
An increase was also recorded in the value of M&A deals targeting companies in the hotel and restaurant industry, which was move then seven times higher year-on-year at USD 3,810 million from USD 505 million in 2015.
Companies operating in the chemical, rubber and plastics sector were the most prolific dealmakers after being targeted in 88 deals in 2016, a 29 per cent increase on 68 transactions in 2015. The construction industry was second by volume with 68 deals, despite slipping from 78 in 2015.

M&A ReportMENA, Full Year 2016
Page 52 You are free to use any data or commentary from this report in your articles as long as the source is cited as “Zephyr published by Bureau van Dijk”
+44 161 838 9554 [email protected]
© Bureau van Dijk Bureau van Dijk is the leading provider of private company, corporate ownership and deal information www.bvdinfo.com
Top 20 MENA deals by value
Deal value (mil USD) Deal type Target Target
country Acquiror Acquiror country
Announced date
1. 14,841 Acquisition 100% First Gulf Bank PJSC AE National Bank of Abu Dhabi AE 03/07/2016
2. 3,689 Acquisition 67% Kuwait Food Company SAK KW Adeptio AD Investments SPC Ltd AE 04/02/2016
3. 2,029 Minority stake 11% Al Safat Energy Holding Company KSCC KW 06/03/2016
4. 1,535 Capital Increase 36% Ghadir Investment Company PSC IR 23/11/2016
5. 1,346 Capital Increase 24% Telecommunication Company of Iran PSC IR 14/08/2016
6. 1,319 Acquisition 66% Maghreb International Publicite TN Yellow Spirit SAL (Holding); Societe Lawhat Tunisie LB; TN 20/07/2016
7. 1,145 Acquisition 50% OGM Holding MA Societe Nationale d'Investissement SA MA 27/10/2016
8. 932 Acquisition 100% Holcim Maroc SA MA Lafarge Ciments SA MA 17/03/2016
9. 900 Acquisition 100% Media.Net Advertising FZ-LLC AE Undisclosed acquirors; Mr Zhiyong Zhang CN 22/08/2016
10. 884 Capital Increase 27% Esfahan Mobarakeh Steel Company PSC IR 24/02/2016
11. 861 Capital Increase 20% Dubai Islamic Bank plc AE 28/04/2016
12. 734 Capital Increase 20% Bank Mellat IR 08/11/2016
13. 728 Capital Increase 25% Parsian Oil and Gas Development Company PSC IR 29/06/2016
14. 631 Minority stake 38% Societe Les Ciments du Maroc SA MA HeidelbergCement France SAS FR 04/08/2016
15. 600 Capital Increase 39% Chadormalu Mining & Industrial Company PSC IR 28/09/2016
16. 560 Acquisition 100% Al Zahra Private Hospital Company Ltd AE NMC Healthcare LLC AE 14/12/2016
17. 558 Capital Increase 17% Qatar Insurance Company SAQ QA 22/02/2016
18. 506 Capital Increase 25% Gole Gohar Mining & Industrial Company PSC IR 20/04/2016
19. 500 Minority stake Careem Networks FZ LLC AE Investors; Saudi Telecom Company; Abraaj Capital Ltd; Al-Tayyar Travel Group; Lumia Capital LLC; BECO Capital Investments LLC; Wamda Capital Partners Ltd; Endure Capital; SQM Frontier Management LP; El Sewedy Investments; Rakuten Ventures
SA; AE; SA; US; AE; AE; US; US; EG; JP
19/12/2016
20. 500 Acquisition 100% Barclays Bank Egypt SAE EG Attijariwafa Bank MA 04/10/2016

M&A ReportMENA, Full Year 2016
Page 53 You are free to use any data or commentary from this report in your articles as long as the source is cited as “Zephyr published by Bureau van Dijk”
+44 161 838 9554 [email protected]
© Bureau van Dijk Bureau van Dijk is the leading provider of private company, corporate ownership and deal information www.bvdinfo.com You are free to use any data or commentary from this report in your articles as long as the source is cited as “Zephyr published by BvD”
Target country by volume - MENA deals
Target country 2014 2015 2016
Egypt 163 168 132
Jordan 83 125 119
UAE 103 107 112
Iran 2 24 110
Saudi Arabia 31 54 47
Morocco 25 36 33
Kuwait 30 87 28
Oman 16 20 27
Tunisia 18 24 24
Bahrain 12 14 15
Lebanon 8 9 13
Qatar 15 12 10
Algeria 5 3 7
Palestine 19 5 7
Iraq 2 1 2
Syria 0 0 0
Yemen 1 0 0
Libya 0 2 0
Target country by value - MENA deals
Target country 2014 (mil USD)
2015 (mil USD)
2016 (mil USD)
UAE 11,814 10,250 20,915
Iran 709 663 8,799
Kuwait 4,185 1,386 6,599
Morocco 1,669 962 4,391
Egypt 5,264 4,059 2,006
Tunisia 85 690 1,606
Saudi Arabia 1,619 3,538 1,439
Qatar 4,485 541 986
Oman 679 571 823
Jordan 313 1,331 786
Bahrain 249 494 490
Lebanon 313 14 413
Algeria 2,625 143 105
Iraq 26 0 2
Palestine 33 9 2
Syria 0 0 0
Yemen 21 0 0
Libya 0 4 0

M&A ReportMENA, Full Year 2016
Page 54 You are free to use any data or commentary from this report in your articles as long as the source is cited as “Zephyr published by Bureau van Dijk”
+44 161 838 9554 [email protected]
© Bureau van Dijk Bureau van Dijk is the leading provider of private company, corporate ownership and deal information www.bvdinfo.com
Target sector by volume - MENA deals
Target sector 2014 2015 2016
Other services 178 239 233
Chemicals, rubber, plastics 44 68 88
Construction 58 78 68
Machinery, equipment, furniture, recycling 17 21 28
Transport 16 13 27
Education, health 20 37 27
Publishing, printing 6 9 25
Food, beverages, tobacco 28 34 25
Insurance companies 14 36 24
Banks 43 23 24
Wholesale & retail trade 34 43 23
Primary sector 18 24 21
Metals & metal products 9 23 20
Hotels & restaurants 16 18 15
Gas, water, electricity 9 7 9
Wood, cork, paper 6 7 7
Post and telecommunications 11 7 5
Textiles, wearing apparel, leather 4 5 4
Public administration and defence 3 0 0
Target sector by value - MENA deals
Target sector 2014 (mil USD)
2015 (mil USD)
2016 (mil USD)
Banks 3,623 1,950 19,393
Other services 9,099 5,064 9,910
Chemicals, rubber, plastics 1,585 4,511 4,403
Hotels & restaurants 43 505 3,810
Insurance companies 315 1,216 2,637
Metals & metal products 435 710 2,397
Post and telecommunications 3,014 747 1,472
Construction 6,916 3,179 973
Education, health 746 1,245 963
Wholesale & retail trade 3,424 1,175 678
Transport 1,208 400 671
Food, beverages, tobacco 2,034 372 561
Primary sector 756 4,080 542
Machinery, equipment, furniture, recycling 356 362 184
Publishing, printing 62 47 94
Wood, cork, paper 5 323 9
Gas, water, electricity 883 541 7
Textiles, wearing apparel, leather 10 7 0
Public administration and defence 2,607 0 0

M&A ReportMENA, Full Year 2016
Page 55 You are free to use any data or commentary from this report in your articles as long as the source is cited as “Zephyr published by Bureau van Dijk”
+44 161 838 9554 [email protected]
© Bureau van Dijk Bureau van Dijk is the leading provider of private company, corporate ownership and deal information www.bvdinfo.com
MENA private equity deals by volume and value
Announced date No of deals Total deal value (mil USD)
2016 81 1,469
2015 74 3,293
2014 63 2,396
2013 61 593
2012 29 1,078
2011 52 302

M&A ReportMENA, Full Year 2016
Page 56 You are free to use any data or commentary from this report in your articles as long as the source is cited as “Zephyr published by Bureau van Dijk”
+44 161 838 9554 [email protected]
© Bureau van Dijk Bureau van Dijk is the leading provider of private company, corporate ownership and deal information www.bvdinfo.com
MENA private equity deals by volume and value
0
10
20
30
40
50
60
70
80
90
0
500
1,000
1,500
2,000
2,500
3,000
3,500
2011 2012 2013 2014 2015 2016
Dea
l val
ue (m
il U
SD
)
Total deal value (mil USD) Number of deals

M&A ReportMENA, Full Year 2016
Page 57 You are free to use any data or commentary from this report in your articles as long as the source is cited as “Zephyr published by Bureau van Dijk”
+44 161 838 9554 [email protected]
© Bureau van Dijk Bureau van Dijk is the leading provider of private company, corporate ownership and deal information www.bvdinfo.com
Top 20 MENA private equity deals by value
Deal value (mil USD) Deal type Target Target
country Fund Manager/General Partner Announced date
1. 500 Minority stake Careem Networks FZ LLC AE Saudi Telecom Company; Abraaj Capital Ltd; Al-Tayyar Travel Group; Lumia Capital LLC; BECO Capital Investments LLC; Wamda Capital Partners Ltd; Endure Capital; SQM Frontier Management LP; El Sewedy Investments; Rakuten Ventures
19/12/2016
2. 272 Minority stake Souq.com FZ LLC AE The International Finance Corporation; Naspers Ltd; Standard Chartered Private Equity Ltd; Baillie Gifford & Co Ltd; Tiger Global Management LLC
29/02/2016
3. 200 Minority stake 40% Al Borg Medical Laboratories Company SA Investcorp Bank BSC 22/11/2016
4. 109 Minority stake 42% United Eastern Medical Services LLC AE Jadwa Investment Company 26/06/2016
5. 82 IBO 100% Cravia Inc. LLC AE Fajr Capital Ltd 16/05/2016
6. 52 Minority stake 40% Medis Laboratories TN Actis LLP 18/04/2016
7. 50 Minority stake United Sugar Company of Egypt SAE EG European Bank for Reconstruction and Development 29/03/2016
8. 44 IBO 77% Tanmeyah Microenterprise Services SAE EG EFG-Hermes Holdings SAE 24/02/2016
9. 34 Minority stake B Tech Company for Trade and Distribution SAE EG Development Partners International LLP 21/07/2016
10. 25 Minority stake Carbon Holdings Ltd EG The International Finance Corporation 30/05/2016
11. 22 Minority stake 18% Universite Privee de Marrakech MA Mediterrania Capital Partners 11/10/2016
12. 20 Minority stake Propertyfinder FZ-LLC AE Vostok New Ventures Ltd 11/01/2016
13. 10 IBO 17% Tanmeyah Microenterprise Services SAE EG EFG-Hermes Holdings SAE 01/03/2016
14. 8 Minority stake The Luxury Closet AE Middle East Venture Partners; Equitrust GmbH; Wamda Capital Partners Ltd; Arzan Financial Group for Financing and Investment KPSC
26/09/2016
15. 7 Minority stake Traveazy DMCC AE Accel Management Company LLC; F&C Overseas Investment; Al-Sanie Company 12/10/2016
16. 5 Minority stake Kharabeesh Lil-Tasmeem JO Dash Ventures Ltd; Wamda Capital Partners Ltd; Endeavor Global Inc. 11/08/2016
17. 4 Minority stake Reserveout Ltd AE 500 Startups Management Company LLC; Silicon Badia; iMena Holdings; Jisr Venture Partners 08/05/2016
18. 4 Minority stake Bayzat FZ-LLC AE BECO Capital Investments LLC; Precinct Partners 10/11/2016
19. 3 Minority stake Mini Exchange DMCC AE 01/11/2016
20. 3 Minority stake MoveSouq AE AddVenture 20/09/2016
M&A ReportMENA, Full Year 2016
Page 58 You are free to use any data or commentary from this report in your articles as long as the source is cited as “Zephyr published by Bureau van Dijk”
+44 161 838 9554 [email protected]
© Bureau van Dijk Bureau van Dijk is the leading provider of private company, corporate ownership and deal information www.bvdinfo.com
Target country by volume - MENA private equity deals
Target country 2014 2015 2016
UAE 26 26 30
Egypt 15 10 12
Saudi Arabia 5 10 7
Palestine 0 2 6
Morocco 5 7 6
Lebanon 1 7 6
Tunisia 2 3 5
Algeria 1 0 4
Bahrain 1 2 2
Jordan 9 5 2
Iran 0 1 1
Oman 0 0 0
Qatar 1 0 0
Libya 0 0 0
Yemen 0 0 0
Iraq 1 0 0
Kuwait 0 1 0
Syria 0 0 0
Target country by value - MENA private equity deals
Target country 2014 (mil USD)
2015 (mil USD)
2016 (mil USD)
UAE 1,573 1,596 1,018
Saudi Arabia 419 290 201
Egypt 268 571 166
Tunisia 0 17 54
Morocco 126 454 23
Jordan 45 183 5
Bahrain 0 0 2
Lebanon 2 8 1
Oman 0 0 0
Qatar 18 0 0
Palestine 0 4 0
Libya 0 0 0
Yemen 0 0 0
Algeria 0 0 0
Iraq 0 0 0
Iran 0 0 0
Kuwait 0 170 0
Syria 0 0 0

M&A ReportMENA, Full Year 2016
Page 59 You are free to use any data or commentary from this report in your articles as long as the source is cited as “Zephyr published by Bureau van Dijk”
+44 161 838 9554 [email protected]
© Bureau van Dijk Bureau van Dijk is the leading provider of private company, corporate ownership and deal information www.bvdinfo.com
Target sectors by volume - MENA private equity deals
Target sector 2014 2015 2016
Other services 26 34 37
Wholesale & retail trade 5 7 10
Publishing, printing 4 5 9
Education, health 10 8 7
Chemicals, rubber, plastics 3 6 4
Wood, cork, paper 0 1 4
Hotels & restaurants 1 2 3
Construction 3 1 1
Primary sector 1 1 1
Metals & metal products 0 2 1
Food, beverages, tobacco 3 4 1
Gas, water, electricity 2 1 1
Machinery, equipment, furniture, recycling 1 2 1
Textiles, wearing apparel, leather 0 1 0
Public administration and defence 1 0 0
Post and telecommunications 2 1 0
Transport 3 1 0
Banks 1 0 0
Insurance companies 0 1 0
Target sectors by value - MENA private equity deals
Target sector 2014 (mil USD)
2015 (mil USD)
2016 (mil USD)
Other services 595 1,775 714
Wholesale & retail trade 80 540 314
Education, health 586 354 222
Hotels & restaurants 0 240 82
Chemicals, rubber, plastics 136 81 77
Food, beverages, tobacco 141 63 50
Publishing, printing 2 6 6
Construction 66 384 2
Primary sector 370 0 1
Machinery, equipment, furniture, recycling 0 18 1
Textiles, wearing apparel, leather 0 0 0
Insurance companies 0 375 0
Gas, water, electricity 286 384 0
Public administration and defence 5 0 0
Banks 0 0 0
Wood, cork, paper 0 175 0
Metals & metal products 0 384 0
Post and telecommunications 71 0 0
Transport 75 384 0

M&A ReportRussia/CEE, Full Year 2016
Page 60 You are free to use any data or commentary from this report in your articles as long as the source is cited as “Zephyr published by Bureau van Dijk”
+44 161 838 9554 [email protected]
© Bureau van Dijk Bureau van Dijk is the leading provider of private company, corporate ownership and deal information www.bvdinfo.com
Russia and CEE dealmaking down for third year in a row
The value of M&A deals involving targets in Russia and Central and Eastern Europe (CEE) declined for the third consecutive year in 2016. In total there were 8,601 deals worth a combined USD 134,437 million signed off over the 12 months, representing a 6 per cent decrease in volume and a 10 per cent decline in value from 9,173 deals worth USD 149,180 million in 2015.
PE and VC activity in the region followed a similar pattern in 2016 and also slipped year-on-year as volume was down 14 per cent from 497 deals to 427, while value dropped 39 per cent to USD 7,369 million in the year under review (2015: USD 12,020 million).
Russia/CEE deals by volume and value
Announced date No of deals Total deal value (mil USD)
2016 8,601 134,437
2015 9,173 149,180
2014 12,370 179,726
2013 11,013 225,832
2012 8,010 133,209
2011 7,799 219,531

M&A ReportRussia/CEE, Full Year 2016
Page 61 You are free to use any data or commentary from this report in your articles as long as the source is cited as “Zephyr published by Bureau van Dijk”
+44 161 838 9554 [email protected]
© Bureau van Dijk Bureau van Dijk is the leading provider of private company, corporate ownership and deal information www.bvdinfo.com
Russia/CEE deals by volume and value
0
2,000
4,000
6,000
8,000
10,000
12,000
14,000
0
50,000
100,000
150,000
200,000
250,000
2011 2012 2013 2014 2015 2016
Dea
l val
ue (m
il U
SD
)
Total deal value (mil USD) Number of deals

M&A ReportRussia/CEE, Full Year 2016
Page 62 You are free to use any data or commentary from this report in your articles as long as the source is cited as “Zephyr published by Bureau van Dijk”
+44 161 838 9554 [email protected]
© Bureau van Dijk Bureau van Dijk is the leading provider of private company, corporate ownership and deal information www.bvdinfo.com
Russia top by value, Poland leads the way by volume
While Russia topped the country rankings by value in 2016 by some distance, it was beaten by Poland in terms of volume. Dealmaking in Russia totalled USD 78,089 million in the 12 months under review, representing 58 per cent of total CEE value (2016: USD 134,437 million).
Despite representing the lowest annual value for Russian companies since 2004 (USD 41,664 million), the USD 78,089 million recorded was still significantly ahead of nearest competitor Poland, which placed second by value with USD 21,729 million.
Poland led the way by volume with 2,649 deals in 2016, up 12 per cent year-on-year from 2,357 deals. Russian companies were the second most frequently targeted with 1,872 deals, followed by Czech Republic (1,405), Ukraine (718) and Romania (396).
Russian oil and gas firm targeted in year’s largest deal
Despite CEE deal values declining over the 12 months under review all of the top 20 deals were worth over USD 1,000 million, with two valued at more than USD 7,000 million.
The largest of the top 20 CEE transactions involved Qatar Investment Authority and Glencore acquiring a minority stake in Rosneft, a Russian oil and gas company, for USD 10,739 million.
This was followed by Asahi Group Holdings buying eight beer companies, including Plzensky Prazdroj, Ursus Breweries and Dreher Sorgyarak, Pivovary Topvar and SABMiller Brands Europe, from Anheuser-Busch InBev for USD 7,766 million.
Russian companies accounted for 12 of the top CEE 20 deals by value in 2016, while other countries such as Poland, Czech Republic and the Ukraine also featured.
Grupa Allegro tops list of 2016’s largest CEE PE deals
The largest PE and VC investment in CEE in 2016 involved Cinven, Permira Advisers and Mid Europa Partners buying Polish online auction services provider Grupa Allegro from Naspers for USD 3,253 million.
This deal alone accounted for 44 per cent of total PE and VC value for the region and surpassed the total value of all PE deals recorded in the region in 2014 (USD 2,255 million).
Only one other PE and VC investment was worth more than USD 1,000 million in 2016 and it involved Intesa SP selling Setefi Services and Intesa Sanpaolo Card to Mercury UK HoldCo, an entity controlled by Advent International, Bain Capital and Clessidra, for USD 1,090 million.

M&A ReportRussia/CEE, Full Year 2016
Page 63 You are free to use any data or commentary from this report in your articles as long as the source is cited as “Zephyr published by Bureau van Dijk”
+44 161 838 9554 [email protected]
© Bureau van Dijk Bureau van Dijk is the leading provider of private company, corporate ownership and deal information www.bvdinfo.com
Top 20 Russia/CEE deals by value
Deal value (mil USD) Deal type Target Target
country Acquiror Acquiror country
Announced date
1. 10,739 Minority stake 20% Neftyanaya Kompaniya Rosneft OAO RU Qatar Investment Authority; Glencore plc QA; GB 07/12/2016
2. 7,766 Acquisition 100% Plzensky Prazdroj AS; Ursus Breweries SA; Dreher Sorgyarak Zrt; Pivovary Topvar AS; SABMiller Brands Europe AS; among other international assets
CZ; RO; HU; SK; CZ;
Asahi Group Holdings Ltd JP 13/12/2016
3. 5,259 Acquisition 50% Aktsionernaya Neftyanaya Kompaniya Bashneft PAO RU Neftyanaya Kompaniya Rosneft OAO RU 12/10/2016
4. 4,429 Acquisition 100% Komertsiynyy Bank Pryvatbank PAT UA Ministerstvo Finansiv Ukrayiny UA 22/12/2016
5. 3,949 Minority stake 10% to 23% Novatek OAO RU Volga Grup OOO RU 29/04/2016
6. 3,866 Capital Increase 89% Grazhdanskie Samolety Sukhogo AO RU Aviatsionnaya Kholdingovaya Kompaniya Sukhoi PAO RU 16/12/2016
7. 3,701 Minority stake 32% Polyus PAO RU Polyus-Invest OOO RU 11/03/2016
8. 3,420 Acquisition 100% Ball Corporation's Polish plant; among other international assets PL Ardagh Group SA LU 25/04/2016
9. 3,253 IBO 100% Grupa Allegro Sp zoo PL Cinven Ltd; Mid Europa Partners LLP; Permira Advisers LLP GB 14/10/2016
10. 3,112 Acquisition 50% to 81% Aktsionernaya Neftyanaya Kompaniya Bashneft PAO RU Neftyanaya Kompaniya Rosneft OAO RU 15/11/2016
11. 3,017 Acquisition 65% to 100% Energeticky a Prumyslovy Holding AS CZ EP Investment Sarl; EP Investment 2 Sarl LU; LU 17/10/2016
12. 2,922 Acquisition 100% Morton OOO RU Mr Sergei Eduardovich Gordeev RU 20/09/2016
13. 2,572 Minority stake 33% Bank Polska Kasa Opieki SA PL Powszechny Zaklad Ubezpieczen SA; Polski Fundusz Rozwoju SA PL; PL 08/12/2016
14. 2,526 Acquisition 100% PointPark Properties SRO CZ GIC Pte Ltd SG 07/11/2016
15. 2,066 Capital Increase 13% Polyus PAO RU 16/12/2016
16. 2,021 Minority stake 24% Vankorneft AO RU Oil India Ltd; Indian Oil Corporation Ltd; Bharat PetroResources Ltd IN; IN; IN 17/06/2016
17. 1,600 Minority stake 20% Uralkalii PAO RU Mr Dmitrii Anatolyevich Lobyak BY 08/07/2016
18. 1,450 Acquisition 100% Arkhangelskoe Geologodobychnoe Predpriyatie AO RU Otkrytie Kholding AO RU 02/12/2016
19. 1,209 Capital Increase 77% VEB-Lizing AO RU Gosudarstvennaya Korporatsiya Bank Razvit iya i Vneshneekonomicheskoi Deyatelnosti (Vneshekonombank)
RU 11/10/2016
20. 1,137 Acquisition 10% to 50% J&T Finance Group SE CZ CEFC China Energy Co., Ltd CN 31/03/2016

M&A ReportRussia/CEE, Full Year 2016
Page 64 You are free to use any data or commentary from this report in your articles as long as the source is cited as “Zephyr published by Bureau van Dijk”
+44 161 838 9554 [email protected]
© Bureau van Dijk Bureau van Dijk is the leading provider of private company, corporate ownership and deal information www.bvdinfo.com
Target country by volume - Russia/CEE deals
Target country 2014 2015 2016
Poland 1,830 2,357 2,649
Russia 3,050 2,074 1,872
Czech Republic 230 354 1,405
Ukraine 979 794 718
Romania 643 718 396
Estonia 395 336 278
Latvia 271 266 242
Belarus 240 140 165
Bulgaria 3,586 999 155
Bosnia and Herzegovina 118 161 115
Serbia 182 209 109
Croatia 111 151 106
Hungary 230 221 106
Moldova 215 149 102
Slovenia 68 117 71
Lithuania 112 75 63
Slovakia 82 42 46
Montenegro 18 24 14
Macedonia 37 15 10
Albania 3 2 4
Kosovo 1 0 0
Target country by value - Russia/CEE deals
Target country 2014 (mil USD)
2015 (mil USD)
2016 (mil USD)
Russia 122,086 92,107 78,089
Poland 17,722 12,170 21,729
Czech Republic 4,841 3,355 16,758
Romania 5,194 11,807 10,406
Hungary 2,546 9,084 9,444
Ukraine 16,237 16,894 7,930
Slovakia 948 10,652 7,835
Croatia 927 2,389 1,745
Bulgaria 3,252 2,184 1,102
Montenegro 96 319 939
Slovenia 2,102 1,451 709
Estonia 525 211 450
Latvia 484 437 446
Bosnia and Herzegovina 297 614 234
Serbia 473 7,908 210
Lithuania 1,029 507 69
Albania 137 0 45
Belarus 2,862 206 40
Moldova 122 21 33
Macedonia 129 3 7
Kosovo 20 0 0

M&A ReportRussia/CEE, Full Year 2016
Page 65 You are free to use any data or commentary from this report in your articles as long as the source is cited as “Zephyr published by Bureau van Dijk”
+44 161 838 9554 [email protected]
© Bureau van Dijk Bureau van Dijk is the leading provider of private company, corporate ownership and deal information www.bvdinfo.com
Target sector by volume - Russia/CEE deals
Target sector 2014 2015 2016
Other services 4,560 3,254 2,547
Wholesale & retail trade 1,564 1,069 715
Machinery, equipment, furniture, recycling 821 591 522
Banks 497 520 463
Construction 832 572 413
Chemicals, rubber, plastics 461 360 329
Primary sector 609 361 264
Food, beverages, tobacco 425 334 257
Gas, water, electricity 476 309 253
Publishing, printing 256 284 217
Transport 425 299 203
Hotels & restaurants 286 235 194
Metals & metal products 302 251 171
Education, health 175 123 140
Insurance companies 286 210 104
Post and telecommunications 161 98 88
Textiles, wearing apparel, leather 172 104 72
Wood, cork, paper 94 86 60
Public administration and defence 7 2 2
Target sector by value - Russia/CEE deals
Target sector 2014 (mil USD)
2015 (mil USD)
2016 (mil USD)
Primary sector 29,402 31,652 34,246
Banks 27,291 24,158 19,221
Other services 22,093 9,732 14,449
Wholesale & retail trade 9,604 4,509 14,275
Metals & metal products 16,961 9,149 11,542
Gas, water, electricity 24,472 4,410 10,073
Machinery, equipment, furniture, recycling 7,882 12,195 9,189
Food, beverages, tobacco 3,097 3,660 8,822
Chemicals, rubber, plastics 7,369 28,524 6,587
Construction 10,296 5,456 6,075
Transport 5,712 13,588 4,202
Post and telecommunications 13,756 2,244 1,090
Hotels & restaurants 878 1,109 1,008
Insurance companies 1,776 1,122 982
Wood, cork, paper 401 1,013 723
Publishing, printing 460 294 225
Education, health 348 77 156
Textiles, wearing apparel, leather 2,008 189 56
Public administration and defence 0 0 0

M&A ReportRussia/CEE, Full Year 2016
Page 66 You are free to use any data or commentary from this report in your articles as long as the source is cited as “Zephyr published by Bureau van Dijk”
+44 161 838 9554 [email protected]
© Bureau van Dijk Bureau van Dijk is the leading provider of private company, corporate ownership and deal information www.bvdinfo.com
Russia/CEE private equity deals by volume and value
Announced date No of deals Total deal value (mil USD)
2016 427 7,369
2015 497 12,020
2014 612 2,255
2013 526 15,566
2012 340 4,397
2011 278 9,207

M&A ReportRussia/CEE, Full Year 2016
Page 67 You are free to use any data or commentary from this report in your articles as long as the source is cited as “Zephyr published by Bureau van Dijk”
+44 161 838 9554 [email protected]
© Bureau van Dijk Bureau van Dijk is the leading provider of private company, corporate ownership and deal information www.bvdinfo.com
Russia/CEE private equity deals by volume and value
0
100
200
300
400
500
600
700
0
2,000
4,000
6,000
8,000
10,000
12,000
14,000
16,000
18,000
2011 2012 2013 2014 2015 2016
Dea
l val
ue (m
il U
SD
)
Total deal value (mil USD) Number of deals

M&A ReportRussia/CEE, Full Year 2016
Page 68 You are free to use any data or commentary from this report in your articles as long as the source is cited as “Zephyr published by Bureau van Dijk”
+44 161 838 9554 [email protected]
© Bureau van Dijk Bureau van Dijk is the leading provider of private company, corporate ownership and deal information www.bvdinfo.com You are free to use any data or commentary from this report in your articles as long as the source is cited as “Zephyr published by BvD”
Top 20 Russia/CEE private equity deals by value
Deal value (mil USD) Deal type Target Target
country Fund Manager/General Partner Announced date
1. 3,253 IBO 100% Grupa Allegro Sp zoo PL Cinven Ltd; Mid Europa Partners LLP; Permira Advisers LLP 14/10/2016
2. 1,090 IBO 100% Intesa Sanpaolo Card doo; among other international assets HR Advent International Corporation; Clessidra SGR SpA; Bain Capital LP 02/05/2016
3. 600 Minority stake 22% Vertolety Rossii AO RU Upravlyayushchaya Kompaniya RFPI OOO 16/06/2016
4. 566 IBO 100% Profi Rom Food SRL RO Mid Europa Partners LLP 23/11/2016
5. 280 Minority stake 30% Erste Bank Hungary Zrt HU European Bank for Reconstruction and Development 20/06/2016
6. 272 IBO 100% Smyk Sp zoo PL Bridgepoint Advisers Ltd; Cornerstone Partners Sp zoo 15/01/2016
7. 209 IBO 100% GetBack SA PL Abris Capital Partners Sp zoo 15/03/2016
8. 137 Capital Increase AFG Natsional OOO RU Upravlyayushchaya Kompaniya RFPI OOO 16/06/2016
9. 129 IBO 100% MKB Bank Zrt HU Minerva Tokelap-Kezelo Zrt 29/06/2016
10. 122 IBO 100% Cimos dd SI Palladio Finanziaria SpA 14/10/2016
11. 93 IBO 52% and 100% Mezhdunarodnyi Aeroport Vladivostok OAO; Terminal Vladivostok ZAO RU; RU Kompaniya Bazovyi Element OOO; Changi Airports International Pte Ltd 25/11/2016
12. 78 Minority stake 40% Evrodon OOO RU Investitsionnaya Kompaniya A1 OOO 02/02/2016
13. 48 IBO 66% Kredyt Inkaso SA PL Waterland Private Equity Investments BV 26/07/2016
14. 45 IBO 37% Bid 2 – Increased offer Pekaes SA PL Innova Capital Sp zoo 29/09/2016
15. 37 IBO 100% Intersport ISI doo SI Enterprise Investors Sp zoo 14/09/2016
16. 31 IBO 100% Centrum Technologii Mobilnych Mobiltek SA PL MCI Capital SA 10/03/2016
17. 30 Minority stake Skeleton Technologies OU EE Harju Elekter AS; UP Invest OU; FirstFloor Capital Sdn Bhd 03/08/2016
18. 28 IBO 75% Centrum Rozliczen Elektronicznych Polskie ePlatnosci SA PL Innova Capital Sp zoo 30/06/2016
19. 26 IBO 59% Kopex SA PL TDJ SA 17/03/2016
20. 25 Minority stake 29% CD - Telematika AS CZ Unicapital AS 06/10/2016

M&A ReportRussia/CEE, Full Year 2016
Page 69 You are free to use any data or commentary from this report in your articles as long as the source is cited as “Zephyr published by Bureau van Dijk”
+44 161 838 9554 [email protected]
© Bureau van Dijk Bureau van Dijk is the leading provider of private company, corporate ownership and deal information www.bvdinfo.com
Target country by volume - Russia/CEE private equity deals
Target country 2014 2015 2016
Russia 255 194 203
Estonia 37 34 66
Poland 65 84 64
Czech Republic 22 23 23
Ukraine 36 31 12
Romania 16 11 12
Latvia 16 19 12
Lithuania 25 8 8
Hungary 49 37 8
Slovakia 16 8 6
Slovenia 6 9 6
Belarus 1 2 3
Croatia 1 4 3
Bulgaria 63 32 3
Serbia 5 2 1
Macedonia 0 1 0
Bosnia and Herzegovina 0 0 0
Kosovo 0 0 0
Albania 0 0 0
Moldova 0 0 0
Montenegro 0 0 0
Target country by value - Russia/CEE private equity deals
Target country 2014 (mil USD)
2015 (mil USD)
2016 (mil USD)
Poland 200 914 3,974
Croatia 12 0 1,090
Russia 989 7,445 1,005
Romania 41 169 576
Hungary 42 391 412
Slovenia 4 362 221
Estonia 71 44 40
Czech Republic 753 282 25
Lithuania 63 7 11
Ukraine 14 11 7
Slovakia 21 2,339 4
Latvia 34 45 3
Belarus 16 0 0
Bulgaria 3 3 0
Serbia 0 6 0
Macedonia 0 0 0
Bosnia and Herzegovina 0 0 0
Kosovo 0 0 0
Albania 0 0 0
Moldova 0 0 0
Montenegro 0 0 0

M&A ReportRussia/CEE, Full Year 2016
Page 70 You are free to use any data or commentary from this report in your articles as long as the source is cited as “Zephyr published by Bureau van Dijk”
+44 161 838 9554 [email protected]
© Bureau van Dijk Bureau van Dijk is the leading provider of private company, corporate ownership and deal information www.bvdinfo.com
Target sectors by volume - Russia/CEE private equity deals
Target sector 2014 2015 2016
Other services 418 302 264
Publishing, printing 63 68 59
Machinery, equipment, furniture, recycling 45 39 29
Wholesale & retail trade 25 16 14
Chemicals, rubber, plastics 11 12 6
Food, beverages, tobacco 6 11 6
Education, health 7 9 6
Construction 11 5 5
Post and telecommunications 3 4 5
Gas, water, electricity 4 4 5
Transport 4 3 4
Primary sector 4 3 4
Insurance companies 1 2 3
Textiles, wearing apparel, leather 2 4 3
Hotels & restaurants 4 3 3
Wood, cork, paper 2 1 2
Banks 3 6 2
Metals & metal products 3 4 2
Public administration and defence 0 0 0
Target sectors by value - Russia/CEE private equity deals
Target sector 2014 (mil USD)
2015 (mil USD)
2016 (mil USD)
Wholesale & retail trade 337 941 4,136
Other services 948 748 1,534
Machinery, equipment, furniture, recycling 45 50 820
Banks 30 2,653 409
Primary sector 150 1,250 215
Transport 4 0 137
Publishing, printing 50 104 48
Post and telecommunications 366 25 25
Wood, cork, paper 32 112 20
Chemicals, rubber, plastics 209 5,035 19
Construction 33 301 2
Textiles, wearing apparel, leather 0 0 1
Hotels & restaurants 2 0 1
Insurance companies 0 7 0
Education, health 4 1 0
Gas, water, electricity 7 529 0
Metals & metal products 0 2 0
Food, beverages, tobacco 51 340 0
Public administration and defence 0 0 0

Zephyr Half Year M&A Report
Notes to editors
Activity is based on the activity of the target company.
Deal status is announced within the time period.
The sector breakdown uses targets’ activities as defined to be ‘Major Sectors’ by Zephyr.
The date range for Full Year 2016 is deals announced between 01/01/2016 - 31/12/2016 inclusive.
The Western Europe region covers target companies in Andorra, Austria, Belgium, Cyprus, Denmark, Finland, France, Germany, Gibraltar, Greece, Iceland, Ireland, Italy, Liechtenstein, Luxembourg, Malta, Monaco, Netherlands, Norway, Portugal, San Marino, Spain, Sweden, Switzerland, Turkey and the UK.
The Asia and Asia Pacific region covers target companies based in the Far East, Southeast Asia, Central Asia and Oceania.
The MENA region covers target companies in Algeria, Bahrain, Egypt, Iran, Iraq, Kuwait, Jordan, Lebanon, Libyan Arab Jamahiriya, Morocco, Oman, Palestinian Territory, Qatar, Saudi Arabia, Syrian Arab Republic, Tunisia, UAE and Yemen. It excludes Israel.
The Russia/CEE region covers target companies in Albania, Belarus, Bosnia and Herzegovina, Bulgaria, Croatia, Czech Republic, Estonia, Hungary, Kosovo, Latvia, Lithuania, Macedonia, Moldova, Montenegro, Poland, Romania, Russia, Serbia, Slovakia, Slovenia and Ukraine.
Advisor league tables are based on advisors advising any party in the deal i.e. acquiror, target or vendor.
Where deals have multiple targets the sector and region of each target is represented in the data.
All deal types are included except joint ventures, IPOs, planned IPOs and share buybacks.

Bureau van Dijk – welcome to the business of certainty
Bureau van Dijk is the leading provider of the richest, most reliable private company information in the market. We capture and treat private
company and M&A information for better decision making and increased efficiency.
Bureau van Dijk’s product range combines data from regulatory and other sources, including 150 information partners, with flexible software to allow
users to manipulate data for a range of research needs and applications.
In addition, Bureau van Dijk addresses specific business challenges through its range of Catalysts including KYC, client on-boarding, credit,
procurement, transfer pricing, M&A research and valuations, while its Custom division delivers bespoke solutions.
www.bvdinfo.com/corporatefinance
Zephyr – the most comprehensive deal database
Zephyr is an information solution containing M&A, IPO and venture capital deals and rumours with links to detailed financial company information.
Winner of numerous recent M&A industry awards, including Best Global M&A Database 2016 at the Acquisition International M&A Awards, Zephyr
is published by Bureau van Dijk. The deals on Zephyr are linked to the company financials and peer reports on Bureau van Dijk’s product range.
Zephyr contains information on over 1.4 million deals. www.zephyrdealdata.com
Orbis – powering the business of certainty
The world’s most powerful comparable data resource on private companies, Bureau van Dijk’s Orbis database provides information on more than
200 million companies across the globe, over 99% of them private. Orbis combines information from regulatory and other sources, and delivers
company information with added value. Its users can: research individual companies or groups of companies; search for companies by profile;
analyse and evaluate companies; and make better-informed decisions. www.bvdinfo.com/orbis
M&A Research Catalyst – combining deal and company data
Drawing data from Orbis and Zephyr, M&A Research Catalyst delivers clear and easy-to-interpret reports specifically created for M&A research.
They combine information on companies, comparable deals and valuations alongside an interface to help you identify targets, or acquirers, and
value companies. M&A Research Catalyst provides you with M&A-tailored information in an easy-to-interpret report, including: financials; earnings
estimates; news and deals; comparable companies and deals; DCF valuation; and valuation multiples. www.bvdinfo.com/ma-catalyst