ma san group corporation · 2016-12-01 · ma san group corporation and its subsidiaries balance...
TRANSCRIPT


Ma San Group Corporation
Corporate Information
1
Business Registration Certificate No 0303576603 20 August 2014
The Company’s Business Registration Certificate has been
amended several times, the most recent of which is dated 20
August 2014. The Certificate and its amendments were
issued by the Department of Planning and Investment of Ho
Chi Minh City. The initial Business Registration Certificate
No. 4103002877 was dated 18 November 2004.
Board of Directors Dr Nguyen Dang Quang Chairman
Mr Ho Hung Anh Member
Ms Nguyen Hoang Yen Member
Mr Nguyen Thieu Nam Member
Mr Lars Kjaer Member
Mr Dominic Edward Salter Price Member (from 25 April 2014)
Registered Office Suite 802, Central Plaza
17 Le Duan Street
Ben Nghe Ward, District 1
Ho Chi Minh City
Vietnam
Auditors KPMG Limited
Vietnam


Ma San Group Corporation and its subsidiaries
Balance sheets at 30 June 2014
Form B 01a – DN/HN
The accompanying notes are an integral part of these interim financial statements
4
Group Company
Code Note 30/6/2014 31/12/2013 30/6/2014 31/12/2013
VND million VND million VND million VND million
ASSETS
Current assets
(100 = 110 + 120 + 130 + 140 + 150) 100 9,011,832 11,198,630 4,949,701 12,352,670
Cash and cash equivalents 110 5 5,160,730 5,698,563 642,385 1,379,279
Cash 111 282,432 203,577 11,555 11,831
Cash equivalents 112 4,878,298 5,494,986 630,830 1,367,448
Short-term investments 120 12 283,300 3,287,000 - -
Accounts receivable 130 6 1,522,663 975,138 4,199,296 10,893,087
Accounts receivable - trade 131 720,873 351,434 60,638 -
Prepayments to suppliers 132 344,098 360,236 136,717 139,141
Other receivables 135 459,885 265,252 4,001,941 10,753,946
Allowance for doubtful debts 139 (2,193) (1,784) - -
Inventories 140 7 1,631,769 1,070,334 - -
Inventories 141 1,645,582 1,091,073 - -
Allowance for inventories 149 (13,813) (20,739) - -
Other current assets 150 413,370 167,595 108,020 80,304
Short-term prepayments 151 56,007 28,718 4,395 489
Deductible value added tax 152 203,798 100,506 48,876 46,866
Taxes receivables from State Treasury 154 72,096 - 20,702 -
Other current assets 158 81,469 38,371 34,047 32,949

Ma San Group Corporation and its subsidiaries
Balance sheets at 30 June 2014 (continued)
Form B 01a – DN/HN
The accompanying notes are an integral part of these interim financial statements
5
Group Company
Code Note 30/6/2014 31/12/2013 30/6/2014 31/12/2013
VND million VND million VND million VND million
Long-term assets
(200 = 210 + 220 + 250 + 260 + 269) 200 36,459,339 35,303,511 18,339,002 19,375,093
Accounts receivable – long-term 210 6 712,452 450,183 4,265,124 2,875,015
Other long-term receivables 218 712,452 450,183 4,265,124 2,875,015
Fixed assets 220 21,492,846 23,121,361 12,422 81,122
Tangible fixed assets 221 8 17,571,704 1,731,429 9,608 68,036
Cost 222 18,697,832 2,457,614 20,759 92,565
Accumulated depreciation 223 (1,126,128) (726,185) (11,151) (24,529)
Finance lease tangible fixed assets 224 9 51,597 58,327 - -
Cost 225 67,300 67,300 - -
Accumulated depreciation 226 (15,703) (8,973) - -
Intangible fixed assets 227 10 1,470,183 1,288,672 2,814 3,065
Cost 228 1,865,530 1,597,069 4,508 4,214
Accumulated amortisation 229 (395,347) (308,397) (1,694) (1,149)
Construction in progress 230 11 2,399,362 20,042,933 - 10,021
Long-term investments 250 12 10,771,961 10,761,467 14,010,034 16,355,220
Investments in subsidiaries 251 - - 5,077,610 7,422,796
Investments in associates 252 10,719,361 10,757,867 8,932,424 8,932,424
Other long-term investments 258 52,600 3,600 - -
Other long-term assets 260 3,071,008 533,381 51,422 63,736
Long-term prepayments 261 13 2,829,957 403,353 42,041 53,311
Deferred tax assets 262 14 196,990 87,572 - -
Other long-term assets 268 44,061 42,456 9,381 10,425
Goodwill 269 15 411,072 437,119 - -
TOTAL ASSETS (270 = 100 + 200) 270 45,471,171 46,502,141 23,288,703 31,727,763

Ma San Group Corporation and its subsidiaries
Balance sheets at 30 June 2014 (continued)
Form B 01a – DN/HN
The accompanying notes are an integral part of these interim financial statements
6
Group Company
Code Note 30/6/2014 31/12/2013 30/6/2014 31/12/2013
VND million VND million VND million VND million
RESOURCES
LIABILITIES (300 = 310 + 330) 300 23,690,979 23,240,644 6,017,522 17,472,541
Current liabilities 310 6,068,695 9,783,892 435,760 3,684,322
Short-term borrowings and liabilities 311 16 2,250,081 6,635,910 188,100 2,311,300
Accounts payable – trade 312 1,204,578 942,375 276 9,286
Advances from customers 313 21,480 22,163 - -
Taxes payable to State Treasury 314 17 374,155 483,421 19 386
Payables to employees 315 47,938 20,387 - -
Accrued expenses 316 18 2,023,796 1,578,366 234,286 479,911
Other payables 319 19 146,667 101,270 13,079 883,439
Long-term borrowings and
liabilities 330 17,622,284 13,456,752 5,581,762 13,788,219
Other long-term liabilities 333 19 208,652 234,688 81,440 1,812,997
Long-term borrowings and liabilities 334 20 16,198,953 12,067,096 5,500,322 11,975,222
Deferred tax liabilities 335 14 1,211,977 1,151,716 - -
Provisions – long-term 337 21 2,702 3,252 - -
EQUITY (400 = 410) 400 14,264,299 14,432,969 17,271,181 14,255,222
Owner’s equity 410 22 14,264,299 14,432,969 17,271,181 14,255,222
Share capital 411 23 7,349,113 7,349,113 7,349,113 7,349,113
Capital surplus 412 23 9,601,627 9,601,627 9,601,627 9,601,627
Other capital 413 24 97,703 97,703 97,703 97,703
Foreign exchange differences 416 3,115 (43,098) - -
Other reserves 418 (8,799,311) (8,929,770) (1,586,675) (1,586,675)
Retained profits 420 6,012,052 6,357,394 1,809,413 (1,206,546)
MINORITY INTERESTS 439 7,515,893 8,828,528 - -
TOTAL RESOURCES
(440 = 300 + 400 + 439) 440 45,471,171 46,502,141 23,288,703 31,727,763


Ma San Group Corporation and its subsidiaries
Statements of income for the six-month period ended 30 June 2014
Form B 02a – DN/HN
The accompanying notes are an integral part of these interim financial statements
8
Group Company
Code Note
From
1/1/2014 to
30/6/2014
From
1/1/2013 to
30/6/2013
From
1/1/2014 to
30/6/2014
From
1/1/2013 to
30/6/2013
VND million VND million VND million VND million
Total revenue 01 25 6,943,236 4,354,940 - -
Less revenue deductions 02 25 104,283 84,861 - -
Net revenue (10 = 01 – 02) 10 25 6,838,953 4,270,079 - -
Cost of sales 11 26 4,211,235 2,651,459 - -
Gross profit (20 = 10 – 11) 20 2,627,718 1,618,620 - -
Financial income 21 27 272,467 227,117 3,652,541 598,651
Financial expenses 22 28 881,763 156,921 573,650 739,448
In which: Interest expense 23 739,854 115,195 570,743 531,038
Selling expenses 24 1,339,903 732,045 - -
General and administration
expenses 25 505,856 392,468 69,878 111,777
Net operating profit/(loss)
{30 = 20 + (21 - 22) - (24 + 25)} 30 172,663 564,303 3,009,013 (252,574)
Other income 31 29 96,652 123,675 67,865 72,723
Other expenses 32 30 74,500 33,745 60,919 -
Results of other activities
(40 = 31 - 32) 40
22,152 89,930 6,946 72,723
Share of profit/(loss) in associates 41 31 41,494 (72,953) - -
Profit/(loss) before tax
(50 = 30 + 40 + 41)
(carried forward to next page)
50 236,309 581,280 3,015,959 (179,851)


Ma San Group Corporation and its subsidiaries
Statements of cash flows for the six-month period ended 30 June 2014 (Indirect method)
Form B 03a – DN/HN
The accompanying notes are an integral part of these interim financial statements
10
Group Company
Code Note
From
1/1/2014 to
30/6/2014
From
1/1/2013 to
30/6/2013
From
1/1/2014 to
30/6/2014
From
1/1/2013 to
30/6/2013
VND million VND million VND million VND million
CASH FLOWS FROM OPERATING ACTIVITIES
Profit/(loss) before tax 01 236,309 581,280 3,015,959 (179,851)
Adjustments for
Depreciation and amortisation 02 707,206 214,431 20,479 13,746
Allowances and provisions 03 31,528 6,157 - -
Net unrealised foreign exchange
losses/(gains) 04 41,882 (6,713) (676) -
Loss on disposal and written off of
fixed assets and other long-term assets 05 2,393 200 1,433 -
Dividends, interest and facility income 05 (241,175) (189,063) (3,651,858) (590,671)
Interest and facility expenses 06 739,854 115,195 573,636 727,338
Share of (profit)/loss in associates 07 (41,494) 72,953 - -
Operating profit/(loss) before changes
in working capital 08 1,476,503 794,440 (41,027) (29,438)
Change in receivables and other assets 09 (776,323) (227,570) (17,894) (197,773)
Change in inventories 10 (592,554) (404,196) - -
Change in payables and other liabilities 11 571,027 (233,779) (143,033) (14,973)
678,653 (71,105) (201,954) (242,184)
Interest paid 13 (928,343) (776,049) (455,897) (327,085)
Corporate income tax paid 14 (420,437) (583,378) - -
Other payments for operating activities 16 (51,235) (17,730) - -
Net cash flows from operating
activities 20 (721,362) (1,448,262) (657,851) (569,269)

Ma San Group Corporation and its subsidiaries
Statements of cash flows for the six-month period ended 30 June 2014
(Indirect method - continued)
Form B 03a – DN/HN
The accompanying notes are an integral part of these interim financial statements
11
Group Company
Code Note
From
1/1/2014 to
30/6/2014
From
1/1/2013 to
30/6/2013
From
1/1/2014 to
30/6/2014
From
1/1/2013 to
30/6/2013
VND million VND million VND million VND million
CASH FLOWS FROM INVESTING ACTIVITIES
Payments for additions to fixed assets
and other long-term assets 21 (924,786) (2,329,348) (1,425) (14,487)
Proceeds from disposals of fixed assets
and other long-term assets 22 1,520 113 - -
Payments for lending loans to
subsidiaries 23 - - (1,778,985) (1,144,493)
Payments for lending loans to third
party 23 (235,799) (214,494) - -
Collecting loans provided to
subsidiaries 23 - - 606,777 727,000
Term deposit to banks 24 (12,638,951) (24,301,551) - -
Term deposit received 24 15,593,651 26,142,051 - 68,000
Net cash used in acquisition of
subsidiary 26 - (429,139) - -
Payments for investment in subsidiaries 26 (287,265) (207,462) - (1,881,404)
Receipts of interest and dividend 27 329,638 294,245 547,688 16,011
Net cash flows from investing activities 30 1,838,008 (1,045,585) (625,945) (2,229,373)

Ma San Group Corporation and its subsidiaries
Statements of cash flows for the six-month period ended 30 June 2014
(Indirect method - continued)
Form B 03a – DN/HN
The accompanying notes are an integral part of these interim financial statements
12
Group Company
Code Note
From
1/1/2014 to
30/6/2014
From
1/1/2013 to
30/6/2013
From
1/1/2014 to
30/6/2014
From
1/1/2013 to
30/6/2013
VND million VND million VND million VND million
CASH FLOWS FROM FINANCING ACTIVITIES
Proceeds from issuance of new shares 31 - 178,608 - 178,608
Proceeds from issuance of new shares
in subsidiaries to minority interest 31 108,566 2,964,725 - -
Proceeds from short-term and long-
term borrowings 33 11,118,735 3,131,399 735,000 1,050,000
Payments to settle debts to banks and
other entities 34 (11,418,410) (3,173,714) (188,100) -
Payment for borrowing fee 34 (166,760) - - -
Payment of dividends to minority
interest by subsidiaries 36 (1,298,323) (14,926) - -
Net cash flows from financing activities 40 (1,656,192) 3,086,092 546,900 1,228,608
Net cash flows during the period
(50 = 20 + 30 + 40) 50 (539,546) 592,245 (736,896) (1,570,034)
Cash and cash equivalents at the
beginning of the period 60 5,698,563 5,718,717 1,379,279 2,160,026
Effect of exchange rate fluctuations on
cash and cash equivalents 61 1,713 31,278 2 -
Cash and cash equivalents at the end
of the period (70 = 50 + 60 + 61) 70 5 5,160,730 6,342,240 642,385 589,992


Ma San Group Corporation and its subsidiaries
Notes to the interim financial statements for the six-month period ended 30 June 2014
Form B 09a – DN/HN
14
These notes form an integral part of and should be read in conjunction with the accompanying interim
financial statements.
1. Reporting entity
Ma San Group Corporation (“the Company”) is a joint stock company incorporated in Vietnam. The
principal activity of the Company is in investment holding.
The consolidated interim financial statements comprise the Company and its subsidiaries (together
referred to as “the Group”).
The principal activities of the subsidiaries are described as follows:
Name Principal activity Percentage of
economic interests at
30/6/2014 31/12/2013
MasanConsumerHoldings Company Limited Investment holding 100% 100%
Orchid Consultant Company Limited Investment holding 100% 100%
Ma San Consumer Corporation Trading, distribution and
consulting
77.3% 74.2%
Masan Food Company Limited Food Trading 77.3% 74.2%
Ma San Industrial One Member Company
Limited
Food sauce and instant
noodle manufacturing
77.3% 74.2%
Viet Tien Food Technology One member
Company Limited
Food sauce manufacturing 77.3% 74.2%
Ma San HD One member Company Limited Instant noodle
manufacturing
77.3% 74.2%
Ma San PQ Corporation Food sauce manufacturing 73.1% 70.1%
Minh Viet Packaging One Member Company
Limited
Packaging 77.3% 74.2%
Masan Beverage Company Limited (*) Beverage trading and
manufacturing
77.3% -
Vinacafe Bien Hoa Joint Stock Company Beverage manufacturing 41.1% 39.5%
Vinh Hao Mineral Water Corporation Beverage manufacturing 49.1% 47.1%
Kronfa., JSC Beverage manufacturing 49.1% 47.1%

Ma San Group Corporation and its subsidiaries
Notes to the interim financial statements for the six-month period ended 30 June 2014
(continued)
Form B 09a – DN/HN
15
Name Principal activity Percentage of
economic interests at
30/6/2014 31/12/2013
Ma San Horizon Corporation Investment holding 100% 100%
Ma San Resources Corporation Investment holding 74.1% 75.9%
Ma San Thai Nguyen Resources
Company Limited
Investment holding 74.1% 75.9%
Thai Nguyen Trading and Investment
Company Limited
Investment holding 74.1% 75.9%
Nui Phao Mining Company Limited Exploring and processing
mineral
74.1% 75.9%
Masan Agri Corporation (**) Investment holding 51% 37.9%
(*) On 28 May 2014, the Planning and Investment Department of Ho Chi Minh City issued the Business
Registration Certificate No. 0312797567 approving the establishment of Masan Beverage Company
Limited, the new 100% owned subsidiary of Ma San Consumer Corporation (“MSC”).
(**) In May 2014, the Company acquired 51% equity interest of Masan Agri Corporation (“Masan Agri”)
from MSC for a consideration of VND1,246,496 million. Therefore, the Company’s effective interest in
Masan Agri Corporation increased from 37.9% as at 31 December 2013 to 51% as at 30 June 2014.
All the subsidiaries are incorporated in Vietnam.
The percentage of economic interests represents the effective percentage of economic interests of the
Company both directly and indirectly in the subsidiaries.
As at 30 June 2014, the Company had 31 employees (31/12/2013: 38 employees) and the Group had
6,804 employees (31/12/2013: 7,297 employees).

Ma San Group Corporation and its subsidiaries
Notes to the interim financial statements for the six-month period ended 30 June 2014
(continued)
Form B 09a – DN/HN
16
2. Basis of preparation
(a) Statement of compliance
The interim financial statements have been prepared in accordance with Vietnamese Accounting Standard
27 – Interim Financial Reporting, the Vietnamese Accounting System for Enterprises and the relevant
statutory requirements applicable to interim financial reporting.
(b) Basis of measurement
The interim financial statements, except for the statement of cash flows, are prepared on the accrual basis
using the historical cost concept. The statement of cash flows is prepared using the indirect method.
(c) Annual accounting period
The annual accounting period of the Company is from 1 January to 31 December.
(d) Accounting currency
The interim financial statements are prepared and presented in millions of Vietnam Dong (“VND
million”).
3. Summary of significant accounting policies
The following significant accounting policies have been adopted by the Group and the Company in the
preparation of these interim financial statements.
(a) Basis of consolidation
(i) Common-control business combination
Business combination where the same group of shareholders (“the Controlling Shareholders”) control the
combining companies before and after the business combination meets the definition of business
combination under common control because there is a continuation of the risks and benefits to the
Controlling Shareholders. Such common control business combination is specifically excluded from the
scope of Vietnamese Accounting Standard 11 Business Combination and in selecting its accounting
policy with respect to such transaction, the Group has considered Vietnamese Accounting Standard 01
Framework and Vietnamese Accounting Standard 21 Presentation of Financial Statements. Based on
these standards, the Group has adopted the merger (“carry-over”) basis of accounting. The assets and
liabilities of the combining companies are consolidated using the existing book values from the
Controlling Shareholders’ perspective. Any difference between the cost of acquisition and net assets
acquired is treated as a deemed distribution to or contribution from shareholders and recorded directly in
equity.

Ma San Group Corporation and its subsidiaries
Notes to the interim financial statements for the six-month period ended 30 June 2014
(continued)
Form B 09a – DN/HN
17
The consolidated statements of income, consolidated statement of cash flows and consolidated movement
in owners’ equity include the results of operations of the combining companies as if the group structure
had been in existence from the Controlling Shareholders’ perspective throughout the entire periods
presented (or where the companies were incorporated at a date later than the beginning of the earliest
period presented, for the period from the date of incorporation to the end of the relevant reporting
periods).
(ii) Non-common control business combination
Non-common control business combinations are accounted for using the purchase method as at the
acquisition date, which is the date on which control is transferred to the Group. Control is the power to
govern the financial and operating policies of an entity so as to obtain benefits from its activities. In
assessing control, the Group takes into consideration potential voting rights that currently are exercisable.
Under the purchase method, the assets and liabilities of the acquired entity are consolidated using their
fair values. Cost of acquisition consists of the aggregate fair value at the date of exchange, of assets
given, liabilities incurred or assumed, and equity instruments issued by the Group. Goodwill represents
the excess of the cost of acquisition over the Group’s interest in the net fair value of the identifiable
assets, liabilities and contingent liabilities of the acquired entity. When the excess is negative, it is
recognised immediately in profit or loss.
Transaction costs, other than those associated with the issue of debt or equity securities, that the Group
incurred in connection with business combinations included any costs directly attributable to the
combination, such as professional fees paid to accountants, legal advisers, valuers and other consultants to
effect the combination. Transaction costs are capitalised into the cost of business combination. General
administrative costs and other costs that cannot be directly attributed to the particular combination being
accounted for are not included in the cost of the combination; they are recognised as an expense when
incurred.
(iii) Subsidiaries
Subsidiaries are entities controlled by the Group. Control exists when the Group has the power to govern
the financial and operating policies of an entity so as to obtain benefits from its activities. In assessing
control, potential voting rights that currently are exercisable are taken into account. The financial
statements of subsidiaries are included in the consolidated interim financial statements from the date that
control commences until the date that control ceases.

Ma San Group Corporation and its subsidiaries
Notes to the interim financial statements for the six-month period ended 30 June 2014
(continued)
Form B 09a – DN/HN
18
(iv) Associates (equity accounted investees)
Associates are those entities in which the Group has significant influence, but not control, over the
financial and operating policies. Significant influence is presumed to exist when the Group holds
between 20 and 50 percent of the voting power of another entity. Associates are accounted for in the
consolidated interim financial statements using the equity method (equity accounted investees) and are
initially recognised at cost. The Group’s investment in associates includes goodwill identified on
acquisition, net of any accumulated amortisation on the goodwill. The consolidated financial statements
include the Group’s share of the income and expenses of equity accounted investees, after adjustments to
align the accounting policies with those of the Group, from the date that significant influence commences
until the date that significant influence ceases. When the Group’s share of losses exceeds its interest in an
equity accounted investee, the carrying amount of that interest (including any long-term investments) is
reduced to nil and the recognition of further losses is discontinued except to the extent that the Group has
an obligation or has made payments on behalf of the investee.
(v) Minority interests
For changes in the Group’s ownership interest in a subsidiary that do not result in change in control, the
difference between the cost of acquisition or proceeds on disposal of the interest and the proportionate
carrying amount of net assets acquired or disposed at the date of exchange is recorded directly in equity.
(vi) Transactions eliminated on consolidation
Intra-group balances, and any unrealised income and expenses arising from intra-group transactions, are
eliminated in preparing the consolidated interim financial statements. Unrealised gains and losses arising
from transactions with equity accounted investees are eliminated against the investment to the extent of
the Group’s interest in the investee.
(b) Foreign currency transactions
Monetary assets and liabilities denominated in currencies other than VND are translated into VND at
rates of exchange ruling at the balance sheet date. Transactions in currencies other than VND during the
year have been translated into VND at rates approximating those ruling at the transaction dates.
All foreign exchange differences are recorded in the statement of income, except when they relate to the
construction of tangible fixed assets or the translation of foreign currency monetary items during pre-
operating stage, in which case they are recorded in the Foreign Exchange Difference Account in equity
until the entity commences operations and the tangible fixed assets are put into use. Once the entity
commences operations and the tangible fixed assets are put into use, the net related foreign exchange gain
or loss is transferred to Unearned Revenue Account or Long-term Prepayment Account respectively. The
net gain or loss is then amortised on a straight line basis over 5 years.

Ma San Group Corporation and its subsidiaries
Notes to the interim financial statements for the six-month period ended 30 June 2014
(continued)
Form B 09a – DN/HN
19
(c) Cash and cash equivalents
Cash comprises cash balances and call deposits. Cash equivalents are short-term highly liquid
investments that are readily convertible to known amount of cash, are subject to an insignificant risk of
changes in value, and are held for the purpose of meeting short-term cash commitments rather than for
investment or other purposes.
(d) Investments
Investments in term deposits and debt instruments, investments in equity instruments of entities over
which the Group has no control or significant influence in the consolidated financial statements, and
investments in all equity instruments in the separate financial statements are stated at cost. Allowance is
made for reductions in investment values which in the opinion of the management are not temporary.
The allowance is reversed if the subsequent increase in recoverable amount can be related objectively to
an event occurring after the allowance was recognised. An allowance is reversed only to the extent that
the investment’s carrying amount does not exceed the carrying amount that has been determined if no
allowance had been recognised.
(e) Accounts receivable
Trade and other receivables are stated at cost less allowance for doubtful debts.
(f) Inventories
Inventories are stated at the lower of cost and net realisable value. Cost is determined on a weighted
average basis and includes all costs incurred in bringing the inventories to their present location and
condition. Cost in the case of finished goods and work in progress includes raw materials, direct labour
and attributable manufacturing overheads. Net realisable value is the estimated selling price of inventory
items, less the estimated costs of completion and selling expenses.
The Group apply the perpetual method of accounting for inventory.
(g) Tangible fixed assets
(i) Cost
Tangible fixed assets are stated at cost less accumulated depreciation. The initial cost of a tangible fixed
asset comprises its purchase price, including import duties, non-refundable purchase taxes and any
directly attributable costs of bringing the asset to its working condition and location for its intended use.
Expenditure incurred after tangible fixed assets have been put into operation, such as repairs and
maintenance and overhaul costs, are normally charged to income in the year in which the costs are
incurred. In situations where it can be clearly demonstrated that the expenditure have resulted in an
increase in the future economic benefits expected to be obtained from the use of tangible fixed assets
beyond their originally assessed standard of performance, the expenditure are capitalised as an additional
cost of tangible fixed assets.

Ma San Group Corporation and its subsidiaries
Notes to the interim financial statements for the six-month period ended 30 June 2014
(continued)
Form B 09a – DN/HN
20
(ii) Depreciation
Mining properties
Depreciation of mining properties which directly relate to the mining exploitation activities is computed
on a unit-of-production method based on the reserves as approved by the Ministry of Natural Resources
and Environment in a subsidiary of the Company which conduct mining activity.
Others
Depreciation is computed on a straight-line basis over the estimated useful lives of tangible fixed assets.
The estimated useful lives are as follows:
buildings and structures 4 - 30 years
leasehold improvements 3 - 5 years
office equipment 3 - 10 years
machinery and equipment 3 - 25 years
motor vehicles 3 - 10 years
(h) Finance lease tangible fixed assets
Leases in terms of which the Group assumes substantially all the risks and rewards of ownership are
classified as finance leases. Tangible fixed assets acquired by way of finance leases are stated at an
amount equal to the lower of fair value and the present value of the minimum lease payments at inception
of the lease, less accumulated depreciation.
Depreciation on finance leased assets is computed on a straight-line basis over the estimated useful lives
of items of the leased assets. The estimated useful lives of finance leased assets are consistent with the
useful lives of tangible fixed assets as described in accounting policy 2(g).
(i) Intangible fixed assets
(i) Land use rights
Land use rights comprise:
those granted by the State for which land use payments have been paid;
those acquired in a legitimate transfer; and
rights to use leased land obtained before the effective date of Land Law (2003) for which payments
have been made in advance for more than 5 years and supported by land use rights certificate issued
by competent authority.
Land use rights are stated at cost less accumulated amortisation. The initial cost of land use rights
comprises its purchase price and any directly attributable costs incurred in conjunction with securing the
land use rights. Amortisation is computed on a straight-line basis over their useful lives ranging from 40
to 50 years.

Ma San Group Corporation and its subsidiaries
Notes to the interim financial statements for the six-month period ended 30 June 2014
(continued)
Form B 09a – DN/HN
21
(ii) Software
Cost of acquisition of new software, which is not an integral part of the related hardware, is capitalised
and treated as an intangible asset. Software is amortised on a straight-line basis over 4 and 10 years.
(iii) Brand name
Cost of acquisition of brand name is capitalised and treated as an intangible asset.
The fair value of brand name acquired in a business combination is based on the discounted estimated
royalty payments that have been avoided as a result of the brand name being owned. The fair value of
brand name acquired in a business combination is recognised as an intangible asset and is amortised on a
straight-line basis ranging from 10 to 20 years.
(iv) Customer relationships
Customer relationships that are acquired by the Group on the acquisition of subsidiary are capitalised and
presented as an intangible asset.
The fair value of customer relationships acquired in a business combination is determined using the multi-
period excess earnings method, whereby the subject assets are valued after deducting a fair return on all
other assets that are part of creating the related cash flows. The fair value of customer relationships is
amortised on a straight line basis over their useful lives ranging from 5 to 13 years.
(v) Mineral water resources
Mineral water resources that are acquired by the Group on the acquisition of subsidiary are capitalised
and presented as an intangible asset.
The fair values of mineral water resources acquired in a business combination are determined using either
the direct comparison method or the multi-period excess earnings method. The direct comparison
approach estimates the value of mineral resources by comparing recent asking/transacted price of similar
interests located in a similar area. In the multi-period excess earnings method, subject assets are valued
after deducting a fair return on all other assets that are part of creating the related cash flows. The fair
value of mineral water resources are amortised on a straight line basis over their useful lives ranging from
10 to 19 years.

Ma San Group Corporation and its subsidiaries
Notes to the interim financial statements for the six-month period ended 30 June 2014
(continued)
Form B 09a – DN/HN
22
(j) Construction in progress
Construction in progress represents the cost of construction and machinery which have not been fully
completed or installed and mineral assets under development. No depreciation is provided for
construction in progress during the period of construction and installation.
Mineral assets under development comprise mineral reserve and related development costs acquired in a
business combination and subsequent development expenditure. These assets qualify for capitalisation
when the mineral reserve to which they relate is proven to be commercially and technically viable. They
are initially recognised at their fair values as part of business combination accounting and subsequent
development expenditures are capitalised net of proceeds from the sale of ore extracted during the
development phase. On completion of development, defined as the time when saleable materials begin to
be extracted from the mine, all assets are reclassified to either “machinery or equipment” or “mining
properties” in tangible fixed assets.
(k) Long-term prepayments
(i) Pre-operating expenses
Pre-operating expenses are recorded in the statement of income, except for establishment costs and
expenditures on training, advertising and promotional activities incurred from the incorporation date to
the commercial operation date. These expenses are recognised as long-term prepayments, initially stated
at cost, and are amortised on a straight line basis over 3 years starting from the date of commercial
operation.
(ii) Prepaid land costs
Prepaid land costs comprise prepaid land lease rentals and other costs incurred in conjunction with
securing the use of leased land. These costs are recognised in the statement of income on a straight-line
basis over the term of the lease from 47 to 50 years.
(iii) Mining costs
Exploration, evaluation and mining licence costs
Exploration, evaluation and mining licence costs comprise the costs to obtain mineral exploration rights,
the results of the preliminary exploration activities, direct exploration and evaluation costs, and
expenditure for obtaining the mining licence. Exploration, evaluation and mining licence costs are
capitalised as long as the Company’s right of tenure to the area of interest is current and active and
significant exploration activities in the area of interest are continuing. Exploration, evaluation and mining
licence costs that do not satisfy the above criteria are written off in the period in which they are incurred.

Ma San Group Corporation and its subsidiaries
Notes to the interim financial statements for the six-month period ended 30 June 2014
(continued)
Form B 09a – DN/HN
23
For the purpose of establishing the amount of exploration, evaluation and mining licence costs to be
written off or amortised, exploration, evaluation and mining licence costs are allocated specific area of
interest where they were incurred; otherwise, they are allocated based on the proportion of the area of
interest to the total area of interest.
Exploration, evaluation and mining licence costs are amortised on a straight-line basis over 3 years.
Land compensation cost
Land compensation costs represent the costs of bringing the land to its intended use. These costs are
amortised on a straight-line basis over 3 years.
(iv) Tools and supplies and printing axles
Tools and instruments and printing axles are initially stated at cost and amortised over their useful lives of
1 to 3 years.
Tools and instruments include assets held for use by the Group in the normal course of business whose
costs of individual items are less than VND30 million and therefore not qualified for recognition as fixed
assets under Circular 45/2013/TT-BTC dated 25 April 2013 of the Ministry of Finance which provides
guidance on management, use and depreciation of fixed assets. Cost of tools and instruments are
amortised on a straight-line basis not more than 3 years.
(v) Borrowing fees
Loan origination costs are incurred in conjunction with the arrangement of long-term borrowings and are
amortised on a straight-line basis over the tenure of the borrowings.
(l) Goodwill
Goodwill arises on acquisition of subsidiaries and associates in non-common control acquisition.
Goodwill is measured at cost less accumulated amortisation. Cost of goodwill represents the excess of
the cost of the acquisition over the Group’s interest in the net fair value of the identifiable assets,
liabilities and contingent liabilities of the acquiree. Goodwill is amortised on a straight-line basis over ten
years. In respect of equity accounted investees, the carrying amount of goodwill is included in the
carrying value of the investment.
(m) Trade and other payables
Trade and other payables are stated at their cost.

Ma San Group Corporation and its subsidiaries
Notes to the interim financial statements for the six-month period ended 30 June 2014
(continued)
Form B 09a – DN/HN
24
(n) Provisions
A provision is recognised if, as a result of a past event, the Group has a present legal or constructive
obligation that can be estimated reliably, and it is probable that an outflow of economic benefits will be
required to settle the obligation. Provisions are determined by discounting the expected future cash flows
at a pre-tax rate that reflects current market assessments of the time value of money and the risks specific
to the liability.
Severance allowance
Under the Vietnamese Labour Code, when employees who have worked for 12 months or more (“eligible
employees”) voluntarily terminates their labour contracts, the employer is required to pay the eligible
employees severance allowance calculated based on years of service and employees’ compensation at
termination. Provision for severance allowance has been provided based on employees’ years of service
and their current salary level.
Pursuant to Law on Social Insurance, effective from 1 January 2009, the Group and its employees are
required to contribute to an unemployment insurance fund managed by the Vietnam Social Insurance
Agency. The contribution to be paid by each party is calculated at 1% of the lower of the employees’
basic salary and 20 times the general minimum salary level as specified by the Government from time to
time. With the implementation of the unemployment insurance scheme, the Group is no longer required to
provide severance allowance for the service period after 1 January 2009. However, severance allowance
to be paid to existing eligible employees as of 30 June 2014 will be determined based on the eligible
employees’ years of service as of 31 December 2008 and their average salary for the six-month period
prior to the termination date.

Ma San Group Corporation and its subsidiaries
Notes to the interim financial statements for the six-month period ended 30 June 2014
(continued)
Form B 09a – DN/HN
25
(o) Classification of financial instruments
Solely for the purpose of providing disclosures about the significance of financial instruments to the
Group and the Company’s consolidated and separate interim financial positions and results of operations
and the nature and extent of risk arising from financial instruments, the Group and the Company classify
their financial instruments as follows:
(i) Financial assets
Financial assets at fair value through profit or loss
A financial asset at fair value through profit or loss is a financial asset that meets either of the following
conditions:
It is considered by management as held for trading. A financial asset is considered as held for trading
if:
- it is acquired principally for the purpose of selling it in the near term;
- there is evidence of a recent pattern of short-term profit-taking; or
- a derivative (except for a derivative that is financial guarantee contract or a designated and
effective hedging instrument).
Upon initial recognition, it is designated by the Group and the Company as financial assets at fair
value through profit or loss.
Held-to-maturity investments
Held-to-maturity investments are non-derivative financial assets with fixed or determinable payments and
a fixed maturity that the Group and the Company has the positive intention and ability to hold to maturity,
other than:
those that the Group and the Company upon initial recognition designates as financial assets at fair
value through profit or loss;
those that the Group and the Company designates as available-for-sale; and
those that meet the definition of loans and receivables.
Loans and receivables
Loans and receivables are non-derivative financial assets with fixed or determinable payments that are not
quoted in an active market, other than those:
that the Group and the Company intends to sell immediately or in the near term, which are classified
as held for trading, and those that the entity on initial recognition designates as at fair value through
profit or loss;
that the Group and the Company upon initial recognition designates as available-for-sale; or
for which the Group and the Company may not recover substantially all of its initial investment, other
than because of credit deterioration, which are classified as available-for-sale.

Ma San Group Corporation and its subsidiaries
Notes to the interim financial statements for the six-month period ended 30 June 2014
(continued)
Form B 09a – DN/HN
26
Available-for-sale financial assets
Available-for-sale financial assets are non-derivative financial assets that are designated as available for
sale or that are not classified as:
financial assets at fair value through profit or loss;
held-to-maturity investments; or
loans and receivables.
(ii) Financial liabilities
Financial liabilities at fair value through profit or loss
A financial liability at fair value through profit or loss is a financial liability that meets either of the
following conditions:
It is considered by management as held for trading. A financial liability is considered as held for
trading if:
- it is incurred principally for the purpose of repurchasing it in the near term;
- there is evidence of a recent pattern of short-term profit-taking; or
- a derivative (except for a derivative that is financial guarantee contract or a designated and
effective hedging instrument).
Upon initial recognition, it is designated by the Group and the Company as financial liabilities at fair
value through profit or loss.
Financial liabilities carried at amortised cost
Financial liabilities which are not classified as financial liabilities at fair value through profit or loss are
classified as financial liabilities carried at amortised cost.
Guarantees issued are under the category of financial liabilities at fair value through profit or loss but they
are not recognised in the interim financial statements.
The above described classification of financial instruments is solely for presentation and disclosure
purpose and is not intended to be a description of how the instruments are measured. Accounting policies
for measurement of financial instruments are disclosed in other relevant notes.
(p) Derivative financial instruments
The Group holds derivative financial instruments to hedge its exposures to the risk of raw material price
fluctuation. Derivative financial instruments are recorded in the balance sheet at carrying value on the
date when the derivative contracts are entered into. Realised gains or losses from derivatives are
recognised as financial income or financial expenses in the statement of income.

Ma San Group Corporation and its subsidiaries
Notes to the interim financial statements for the six-month period ended 30 June 2014
(continued)
Form B 09a – DN/HN
27
(q) Taxation
Income tax on the profit or loss for the period comprises current and deferred tax. Income tax is
recognised in the statement of income except to the extent that it relates to items recognised directly to
equity, in which case it is recognised in equity.
Current tax is the expected tax payable on the taxable income for the period, using tax rates enacted or
substantially enacted at the balance sheet date, and any adjustment to tax payable in respect of previous
periods.
Deferred tax is provided using the balance sheet method, providing for temporary differences between the
carrying amounts of assets and liabilities for financial reporting purposes and the amounts used for
taxation purposes. The amount of deferred tax provided is based on the expected manner of realisation or
settlement of the carrying amount of assets and liabilities using tax rates enacted or substantively enacted
at the balance sheet date.
A deferred tax asset is recognised only to the extent that it is probable that future taxable profits will be
available against which the asset can be utilised. Deferred tax assets are reduced to the extent that it is no
longer probable that the related tax benefit will be realised.
(r) Equity
(i) Share capital and capital surplus
Ordinary share capital is classified as equity. The excess of proceeds contributed over the par value of
shares issued is recorded as capital surplus. Incremental costs directly attributable to the issue of ordinary
shares are recognised as a deduction from capital surplus.
(ii) Other capital
Agreements to issue a fixed number of shares in the future are recognised based on their fair values at the
dates of the agreements under other capital if there are no other settlement alternatives.
(iii) Other reserves
Equity movements resulting from common-control business combination, acquisition of/disposal to
minority interests and transactions involving equity instruments are recorded in “Other Reserves” in
equity.
Ma San Group Corporation and its subsidiaries
Notes to the interim financial statements for the six-month period ended 30 June 2014
(continued)
Form B 09a – DN/HN
28
(s) Revenue
(i) Goods sold
Revenue from the sale of goods is recognised in the statement of income when the significant risks and
rewards of ownership have been transferred to the buyer. Revenue of mining assets is initially recognised
at provisional amount by reference to the price of metal concentrate quoted in the London Metal
Exchange. Such provisional revenue is adjusted on monthly basis and finalised when the final
independent analysis of the metal concentrate content is agreed by the Group and its customers.
No revenue is recognised if there are significant uncertainties regarding recovery of the consideration due
or the possible return of goods.
(ii) Services rendered
Revenue from services rendered is recognised in the statement of income in proportion to the stage of
completion of the transaction at the balance sheet date. The stage of completion is assessed by reference
to surveys of work performed as certified by the customers following the contract terms. No revenue is
recognised if there are significant uncertainties regarding recovery of the consideration due.
(t) Dividend income
Dividend income is recognised when the right to receive dividend is established.
(u) Financial income and financial expenses
(i) Financial income
Financial income comprises interest income from deposits and loans, net foreign exchange gains and
realised gains from derivative financial instruments. Interest income is recognised as it accrues in the
statement of income.
(ii) Financial expenses
Financial expenses comprise interest expenses on borrowings, facility fees, net foreign exchange losses
and realised losses from derivative financial instruments. Borrowing costs are recognised as an expense in
the year in which they are incurred, except where the borrowing costs relate to borrowings in respect of
the construction of tangible fixed assets, in which case the borrowing costs incurred during the period of
construction are capitalised as part of the cost of the fixed assets concerned.

Ma San Group Corporation and its subsidiaries
Notes to the interim financial statements for the six-month period ended 30 June 2014
(continued)
Form B 09a – DN/HN
29
(v) Operating lease payments
Payments made under operating leases are recognised in the statement of income on a straight-line basis
over the term of the lease. Lease incentives received are recognised in the statement of income as an
integral part of the total lease expense.
(w) (Loss)/earnings per share
The Group presents basic and diluted (loss)/earnings per share (EPS) data for its ordinary shares. Basic
EPS is calculated by dividing the profit or loss attributable to ordinary shareholders of the Company by
the weighted average number of ordinary shares outstanding during the period. Diluted EPS is
determined by adjusting the profit or loss attributable to ordinary shareholders of the Company and the
weighted average number of ordinary shares outstanding for the effects of all dilutive potential ordinary
shares.
(x) Segment reporting
A segment is a distinguishable component of the Group that is engaged either in providing related
products or services (business segment), or in providing products or services within a particular economic
environment (geographical segment), which is subject to risks and rewards that are different from those of
other segments. The Group’s primary format for segment reporting is based on business segments.
(y) Related parties
Related parties include enterprises and individuals that directly or indirectly through one or more
intermediaries, control, or are controlled by, or are under common control with, the Group, including
holding companies, subsidiaries and fellow subsidiaries. Associates and individuals owning, directly or
indirectly, an interest in the voting power of the Group that gives them significant influence over the
enterprise, key management personnel, including directors and officers of the Group and close members
of the family of these individuals and companies associated with these individuals also constitute related
parties.
In considering each possible related party relationship, attention is directed to the substance of the
relationship, and not merely the legal form.
(z) Share-based payments
Shares issued to employees are recorded at their par value. Redemption of such shares performed by
related companies outside the Group is not recorded by the Group.

Ma San Group Corporation and its subsidiaries
Notes to the interim financial statements for the six-month period ended 30 June 2014
(continued)
Form B 09a – DN/HN
30
4. Segment reporting
The Group has four (4) reportable segments, as described below, which are the Group’s strategic
businesses. The strategic businesses offer different products and services, and are managed separately
because they require different technology and marketing strategies. For each of the strategic businesses,
the Group’s Board of Management reviews internal management reports on a periodic basis.
The Group holds the following business segments through separate subsidiary groups:
Food and beverage
Mining
The Group also invested in and has significant influence in a joint stock bank and a group that operates
feed mills and supply animal nutrition products. The Group’s Board of Management considers Financial
Services and Animal Nutrition as separate business segments.

Ma San Group Corporation and its subsidiaries
Notes to the interim financial statements for the six-month period ended 30 June 2014 (continued) Form B 09a – DN/HN
31
Business segments
Food and beverage Animal nutrition Mining Financial services Total
From
1/1/2014 to
30/6/2014
VND million
From
1/1/2013 to
30/6/2013
VND million
From
1/1/2014 to
30/6/2014
VND million
From
1/1/2013 to
30/6/2013
VND million
From
1/1/2014 to
30/6/2014
VND million
From
1/1/2013 to
30/6/2013
VND million
From
1/1/2014 to
30/6/2014
VND million
From
1/1/2013 to
30/6/2013
VND million
From
1/1/2014 to
30/6/2014
VND million
From
1/1/2013 to
30/6/2013
VND million
Segment revenue 5,693,561 4,270,079 - - 1,145,392 - - - 6,838,953 4,270,079
Segment gross margin 2,489,798 1,618,620 - - 137,920 - - - 2,627,718 1,618,620
Segment results 772,843 739,433 104,928 65,362 (274,015) (27,165) (63,434) (138,315) 540,322 639,315
Unallocated expenses (70,662) (111,962)
Financial income 43,638 26,335
Financial expenses (299,141) (62,338)
Net operating profit (include
share of results of associates) 214,157 491,350
Other income 96,652 123,675
Other expenses (74,500) (33,745)
Income tax expense (280,331) (279,794)
Net (loss)/profit
(44,022) 301,486

Ma San Group Corporation and its subsidiaries
Notes to the interim financial statements for the six-month period ended 30 June 2014 (continued) Form B 09a – DN/HN
32
Food and beverage Animal nutrition Mining Financial services Total
30/6/2014
VND million
31/12/2013
VND million
30/6/2014
VND million
31/12/2013
VND million
30/6/2014
VND million
31/12/2013
VND million
30/6/2014
VND million
31/12/2013
VND million
30/6/2014
VND million
31/12/2013
VND million
Segment assets 10,546,877 12,923,825 2,177,861 2,152,932 21,858,767 20,376,937 8,541,500 8,604,935 43,125,005 44,058,629
Unallocated assets 2,346,166 2,443,512
Total assets
45,471,171 46,502,141
Segment liabilities 8,118,162 7,952,295 - - 8,339,483 7,870,718 - - 16,457,645 15,823,013
Unallocated liabilities 7,233,334 7,417,631
Total liabilities
23,690,979 23,240,644
From
1/1/2014 to
30/6/2014
VND million
From
1/1/2013 to
30/6/2013
VND million
From
1/1/2014 to
30/6/2014
VND million
From
1/1/2013 to
30/6/2013
VND million
From
1/1/2014 to
30/6/2014
VND million
From
1/1/2013 to
30/6/2013
VND million
From
1/1/2014 to
30/6/2014
VND million
From
1/1/2013 to
30/6/2013
VND million
From
1/1/2014 to
30/6/2014
VND million
From
1/1/2013 to
30/6/2013
VND million
Capital expenditure 294,843 175,422 - - 628,518 2,139,441 - - 923,361 2,314,863
Depreciation 130,760 110,632 - - 297,151 17,945 - - 427,911 128,577
Amortisation 166,642 93,320 - - 97,148 7,668 - - 263,790 100,988
Segment assets and liabilities exclude deferred tax assets and liabilities, respectively.
Geographical segments
The Group view themselves as operating in one geographical segment which is in Vietnam since all the Group’s facilities and investments are in Vietnam.

Ma San Group Corporation and its subsidiaries
Notes to the interim financial statements for the six-month period ended 30 June 2014
(continued)
Form B 09a – DN/HN
33
5. Cash and cash equivalents
Group Company
30/6/2014 31/12/2013 30/6/2014 31/12/2013
VND million VND million VND million VND million
Cash on hand 1,796 3,367 169 470
Cash at banks 280,636 200,210 11,386 11,361
Cash equivalents 4,878,298 5,494,986 630,830 1,367,448
5,160,730 5,698,563 642,385 1,379,279
Cash equivalents represented term deposits at banks with original terms to maturity of three months or
less from their transactions dates. The term deposits are denominated in VND and earned interest at rates
ranging from 5.1% to 6% per annum during the period (31/12/2013: 6% to 8% per annum for VND and
0.25% to 0.5% per annum for USD).
Cash equivalents as at 30 June 2014 included VND28,000 million (31/12/2013: VND28,000 million)
pledged with banks as security for loans granted to the Group (see Note 20).
6. Accounts receivable
As at 30 June 2014, certain trade receivables of the Group were pledged with banks as security for loans
granted to subsidiaries (see Note 16).
As at 30 June 2014, prepayments to suppliers amounting to VND121,289 million (31/12/2013:
VND194,417 million) were related to construction in progress.

Ma San Group Corporation and its subsidiaries
Notes to the interim financial statements for the six-month period ended 30 June 2014
(continued)
Form B 09a – DN/HN
34
Other receivables comprised:
Group Company
30/6/2014 31/12/2013 30/6/2014 31/12/2013
VND million VND million VND million VND million
Other short-term receivables
Non-trade receivables from related
parties 142,244 142,244 3,987,758 10,734,312
Accrued interest receivable from deposits 18,518 51,906 2,636 1,250
VAT portion of foreign contractor tax - 11,947 - 6,837
Services receivable 11,547 11,547 11,547 11,547
Others 287,576 47,608 - -
459,885 265,252 4,001,941 10,753,946
Other long-term receivables
Long-term interest receivables 51,865 25,395 - -
Long-term loans receivables 660,587 424,788 - -
Other long-term receivables from
related parties - - 4,265,124 2,875,015
712,452 450,183 4,265,124 2,875,015
Other receivables included the following amounts due from related parties:
Group Company
30/6/2014 31/12/2013 30/6/2014 31/12/2013
VND million VND million VND million VND million
Amounts due from Ma San
Corporation – the parent company
Non-trade – short-term 142,244 142,244 142,244 142,244
Amounts due from other related
parties
Non-trade – short-term 262,861 - 3,845,514 10,592,068
Non-trade – long-term - - 4,265,124 2,875,015
The short-term non-trade amounts of the Group due from Ma San Corporation was unsecured, interest-
free and receivable in accordance with contract terms.
Ma San Group Corporation and its subsidiaries
Notes to the interim financial statements for the six-month period ended 30 June 2014
(continued)
Form B 09a – DN/HN
35
As at 30 June 2014, the short-term non-trade receivables due from other related parties of the Company
comprised of:
(a) VND2,121,922 million relates to an unsecured loan agreement between the Company and a
subsidiary for a principal amount of VND1,962,319 million and interest receivable of
VND159,603 million. The loan is due in 2015 and bears interest at 12% per annum;
(b) Facility fees of 15% per annum amounting to VND956,529 million on unsecured loan facilities
amounting to USD108 million made available to a subsidiary which have not been drawn down.
The facility fees are payable in 2015;
(c) An unsecured funding agreement between the Company and a subsidiary for a principal amount
of VND487,500 million. The loan is interest free and will be repayable on the maturity date in
2015;
(d) VND221,484 million relates to an unsecured loan agreement between the Company and a
subsidiary for a principal amount of VND210,000 million and interest receivable of VND11,484
million. The loan is due in 2015 and bears interest at 10% per annum;
(e) VND23,641 million relates to interest receivable, which is due in 2015, accrued on a
VND620,000 million loan extended to a subsidiary in 2013 which has been repaid in 2013; and
(f) The remaining VND34,438 million of short-term non-trade receivables due from related parties
were unsecured, interest-free and receivable in accordance with contract terms.
The long-term loan receivable of the Group represents an unsecured loan agreement between a subsidiary
of the Company, Orchid Consultant Company Limited (“Orchid”), and LamKa One Member Company
Limited (“LamKa”), a third party which holds 99.99% equity interest in Phu Yen Beer and Beverage
Joint Stock Company (“PYBECO”), for a principal amount of VND660,587 million. The loan bears
interest of 10% to 10.5% per annum and will be repayable on the maturity date in 2016. The Group has
entered into a contract with the debtor to acquire equity interest in PYBECO, subject to the fulfilment of
certain conditions precedent.
At 30 June 2014, the non-trade long-term amounts due from other related parties of the Company were
unsecured, interest free and receivable in accordance with contract terms, and consist of:
(a) Facility fees of 4.25% to 15% per annum amounting to VND1,177,961 million on unsecured loan
facilities amounting to USD110 million and VND2,200 billion made available to a subsidiary,
and VND216,893 million relates to principal drawn down and interest receivables during the
period. The facility fees are payable from 2015 to 2016;
(b) VND299,514 million relates to interest receivable, which are due in 2019, accrued on a
VND2,000 billion loan extended to a subsidiary in 2011 which has been repaid in 2012;
(c) VND2,111,776 million relates to unsecured loan agreements between the Company and its
subsidiary for the principal amount of VND1,985,233 million and interest receivable of
VND126,543 million. The loans are due in 2018 and bear interest rate of 12% per annum;
(d) Unsecured loan agreements between the Company and its subsidiary for the principal amount of
VND447,869 million and interest amount of VND4,444 million. The loans bear interest of
10.5% per annum and will be repayable on the maturity date in 2016 and 2017; and

Ma San Group Corporation and its subsidiaries
Notes to the interim financial statements for the six-month period ended 30 June 2014
(continued)
Form B 09a – DN/HN
36
(e) Unsecured loan agreements between the Company and its subsidiary for the principal amount of
VND6,665 million and interest amount of VND2 million. The loans bear interest of 12% per
annum and will be repayable on the maturity date in 2019.
7. Inventories
Group
30/6/2014 31/12/2013
VND million VND million
Goods in transit 123,023 49,521
Raw materials 660,170 381,333
Tools and supplies 393,023 326,413
Work in progress 92,746 90,522
Finished goods 372,535 223,444
Merchandise inventories 4,085 19,840
1,645,582 1,091,073
Allowance for inventories (13,813) (20,739)
1,631,769 1,070,334
Movements in the allowance for inventories during the period/year were as follows:
Group
From 1/1/2014
to 30/6/2014
From 1/1/2013
to 31/12/2013
VND million VND million
Opening balance 20,739 11,991
Increase in allowance during the period/year 34,608 38,187
Allowance utilised during the period/year (38,045) (24,495)
Written back (3,489) (4,944)
Closing balance 13,813 20,739
As at 30 June 2014, certain inventories of the Group were pledged with banks as security for loans
granted to subsidiaries (see Note 16).

Ma San Group Corporation and its subsidiaries
Notes to the interim financial statements for the six-month period ended 30 June 2014 (continued)
Form B 09a – DN/HN
37
8. Tangible fixed assets
Group
Mining
properties
Buildings
and structures
Leasehold
improvements
Office
equipment
Machinery and
equipment
Motor
vehicles Total
VND million VND million VND million VND million VND million VND million VND million
Cost
Opening balance - 627,019 94,220 71,834 1,605,642 58,899 2,457,614
Additions - 60,923 - 753 2,947 - 64,623
Transfer from construction in progress 6,002,630 2,576,392 - 11,659 7,671,451 1,258 16,263,390
Transfer to short-term prepayments - - - - (479) - (479)
Transfer from/(to) long-term prepayments - 11 - - (3,018) - (3,007)
Disposals - (776) (71,680) (4,439) (4,479) (2,020) (83,394)
Written off - (294) - - (621) - (915)
Reclassifications - (1,854) - 668 1,186 - -
Closing balance 6,002,630 3,261,421 22,540 80,475 9,272,629 58,137 18,697,832
Ma San Group Corporation and its subsidiaries
Notes to the interim financial statements for the six-month period ended 30 June 2014 (continued)
Form B 09a – DN/HN
38
Mining
properties
Buildings
and structures
Leasehold
improvements
Office
equipment
Machinery and
equipment
Motor
vehicles Total
VND million VND million VND million VND million VND million VND million VND million
Accumulated depreciation
Opening balance - 86,063 29,111 32,932 552,702 25,377 726,185
Charge for the period 112,620 74,581 7,643 8,505 222,683 3,786 429,818
Transfer to short-term prepayments - - - - (97) - (97)
Transfer to long-term prepayments - - - - (1,717) - (1,717)
Disposals - (750) (19,809) (2,206) (3,478) (944) (27,187)
Written off - (294) - - (580) - (874)
Reclassifications - 106 - 653 (759) - -
Closing balance 112,620 159,706 16,945 39,884 768,754 28,219 1,126,128
Net book value
Opening balance - 540,956 65,109 38,902 1,052,940 33,522 1,731,429
Closing balance 5,890,010 3,101,715 5,595 40,591 8,503,875 29,918 17,571,704
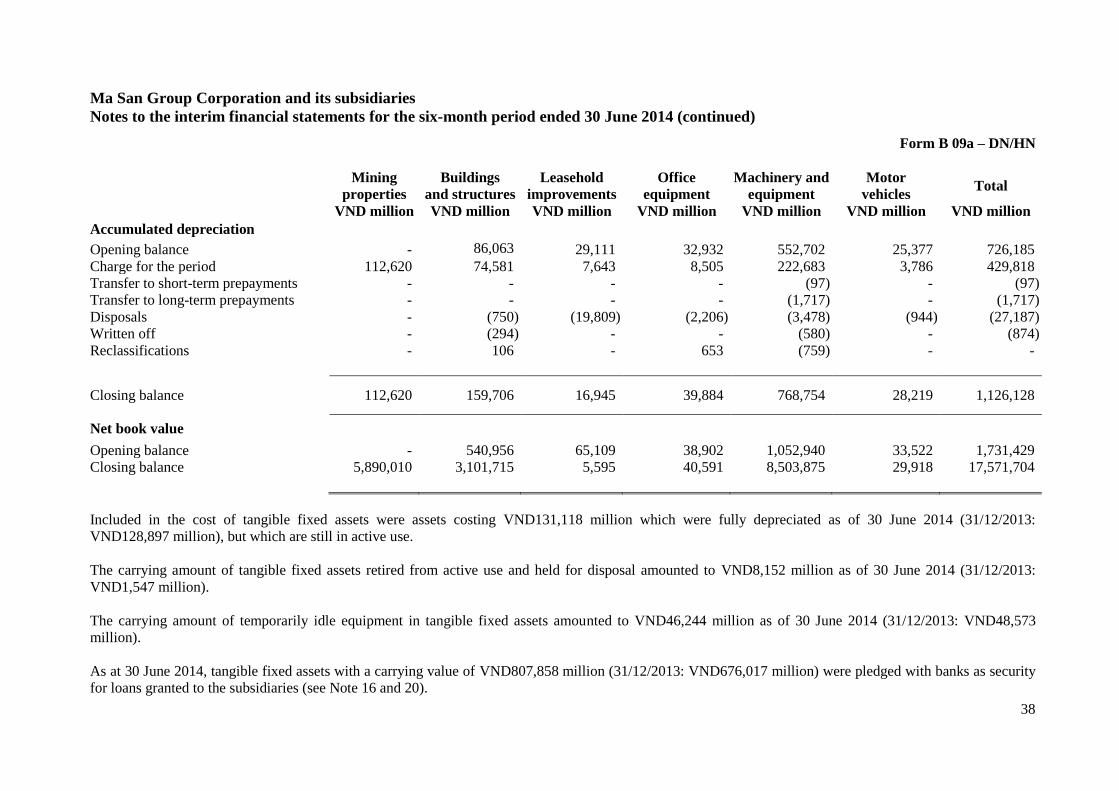
Included in the cost of tangible fixed assets were assets costing VND131,118 million which were fully depreciated as of 30 June 2014 (31/12/2013:
VND128,897 million), but which are still in active use.
The carrying amount of tangible fixed assets retired from active use and held for disposal amounted to VND8,152 million as of 30 June 2014 (31/12/2013:
VND1,547 million).
The carrying amount of temporarily idle equipment in tangible fixed assets amounted to VND46,244 million as of 30 June 2014 (31/12/2013: VND48,573
million).
As at 30 June 2014, tangible fixed assets with a carrying value of VND807,858 million (31/12/2013: VND676,017 million) were pledged with banks as security
for loans granted to the subsidiaries (see Note 16 and 20).

Ma San Group Corporation and its subsidiaries
Notes to the interim financial statements for the six-month period ended 30 June 2014
(continued)
Form B 09a – DN/HN
39
Company:
Leasehold
improvements
Office
equipment Total
VND million VND million VND million
Cost
Opening balance 86,778 5,787 92,565
Transfer from construction in progress - 4,313 4,313
Disposals (71,680) (4,439) (76,119)
Closing balance 15,098 5,661 20,759
Accumulated depreciation
Opening balance 21,979 2,550 24,529
Charge for the period 7,577 1,060 8,637
Disposals (19,809) (2,206) (22,015)
Closing balance 9,747 1,404 11,151
Net book value
Opening balance 64,799 3,237 68,036
Closing balance 5,351 4,257 9,608

Ma San Group Corporation and its subsidiaries
Notes to the interim financial statements for the six-month period ended 30 June 2014
(continued)
Form B 09a – DN/HN
40
9. Finance lease tangible fixed assets
Group
Machinery and
equipment
VND million
Cost
Opening balance/Closing balance 67,300
Accumulated amortisation
Opening balance 8,973
Charge for the period 6,730
Closing balance 15,703
Net book value
Opening balance 58,327
Closing balance 51,597
A subsidiary of the Company leased laboratory equipments for metallurgical assay testing under a finance
lease arrangement (Note 20(d)).

Ma San Group Corporation and its subsidiaries
Notes to the interim financial statements for the six-month period ended 30 June 2014
(continued)
Form B 09a – DN/HN
41
10. Intangible fixed assets
Group
Land use
rights Software
Brand
name
Customer
relationships
Mineral
water
resource Total
VND million VND million VND million VND million VND million VND million
Cost
Opening balance 173,793 39,964 702,866 375,110 305,336 1,597,069
Additions - 458 - - - 458
Transfer from
construction in
progress - 268,003 - - - 268,003
Closing balance 173,793 308,425 702,866 375,110 305,336 1,865,530
Accumulated amortisation
Opening balance 20,194 17,363 125,665 142,788 2,387 308,397
Charge for the period 2,475 10,506 31,159 34,159 8,651 86,950
Closing balance 22,669 27,869 156,824 176,947 11,038 395,347
Net book value
Opening balance 153,599 22,601 577,201 232,322 302,949 1,288,672
Closing balance 151,124 280,556 546,042 198,163 294,298 1,470,183
Included in the cost of intangible fixed assets were assets costing VND8,547 million which were fully
amortised as of 30 June 2014 (31/12/2013: VND7,274 million), but which are still in use.
As at 30 June 2014, land use rights with a carrying value of VND71,525 million (31/12/2013:
VND72,958 million) were pledged with banks as security for loans granted to the subsidiaries (see Note
16).

Ma San Group Corporation and its subsidiaries
Notes to the interim financial statements for the six-month period ended 30 June 2014
(continued)
Form B 09a – DN/HN
42
Company:
Software
VND million
Cost
Opening balance 4,214
Additions 294
Closing balance 4,508
Accumulated amortisation
Opening balance 1,149
Charge for the period 545
Closing balance 1,694
Net book value
Opening balance 3,065
Closing balance 2,814

Ma San Group Corporation and its subsidiaries
Notes to the interim financial statements for the six-month period ended 30 June 2014
(continued)
Form B 09a – DN/HN
43
11. Construction in progress
Group Company
From 1/1/2014
to 30/6/2014
From 1/1/2013
to 31/12/2013
From 1/1/2014
to 30/6/2014
From 1/1/2013
to 31/12/2013
VND million VND million VND million VND million
Opening balance 20,042,933 15,317,924 10,021 71,628
Acquisition on business combination - 1,047 - -
Additions during the period/year 1,259,736 5,094,361 1,093 16,009
Transfer to tangible fixed assets (16,263,390) (340,323) (4,313) (74,844)
Transfer to intangible fixed assets (268,003) (15,097) - (2,161)
Transfer to short-term prepayments (3,285) (5,779) - (570)
Transfer to long-term prepayments (2,361,891) (9,200) (63) (41)
Disposals (4,521) - (4,521) -
Written off (2,217) - (2,217) -
Closing balance 2,399,362 20,042,933 - 10,021
As at 30 June 2014, construction in progress with carrying value of VND18,563 million (31/12/2013:
VND176,983 million) were pledged with banks as security for loans granted to the Group’s subsidiaries
(see Note 16).
During the period, borrowing costs capitalised into construction in progress amounted to VND217,641
million (for the year ended 31 December 2013: VND1,117,239 million).
12. Investments
Group Company
30/6/2014 31/12/2013 30/6/2014 31/12/2013
VND million VND million VND million VND million
Short-term investments
Term deposits in banks 283,300 3,287,000 - -
Long-term investments
Investments in subsidiaries - - 5,077,610 7,422,796
Investment in associates (a) 10,719,361 10,757,867 8,932,424 8,932,424
Other long-term investments (b) 52,600 3,600 - -
10,771,961 10,761,467 14,010,034 16,355,220

Ma San Group Corporation and its subsidiaries
Notes to the interim financial statements for the six-month period ended 30 June 2014
(continued)
Form B 09a – DN/HN
44
Term deposits at banks represented deposits with original terms to maturity of more than three months but
less than twelve months from their transaction dates. The term deposits are denominated in Vietnam
Dong and earned interest at rates ranging from 5.9% to 7.2 % (2013: ranging from 6% to 8%) per annum
during the period.
Details of the Company’s cost of investments in subsidiaries are as follows:
30/6/2014 31/12/2013
VND million VND million
Ma San Consumer Corporation (*) - 3,591,682
MasanConsumerHoldings Company Limited 516,600 516,600
Orchid Consultant Company Limited 441,200 441,200
Ma San Horizon Corporation 2,873,314 2,873,314
Masan Agri Corporation (**) 1,246,496 -
5,077,610 7,422,796
(*) In May 2014, the Company transferred the remaining equity interest of 21.39% of MSC at cost to
MasanConsumerHoldings Company Limited (“MCH”) for a consideration of VND3,591,682 million.
Together with this transaction, the Company assigned all outstanding debts and related interest payables
to MSC to MCH.
(**) From May 2014, Masan Agri became a direct subsidiary of the Company resulting from a restructuring
transaction between the Company and MSC.
The following are the details of the consolidated subsidiaries as at 30 June 2014:
Name Address
MasanConsumerHoldings Company
Limited
Suite 802, 8th Floor, Central Plaza, 17 Le Duan Street, Ben
Nghe Ward, District 1, Ho Chi Minh City, Viet Nam
Orchid Consultant Company Limited Suite 802, 8th Floor, Central Plaza, 17 Le Duan Street, Ben
Nghe Ward, District 1, Ho Chi Minh City, Viet Nam
Ma San Consumer Corporation 12th Floor, Kumho Asiana Plaza Saigon, 39 Le Duan, Ben
Nghe Ward, District 1, Ho Chi Minh City, Viet Nam
Masan Food Company Limited 12th Floor, Kumho Asiana Plaza Saigon, 39 Le Duan, Ben
Nghe Ward, District 1, Ho Chi Minh City, Viet Nam
Ma San Industrial One Member Company
Limited
Lot 6, Tan Dong Hiep A Industrial Park, Di An District, Binh
Duong Province, Vietnam

Ma San Group Corporation and its subsidiaries
Notes to the interim financial statements for the six-month period ended 30 June 2014
(continued)
Form B 09a – DN/HN
45
Name Address
Viet Tien Food Technology One
Member Company Limited
Lot III-10-Industrial Group III, Tan Binh Industrial Park, Tan
Phu District, Ho Chi Minh City, Vietnam
Ma San HD One Member Company
Limited
Lot 22, Dai An Industrial Zone, Hai Duong City, Hai Duong
Province, Vietnam
Ma San PQ Corporation 261 Nguyen Trung Truc, Ward 5, Duong Dong Town, Phu
Quoc District, Kien Giang Province, Vietnam
Minh Viet Packaging One Member
Company Limited
Lot III-12-Industrial Group III, Tan Binh Industrial Park, Tan
Phu District, Ho Chi Minh City, Vietnam
Masan Beverage Company Limited 12th Floor, Kumho Asiana Plaza Saigon – 39 Le Duan, Ben
Nghe Ward, District 1, Ho Chi Minh City, Vietnam
VinaCafe Bien Hoa Joint Stock
Company
Bien Hoa Industrial Zone I, Bien Hoa City, Dong Nai
Province, Vietnam
Vinh Hao Mineral Water Corporation Vinh Son Hamlet, Vinh Hao Commue, Tuy Phong District,
Binh Thuan Province, Vietnam
Kronfa., JSC Km37, National Road 27, Tan Son Town, Ninh Son District,
Ninh Thuan Province, Vietnam
Ma San Horizon Corporation Suite 802, 8th Floor, Central Tower, 17 Le Duan Street, Ben
Nghe Ward, District 1, Ho Chi Minh City, Vietnam
Ma San Resources Corporation Suite 802, 8th Floor, Central Plaza, 17 Le Duan Street, Ben
Nghe Ward, District 1, Ho Chi Minh City, Vietnam
Ma San Thai Nguyen Resources
Company Limited
Suite 802, 8th Floor, Central Plaza, 17 Le Duan Street,
District 1, Ben Nghe Ward, Ho Chi Minh City, Vietnam
Thai Nguyen Trading and Investment
Company Limited
8th Floor, Central Plaza, 17 Le Duan Street, Ben Nghe Ward,
District 1, Ho Chi Minh City, Viet Nam
Nui Phao Mining Company Limited Ha Thuong Commune, Dai Tu District, Thai Nguyen
Province, Vietnam
Masan Agri Corporation 12th Floor, Kumho Asiana Plaza Saigon, 39 Le Duan, Ben
Nghe Ward, District 1, Ho Chi Minh City, Vietnam

Ma San Group Corporation and its subsidiaries
Notes to the interim financial statements for the six-month period ended 30 June 2014
(continued)
Form B 09a – DN/HN
46
(a) Investment in associates
Details of the investments in associates are as follows:
Group Company
30/6/2014 31/12/2013 30/6/2014 31/12/2013
VND million VND million VND million VND million
Vietnam Technological and
Commercial Joint Stock Bank
(“Techcombank”) (*) 8,541,500 8,604,935 8,932,424 8,932,424
Vietnamese French Cattle Feed Joint
Stock Company (“Proconco”) (**) 2,177,861 2,152,932 - -
10,719,361 10,757,867 8,932,424 8,932,424
(*) Investment in Techcombank represented investment in 30.36% (31/12/2013: 30.36%) of the
effective economic interest in Techcombank as of 30 June 2014. The Group’s effective economic
interest includes 15.64% through direct equity interest and 14.72% through 10 year convertible
bonds issued by Techcombank which the Company has agreed to irrevocably and mandatorily
convert during the conversion period of the convertible bonds, subject to regulatory and other
customary approvals.
(**) The Group holds 20.4% (31/12/2013: 15.14%) of the effective equity interest in Proconco as of 30
June 2014, an increase from their holdings of 15.14% as at 31 December 2013, as a result of
changes in the effective economic interest of the Company in Masan Agri, which holds a 40%
direct interest in Proconco.
(b) Other long-term investments
Details of the other long-term investments are as follows:
Group 30/6/2014
VND million
31/12/2013
VND million
Term deposits at banks 49,000 -
Investment in Vinh Hao Seaweed Corporation 3,600 3,600
52,600 3,600
The term deposits are denominated in Vietnam Dong, have original terms to maturity of more than twelve
months from their transaction dates and earned interest at rates ranging from 7.5% to 7.7% per annum
during the period.

Ma San Group Corporation and its subsidiaries
Notes to the interim financial statements for the six-month period ended 30 June 2014
(continued)
Form B 09a – DN/HN
47
(c) Transactions in subsidiaries for the six-month period ended 30 June 2014 – transactions
with minority interests
(i) Transactions with minority interests in MSC
On 25 January 2013, KKR Ma San Aggregator L.P, an affiliate of KKR, subscribed for new shares issued
by MSC. In connection with the issuance, MSC entered into an agreement with the investor to issue
additional shares based on certain valuation conditions derived from 2013 earnings. The additional shares
required to be issued resulted in a decrease in the Group’s equity interests as at 31 December 2013.
However, this requirement was waived by the investor in 2014 resulting in the Group’s equity interests in
MSC increasing back to 77.4%, resulting in the following effects:
VND million
Shares issued not subscribed by the Group -
Net assets increased 512,575
Difference recorded in other reserves 512,575
In April 2014, MCH acquired an additional 0.21% of the equity interests in MSC from minority interests
for VND99,000 million in cash, resulting in the following effects:
VND million
Cost of acquisition (99,000)
Net assets acquired 34,467
Difference recorded in other reserves (64,533)
In April 2014, MCH acquired an additional 0.11% of the equity interests in MSC from minority interests
for VND54,000 million in cash, resulting in the following effects:
VND million
Cost of acquisition (54,000)
Net assets acquired 18,896
Difference recorded in other reserves (35,104)

Ma San Group Corporation and its subsidiaries
Notes to the interim financial statements for the six-month period ended 30 June 2014
(continued)
Form B 09a – DN/HN
48
In May 2014, MSC disposed investment in Masan Agri by doing an upstream transfer of Masan Agri to
the Company, and at the same time, MCH acquired an additional 0.15% of the equity interests in MSC
from minority interests for VND71,496 million in cash, resulting in the following effects:
VND million
Cost of acquisition (71,496)
Net assets acquired 16,813
Shared other reserves from the disposal of investment in Masan Agri 7,135
Difference recorded in other reserves (47,548)
In June 2014, MSC issued shares to certain employees under its employee share based payment plan after
obtaining shareholders’ approval at its Annual General Meeting, resulting in the following effects:
VND million
Shares issued at par not subscribed by the Group 39,905
Net assets diluted (74,833)
Difference recorded in other reserves (34,928)
In June 2014, MCH acquired an additional 0.01% of the equity interests in MSC from minority interests
for VND6,665 million in cash, resulting in the following effects:
VND million
Cost of acquisition (6,665)
Net assets acquired 1,593
Difference recorded in other reserves (5,072)

Ma San Group Corporation and its subsidiaries
Notes to the interim financial statements for the six-month period ended 30 June 2014
(continued)
Form B 09a – DN/HN
49
(ii) Transactions with minority interests in Ma San Resources Corporation
From February 2014 to June 2014, Ma San Resources Corporation (“MR”) issued shares to certain
employees under its employee share based payment plan after obtaining shareholders’ approval at its
Annual General Meeting. The Group effective interest in MR had a decrease from 75.9% to 74.1%
resulting in the following effects:
VND million
Shares issued not subscribed by the Group, net of transaction costs 24,406
Net assets diluted (219,337)
Difference recorded in other reserves (194,931)
Other reserve movements were as follows
VND million
Balance at 1 January 2014 (8,929,770)
Increase in minority interests in MSC 325,390
Decrease in minority interests in MR (194,931)
Balance at 30 June 2014 (8,799,311)

Ma San Group Corporation and its subsidiaries
Notes to the interim financial statements for the six-month period ended 30 June 2014
(continued)
Form B 09a – DN/HN
50
(d) Significant transactions in subsidiaries in 2013
(i) Transactions with minority interests in MSC
On 16 January 2013, the Company acquired an additional 0.45% of the equity interests in MSC, a
subsidiary, from minority interests for VND207,462 million in cash, resulting in the following effects:
VND million
Cost of acquisition (207,462)
Net assets acquired 48,032
Difference recorded in other reserves (159,430)
On 25 January 2013, KKR Ma San Aggregator L.P, an affiliate of KKR, subscribed for new shares issued
by MSC equivalent to 4.35% of its outstanding shares after such issuance for VND2,272,364 million. The
dilution effects of new shares issued by MSC not subscribed by the Group were as follows:
VND million
Shares issued not subscribed by the Group, net of transaction costs 2,204,951
Net assets diluted (866,541)
Difference recorded in other reserves 1,338,410
In connection with the issuance on 25 January 2013, MSC entered into an agreement with the investor to
issue additional shares based on certain valuation conditions derived from 2013 earnings. The additional
shares required to be issued resulted in a decrease in the Group’s equity interests in MSC as follows:
VND million
Shares issued not subscribed by the Group -
Net assets diluted (512,575)
Difference recorded in other reserves (512,575)
However, after 31 December 2013, this requirement was waived by the investor resulting in the Group’s
equity interests in MSC increasing back to 77.4%.
Within 6 years from the closing date, if MSC has not completed an initial public offering that meet certain
pre-agreed requirements, the investor has the option to put all or part of its MSC shares for the
Company’s shares based on a pre-agreed formula.

Ma San Group Corporation and its subsidiaries
Notes to the interim financial statements for the six-month period ended 30 June 2014
(continued)
Form B 09a – DN/HN
51
If the investor does not exercise its put option during the put option period, the Company has the right to
call the MSC shares from the investor for a period of one year after the end of the put option period for
cash or the Company’s share or 50% of each at a pre-agreed valuation to the investor. For the avoidance
of doubt, the call option right will cease to be available if MSC has completed an initial public offering
that meet certain pre-agreed requirements.
On 18 June 2013 MSC issued shares to certain employees under its employee share based payment plan
after obtaining shareholders’ approval at its Annual General Meeting, resulting in the following effects:
VND million
Shares issued at par not subscribed by the Group 19,950
Net assets diluted (44,975)
Difference recorded in other reserves (25,025)
On 26 August 2013, MSC entered into definitive agreements with Vietnam Growth Capital Pte. Ltd.,
(“TPG”) to sell a 49% stake in Masan Agri, a subsidiary of MSC, which holds a 40% direct interest in
Proconco. TPG paid a cash consideration of VND1,061,862 million to acquire the shares from MSC,
resulting in the following effects:
VND million
Cash consideration 1,061,862
Net assets diluted (1,027,277)
Difference recorded in other reserves 34,585
As part of the transaction, the Company granted TPG an option to put its 49% stake in Masan Agri for the
Company’s shares 3 years after the closing of the transaction. The amount of shares to be issued in the
event the put option is exercised will be based on the trading price of the Company’s shares and an
amount of shares that would allow TPG to generate a certain rate of return based on its upfront
investment amount. In addition, TPG granted to the Company a call option on the 49% interest and all
other interests that TPG may further acquire in Masan Agri. The call option can be exercised within 30
days after 3 years from the closing of the initial transaction, for an amount in VND equal to the purchase
price plus an amount that would result in TPG achieving a certain rate of return on the aggregate of the
purchase price and all TPG capital contributions.
Additionally, under certain conditions, the Company has to grant TPG an option to subscribe for shares
equal in value to the greater of 25% of the initial purchase consideration or the fair value of this additional
option based on a price per share of VND90,000.

Ma San Group Corporation and its subsidiaries
Notes to the interim financial statements for the six-month period ended 30 June 2014
(continued)
Form B 09a – DN/HN
52
(ii) Transactions with minority interests in MR
On 25 January 2013, BI Private Equity New Market III K/S (“PENM II”) subscribed for 15,902,430
mandatorily convertible preference shares in MR for a cash consideration of VND520,709 million. The
holders of these mandatorily convertible preference shares shall be paid fixed dividends ranging from 3%
to 10% per annum on the principal amount and the preference shares are mandatorily convertible into
ordinary shares within 4 years. The preference shares also confer onto PENM II the right to receive
dividends declared to ordinary shareholders in proportion to their shareholding and are automatically
converted to ordinary shares in the event of the liquidation of MR.
As part of the agreement, MR is able to exercise its right to convert or force convert the preference shares
to ordinary shares according to the terms of the agreement.
Between April and June 2013, MR issued 99,182,832 ordinary shares at VND18,726 per share to MR’s
existing investors amounting to VND1,857,297 million in multiple tranches. Ma San Horizon
Corporation, a subsidiary of the Company, PENM II and MRC Ltd., an investment entity managed by
Mount Kellett Capital Management LP, subscribed to 89,391,298 ordinary shares, 3,180,486 ordinary
shares and 6,611,048 ordinary shares for cash considerations of VND1,673,941 million, VND59,558
million and VND123,798 million, respectively.
In July 2013, MR issued 29,420,151 ordinary shares at par value of VND10,000 to MRC Ltd. for a cash
consideration of VND294,202 million. The private placement was part of a settlement of an equity
adjustment clause from the 16 March 2011 transaction between MR and MRC Limited.
In August 2013, the Group entered into agreements to amend and exercise the call option and purchased
100% of Dragon Capital’s shares in MR for a consideration of VND899,175 million to be paid in cash.
In December 2013, MR issued shares to certain employees under its employee share based payment plan
after obtaining shareholders’ approval at its Annual General Meeting. During the year, a subsidiary of the
Company, Ma San Horizon Corporation purchased 8,392,857 MR shares issued under the MR employee
share-based payment plan for VND123,342 million.
Overall the Group’s effective interest in MR had a net increase from 65% to 75.9% during the year due to
the transactions above, resulting in the following effects:
VND million
Shares issued not subscribed by the Group, net of transaction costs 865,745
Shares issued and subscribed by the Group, net of transaction costs (1,614,533)
Total net assets transacted 818,972
Difference recorded in other reserves 70,184

Ma San Group Corporation and its subsidiaries
Notes to the interim financial statements for the six-month period ended 30 June 2014
(continued)
Form B 09a – DN/HN
53
(e) Significant transactions in subsidiaries in prior years
(i) Transactions with minority interest in MSC
On 7 April 2011, Kohlberg Kravis Roberts & Co. L.P. (“KKR”) through its company named MC
Holdings II (Cayman) Limited subscribed for new shares issued by MSC equivalent to 10% of its
outstanding shares on that date for VND3,327,552 million.
Within 6 years from the closing date, if MSC has not completed a qualified initial public offering, as
defined in the agreement, the investor has the option to put its MSC shares for the Company’s shares
within a certain period. If the investor does not exercise its put option during the put option period, the
Company can call the MSC shares from the investor for a period of one year after the end of the put
option period for cash or the Company’s shares or 50% of each at a pre-agreed valuation to the investor.
(ii) Transactions with minority interest in MR
On 16 March 2011, Mount Kellett Capital Management LP through its company named MRC Limited
subscribed for new MR shares for a cash consideration of USD100 million, equivalent to VND2,059,120
million. The investor obtained 20% interest in MR. As part of this transaction, the Group invested
VND487,500 million in MR for new ordinary shares. The Company also granted the investor an option to
put its 20% ownership in MR to the Company for the Company’s shares in the event MR has not listed
within 4.5 years after closing of the transaction. The amount of shares to be issued in the event the put
option is exercised will be based on the trading price of the Company’s shares and an amount of shares
that would allow the investor to generate a certain rate of return.

Ma San Group Corporation and its subsidiaries
Notes to the interim financial statements for the six-month period ended 30 June 2014 (continued)
Form B 09a – DN/HN
54
13. Long-term prepayments
Group
Pre-operating
expenses
Prepaid land
costs Mining costs
Printing
axles
Tools and
supplies
Borrowing
fees
Foreign
exchange
difference Others Total
VND million VND million VND million VND million VND million VND million VND million VND million VND million
Opening balance 58,796 2,226 - 1,143 25,980 306,817 - 8,391 403,353
Additions - - - 2,141 4,646 153,000 61,281 3,523 224,591
Transfer from construction in progress - 2,038,509 318,950 - 4,369 - - 63 2,361,891
Transfers from tangible fixed assets - - - - 1,290 - - - 1,290
Reclassify from/(to) short-term prepayment - - - - 1,995 - - (118) 1,877
Amortisation for the period - (32,519) (39,832) (1,570) (12,143) (70,261) (4,045) (2,265) (162,635)
Disposals - - - - (128) - - (74) (202)
Written off - - - - (208) - - - (208)
-
Closing balance 58,796 2,008,216 279,118 1,714 25,801 389,556 57,236 9,520 2,829,957

Ma San Group Corporation and its subsidiaries
Notes to the interim financial statements for the six-month period ended 30 June 2014
(continued)
Form B 09a – DN/HN
55
Company
Borrowing fees Others Total
VND million VND million VND million
Opening balance 52,812 499 53,311
Additions - 38 38
Transfer from construction in progress - 63 63
Disposals - (74) (74)
Amortisation for the period (11,088) (209) (11,297)
Closing balance 41,724 317 42,041
14. Deferred tax assets and liabilities
(i) Recognised deferred tax assets and liabilities
Group
30/6/2014 31/12/2013
VND million VND million
Deferred tax assets:
Accrued sales discount 12,375 8,891
Accrued advertising and promotion expenses 110,530 57,987
Accrued transportation costs 33,952 9,486
Other accruals 18,583 9,755
Unrealised profits on intra-group transactions 21,550 1,453
Total deferred tax assets 196,990 87,572
Deferred tax liabilities:
Construction in progress (738,087) (751,021)
Tangible fixed assets (14,890) (15,954)
Intangible fixed assets (186,665) (194,506)
Accrued interest income (272,335) (190,235)
(1,211,977) (1,151,716)
Total deferred tax liabilities (1,014,987) (1,064,144)

Ma San Group Corporation and its subsidiaries
Notes to the interim financial statements for the six-month period ended 30 June 2014
(continued)
Form B 09a – DN/HN
56
(ii) Movement in temporary differences during the period
Group
31/12/2013
Recognised in
income 30/6/2014
VND million VND million VND million
Accrued sales discount 8,891 3,484 12,375
Accrued advertising and promotion expenses 57,987 52,543 110,530
Accrued transportation costs 9,486 24,466 33,952
Other accruals 9,755 8,828 18,583
Unrealised profit on intra-group transactions 1,453 20,097 21,550
Construction in progress (751,021) 12,934 (738,087)
Tangible fixed assets (15,954) 1,064 (14,890)
Intangible fixed assets (194,506) 7,841 (186,665)
Accrued interest income (190,235) (82,100) (272,335)
(1,064,144) 49,157 (1,014,987)
(iii) Unrecognised deferred tax assets
Deferred tax assets have not been recognised in respect of the following item:
Group Company
30/6/2014 31/12/2013 30/6/2014 31/12/2013
VND million VND million VND million VND million
Other accruals (1,018) 7,373 (1,018) 7,373
Tax losses 531,153 364,880 316,258 320,574
530,135 372,253 315,240 327,947
The deductible temporary differences do not expire under current tax legislation. Tax losses expire in five
years from the year of occurrence. Deferred tax assets have not been recognised in respect of these tax
losses because it is not probable that future taxable profit will be available against which the Group and
the Company can utilise the benefits therefrom.

Ma San Group Corporation and its subsidiaries
Notes to the interim financial statements for the six-month period ended 30 June 2014
(continued)
Form B 09a – DN/HN
57
The tax losses expire in the following years:
Year of expiry Status of tax review Tax losses available
Group Company
VND million VND million
2014 Outstanding - 11,097
2015 Outstanding 4,410 -
2016 Outstanding 239,700 215,633
2017 Outstanding 292,564 216,405
2018 Outstanding 945,284 839,162
2019 Outstanding 1,034,067 155,239
2,516,025 1,437,536
15. Goodwill
Group
30/6/2014
VND million
Cost
Opening balance/Closing balance 520,945
Accumulated amortisation
Opening balance 83,826
Amortisation for the period 26,047
Closing balance 109,873
Net book value
Opening balance 437,119
Closing balance 411,072

Ma San Group Corporation and its subsidiaries
Notes to the interim financial statements for the six-month period ended 30 June 2014
(continued)
Form B 09a – DN/HN
58
16. Short-term borrowings and liabilities
Group Company
30/6/2014
VND
million
31/12/2013
VND
million
30/6/2014
VND
million
31/12/2013
VND
million
Short-term borrowings 1,873,585 4,245,567 - 2,123,200
Current portion of long-term borrowings
(see Note 20) 376,496 2,390,343 188,100 188,100
2,250,081 6,635,910 188,100 2,311,300
Terms and conditions of outstanding short-term borrowings were as follows:
Currency
Annual
interest rate Group Company
30/6/2014 31/12/2013 30/6/2014 31/12/2013
VND million VND million VND million VND million
Short-term borrowings
Secured bank loans VND 3.6%-6% 1,282,696 2,088,838 - -
Secured bank loans USD 4.5%-9.91% - 968,762 - -
Secured bank loans EUR 5% - 1,080 - -
Unsecured bank
loan VND 4%-6.2% 590,889 287,712 - -
Unsecured loan
from a subsidiary VND 15% - - - 2,123,200
Promissory Note VND - 899,175 - -
1,873,585 4,245,567 - 2,123,200
As at 30 June 2014, the bank loans were secured by the following assets of the Group:
(i) Inventories and trade receivables with a carrying amount of USD30.5 million, equivalent to
VND677,498 million (31/12/2013: USD30.5 million, equivalent to VND642,940 million).
(ii) Fixed assets with a carrying value of VND897,946 million (31/12/2013: VND925,958 million).
Part of these fixed assets with carrying value of VND859,879 million (31/12/2013: VND885,745
million) was also used as security for long-term borrowings and accordingly, included in the
amount of security disclosed in Note 20.

Ma San Group Corporation and its subsidiaries
Notes to the interim financial statements for the six-month period ended 30 June 2014
(continued)
Form B 09a – DN/HN
59
17. Taxes payable to State Treasury
Group Company
30/6/2014 31/12/2013 30/6/2014 31/12/2013
VND million VND million VND million VND million
Corporate income tax 251,549 334,003 - -
Value added tax 46,037 91,603 - -
Import-export tax 8,986 3,332 - -
Personal income tax 25,241 27,112 - -
Other taxes 42,342 27,371 19 386
374,155 483,421 19 386
18. Accrued expenses
Group Company
30/6/2014 31/12/2013 30/6/2014 31/12/2013
VND million VND million VND million VND million
Advertising and promotion expenses 508,427 279,737 - -
Accrued interest payable 420,593 423,814 207,093 303,400
Accruals for construction work 181,161 66,563 - -
Transportation expenses 174,049 46,056 - -
Bonus and 13th month salary 135,142 198,675 - -
Withholding tax 120,319 33,729 348 5,251
Accruals for inventories purchased 80,826 16,252 - -
Sales discount 63,451 49,653 - -
Consultant fee 52,010 104,365 23,667 32,476
Others 287,818 359,522 3,178 138,784
2,023,796 1,578,366 234,286 479,911

Ma San Group Corporation and its subsidiaries
Notes to the interim financial statements for the six-month period ended 30 June 2014
(continued)
Form B 09a – DN/HN
60
19. Other payables
Group Company
30/6/2014 31/12/2013 30/6/2014 31/12/2013
VND million VND million VND million VND million
Other short-term payables
Social and health insurance 4,598 155 - 155
Short-term deposits from customers 2,109 1,509 - -
Other short-term payables to a subsidiary - - - 883,284
Purchase of shares in a subsidiary 24,360 43,398 - -
Dividends payable 15,283 902 - -
Others 100,317 55,306 13,079 -
146,667 101,270 13,079 883,439
Other long-term liabilities
Long-term payables (a) 125,164 157,610 20,879 27,076
Other long-term payables to a subsidiary - - - 1,725,360
Obligation to issue shares (b) (Note 24) 60,561 60,561 60,561 60,561
Long-term deposit 22,927 16,517 - -
208,652 234,688 81,440 1,812,997
(a) Long-term payables of the Group and the Company amounting to VND20,879 million (31/12/2013:
VND27,076 million) comprised the gross amount of interest relating to certain instruments described in
Note 24 and were unsecured and payable every six months from the disbursement date of the instruments.
The remaining VND104,285 million (31/12/2013: VND130,534 million) included in long-term payables
of the Group is related to fixed dividends payable for mandatory convertible preference shares issued by a
subsidiary in Note 12(d)(ii).
(b) Obligation to issue shares represents the liability to issue an additional variable number of shares as noted
in Note 24.

Ma San Group Corporation and its subsidiaries
Notes to the interim financial statements for the six-month period ended 30 June 2014
(continued)
Form B 09a – DN/HN
61
20. Long-term borrowings and liabilities
Group Company
30/6/2014
VND million
31/12/2013
VND million
30/6/2014
VND million
31/12/2013
VND million
Long-term borrowings (a) 4,030,615 8,519,274 - 6,286,800
Convertible bonds and loans (b) 988,422 1,176,522 988,422 1,176,522
Secured bonds (c) 11,500,000 4,700,000 4,700,000 4,700,000
Finance lease liabilities (d) 56,412 61,643 - -
16,575,449 14,457,439 5,688,422 12,163,322
Repayable within twelve months
(Note 16) (376,496) (2,390,343) (188,100) (188,100)
Repayable after twelve months 16,198,953 12,067,096 5,500,322 11,975,222

Ma San Group Corporation and its subsidiaries
Notes to the interim financial statements for the six-month period ended 30 June 2014
(continued)
Form B 09a – DN/HN
62
Term and conditions of outstanding long-term borrowings and liabilities are as follows:
Group Company
30/6/2014 31/12/2013 30/6/2014 31/12/2013
Currency
Interest rate
per annum
Year of
maturity
VND
million
VND
million
VND
million
VND
million
a. Long-term borrowings
Secured bank loans VND 9%-10.3% 2014-2017 303,990 2,674,117 - -
Secured bank loans USD
Libor + 3.5% -
Libor + 4.5% 2016 3,726,625 5,845,157 - -
Unsecured loan from
a subsidiary VND 10.5%-13.0% 2016-2018 - - - 6,286,800
4,030,615 8,519,274 - 6,286,800
b. Convertible bonds and loans issued to:
International
Finance
Corporation (b.1) VND 8.0%-20.4% 2014-2016 420,462 608,562 420,462 608,562
Jade Dragon
(Mauritius)
Limited (b.2) USD 2.0%-6.0% 2015 567,960 567,960 567,960 567,960
988,422 1,176,522 988,422 1,176,522
c. Secured bonds VND 11%-15% 2016-2019 11,500,000 4,700,000 4,700,000 4,700,000
d. Finance lease liability VND 15% 2018 56,412 61,643 - -

Ma San Group Corporation and its subsidiaries
Notes to the interim financial statements for the six-month period ended 30 June 2014
(continued)
Form B 09a – DN/HN
63
(a) As at 30 June 2014, long-term borrowings of the Group comprised of:
(i) VND denominated loans amounting to VND303,990 million (31/12/2013: VND390,279
million) secured over fixed assets with a carrying amount of VND859,879 million
(31/12/2013: VND885,745 million) and a certain term deposit at bank with amount of
VND28,000 million (31/12/2013: VND28,000 million).
(ii) USD175 million denominated loan from J.P Morgan amounting to VND3,726,625 million
(31/12/2013: USD175 million, equivalent to VND3,689,000 million), of which USD150
million, equivalent to VND3,194,250 million was insured by Multilateral Investment
Guarantee (“MIGA”), a member of the World Bank (31/12/2013: USD150 million of the
loans, equivalent to VND3,162,000 million). The USD150 million and USD25 million
loans will bear interest at rates of LIBOR + 3.5% and LIBOR + 4.5%, respectively, if they
are guaranteed by the Company, otherwise they will bear interest at rates of LIBOR + 4.5%
and LIBOR + 5.5%, respectively. The outstanding balance at 30 June 2014 is repayable in
one instalment on the termination date. The facility is available for thirty-six months.
At 30 June 2014, Ma San Consumer Corporation’s investments in subsidiaries with carrying
value of VND879,033 million (31/12/2013: VND879,023 million) were pledged as security
for this loan.
(b.1) This loan represented a convertible loan, with a principal of VND420,462 million (31/12/2013:
VND608,562 million), entered into with International Finance Corporation (“IFC”), wherein
VND38,562 million (31/12/2013: VND38,562 million) is convertible to the Company’s shares.
Among others, the agreement provides the following:
(i) Interest is charged at 8% per annum from disbursement date to 15 April 2012 and at 20.4%
per annum from 15 April 2012 to the maturity date for the non-convertible portion. Interest
is charged at 20.4% per annum for the convertible portion from 15 April 2013 to 15 April
2016. The loan matures on 15 April 2016. The Group has accrued interest based on the
nominal interest rates.
(ii) IFC can exercise the option to convert VND190,000 million, at the maximum, of the
principal amount and require the Company to list those converted shares. There are two
available periods for conversion: the first option period is the period commencing the date
falling 12 months after 11 May 2010 and ending on the date falling 36 months after 31 May
2010, the second option period is the period commencing from the date falling thirty six
months after 11 May 2010 and ending on 15 April 2016. Interest shall continue to accrue
and payment premium remains payable on the convertible loan if IFC does not exercise its
conversion option during the first option period. IFC exercised the option to convert
VND151,438 million into 3,521,803 shares issued by the Company in June 2012. At 30
June 2014, VND38,562 million remains available for conversion by IFC into 896,802 shares
up to 15 April 2016. Subsequent to 30 June 2014, IFC exercised the option to convert the
remaining convertible portion of VND38,562 million into 896,802 shares, IFC has fully
converted the convertible portion as described above.
(iii) The loan is guaranteed by MSC and is secured by MCH’s 14,305,183 shares in MSC.

Ma San Group Corporation and its subsidiaries
Notes to the interim financial statements for the six-month period ended 30 June 2014
(continued)
Form B 09a – DN/HN
64
(b.2) This loan from Goldman Sachs Group, Inc. through its company named Jade Dragon (Mauritius)
Limited represents a USD-denominated convertible loan, with a principal amount of USD30
million.
Among others, the agreement provides the following:
(i) The interest rate of this loan has two portions: nominal interest rate and deferred interest
rate. Deferred interest is not payable if the loan is converted. During the period from 15
December 2010 to 14 December 2012 the nominal interest rate and deferred interest rate are
2% per annum and 6% per annum respectively. During the period from 15 December 2012
to 14 December 2013 the nominal interest rate and deferred interest rate are 4% per annum
and 4% per annum respectively. During the period from 15 December 2013 to 14 December
2015 the nominal interest rate and deferred interest rate are 6% per annum and 2% per
annum respectively. The loan matures on 14 December 2015. The nominal interest rate is
compounded daily and the deferred interest rate is compounded annually. The Group has
accrued interest based on the nominal interest rates.
(ii) The loan may be converted into shares by the lender at any time after two years from 15
December 2010 to the loan’s maturity date.
(iii) The conversion price was determined at VND65,000 per share.
(iv) The Group also separately entered into an arrangement with Ma San Corporation which
undertakes the risks and obligations to subscribe to and pay a cash consideration of USD30
million plus the deferred interest for 9,000,000 shares under the convertible loan in the event
that the lender does not exercise the conversion option.
(c) The secured bonds of the Company amounting to VND4,700 billion comprised the following:
(i) VND2,200 billion bonds included VND600 billion of the bonds bear coupon of 3% per
annum plus the amalgated average 12 months deposit rates of selected major banks and
VND1,600 billion of the bonds bear coupon of 1% per annum plus the amalgated average 12
months deposit rates of selected major banks. The coupons are payable every six months
from the disbursement date. These bonds were secured against 22.3 million convertible
bonds issued by Techcombank.
(ii) VND2,500 billion bonds with a maturity of 3 years at an interest rate of 12.0% per annum in
the first year, 12.5% per annum in the second year and 4% per annum plus the amalgated
average 12 months deposit rates of selected major banks in the third year. MCH has pledged
125 million shares in MSC as security for these bonds.
The secured bonds of the Group amounting to VND11,500 billion comprise VND4,700
billion bonds as described above and the remaining VND6,800 billion bonds with a maturity
of 5 years at an interest rate of 11.0% per annum in first 12 months and 4% per annum plus
the amalgated average 12 months deposit rates of selected major banks in the remaining
months. The bonds were secured over certain assets of a subsidiary of the Company.
During the period, the Company and the Group complied with the loan covenants on the above
borrowings.

Ma San Group Corporation and its subsidiaries
Notes to the interim financial statements for the six-month period ended 30 June 2014
(continued)
Form B 09a – DN/HN
65
(d) The future minimum lease payments under non-cancellable finance leases are:
30 June 2014 31 December 2013
Payments Interest Principal Payments Interest Principal
VND million VND million VND million VND million VND million VND million
Within one year 18,798 7,043 11,755 20,364 8,554 11,810
Within two to five years 54,168 9,511 44,657 62,661 12,828 49,833
72,966 16,554 56,412 83,025 21,382 61,643
21. Provision – long-term
Movements of provision for severance allowance during the period/year were as follows:
Group
From
1/1/2014 to
30/6/2014
From
1/1/2013 to
31/12/2013
VND million VND million
Opening balance 3,252 1,381
Provision made during the period/year - 3,252
Provision reversed during the period/year (550) -
Reclassification - (1,381)
Closing balance 2,702 3,252

Ma San Group Corporation and its subsidiaries
Notes to the interim financial statements for the six-month period ended 30 June 2014 (continued) Form B 09a – DN/HN
66
22. Change in owners’ equity
Group
Share
capital
Capital
surplus
Other
Capital
Foreign
exchange
differences
Other
reserves
Retained
profits
Equity
attributable to
equity holders
of Company
Minority
interests Total
VND million VND million VND million VND million VND million VND million VND million VND million VND million
Balance at 1 January 2013 6,872,801 7,999,167 1,721,824 (16,128) (8,619,479) 5,925,652 13,883,837 5,820,548 19,704,385
Issuance of new shares for cash 178,608 - - - - - 178,608 - 178,608
Transactions with minority interest in MSC - - - - 1,153,955 - 1,153,955 863,484 2,017,439
Increase in minority interest from the
acquisition of a subsidiary - - - - - - - 116,139 116,139
Transaction with minority interest in MR - - - - (41,028) - (41,028) 513,708 472,680
Foreign exchange differences in a subsidiary - - - (27,298) - - (27,298) (12,663) (39,961)
Net profit for the period - - - - - 136,477 136,477 165,009 301,486
Dividend paid - - - - - - - (14,926) (14,926)
Transfer to funds - - - - - (15,925) (15,925) (16,949) (32,874)
Balance at 30 June 2013 7,051,409 7,999,167 1,721,824 (43,426) (7,506,552) 6,046,204 15,268,626 7,434,350 22,702,976

Ma San Group Corporation and its subsidiaries
Notes to the interim financial statements for the six-month period ended 30 June 2014 (continued) Form B 09a – DN/HN
67
Share
capital
Capital
surplus
Other
capital
Foreign
exchange
differences
Other
reserves
Retained
profits
Equity
attributable to
equity holders
of Company
Minority
interests Total
VND million VND million VND million VND million VND million VND million VND million VND million VND million
Balance at 1 January 2014 7,349,113 9,601,627 97,703 (43,098) (8,929,770) 6,357,394 14,432,969 8,828,528 23,261,497
Transactions with minority interest in MSC
(Note(12)(c)(i)) - - - - 325,390 - 325,390 (509,457) (184,067)
Transaction with minority interest in MR
(Note 12(c)(ii)) - - - - (194,931) - (194,931) 213,133 18,202
Foreign exchange differences in a subsidiary - - - 46,213 - - 46,213 14,682 60,895
Net (loss)/profit for the period - - - - - (333,330) (333,330) 289,308 (44,022)
Dividend paid - - - - - - - (1,304,830) (1,304,830)
Transfer to funds - - - - - (12,012) (12,012) (15,471) (27,483)
Balance at 30 June 2014 7,349,113 9,601,627 97,703 3,115 (8,799,311) 6,012,052 14,264,299 7,515,893 21,780,192

Ma San Group Corporation and its subsidiaries
Notes to the interim financial statements for the six-month period ended 30 June 2014 (continued) Form B 09a – DN/HN
68
Company
Share capital
Capital
surplus Other capital Other reserves
Retained
profits Total
VND million VND million VND million VND million VND million VND million
Balance at 1 January 2013 6,872,801 7,999,167 1,721,824 (530,235) (242,703) 15,820,854
Issuance of new shares for cash 178,608 - - - - 178,608
Net loss for the period - - - - (179,851) (179,851)
Balance at 30 June 2013 7,051,409 7,999,167 1,721,824 (530,235) (422,554) 15,819,611
Balance at 1 January 2014 7,349,113 9,601,627 97,703 (1,586,675) (1,206,546) 14,255,222
Net profit for the period - - - - 3,015,959 3,015,959
Balance at 30 June 2014 7,349,113 9,601,627 97,703 (1,586,675) 1,809,413 17,271,181

Ma San Group Corporation and its subsidiaries
Notes to the interim financial statements for the six-month period ended 30 June 2014
(continued)
Form B 09a – DN/HN
69
23. Share capital and capital surplus
The Company’s authorised and issued share capital comprises:
30/6/2014 31/12/2013
Number of
shares
VND
million
Number of
shares
VND
million
Authorised share capital 734,911,338 7,349,113 734,911,338 7,349,113
Issued share capital
Ordinary shares 734,911,338 7,349,113 734,911,338 7,349,113
Capital surplus - 9,601,627 - 9,601,627
All ordinary shares have a par value of VND10,000. Each share is entitled to one vote at meetings of the
Company. Shareholders are entitled to receive dividends as declared from time to time. All ordinary
shares are ranked equally with regard to the Company’s residual assets. In respect of shares bought back
by the Company, all rights are suspended until those shares are reissued.
Capital surplus represents the excess of the proceeds on issuance of shares over the par value.
Movements in issued share capital during the period/year were as follows:
From 1/1/2014
to 30/6/2014
From 1/1/2013
to 31/12/2013
Number of
shares
VND
million
Number of
shares
VND
million
Balance at beginning of the
period/year 734,911,338 7,349,113 687,280,123 6,872,801
Issuance of new shares to settle debt
instruments - - 29,770,465 297,704
Issuance of new shares for cash - - 17,860,750 178,608
Balance at the end of the period/year 734,911,338 7,349,113 734,911,338 7,349,113

Ma San Group Corporation and its subsidiaries
Notes to the interim financial statements for the six-month period ended 30 June 2014
(continued)
Form B 09a – DN/HN
70
24. Other capital
Other capital represents the fair value of the Company’s fixed number of shares to be issued at a future
date.
30/6/2014 31/12/2013
Number of
shares
VND
million
Number of
shares
VND
million
Parent company credit support 2,450,353 97,703 2,450,353 97,703
Movements of other capital during the period/year were as follows:
From 1/1/2014
to 30/6/2014
From 1/1/2013
to 31/12/2013
Number of
shares to be
issued
VND
million
Number of
shares to be
issued
VND
Million
Balance at beginning of the
period/year
2,450,353 97,703 31,173,935 1,721,824
Equity instruments repurchased - - (28,723,582) (1,624,121)
Balance at the end of the
period/year
2,450,353 97,703 2,450,353 97,703
In 2012, the Company entered into convertible loan agreements for USD30 million (equivalent to
VND624,840 million) with Mount Kellett Capital Management LP through its company named MRG
Limited for a term of 4 years.
To enhance the creditworthiness of the Company and facilitate the financing transaction, the parent
company also entered into arrangement with the Company and the lender in which the parent company
undertakes the risks and obligations to subscribe to the Conversion Shares and directly pay the principals
and deferred interests to the lender in the event that the lender do not exercise the conversion option. The
parent company did not receive any consideration or other benefits in return for such undertakings on
behalf of the Company.

Ma San Group Corporation and its subsidiaries
Notes to the interim financial statements for the six-month period ended 30 June 2014
(continued)
Form B 09a – DN/HN
71
Among others, the agreements provide the following:
(i) The convertible loan bear semi-annual coupons of 5% per annum in year one, 6% per annum
in years two and three, and 7% per annum for the remaining term of the convertible loan. A
deferred interest which would achieve an effective rate of return of 10% is payable if the
conversion option is not exercised; and
(ii) The shares to be issued on conversion (“Conversion Shares”) shall be determined based on an
initial conversion price of VND85,000 per share and subject to ratchet adjustments and other
terms of the definitive agreement. However, the maximum number of Conversion Shares
will be 9.6 million. The mandatorily issuable minimum number of Conversion Shares is 7.5
million, which is treated as an equity instrument.
In July 2013, the Company repurchased two thirds of the convertible loan of USD30 million subscribed
by MRG Limited, resulting in the maximum number of Conversion Shares being reduced to 3.2 million
and the mandatorily issuable minimum number of Conversion Shares was reduced to 2.5 million as at 31
December 2013.
25. Total revenue
Total revenue represents the gross invoiced value of goods sold and services rendered exclusive of value
added tax.
Net revenue comprised:
Group Company
From 1/1/2014
to 30/6/2014
From 1/1/2013
to 30/6/2013
From 1/1/2014
to 30/6/2014
From 1/1/2013
to 30/6/2013
VND million VND million VND million VND million
Total revenue
Sales of finished goods 6,853,363 4,354,466 - -
Services and other sales 89,873 474 - -
6,943,236 4,354,940 - -
Less sales deductions
Sales discounts (79,787) (70,923) - -
Sales returns (24,496) (13,938) - -
(104,283) (84,861) - -
6,838,953 4,270,079 - -

Ma San Group Corporation and its subsidiaries
Notes to the interim financial statements for the six-month period ended 30 June 2014
(continued)
Form B 09a – DN/HN
72
26. Cost of sales
Group Company
From 1/1/2014
to 30/6/2014
From 1/1/2013
to 30/6/2013
From 1/1/2014
to 30/6/2014
From 1/1/2013
to 30/6/2013
VND million VND million VND million VND million
Total cost of sales
Finished goods sold 4,180,116 2,645,338 - -
Allowance for inventories 31,119 6,121 - -
4,211,235 2,651,459 - -
27. Financial income
Group Company
From 1/1/2014
to 30/6/2014
From 1/1/2013
to 30/6/2013
From 1/1/2014
to 30/6/2014
From 1/1/2013
to 30/6/2013
VND million VND million VND million VND million
Interest income from:
Deposits 215,196 183,080 14,917 12,373
Loans to subsidiaries - - 291,198 52,095
Loan to third party 25,979 5,983 - -
Facility income from subsidiaries - - 176,691 526,203
Foreign exchange gains 13,739 37,569 683 7,980
Dividend income - - 3,169,052 -
Realised gains from derivative
financial instruments 17,283 - - -
Others 270 485 - -
272,467 227,117 3,652,541 598,651

Ma San Group Corporation and its subsidiaries
Notes to the interim financial statements for the six-month period ended 30 June 2014
(continued)
Form B 09a – DN/HN
73
28. Financial expenses
Group Company
From 1/1/2014
to 30/6/2014
From 1/1/2013
to 30/6/2013
From 1/1/2014
to 30/6/2014
From 1/1/2013
to 30/6/2013
VND million VND million VND million VND million
Interest expense on loans from:
Banks 266,343 62,217 - -
Bondholders 473,511 52,978 350,656 216,631
Subsidiary - - 220,087 314,407
Facility fee expenses to a subsidiary - - 2,893 196,300
Foreign exchange losses 59,370 32,481 14 75
Realised losses from derivative
financial instruments 37,016 - - -
Others 45,523 9,245 - 12,035
881,763 156,921 573,650 739,448
29. Other income
Group Company
From 1/1/2014
to 30/6/2014
From 1/1/2013
to 30/6/2013
From 1/1/2014
to 30/6/2014
From 1/1/2013
to 30/6/2013
VND million VND million VND million VND million
Income from scrap sales 14,821 7,887 - -
Proceeds on disposals of fixed assets 61,006 113 59,486 -
Import tax refund 7,845 13,350 - -
Others 12,980 102,325 8,379 72,723
96,652 123,675 67,865 72,723

Ma San Group Corporation and its subsidiaries
Notes to the interim financial statements for the six-month period ended 30 June 2014
(continued)
Form B 09a – DN/HN
74
30. Other expenses
Group Company
From 1/1/2014
to 30/6/2014
From 1/1/2013
to 30/6/2013
From 1/1/2014
to 30/6/2014
From 1/1/2013
to 30/6/2013
VND million VND million VND million VND million
Cost of scrap sales 9,750 6,296 - -
Net book value of fixed assets and
other assets disposed and written off 63,399 313 60,919 -
Others 1,351 27,136 - -
74,500 33,745 60,919 -
31. Share of profit/(loss) in associates
Group
From 1/1/2014
to 30/6/2014
From 1/1/2013
to 30/6/2013
VND million VND million
Share of profit in associates 373,148 263,603
Adjustment arising from purchase price allocation and goodwill
amortisation (331,654) (336,556)
41,494 (72,953)

Ma San Group Corporation and its subsidiaries
Notes to the interim financial statements for the six-month period ended 30 June 2014
(continued)
Form B 09a – DN/HN
75
32. Income tax
(a) Recognised in the statement of income
Group Company
From 1/1/2014
to 30/6/2014
From 1/1/2013
to 30/6/2013
From 1/1/2014
to 30/6/2014
From 1/1/2013
to 30/6/2013
VND million VND million VND million VND million
Current tax expense
Current period 336,703 296,218 - -
Under provision in prior period (7,215) 79 - -
329,488 296,297 - -
Deferred tax expenses
Origination and reversal of
temporary differences (49,157) (16,503) - -
(49,157) (16,503) - -
Income tax expense 280,331 279,794 - -
(b) Reconciliation of effective tax rate
Group From 1/1/2014 to 30/6/2014 From 1/1/2013 to 30/6/2013
% VND million % VND million
Profit before tax 100% 236,309 100% 581,280
Tax at CIT rate applicable 22.00% 51,988 25.00% 145,320
Effect of different tax rates in
subsidiaries 3.17% 7,486 (6.33%) (36,813)
Tax losses utilised (1.57%) (3,699) - -
Effect of intra-group transactions 21.22% 50,146 13.68% 79,544
Non-deductible expenses 5.16% 12,198 2.48% 14,388
Effect of results of associates (3.86%) (9,129) 3.14% 18,238
Deferred tax assets not recognised 92.47% 218,523 10.15% 59,038
Under provision in prior periods (3.05%) (7,215) 0.01% 79
Effect of change in tax rate (16.91%) (39,967) - -
118.63% 280,331 48.13% 279,794

Ma San Group Corporation and its subsidiaries
Notes to the interim financial statements for the six-month period ended 30 June 2014
(continued)
Form B 09a – DN/HN
76
Company
From 1/1/2014 to 30/6/2014 From 1/1/2013 to 30/6/2013
% VND million % VND million
Profit/(loss) before tax 100% 3,015,959 100% (179,851)
Tax at CIT rate applicable 22.00% 663,511 (25.00%) (44,963)
Tax exempt income (23.12%) (697,191) - -
Non-deductible expenses 0.02% 545 0.41% 746
Deferred tax assets not recognised 1.10% 33,135 24.59% 44,217
- - - -
(c) Applicable tax rates
The Company has an obligation to pay the government corporate income tax (“CIT”) at the rate of 25% of
taxable profits.
Pursuant to supplemented Corporate Income Tax law dated 19 June 2013 issued by the National Assembly,
standard corporate income tax rate will be reduced from 25% to 22% from 01 January 2014 and to 20%
from 01 January 2016 onwards.
The Company’s subsidiaries enjoy various tax incentives which provide some subsidiaries with further
tax exemptions and reductions.
(d) Tax contingencies
The taxation laws and their application in Vietnam are subject to interpretation and change over time as
well as from one tax office to another. The final tax position may be subject to review and investigation
by a number of authorities, who are enabled by law to impose severe fines, penalties and interest charges.
These facts may create tax risks in Vietnam that are substantially more significant than in other countries.
Management believes that it has adequately provided for tax liabilities based on its interpretation of tax
legislation, including on transfer pricing requirements and computation of corporate income tax.
However, the relevant authorities may have differing interpretations and the effects could be significant.

Ma San Group Corporation and its subsidiaries
Notes to the interim financial statements for the six-month period ended 30 June 2014
(continued)
Form B 09a – DN/HN
77
33. Significant transactions with related parties
In addition to related party balances and transactions disclosed in other notes to these financial statements,
the Group has the following transactions with related parties during the period:
Group
Related Party Nature of transaction From 1/1/2014
to 30/6/2014
From 1/1/2013
to 30/6/2013
VND million VND million
Other related parties
Vietnamese French
Cattle Feed Joint Stock
Company
Dividend income and received 80,000 -
Key management
personnel
Remuneration to key management
personnel (*)
19,998 24,359
(*) No board fees were paid to Board of Directors members in the six-month periods ended 30/6/2014
and 30/6/2013.

Ma San Group Corporation and its subsidiaries
Notes to the interim financial statements for the six-month period ended 30 June 2014
(continued)
Form B 09a – DN/HN
78
Company
Related Party Nature of transaction From 1/1/2014
to 30/6/2014
From 1/1/2013
to 30/6/2013
VND
million
VND
million
Subsidiaries
Ma San Consumer Loan received from subsidiary 735,000 1,050,000
Corporation Interest expense on long-term loan 220,087 314,407
Facility fee expense 2,893 196,300
Dividend income 1,240,800 -
Loan repaid to a subsidiary through
assignment loans to another subsidiary 7,709,298 -
Loan repaid to a subsidiary through net
off dividend 1,435,702 -
Interest repaid to a subsidiary through
assignments loan to a subsidiary 2,831,626 -
Acquisition of a subsidiary 1,246,496 -
Ma San Resources Corporation Interest income from loan provided to
a subsidiary 32,416 46,113
Facility fee income 72,995 196,300
Loan provided to a subsidiary - 930,000
Loan collected from a subsidiary - 727,000
Nui Phao Mining Company Limited Facility fee income 103,696 329,903
Loan provided to a subsidiary 210,000 -
Interest income from loan provided to
a subsidiary 6,892 -
Orchid Consultant Company
Limited
Interest income from loan provided to
a subsidiary 24,831 5,982
Loan provided to a subsidiary 475,657 214,494
Collected loan from a subsidiary 452,577 -
Ma San Horizon Corporation Interest income from loan provided to
a subsidiary 225,536 -
Loan provided to a subsidiary 932,463 -
Masanconsumerholdings Company
Limited
Interest income from loan provided to
a subsidiary 1,523 -
Dividend income 1,928,252 -
Sale of shares to a subsidiary 3,591,682 -
Loan provided to a subsidiary 160,865 -
Collected loan from a subsidiary 154,200 -
Key management personnel Remuneration to key management
personnel (*) 2,909 4,137

Ma San Group Corporation and its subsidiaries
Notes to the interim financial statements for the six-month period ended 30 June 2014
(continued)
Form B 09a – DN/HN
79
(*) No board fees were paid to Board of Directors members in the six-month periods ended 30/6/2014
and 30/6/2013.
34. (Loss)/earnings per share
(a) Basic (loss)/earnings per share
The calculation of basic (loss)/earnings per share at 30 June 2014 was based on the loss attributable to
ordinary shareholders of VND333,330 million (the profit for six-month period ended 30 June 2013:
VND136,477 million) of the Group and a weighted average number of ordinary shares outstanding of
746,361,691 shares during the period (the six-month period ended 30 June 2013: 730,496,274 shares).
For the purpose of calculating basic (loss)/earnings per shares, shares that are issuable solely after the
passage of time are treated as outstanding shares from the date that the right to the shares comes into
existence calculated as follow:
(i) Net (loss)/profit attributable to ordinary shareholders
From 1/1/2014
to 30/6/2014
From 1/1/2013
to 30/6/2013
VND million VND million
Net (loss)/profit attributable to ordinary shareholders (333,330) 136,477
(ii) Weighted average number of ordinary shares
From 1/1/2014
to 30/6/2014
From 1/1/2013
to 30/6/2013
Issued ordinary shares at the beginning of the period 734,911,338 687,280,123
Effect of shares issued for cash - 3,042,216
Effect of shares issued solely after the passage of time 11,450,353 40,173,935
Weighted average number of ordinary shares at the end of the period 746,361,691 730,496,274

Ma San Group Corporation and its subsidiaries
Notes to the interim financial statements for the six-month period ended 30 June 2014
(continued)
Form B 09a – DN/HN
80
(b) Diluted (loss)/earnings per share
The calculation of diluted (loss)/earnings per share for six-month period ended 30 June 2014 was based
on profit attributable to shareholders and a weighted average number of ordinary shares outstanding after
adjustment for the effect of all dilutive potential ordinary shares.
(i) Net (loss)/profit attributable to ordinary shareholders (diluted)
From 1/1/2014
to 30/6/2014
From 1/1/2013
to 30/6/2013
VND million VND million
Net (loss)/profit attributable to shareholders (333,330) 136,477
Potential dilutive ordinary shares have no income effect on the net loss attributable to shareholders for the
six-month period ended 30 June 2014 (from 1/1/2013 to 30/6/2013: Nil).
(ii) Weighted average number of ordinary shares (diluted)
From 1/1/2014
to 30/6/2014
From 1/1/2013
to 30/6/2013
Weighted average number of ordinary shares (basic) 746,361,691 730,496,274
Effect of potential dilutive share ordinary shares (*) - 103,917,553
Weighted average number of ordinary shares (diluted) 746,361,691 834,413,827
(*) Diluted loss per ordinary share is the same as the basic loss per ordinary share as the effect of anti-dilutive
potential ordinary shares are ignored in calculating diluted loss per ordinary share.

Ma San Group Corporation and its subsidiaries
Notes to the interim financial statements for the six-month period ended 30 June 2014
(continued)
Form B 09a – DN/HN
81
35. Commitments
(a) Capital expenditure
As at 30 June 2014, the following outstanding capital commitments have been approved but not provided
for in the balance sheet:
Group Company
30/6/2014 31/12/2013 30/6/2014 31/12/2013
VND million VND million VND million VND million
Approved and contracted 1,178,634 1,781,158 - -
Approved but not contracted 624,839 486,732 - -
1,803,473 2,267,890 - -
(b) Leases
The future minimum lease payments under non-cancellable operating leases were:
Group Company
30/6/2014 31/12/2013 30/6/2014 31/12/2013
VND million VND million VND million VND million
Within one year 67,663 103,267 12,344 15,795
Within two to five years 43,818 40,098 10,631 -
111,481 143,365 22,975 15,795
(c) Mining right fee
In accordance with the Law on Minerals No. 60/2010/QH12 dated 17 November 2010, entities
conducting mineral mining must pay fees for issuance of mineral mining rights. The Government shall
provide specific regulations on the method for calculating and the rates of fees for issuance of mineral
mining rights.
On 28 November 2013, the Government issued Decree No. 203/2013/ND-CP (“Decree 203”) regulating
method for calculating fees and rates of fees for issuance of mineral mining rights. According to Article 7
of Decree 203, the price for calculating mining right fees should be announced by the Provincial People’s
Committee.
As of 30 June 2014, the Group has not provided for the provision of the mining rights fee on the mineral
reserves due to the existence of uncertainties as to the determination of the price for calculating mining
right fees.

Ma San Group Corporation and its subsidiaries
Notes to the interim financial statements for the six-month period ended 30 June 2014
(continued)
Form B 09a – DN/HN
82
36. Share-based payment plan
A subsidiary of the Company, MSC, has an employee share-based payment plan to award shares on
assessment of performance subsequent to the year ended 31 December 2013 and upon approval of the
shareholders at the Annual General Meeting. In accordance with the Resolution of Shareholders Meeting
on 9 May 2014, the Shareholders resolved to issue 3,990,412 shares for employees and completed this
issuance on 12 June 2014.
Another subsidiary of the Company, MR, has an employee share-based payment plan in place which
periodically rewards high performing employees with shares. A total of 13,392,857 of the subsidiary’s
shares were issued to members of the Management in 2013. The remaining 20,866,429 of the subsidiary’s
shares were issued to members of the Management during the period.
37. Financial risk management
The Board of Management has overall responsibility for establishing, developing and monitoring the
Group’s risk management policies.
(a) Credit risk
Credit risk is the potential financial loss resulting from the failure of a customer or a counterparty to settle
its financial and contractual obligations to the Group and the Company, as and when they fall due, and
arises principally from the Group’s trade and other receivables, deposits in banks, and guarantees issued
to banks for loans granted to entities within the Group.
(i) Exposure to credit risk
The following represents the maximum credit exposure of the Group and the Company:
Group Company Note 30/6/2014 31/12/2013 30/6/2014 31/12/2013
VND million VND million VND million VND million
Cash and cash equivalents (ii) 5,158,934 5,695,196 642,216 1,378,809
Short-term investments (ii) 283,300 3,287,000 - -
Trade and other
receivables (iii) 1,891,017 1,065,085 8,327,703 13,628,961
Other long-term
investments (ii) 49,000 - - -
Guarantees issued (iv) - - 3,726,625 4,848,400
7,382,251 10,047,281 12,696,544 19,856,170
(*) Trade and other receivables comprise of accounts receivable – trade and other receivables – short-term
and long-term.

Ma San Group Corporation and its subsidiaries
Notes to the interim financial statements for the six-month period ended 30 June 2014
(continued)
Form B 09a – DN/HN
83
(ii) Cash and cash equivalents, short-term investments and other long-term investments
Cash and cash equivalents, short-term investments and other long-term investments are placed with
financial institutions which are regulated. Investments and transactions involving derivative financial
instruments are allowed only with counterparties after assessment by management. Management does not
foresee any significant credit risks from these deposits nor expect these financial institutions to default.
(iii) Trade and other receivables
The Group and the Company’s exposure to credit risk in relation to receivables is influenced mainly by
the individual characteristics of each customer or counter party. In response to the risk, the Group
generally transact with customers on cash on delivery terms. For instances where customers are granted
credit terms, management has established a credit policy under which each customer is analysed
individually for creditworthiness before credit terms are offered.
The carrying amount of the trade and other receivables represents the maximum credit exposure.
The Group establishes allowance for doubtful debt that represents its estimate of incurred losses in respect
of trade and other receivables.
Movements of allowance for doubtful debts were as follows:
Group
From
1/1/2014 to
30/6/2014
From
1/1/2013 to
31/12/2013
VND million VND million
Opening balance 1,784 378
Increase in allowance during the period/year 479 1,493
Allowance utilised during the period/year - (57)
Written back (70) (30)
Closing balance 2,193 1,784

Ma San Group Corporation and its subsidiaries
Notes to the interim financial statements for the six-month period ended 30 June 2014 (continued)
Form B 09a – DN/HN
84
The Group and the Company believe that, apart from the amount provided for above, no further allowance for doubtful debts is necessary in respect of the
outstanding trade and other receivables as of 30 June 2014. The ageing analysis of the trade and other receivables is as follows:
Group Company
30/6/2014 31/12/2013 30/6/2014 31/12/2013
VND million VND million VND million VND million VND million VND million VND million VND million
Gross
Impairment
losses
Gross
Impairment
losses
Gross
Impairment
losses
Gross
Impairment
losses
Not past due 1,718,938 - 1,046,732 - 8,327,703 - 13,628,961 -
Past due 0 – 30 days 163,178 - 16,472 - - - - -
Past due 31 – 180 days 9,918 (1,017) 2,715 (834) - - - -
Past due over 180 days 1,176 (1,176) 950 (950) - - - -
1,893,210 (2,193) 1,066,869 (1,784) 8,327,703 - 13,628,961 -
(iv) Guarantees
The Company is also exposed to credit risk in connection with the guarantees it has issued to banks for loans granted to its subsidiary, MSC (see Notes 20(a)(ii)).
The risk represents the loss that would be recognised on default by the lenders. To mitigate this risk, management continually monitors the performance of the
subsidiary.

Ma San Group Corporation and its subsidiaries
Notes to the interim financial statements for the six-month period ended 30 June 2014
(continued)
Form B 09a – DN/HN
85
(b) Liquidity risk
Liquidity risk is the risk that the Group and the Company will encounter difficulty in meeting the obligations
associated with its financial liabilities that are settled by delivering cash or another financial asset.
The Group and the Company’s approach to managing liquidity is to ensure, as far as possible, that it will always
have sufficient liquidity to meet its liabilities when due, under both normal and stressed conditions, without
incurring unacceptable losses or risking damage to the Group’s reputation.
Typically the Group ensures that it has sufficient cash on demand to meet expected operational expenses,
including the servicing of financial obligations; this excludes the potential impact of extreme circumstances that
cannot reasonably be predicted, such as natural disasters.
As at 30 June 2014 and 31 December 2013, the financial liabilities with fixed or determinable payments have
the following contractual maturities including the estimated interest payments:
Group:
Carrying
amount
Contractual
cash flows
Within
1 year 1 – 2 years 2 – 5 years
VND million VND million VND million VND million VND million
30 June 2014
Short-term borrowings 1,873,585 (1,880,561) (1,880,561) - -
Accounts payable – trade 1,204,578 (1,204,578) (1,204,578) - -
Payables to employees 47,938 (47,938) (47,938) - -
Accrued expenses 2,023,796 (2,023,796) (2,023,796) - -
Other payables, excluded
bonus and welfare funds 115,895 (115,895) (115,895) - -
Long-term borrowings and
liabilities, excluded
derivative liabilities 4,235,118 (4,873,849) (541,509) (318,956) (4,013,384)
Long-term bonds/loans
issued 12,488,422 (17,543,247) (1,375,284) (2,100,646) (14,067,317)
21,989,332 (27,689,864) (7,189,561) (2,419,602) (18,080,701)

Ma San Group Corporation and its subsidiaries
Notes to the interim financial statements for the six-month period ended 30 June 2014
(continued)
Form B 09a– DN/HN
86
Carrying
amount
Contractual
cash flows
Within
1 year 1 – 2 years 2 – 5 years
More than
5 years
VND million VND million VND million VND million VND million VND million
31 December 2013
Short-term borrowings 4,245,567 (4,317,179) (4,317,179) - - -
Accounts payable – trade 942,375 (942,375) (942,375) - - -
Payables to employees 20,387 (20,387) (20,387) - - -
Accrued expenses 1,578,366 (1,578,366) (1,578,366) - - -
Other payables, excluded
bonus and welfare funds 83,313 (83,313) (83,313) - - -
Long-term borrowings and
liabilities, excluded derivative
liabilities 8,755,044 (10,561,743) (2,757,462) (1,821,077) (5,414,967) (568,237)
Long-term bonds/loans issued 5,876,522 (7,757,035) (638,651) (1,464,394) (5,653,990) -
21,501,574 (25,260,398) (10,337,733) (3,285,471) (11,068,957) (568,237)
Company:
Carrying
amount
Contractual
cash flows Within 1 year 1 – 2 years 2 – 5 years
VND million VND million VND million VND million VND million
30 June 2014
Accounts payable – trade 276 (276) (276) - -
Accrued expenses 234,286 (234,286) (234,286) - -
Other payables 13,079 (13,079) (13,079) - -
Long-term borrowings and liabilities,
excluded derivative liabilities 20,879 (20,879) (11,772) (9,107) -
Long-term bonds/loans issued 5,688,422 (7,034,199) (701,870) (1,340,179) (4,992,150)
5,956,942 (7,302,719) (961,283) (1,349,286) (4,992,150)
Carrying
amount
Contractual
cash flows
Within
1 year 1 – 2 years 2 – 5 years
VND million VND million VND million VND million VND million
31 December 2013
Short-term borrowings 2,123,200 (2,325,789) (2,325,789) - -
Accounts payable – trade 9,286 (9,286) (9,286) - -
Other payables 883,439 (883,439) (883,439) - -
Accrued expenses 479,911 (479,911) (479,911) - -
Long-term borrowings and liabilities,
excluded derivative liabilities 8,039,236 (11,352,419) (886,865) - (10,465,554)
Long-term bonds/loans issued 5,876,522 (7,757,035) (638,651) (1,464,394) (5,653,990)
17,411,594 (22,807,879) (5,223,941) (1,464,394) (16,119,544)

Ma San Group Corporation and its subsidiaries
Notes to the interim financial statements for the six-month period ended 30 June 2014
(continued)
Form B 09a – DN/HN
87
It is not expected that the cash flows included in the Group and Company’s maturity analysis could occur
significantly earlier, or at significantly different amounts.
(c) Market risk
Market risk is the risk that changes in market prices, such as foreign exchange rates and interest rates will affect
the Group and the Company’s results of operations or the value of its holdings of financial instruments. The
objective of market risk management is to manage and control market risk exposures within acceptable
parameters, while optimising the return.
Currency risk
The Group and the Company is exposed to currency risk on sales, purchases and borrowings that are
denominated in a currency other than the respective functional currencies of Group entities. The currencies in
which these transactions are primarily denominated are the United States dollar (USD), Euro (EUR).
In respect of other monetary assets and liabilities denominated in foreign currencies, the Group’s policy is to
ensure that its net exposure is kept to an acceptable level by buying or selling foreign currencies at spot rates
when necessary to address short-term imbalances.
At 30 June 2014 and 31 December 2013, the Group and the Company had the following net exposed
asset/(liability) positions:
Group Company
USD EUR USD
30 June 2014
Cash and cash equivalents 6,753,834 - 7,969
Trade and other receivables (*) 18,824,713 109,110 45,376,143
Other long-term receivables - - 23,765,672
Trade and other payables (**) (6,760,473) (1,145,731) (297,534)
Long-term borrowings (175,000,000) - -
Other long-term liabilities (3,020,446) - (1,002,466)
(159,202,372) (1,036,621)
67,849,784

Ma San Group Corporation and its subsidiaries
Notes to the interim financial statements for the six-month period ended 30 June 2014
(continued)
Form B 09a – DN/HN
88
Group Company
USD AUD EUR SGD THB USD SGD
31 December 2013
Cash and cash equivalents 27,222,114 - 7,547 - - 66,367,554 621
Trade and other receivables (*) 5,365,602 - - - - - -
Other long-term receivables - - - - - 31,635,370 -
Trade and other payables (**) (7,827,788) (2,203,117) (31) (13,733,722) (13,733,722) (11,464,445) -
Short-term borrowings (45,955,726) - (37,345) - - (41,512,356) -
Long-term borrowings (277,281,875) - - - - - -
Other long-term liabilities (1,300,000) - - - - - -
(299,777,673) (2,203,117) (29,829) (13,733,722) (13,733,722) 45,026,123 621
(*) Trade and other receivables comprise of accounts receivable – trade and other receivables – short-term.
(**) Trade and other payables comprise of accounts payable – trade, payables to employees, accrued expenses
and other short-term payables.
The following were the significant exchange rates applied by the Group and Company:
Group Company
Exchange
rate as at
30/6/2014
Exchange
rate as at
31/12/2013
Exchange
rate as at
30/6/2014
Exchange
rate as at
31/12/2013
VND VND VND VND
USD1 21,295 21,080 21,295 21,080
EUR1 28,882 28,890 - -
Below is an analysis of the possible impact on the profit before tax of the Group and the Company by a
fluctuation of the following currencies after taking into account the current level of exchange rates and the
historical volatility as well as market expectations. This analysis assumes that all other variables, in
particular interest rates, remain constant.
Group Company
Increase/(decrease)
in profit before tax
as at
Increase/(decrease)
in profit before tax
as at
30/6/2014 30/6/2014
VND million VND million
USD (1% strengthening) (33,902) 14,449
EUR (5% strengthening) (1,497) -
(35,399) 14,449

Ma San Group Corporation and its subsidiaries
Notes to the interim financial statements for the six-month period ended 30 June 2014
(continued)
Form B 09a – DN/HN
89
Group Company
Increase/(decrease)
in profit before tax
as at
Increase/(decrease)
in loss before tax
as at
31/12/2013 31/12/2013
VND million VND million
USD (1% strengthening) (63,193) (17,061)
AUD (13% weakening) 5,355 -
EUR (5% strengthening) (43) -
SGD (3% weakening) (1) (1)
THB (5% weakening) 433 -
(57,449) (17,062)
The opposite movement of the currencies would have the equal but opposite effect to the loss and the
profit before tax of the Group and the Company at the reporting date, respectively.
Interest rate risk
The Group and the Company’s exposure to changes in interest rates relates primarily to floating rate
interest-bearing financial assets and financial liabilities. Interest rate risk is managed by the Group and
the Company on an on-going basis with the primary objective of limiting the extent to which interest
expense could be affected by an adverse movement in interest rates.
The Group and the Company does not hedge its exposure to changes in interest rates on interest-bearing
borrowings.

Ma San Group Corporation and its subsidiaries
Notes to the interim financial statements for the six-month period ended 30 June 2014
(continued)
Form B 09a – DN/HN
90
At the reporting date the interest rate profile of the Group and the Company’s interest-bearing
financial instruments was as follows:
Group Company
30/6/2014 31/12/2013 30/6/2014 31/12/2013
VND million VND million VND million VND million
Fixed rate instruments
Cash equivalents (Note 5) 4,878,298 5,494,986 630,830 1,367,448
Short-term investments (Note 12) 283,300 3,287,000 - -
Other long-term investments
(Note 12) 49,000 - - -
Short-term loan receivable from
subsidiaries (Note 6) - - 2,172,319 2,172,319
Long-term loan receivable from a
third party (Note 6) 660,587 424,788 - -
Long-term loan receivable from
subsidiaries (Note 6) - - 2,649,767 1,477,557
Loan from a subsidiary - long-term
(Note 20) - - - (6,286,800)
Short-term borrowings (Note 16) (1,335,277) (1,956,485) - (2,123,200)
Long-term borrowings (Note 20) (988,422) (5,208,722) (988,422) (4,276,522)
3,547,486 2,041,567 4,464,494 (7,669,198)
Variable rate instruments
Cash at banks (Note 5) 280,636 200,210 11,386 11,361
Short-term borrowings (Note 16) (538,308) (1,389,907) - -
Long-term borrowings (Note 20) (15,587,027) (9,248,717) (4,700,000) (1,600,000)
(15,844,699) (10,438,414) (4,688,614) (1,588,639)
Sensitivity analysis for variable rate instruments
An increase of 100 basis points in interest rates would have decreased the profit before tax of the Group
and the Company by VND158,447 million (31/12/2013: VND104,384 million) and VND46,886 million
(31/12/2013: VND15,886 million), respectively.

Ma San Group Corporation and its subsidiaries
Notes to the interim financial statements for the six-month period ended 30 June 2014
(continued)
Form B 09a – DN/HN
91
(d) Estimating the fair value
Basis for determining fair values
Cash and cash equivalents, short-term investments, trade and other receivables and trade and other
payables
The carrying amounts of these financial assets and financial liabilities approximate their respective fair
values due to the short-term maturity of these instruments.
Other long-term investments, other long-term receivables, short-term borrowings, long-term borrowings,
guarantees issued, call and put options
The Company has not determined fair values of these financial instruments for disclosure in the financial
statements because information about their market prices is not available and there is currently no
guidance on determination of fair value using valuation techniques under Vietnamese Accounting
Standards or the Vietnamese Accounting System for Enterprises and the relevant statutory requirements
applicable to financial reporting. There fair values of these financial instruments may differ from their
carrying amounts.
(e) Carrying amount of financial assets and liabilities
The following tables summarise the carrying value of financial assets and liabilities together with carrying
amounts shown on the balance sheet by Circular 210 categories:
Group:
Note
Available
for sale
Fair value
through
profit or loss
Loans and
receivables
Financial
liabilities
carried at
amortised cost
Total
carrying
amount
VND
million
VND
million
VND
million
VND
million
VND
million
30 June 2014
Short-term investment 12 - - 283,300 - 283,300
Other long-term investments 12 3,600 - 49,000 - 52,600
Trade and other receivables (*) 6 - - 1,178,565 - 1,178,565
Other long-term receivables 6 - - 712,452 - 712,452
Cash and cash equivalents 5 - - 5,160,730 - 5,160,730
3,600 - 7,384,047 - 7,387,647
Short-term borrowings 16 - - - (1,873,585) (1,873,585)
Long-term borrowings and
liabilities (***) 19,20 - (60,561) - (4,235,118) (4,295,679)
Convertible bonds/loans 20 - - (12,488,422) (12,488,422)
Trade and other payables (**) - - - (3,422,979) (3,422,979)
- (60,561) - (22,020,104) (22,080,665)

Ma San Group Corporation and its subsidiaries
Notes to the interim financial statements for the six-month period ended 30 June 2014
(continued)
Form B 09a – DN/HN
92
Note Available
for sale
Fair value
through
profit or loss
Loans and
receivables
Financial
liabilities
carried at
amortised cost
Total carrying
amount
VND
million
VND
million
VND
million
VND
million
VND
million
31 December 2013
Short-term investments 12 - - 3,287,000 - 3,287,000
Other long-term investments 12 3,600 - - - 3,600
Trade and other receivables (*) 6 - - 614,902 - 614,902
Other long-term receivables 6 - - 450,183 - 450,183
Cash and cash equivalents 5 - - 5,698,563 - 5,698,563
3,600 - 10,050,648 - 10,054,248
Short-term borrowings 16 - - - (4,245,567) (4,245,567)
Long-term borrowings and
liabilities (***) 19, 20 - (60,561) - (8,755,044) (8,815,605)
Secured bonds/loans 20 - - - (5,876,522) (5,876,522)
Trade and other payables (**) - - - (2,624,441) (2,624,441)
- (60,561) - (21,501,574) (21,562,135)
Company:
Note
Fair value
through
profit or loss
Loans and
receivables
Financial
liabilities
carried at
amortised cost
Total
carrying
amount
VND
million
VND
million
VND
million
VND
million
30 June 2014
Trade and other receivables (*) 6 - 4,062,579 - 4,062,579
Other receivables - long-term 6 - 4,265,124 - 4,265,124
Cash and cash equivalents 5 - 642,385 - 642,385
- 8,970,088 - 8,970,088
Long-term liabilities 19 (60,561) - (20,879) (81,440)
Convertible bonds/loans 20 - - (988,422) (988,422)
Secured bonds 20 - - (4,700,000) (4,700,000)
Trade and other payables (**) - - (247,641) (247,641)
(60,561) - (5,956,942) (6,017,503)

Ma San Group Corporation and its subsidiaries
Notes to the interim financial statements for the six-month period ended 30 June 2014
(continued)
Form B 09a – DN/HN
93
Note
Fair value
through profit
or loss
Loans and
receivables
Financial
liabilities carried
at amortised cost
Total carrying
amount
VND million VND million VND million VND million
31 December 2013
Trade and other receivables (*) 6 - 10,753,946 - 10,753,946
Other receivables - long-term - 2,875,015 - 2,875,015
Cash and cash equivalents 5 - 1,379,279 - 1,379,279
- 15,008,240 - 15,008,240
Long-term borrowings and
liabilities (***) 19,20 (60,561) - (8,039,236) (8,099,797)
Secured bonds/loans 20 - - (5,876,522) (5,876,522)
Short-term borrowings - - (2,123,200) (2,123,200)
Trade and other payables (**) - - (1,372,636) (1,372,636)
(60,561) - (17,411,594) (17,472,155)
(*) Trade and other receivables comprise of accounts receivable – trade and other receivables – short-term.
(**) Trade and other payables comprise of accounts payable – trade, payables to employees, accrued expenses
and other short-term payables.
(***) Long-term borrowings and liabilities comprise of long-term borrowings and other long-term liabilities.
