maba 2007 effects of...
TRANSCRIPT

Effects of Tillage System on NutrientEffects of Tillage System on Nutrient Availability and Management
Prepared for 2007 MABA Convention
by Clain Jones, Extension Soil Fertility Specialistl i j@ d 406 994 60 [email protected]; 406 994-6076

No-till Relevance
50%tal)
Wi t Wh t 2004
35%40%45%
% o
f tot Winter Wheat, 2004
20%25%30%
age
(%
10%15%20%
Acr
ea
0%5%
MT ID CO NE WY UT West USNo
Till
MT ID CO NE WY UT West USN
Data from Conservation Technology Information Center

Conservation Tillage
80%l)
Wi t Wh t 2004
60%
70%
% o
f tot
a Winter Wheat, 2004
40%
50%
eage
(%
20%
30%
40%
ge A
cre
0%
10%
20%
ns. T
illa
0%
MT ID CO NE WY UT West USCon

Questions for youQuestions for you
• Is the majority of all of your clients’Is the majority of all of your clients acreage in no-till? Yes, No?
• Who recommends different N fertilizer• Who recommends different N fertilizer rates for no-till than for till?

Objectives todayObjectives today
• Discuss how tillage reduced tillage or noDiscuss how tillage, reduced tillage, or no till can affect nutrient availability
• Show the effects of tillage system on yield• Show the effects of tillage system on yield and protein responses to nitrogen (N)Sh th ff t f till t• Show the effects of tillage system on vertical ‘stratification’ of phosphorus (P)
d P il bilitand P availability

BasicsBasicsTillage ‘mineralizes’ more N than no-till, g ,
especially in short term.Why?
1. Soil Aeration: bacteria and fungi work faster with oxygen.
2 B k i ti l d ll id2. Breaks up organic particles and colloids: More surface area faster decomposition
3 Temperature slightly higher in spring under3. Temperature slightly higher in spring under tillage, due to less shading/darker surface: Higher temp faster breakdown

Basics continuedBasics, continuedWhen N fertilizer is surface broadcast, ,‘immobilization’ will be higher on no-till than tilled fields.Wh ?Why?Bacteria and fungi use fertilizer N in breaking down stubble at surfacestubble at surface.Solution? Add 10 lb N/ac more for each ½ ton stubble thatAdd 10 lb N/ac more for each ½ ton stubble that remains on surface IF broadcast N (stubble weight = ~1.5 x grain weight).

How does tillage affect O.M. in Montana?Montana?
Tillage effect on soil organic carbon, 2002.Tillage effect on soil organic carbon, 2002.
35
NT CT
a
Measured SOC (0 to 20-cm) Bricklemyer, 200335
NT CT
a
Measured SOC (0 to 20-cm) Bricklemyer, 2003
1 ) 25
30
a aa
ab α = 0.1
1 ) 25
30
a aa
ab α = 0.1
SOC
(t
ha-1
20
25
ba
a
b
bSOC
(t
ha-1
20
25
ba
a
b
b
15
a
b15
a
b
Chester Conrad E Conrad W Ft. Benton St. Johns Simpson
10
Chester Conrad E Conrad W Ft. Benton St. Johns Simpson
10

Organic matter and organic N h i hchanges with management

Is building O M free?Is building O.M. free?
• NO!NO!• It takes N to ‘grow’ O.M.:
T i 1% O M i 6 i h t kTo gain 1% O.M. in upper 6 inches takesabout 1,000 lb N/acre extra N.(assumes 20:1 O.M.:N ratio)
• Need more N in first few years afterNeed more N in first few years after converting to NT to attain same response as CT Less N in long-termas CT. Less N in long term.

N response curves differ between h d l NTshort- and long-term NT
Spring Wheat
From Miller et al. 2004 Why is there a larger difference with protein than with yield at high N?

QUESTIONS SO FAR?QUESTIONS SO FAR?

What if don’t add anymore N to NT h CT fi ld ?than to CT fields?
• Study site: Moccasiny• Researchers: C. Chen and C. Jones• 9-yr NT (NTNT) side by side with 30+ yr CT (CTCT). CT
= one sweep tillage pass per year (Reduced Till?)= one sweep tillage pass per year (Reduced Till?)• Organic Matter in top 6 inches was same after 9-yr.• Part of NT converted to CT in 2005 (NTCT)• Part of CT converted to NT in 2005 (CTNT)• Four systems: Fallow, spring pea (grain), winter pea
(forage) and spring wheat All seeded to winter wheat in(forage), and spring wheat. All seeded to winter wheat in Fall 2005.

Moccasin, 200530
Spring Wheat Grain YieldAfter 9 yr of Identical N Rates
20
25
bu/a
cre)
After 9-yr of Identical N Rates
NTCT
15
in Y
ield
(b NT
10
SW G
rai
0
5
Data from C. Chen
0 20 40 60 80 100 120Nitrogen Units (lb N/acre)
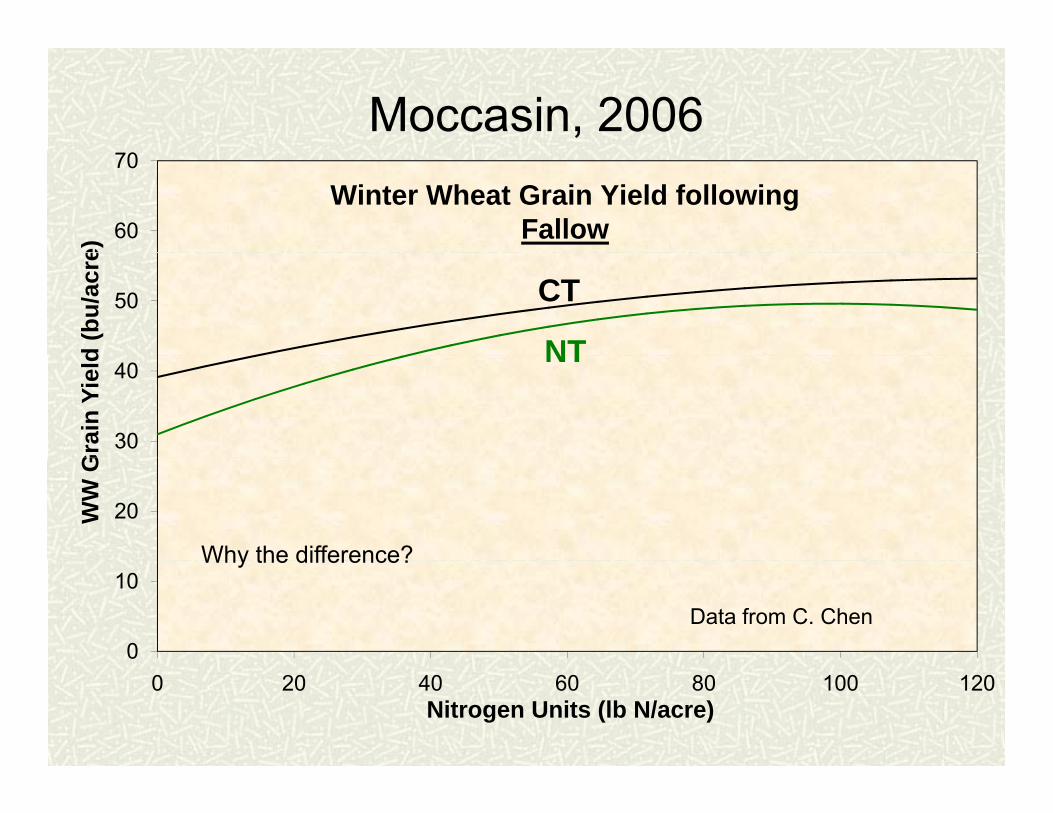
Moccasin, 2006
60
70
e)
Winter Wheat Grain Yield following Fallow
50
d (b
u/ac
re
NT
CT
30
40
Gra
in Y
ield NT
20WW
G
Why the difference?
0
10Data from C. Chen
Why the difference?
0 20 40 60 80 100 120Nitrogen Units (lb N/acre)

Moccasin, 2006
70
80
Winter Wheat Grain Yield following Winter PeaAfter 10-yr of Identical N Rates
50
60
(bu/
acre
) After 10 yr of Identical N Rates
CT
40
50
rain
Yie
ld
NT
20
30
WW
Gr
Is difference due to N??
0
10Data from C. Chen
00 20 40 60 80 100 120
Nitrogen Units (lb N/acre)

Spring Nitrate-N (2006) after 10-yr f Id i l N Rof Identical N Rates
90C Chen
70
80
(lb/
ac)
CTNT
C Chen
Why different?
40
50
60
l Nitr
ate-
N
20
30
40
Sprin
g So
i
0
10
S
Fallow Winter Pea Spring Pea Spring Wheat
Previous Crop

Moccasin, 2006
60
70
Winter Wheat Grain Yield following Spring
50
(bu/
acre
)
CT
30
40
ain
Yiel
d
NT
10
20
WW
Gra
Why the difference?
0
10
0 20 40 60 80 100 120
Data from C. Chen
0 20 40 60 80 100 120Nitrogen Units (lb N/acre)

How do grain yields between NT and CT i th M t t di ?
---
CT compare in other Montana studies?• Bricklemyer and
Miller, 2006• Six sites: NT-CT
small plot study.• Data: From 2nd
f iyear of ongoing study.

Wheat Yields for NT, CT, after Fallow, d C ti C i (2004)and Continuous Cropping (2004)
Wheat Yeild (2004)Average NT yield was 13% higher than average CT yield
50
60
30
40
(bu
ac-1
)
10
20Yiel
d (
0
10
Chester Collins Conrad Great Falls Kremlin PowerSite
No-till Tilled Alternate Yr Continuous

Take home messages on NTake home messages on N
• More N will be needed in first few yearsMore N will be needed in first few years after conversion to NT, ESPECIALLY when surface broadcast (10 lb N/1000 lb (stubble) .
• In “mid-term” (5-10 yr?), similar N will be ( y )needed to maximize yield.
• In long-term, less N will be needed to gmaximize yield and protein, especially when more N was added in short-term.

QUESTIONS SO FAR?QUESTIONS SO FAR?

Basics on PBasics on P• Soil pH controls P availability more than p y
mineralization does. Different than N.• SO, tillage expected to affect P less than N.• Soil pH is generally somewhat less near surface
of no-till field, which should increase P availability near surfaceavailability near surface.
• Some are asking if P is concentrating near P subsurface bands more in NT than in tilled subsu ace ba ds o e t a t edsystems, and if so, how is this affecting P availability?

P Stratification in Alberta (Lupwayi et al., 2006)Olsen P (ppm)
m)
dept
h (c
mS
oil
1998-99 1999-2000

Stratification appears dependent on:
• YearYear
• Crop
• Tillage
Wheat P uptake was not different between tillage p gsystems, suggesting stratification differences did not greatly affect overall P availability.

0
Does P stratification happen here in Montana?
e (in
.)0
2LSD (0.05) = 5.1 ppm
l sur
face
4
J d Ch
rom
soi
l
6
8
Jones and Chen, Moccasin
Dep
th f
10NTNTNTCTCTNTCTCT
Ol P ( )0 2 4 6 8 10 12 14 16 18 20
12CTCT
September 2005Olsen P (ppm) September 2005
Is Olsen P the only P fraction that could be affected by tillage?

Average P concentration in top 6 inches for different P fractions
140
160NTNTNTCTCTNT
ppm
)
100
120CTNTCTCT
otal
P (
60
80
To
20
40
b a a a
Resin-P Bic-P NaOH-P HCl-P Olsen P0
b
Extractions Jones and Chen, Moccasin

But the proof is in the pudding…meaning P f
30
c) 0 lb N/ac
uptake is likely best indicator of P availability
No differences in P uptake between tillage
25
b P 2
O5/a
c 0 lb N/ac80 lb N/aca
ababab
No differences in P uptake between tillage systems when N rate was optimized.
15
20
upak
e (lb bc
cdd d
10
15
ound
P u d
5
Abo
vegr
o
0NTNT NTCT CTNT CTCT
A

Is P being ‘stranded’ near the surface i d d till t ( hin reduced till systems (esp. when
broadcast or seed-applied)?pp )
• Apparently, yes.• Where should P be applied for best uptake?
We regressed P uptake against Olsen P (and resin P) for each 1.2 inch layer to find the depth with the highest correlation and thus possibly b t d th t l Pbest depth to apply P.

Correlation between Olsen P and ‘Resin P’ for h 1 2 i l d P t k (M i )each 1.2 in. layer and P uptake (Moccasin)
T able 2 . C orrela tion coefficien ts betw een O lsen P an d resin -P con cen tra tion s an d abovegroun d P
O lsen P R esin Pr 2-va lue r 2-va lue
D ep th (in .)
up take in in d ividua l soil layers an d averaged soil dep th s.
In d ividua l layers 0 - 1 .2 0 .46** 0 .12N S
1 .2 - 2 .4 0 .46** 0 .17N S2 .4 - 3 .6 0 .57*** 0 .35*3 6 4 8 0 50** 0 13N S
Best correlation at 2.4 to 3.6 in. below
3 .6 - 4 .8 0 .50** 0 .13N S4 .8 - 6 .0 0 .17N S 0 .005N S
A veraged dep th s0 - 2 .4 0 .53** 0 .19N S0 3 6 0 57*** 0 28*
soil surface.
0 - 3 .6 0 .57*** 0 .28*0 - 4 .8 0 .59*** 0 .30*0 - 6 .0 0 .57*** 0 .27*0 - 8 .3 0 .54**0 - 12 .0 0 .42**2 4 4 8 0 60*** 0 32*2 .4 - 4 .8 0 .60*** 0 .32*
respectively
N S , n ot sign ifican t a t P = 0 .05 * , ** , *** sign ifican t a t P< 0 .05 , 0 .01 , 0 .001

0
How much available P is there at 2.4 to 3.6 inches deep?
e (in
.)0
2LSD (0.05) = 5.1 ppm
surfa
ce
4
m s
oil s
6
epth
fro 8
10NTNTNTCT
0 2 4 6 8 10 12 14 16 18 20
De 10
12
CTNTCTCT
Olsen P (ppm)0 2 4 6 8 10 12 14 16 18 20

Take home messages on PTake home messages on P
• There may be some slight, yet not significant,There may be some slight, yet not significant, differences in P availability between tillage systems.
• Olsen P measured to 6 inches appears to be a good estimate of available P, regardless of tillage system.
• P should be placed approximately 3 inches b h il f id di ibeneath soil surface to avoid stranding it near surface, especially in reduced till systems.
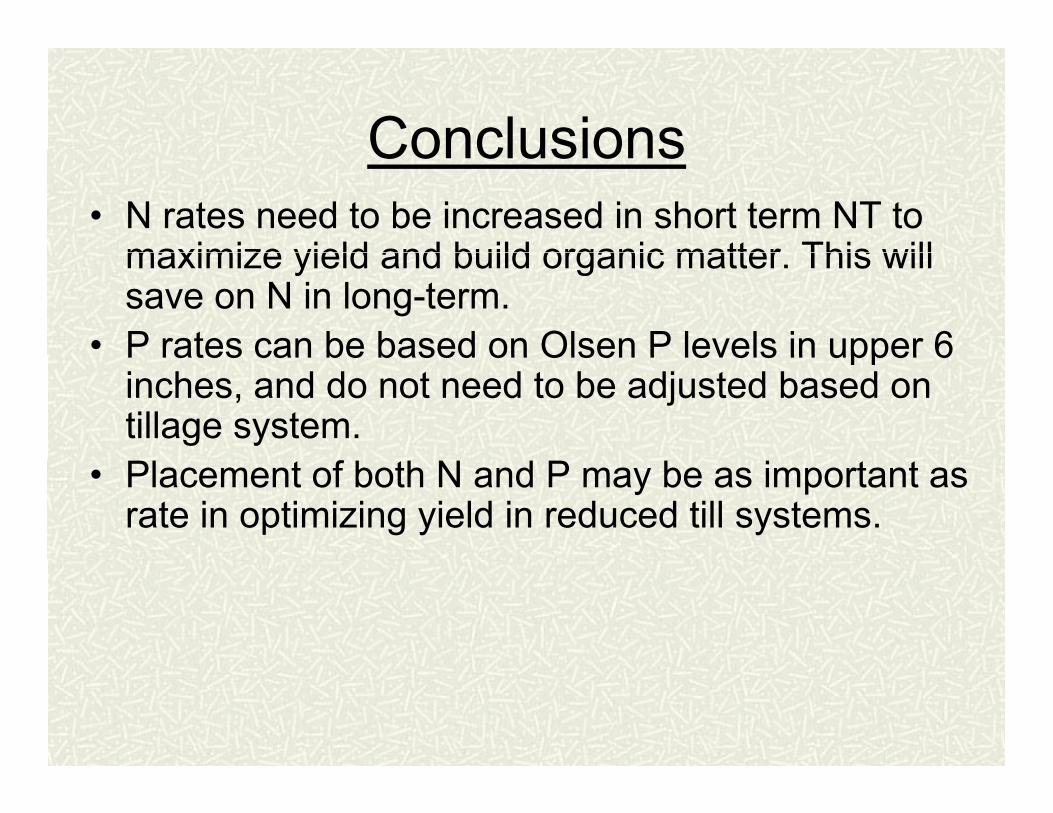
ConclusionsConclusions• N rates need to be increased in short term NT to
maximize yield and build organic matter This willmaximize yield and build organic matter. This will save on N in long-term.
• P rates can be based on Olsen P levels in upper 6P rates can be based on Olsen P levels in upper 6 inches, and do not need to be adjusted based on tillage system.
• Placement of both N and P may be as important as rate in optimizing yield in reduced till systems.

For more informationFor more information
• Soil Fertility Website:Soil Fertility Website: http://landresources.montana.edu/soilfertility
• Cropping Systems Website:• Cropping Systems Website: http://scarab.msu.montana.edu/CropSystems