maca investor report 2019 v10c
TRANSCRIPT


MACA LIMITED
ABN 42 144 745 782
DIRECTORS
Andrew Edwards
Non-Executive Chairman
Chris Tuckwell
Managing Director /
Chief Executive Offi cer
Geoff Baker
Executive Director
Linton Kirk
Non-Executive Director
Robert Ryan
Non-Executive Director
Peter Gilford
Company Secretary
REGISTERED OFFICE
45 Division Street
WELSHPOOL WA 6106
Telephone (08) 6242 2600
Facsimile (08) 6242 2677
SOLICITORS
KD Legal
Corporate and Commercial Law
Level 4/105 St Georges Terrace,
Perth WA 6000
AUDITORS
Moore Stephens
Exchange Tower
2 The Esplanade
PERTH WA 6000
SHARE REGISTRY
Computershare Investor
Services Pty Ltd
11 / 122 St Georges Terrace
PERTH WA 6000
STOCK EXCHANGE LISTINGS
MACA Limited shares are
listed on the Australian
Securities Exchange
ASX CODE : MLD
www.maca.net.au
CORPORATE DIRECTORY
2 MACA LIMITED ANNUAL REPORT 2019

CONTENTS
Corporate Directory 02
About MACA 04
Our Operating Businesses 05
History 06
2018/19 Highlights 07
Areas of Activity 08
Performance 10
Growth Strategy 11
Executive Leadership Team 12
Board of Directors 13
Chairman’s Address 14
Managing Director’s Review of Operations 15
Directors’ Report 22
Remuneration Report – Audited 30
Auditor’s Independence Declaration 44
Corporate Governance Statement Checklist 45
Directors’ Declaration 51
Consolidated Statement of Profit or Lossand Other Comprehensive Income 52
Consolidated Statement of Financial Position 53
Consolidated Statement of Changes in Equity 54
Consolidated Statement of Cash Flows 55
Sections to the Financial Statements 56
Independent Audit Report 96
Shareholder Information 101
3MACA LIMITED ANNUAL REPORT 2019

ABOUT US
MACA is a publicly listed, international
contracting group providing services to the
mining and construction industries.
With our team of highly skilled and dedicated professionals, we provide
tailored solutions to meet the needs of all our clients.
CORE VALUES
PEOPLE FIRST
We care for people
and create a safe and
enjoyable workplace.
We treat them fairly,
with integrity, honesty
and respect.
EXCEED
EXPECTATIONS
We strive to exceed
expectations of our
people, clients and
shareholders.
CONTINUOUS
IMPROVEMENT
We are committed
to being a better
business through
continuous
improvement and
innovation.
COMMUNITY
We show leadership
and take responsibility
for our community.
ACCOUNTABILITY
We are personally
accountable for
delivering on our
commitments.
We do what we say.
OUR PROMISE
We CareWe are FlexibleWe Deliver
OUR VISION
Be Number 1 in what we do.
4 MACA LIMITED ANNUAL REPORT 2019

OUR OPERATING BUSINESSES
MINING AUSTRALIA
• Modern fleet of surface mining equipment
• Load & haul mining contracts
• Bulk overburden removal
• Bulk earthworks
• Modern fleet of proven drilling equipment
• Complete blasting service utilising latest technology
• Experience in gold, iron ore, lithium, coal and others
CIVIL CONSTRUCTION
• Civil bulk earthworks for the private / resource sector including mining, TSF road, borefield and camp infrastructure
• Public works civil capabilities include roads and bridges, bulk earthworks, aerodromes, drainage and marine works
CRUSHING
• Modern fleet of crushing equipment including primary jaw crushers, secondary cone crushers and tertiary cone crushers
• Complete screening services utilising the latest technology with scalping screens, vibrating and fixed screens and single, double and triple deck screens
INFRASTRUCTURE MAINTENANCE
• Infrastructure capabilities and experience includes roads maintenance and construction, parks and gardens, specialist services, verge works, bridge works and safety barriers
• Asset management and maintenance segments in Australia
MINING INTERNATIONAL
• Equipment and operating techniques are used to meet client needs in diverse operating environments
• Load and haul
• Drill and blast
• International experience in gold and copper projects
MACA INTERQUIP
• Delivering small to large scale structural, mechanical and piping projects
• New and refurbished plant and equipment
• Consumables to the mineral processing sector of the resources industry
• Significant number of low to high lift cranes available
5MACA LIMITED ANNUAL REPORT 2019

HISTORY
2003
Awarded first Mining
Services contract
2002
Mining and Civil Australia
was founded in WA
2007
Awarded 1st Crushing and
Screening contract
2010
Listed on ASX as
MACA Limited
2014
Awarded 1st International
Mining contract.
Gold Project, Brazil
2016
Acquisition of Alliance
Contracting, a small Mining
Services business
2018
Awarded Bluff Coal contract
in Queensland
2004
Awarded 1st contract
with Equigold
(now Regis Resources)
2011
Awarded 1st interstate Mining
Services contract in South
Australia
MACA Civil began providing
Civil Infrastructure design &
construction services
2016
Established MACA Infrastructure and
expanded the Civil and Infrastructure
businesses into Victoria through
the acquisition of local contractor
Services South East
Acquired a 60% stake in MACA
Interquip, and expanded Mining
Services offering to include mineral
processing solutions
2019
1,600 + employees, $666m turnover
$2.1b work in hand
6 MACA LIMITED ANNUAL REPORT 2019

2018/19 HIGHLIGHTS
CORPORATE
Significant capital investment in FY19 to support
growth.
Balance sheet remains strong with capacity to
invest in suitable opportunities.
Work in Hand at $2.1 billion.
$30 million returned by Great Panther in the year
– debt now $27 million.
REGIS DUKETON SOUTH
EXTENSION
5 year $590 million
contract extension at Regis
Resource’s Duketon South
project, with an option for
a further 5 year extension.
BLUFF CONTRACT
AWARD
10 year, $700 million
contract at Bluff Coal,
with finance supported
by MACA. Shipping of
first coal in June 2019.
INFRASTRUCTURE
MAINTENANCE
Rollover of current
Infrastructure
Maintenance contracts
in FY19, expected to
continue in FY20, in
both WA and Victoria.
MACA INTERQUIP
Strong year for MACA
Interquip including supporting
Adaman Resources at its
Kirkalocka gold project
with mill installation and
refurbishment and a longer
term maintenance contract.
CRUSHING FOR BHP
Completed construction
and commenced crushing
operations of two
plants at Mining Area C
(12Mtpa) and Eastern
Ridge (5Mtpa) for BHP.
7MACA LIMITED ANNUAL REPORT 2019

B R A Z I L
AREAS OF ACTIVITY
WA Goldfi elds
01 Regis Resources Duketon South Moolart Well
02 Blackham Resources Matilda Gold
03 Gold Road / Gold Fields JV Gruyere Earthworks
04 AngloGold Ashanti Tropicana Joint Venture
WA Murchison
05 Ramelius Resources Mount Magnet
06 Minjar GoldGossan Hill
07 Adaman ResourcesKirkalocka
WA Pilbara
08 Pilbara Minerals Pilgangoora
09 BHPMining Area C Eastern Ridge 10
WAIO
11 Atlas IronMt Dove Crushing
12 MainRoads WAKarratha / Tom Price RdCoongan Gorge
WA Kimberley
13 MainRoads WA Kimberley Road Maintenance
14 Panoramic Resources Savannah
QLD Bowen Basin
15 Carabella Resources Bluff Coal
VIC Regional
16 VicRoads Dual Lane Roundabouts - Shepparton Doncaster Bus Lanes Safe System Infrastructure ProgramO’Herns Road Signalised IntersectionVerge MaintenanceNetwork Maintenance
17 Baw Baw Shire Network Maintenance
Brazil
18 OZ Minerals Antas North
Cambodia (East)
19 Emerald Resources* Okvau Gold
MACA OFFICES
MINING
CIVIL & INFRASTRUCTURE
CRUSHING
INTERQUIP
RIO DE
JANEIRO
18
* MoU entered into as per ASX announcement January 30th 2019
8 MACA LIMITED ANNUAL REPORT 2019

A U S T R A L I A
C A M B O D I A
12
PERTH
MELBOURNE
BRISBANE
19
01 02 03 04
05 06 07
08 09 10 11
13 14
15
1617
9MACA LIMITED ANNUAL REPORT 2019

PERFORMANCE
Chart FY17 FY18 FY19
Revenue ($m) 497.9 562.6 665.7
EBITDA ($m) 98.5 76.6 70.7
NPAT ($m) 32.1 23.6 20.6
Operating Cash Flow ($m) 68.1 8.7 57.5
Work in Hand ($m) 1,130 1,051 2,1101
Dividends (cps) 9.0 6.5 4.5
Net debt / (cash) ($m) (64.2) (63.3) 82.8
Net tangible asset backing (cps) 108.9 118.8 119.5
0
175
350
525
700
REVENUE($m)
0
550
1,100
1,650
2,200
WORK IN HAND($m)
0
25
50
75
100
EBITDA($m)
0.0
2.3
4.5
6.8
9.0
DIVIDENDS (cents per share)
0
8.5
17
25.5
34
NPAT($m)
0
22.5
45
67.5
90
-22.5
-45
-67.5
NET DEBT / (CASH)($m)
0
17.5
35
52.5
70
OPERATING CASH FLOW($m)
100
105
110
115
120
NET TANGIBLE ASSET BACKING(cents per share)
Mil
lio
ns
FY17 FY18 FY19 FY17 FY18 FY19 FY17 FY18 FY19 FY17 FY18 FY19
Mil
lio
ns
Mil
lio
ns
Mil
lio
ns
Mil
lio
ns
Cen
ts
Mil
lio
ns
Cen
ts
FY17 FY18 FY19FY17 FY18 FY19FY17 FY18 FY19
FY17 FY18
FY19
1 As at 31 Aug 2019
10 MACA LIMITED ANNUAL REPORT 2019

MACA has a positive outlook for FY20 and
expects to deliver to shareholders continued
growth in both our revenue and earnings. Our
outlook is underpinned by our strong work in
hand position of $2.1 billion at Aug19 and is
also supported by a general improvement in
the mining and construction industries.
Delivering for our
Existing Clients while
Winning New Work
Diversifying into
New Markets, Services
and Commodities
Supporting our Trading
Divisions to extract the
full value of our assets
Implementing long-term
strategic plans for Human
Resources and Technology
Encourage an
environment of Continuous
Improvement to drive
operational effi ciencies
GROWTH STRATEGY
MACA IS FOCUSED ON THE FOLLOWING STRATEGIC PRIORITIES:
11MACA LIMITED ANNUAL REPORT 2019

David GreigGeneral Manager
Business Development
David was appointed
in 2016 and has over
20 years’ experience
in the international
mining, construction,
maintenance and
infrastructure
industries.
Peter GilfordChief Financial Offi cer
and Company Secretary
Peter has over 20
years’ experience in
the areas of financial
management,
accounting, business
and taxation services
and has been with
MACA for over 12 years.
Front: Chris Tuckwell, Mark Davidovic & Adam Struthers.
Back: David Greig, Peter Gilford, Geoff Baker, Linda Devereux, Tim Gooch & Tony McClure.
Absent: Mitch Wallace
EXECUTIVE LEADERSHIP TEAM
Geoff BakerExecutive Director
Operations
Geoff is a founding
shareholder of MACA
and brings with
him more than 40
years’ experience
in the mining
and construction
industries.
Linda DevereuxGeneral Manager
People & Safety
Linda joined MACA
in 2019 and brings
with her more than
20 years’ experience
in HR and Corporate
Services from a
diverse range of
industries.
Tim GoochGeneral Manager
Mining
Tim joined MACA
in 2011 and is an
experienced mining
engineer with over
30 years domestic and
international mining
experience.
Tony McClureGeneral Manager
Interquip
Tony has held a
number of senior
management roles,
with over 25 years’
experience within the
oil and gas, mining and
construction industries.
Chris TuckwellManaging Director and
Chief Executive Offi cer
Chris has over 35
years’ experience
within the mining
industry, working
with both domestic
and international
mining contractors
and companies.
Mark DavidovicGeneral Manager Civil
and Infrastructure
Mark is a
professional civil
engineer with over
25 years’ experience
in the resources and
public infrastructure
development sectors.
Adam StruthersGeneral Manager
Plant
Adam has over 25
years’ experience
in maintenance and
mining industry
and has held
management roles
with contractors,
hire companies and
OEMs.
Mitch WallaceGeneral Manager
Brazil
Mitch has more
than 20 years’
experience in the
management of fixed
and mobile plant,
and has held senior
management roles
both in Australia and
Internationally.
12 MACA LIMITED ANNUAL REPORT 2019

Andrew Edwards
Non-Executive
Chairman
Andrew is an experienced Non-
Executive director. He is a former
Managing Partner of PwC’s Perth
Office, and a former president of the
Western Australian division of the
Securities Institute of Australia (now
the Financial Services Institute of
Australasia).
Linton Kirk
Independent Non-Executive
Director
Linton has over 40 years’ experience
in mining and earthmoving, covering
both open pit and underground
operations in several commodities.
He has held technical, operational
and management positions in a
variety of mining and mining service
companies throughout the world prior
to becoming a consultant in 1997.
Chris Tuckwell
Managing Director and
Chief Executive Offi cer
Chris is a qualified construction
engineer who has spent his entire
35 year career within the mining
industry, working with both domestic
and international mining contractors
and companies.
Robert Ryan
Independent Non-Executive
Director
Robert brings over 40 years’
experience in civil engineering and
construction to the Board. For 10
years he worked at a senior level
for a significant public company
working in engineering services.
Geoff Baker
Executive Director,
Operations
Geoff is a founding shareholder
of MACA. Geoff is responsible for
the operations including planning,
operating strategy, capital
expenditure and delivery of safety and
financial outcomes on all projects.
BOARD OF DIRECTORS
13MACA LIMITED ANNUAL REPORT 2019

Dear Shareholders,
I am pleased to report that in 2019 MACA achieved record high levels of
revenue and work in hand, alongside a continuing focus to diversify the
business. The year has also presented challenges, which we continue to
address in order to best position MACA for future years.
Our financial results were in line with guidance, with revenue
of $666m, EBITDA of $70.7m and NPAT attributable to
members of $20.6m. Our NPAT was down 13% on the prior
year, following a subdued financial performance in the first
half due to margin pressure in our core mining division.
A tightening labour market impacted the availability and
deployment of our equipment, which in turn adversely
affected site performance across our projects. This has been
addressed through significant investment in newer and larger
equipment, giving rise to improved margins in the second half
of the financial year and the benefits of this investment are
expected to extend further in coming years.
Our Australian mining operations have continued to
grow, with the renewal of our long-term contract with
Regis Resources at the Duketon South operations, the
commencement of the Bluff Coal project for Carabella
Resources in Queensland, and the award of three crushing
contracts by BHP Iron Ore. MACA has continued to provide
financial support to our mining clients where this aligns with
our commercial objectives. Nevertheless, market concerns
with the associated risks have weighed on MACA’s share
price over the past year. We look forward to maintaining our
positive working relationships with these clients and are
confident of the continued realisation of these investments in
FY20.
The performance of our civil and infrastructure operations in
FY19 was disappointing with cost overruns on some key civil
projects. We expect these businesses to improve in 2020 with
increased scale and a tightening of our project delivery and
financial monitoring processes.
Our MACA Interquip business has had a strong year, including
supporting Adaman Resources at its Kirkalocka gold project
and supporting the construction of our BHP crushing plants.
Positive market conditions exist across the mining and civil
construction sectors, and the company is actively pursuing
many mining, civil and infrastructure opportunities. As
previously announced, MACA is expecting revenue to increase
to $720m in FY20, of which over $500m relates to Mining and
Crushing.
Your Directors have declared a final dividend of 2.5 cents
per share, taking the total dividends for the year to 4.5 cents
fully franked. This dividend has been set having regard to
the recent level of earnings and the desire to retain sufficient
funds for equipment and working capital investments
required to support future projects.
MACA remains focused on productivity and other initiatives to
improve and protect margins in our drive to bolster earnings
sustainability. Importantly, the Company’s strong balance
sheet provides MACA with the capacity to pursue the right
opportunities to achieve its long-term growth strategy.
On behalf of the Board, I would like to take this opportunity
to thank our shareholders, as well as all of MACA’s other
stakeholders, for their continued support, and in particular
our dedicated people for their commitment and contribution
during the year.
Andrew Edwards
Chairman
CHAIRMAN’S ADDRESSCHAIRMAN ANDREW EDWARDS
14 MACA LIMITED ANNUAL REPORT 2019

REVIEW OF OPERATIONSMANAGING DIRECTOR
This report marks the ninth year since listing and seventeenth year
since incorporation of MACA. I am pleased to present a review of the
Company’s performance to you the shareholders of MACA Limited.
This year has seen MACA invest the
most amount of capital in its history.
This capital has been deployed to both
new projects and existing extended
projects, and is underpinned by a
record orderbook of $2.1b, providing a
solid platform of work going forward.
The significant capital investment into
the business has been achieved with
a prudent and modest level of gearing
supported by a strong focus on cash
management.
Against that background the Group’s
core mining services business has seen
improved performance half on half. The
other parts of our business are maturing
and beginning to generate improved
financial performance in line with our
corporate group strategy.
MINING - AUSTRALIA
Operational activities have continued
to grow in gold, with MACA renewing
its long-term contract at the beginning
of the year with Regis Resources at the
Duketon South operations for another
5 year period. Our current operations
with Ramelius Resources at Mount
Magnet, Blackham Resources at the
Matilda project and for Pilbara Minerals
at the Pilgangoora project continued
throughout the full year. In the first half
MACA commenced in a new geographic
area and commodity when commencing
the Bluff Coal project for Carabella
Resources in the Blackwater region of
Queensland. This is a significant project
for MACA both in terms of scale and
tenure (a 10 year life of mine contract)
which is now beginning to generate
reasonable returns.
CRUSHING – AUSTRALIA
MACA was awarded 3 crushing
contracts by BHP during the year.
These included a 2 year contract to
crush blast-hole stemming material
across Western Australian Iron Ore
(WAIO) operations and a 3 year
contract to crush and screen up to
12Mtpa at the Mining Area C operation,
which commenced in March 2019.
MACA was also awarded a contract
to crush and screen up to 5Mtpa at
the Eastern Ridge operations which
commenced subsequent to year end.
These projects have allowed us to
utilise idle crushing equipment from
past completed projects.
MINING - INTERNATIONAL
We continue to operate at OZ Minerals’
Antas copper mine in the state of Para
in Brazil. The Company continues to
assess opportunities in Brazil given
equipment coming available from other
completed projects.
MACA has also executed a
Memorandum of Understanding with
Emerald Resources to provide contract
mining services at the Okvau Gold
Project in Cambodia – a new jurisdiction
for the business going forward.
CHRIS TUCKWELL
15MACA LIMITED ANNUAL REPORT 2019

REVIEW OF OPERATIONS CONTINUED
Operations
MINING AND CRUSHING
The division’s revenue of $473 million represented 71% of the total
Group revenue and was derived from continuing operations, the
completion of 2 projects and the commencement of 4 new projects
during the period.
MINING CONTRACTS BY SECTOR FROM JULY 2018 INCLUDE:
GOLD
MINING SERVICES
Continued Regis Resources at Moolart Well
Regis Resources at Duketon South – 5 year extension July 18
Blackham Resources at Matilda
Ramelius Resources at Mount Magnet
Completed Minjar Gold at Gossan Hill in February 2019
Memorandum of Emerald Resources at Okvau Gold (Cambodia East)
Understanding
COAL
MINING SERVICES
Commenced Carabella Resources at Bluff Coal in Queensland in December 18 – Life of Mine (10 year) contract
COPPER
MINING SERVICES
Continued OZ Minerals at Antas (Brazil, South America)
LITHIUM
MINING SERVICES
Continued Pilbara Minerals at Pilgangoora
CRUSHING AND SCREENING CONTRACTS BY SECTOR FROM JULY
2018 INCLUDE:
IRON ORE
CRUSHING AND SCREENING SERVICES
Commenced BHP at Mining Area C in April 2019
BHP at Eastern Ridge in June 2019
BHP WAIO (stemming and other stockpiles at various sites) in July 18
LITHIUM
CRUSHING AND SCREENING SERVICES
Completed Atlas Iron at Mt Dove in September 2018
MACA INTERQUIP
MACA Interquip (MACA 60% owned) is a
business providing Engineering, Procurement
and Construction (EPC) services including
Structural, Mechanical and Piping (SMP)
solutions in Western Australia.
MACA Interquip commenced the Kirkalocka
gold project for Adaman Resources during the
year - this included installation of a new semi-
autogenous (SAG) mill and the refurbishment
of an existing processing plant. The project
commenced in February of 2019 and will be
completed in the first half of FY2020. In addition
to this, MACA Interquip is actively pursuing
longer term maintenance services with its first
of these being agreed subsequent to year end.
Other projects completed during the period
included the construction of crushing plants
for MACA Mining at BHP and a secondary mill
upgrade for AngloGold Ashanti at the
Tropicana project.
WESTERN AUSTRALIA
Adaman Resources at Kirkalocka
Mill installation and refurbishment
of existing processing plant
Continuing
Panoramic Resources Savannah project
Refurbishment and maintenance services
Completed
Sandfi re Resources De Grussa project
SMP services for a filtration upgrade
Completed
AngloGold Ashanti at Tropicana
Secondary mill upgrade
Completed
16 MACA LIMITED ANNUAL REPORT 2019

CIVIL CONSTRUCTION
The Civil Construction business in both the Western Australian and
Victoria regions continued to mature in 2019, with cost overrun on a
small number of key projects offsetting the broader positive financial
performance generated by the business unit. Both sectors continued
their year-on-year revenue growth and developed positive relationships
with our valued stakeholders, in line with our corporate group strategy.
During 2019 the Civil division in Western Australia completed the
bulk earthworks at the Gruyere Gold project involving the greenfield
development of the overall process plant bulk earthworks, access
roads, storage ponds, airstrip, sealed intersections and tailings storage
facility (TSF) works. Later in the year the Coongan Gorge realignment
for MainRoads of WA was commenced and completed in the Kimberley
region. In addition, a number of small mine based infrastructure
projects were completed for mining clients and internally for our
Crushing Division.
Subsequent to year end MACA has been awarded stage 3 of the
Karratha / Tom Price road - a Construct Only contract for 45km of
roadworks for MainRoads WA in the Pilbara region at a value of $81m.
In Victoria, a number of projects for VicRoads and local shires between
$2m and $20m were completed with the business growing in scale and
capability. The most notable projects during the year were the O’Herns
Road intersection upgrade and the Doncaster Bus Lanes projects.
INFRASTRUCTURE MAINTENANCE
The Infrastructure Maintenance business in
Western Australia has maintained its strong
relationship with Main Roads during the period
receiving an extension in contract tenure for
delivery of the Road and Asset Maintenance
contract in the Kimberley region. One of the
success stories has been the outstanding
intake of local Aboriginal employees in the
workforce and their job growth development
in the region.
The Infrastructure Maintenance business in
Victoria has maintained its strong relationships
with VicRoads and Baw Baw Shire Council plus
other local government clients with continuing
long-term Road and Asset Maintenance
contracts.
MACA Civil once again achieved re-certification
in the National pre-qualification system to an
elevated R4 (conditional) / B2 level for Roads
and has also retained its accreditation to the
Office of Federal Safety. This allows continued
participation on or competing for federally
funded public infrastructure projects.
CIVIL CONSTRUCTION
PROJECTS
Gruyere Joint Venture
Site Bulk Earthworks, Access
Roads, Airstrip and Tailings Storage
Facility works and variations
Completed
Coongan Gorge
Road realignment in the
Kimberley region
Completed
Pilbara Minerals
Road and Tailings Storage
Infrastructure works
Completed
Western Areas
Odysseus Evaporation ponds
at the Cosmos project
Completed
Main Roads WA
Karratha / Tom Price road
Subsequent to year end
VicRoads
Design and Construct signalised
Intersection Upgrade -
O’Herns Road, Epping
Completed
Croydon Road Intersection
Upgrade
Continuing
Safe System Road Infrastructure
Projects (SSRIP) Project Zero
Construction Panel
Continuing
Design and Construct
Doncaster Bus-lanes
Completed
Works for various shires
and councils
Hobson Bay, Wangaratta
and Whittlesea
Continuing
INFRASTRUCTURE
PROJECTS
Main Roads WA
Kimberley Road Maintenance
Continuing
VicRoads
Western Region Road and
Roadside Maintenance
Continuing
Baw Baw Shire
Routine maintenance
Continuing
17MACA LIMITED ANNUAL REPORT 2019

THE BUSINESS
The improved performance of the Mining and Crushing
Divisions in the second half of FY19 is expected to continue
into the coming year as the full benefits of the capital
investment are realised. Increased activity within the mining
sector is expected to support future growth within this
segment.
The Civil and Infrastructure businesses, through increased
scale and a heightened focus on improved project delivery,
is expected to benefit from a very large infrastructure spend
on the East Coast and opportunities in WA increasing on
the back of significant capital works programs in the mining
industry. MACA Interquip continues to build its reputation
and is now starting to deliver on the potential identified at
the time of acquisition.
MACA enters the year with a work in hand position of $2.1
billion as at 31 August 2019. This together with strong
prospects has the business poised to grow both revenue and
profitability. We will continue to selectively identify mining
and construction opportunities and are well positioned to
deliver growth of our quality services to customers in the
sectors in which it operates.
FINANCIAL AND OPERATING PERFORMANCE
• Operating revenue of $665.7 million
• EBITDA of $70.7 million
• Net profit after tax attributable to members of $20.6
million
• Net operating cash flow of $57.5 million
• Final dividend of 2.5 cents per share (fully franked) (Total
for FY19 of 4.5 cps)
• Strong balance sheet with a net debt position of $82.8
million
30 JUNE 2019 30 JUNE 2018 MOVEMENT
Revenue $665.7m $562.6m 18%
EBITDA $70.7m1 $76.6m (8)%
EBIT $28.1m $29.4m (4)%
Net Profit Before Tax $32.0m $31.6m 1%
Net Profit After Tax Attributable to Members $20.6m $23.6m (13)%
Work in Hand $2,110m2 $1,051m3
Operating Cash Flow $57.5m $8.7m
Earnings per share - basic 7.7 cents 9.1 cents
Dividends per share (fully franked) 4.5 cents 6.5 cents
1 Adjusted EBTDA of $74.7m excluding addback of net interest income2 As at August 20193 As at August 2018
Group revenue increased overall with an increase in growth of the core mining segment of 18% to $473 million, revenue of
$139 million for the Civil Construction and Infrastructure Maintenance division and an increase in the mineral processing
equipment businesses from $21 million to $51 million.
The after-tax profit has decreased to $20.6 million for the year ended 30 June 2019.
EBITDA (Earnings before interest, tax, depreciation and amortisation) was $70.7 million for the year ended 30 June 2019.
REVIEW OF OPERATIONS CONTINUED
18 MACA LIMITED ANNUAL REPORT 2019

DIVIDEND
On the 22nd August 2019, the board of MACA Limited
declared a final dividend for the financial year ended 2019
of 2.5 cents per share and a total dividend for the year of 4.5
cents per share. This payout is consistent with our targeted
guideline and the Board’s objective to provide a return to
shareholders whilst still retaining the financial capacity to
support our growth plans.
The total dividend paid during the year was $14.7 million
(2018: $19.0 million).
OPERATING CASH FLOW AND CAPITAL EXPENDITURE
Operating cash flow for the 12 months ended 30 June 2019
was $57.5 million (representing a cash conversion ratio
of 81%).
Capital expenditure for the financial year was $166
million relating to plant and equipment associated with
the commencement of the Bluff Coal project for Carabella
Resources, the crushing plants for BHP at Mining Area C
and Eastern Ridge, new equipment for the Duketon South
operations for Regis Resources, and sustaining capital.
Capital equipment purchases were funded by a combination
of cash and equipment finance contracts.
The operating cashflow in the second half was significantly
improved as a result of repayment arrangements with Great
Panther being accelerated by the exercise and conversion of
3 tranches of debt to equity with $30 million received since
the end of the first half reporting period.
BALANCE SHEET AND GEARING
With an increase in revenue and assets employed, the Group
as at 30 June 2019 remains in a strong financial position with
a net debt position of $82.8 million representing a gearing
ratio of 20%, and with cash on hand of $59.3 million.
ORDER BOOK
As at the end of August 2019 the Company had Work-In-
Hand of $2,110 million, with Mining accounting for $1,867
million and Crushing $103 million.
OUR PEOPLE
At MACA, we recognise that people are our greatest asset,
employing over 1,600 at 30 June 2019. Our ability to
attract and retain great people is very much the essence
of our employer brand and forms the cornerstone of our
business. It sets us apart. We ask a lot of our people, as
it takes a special effort to consistently strive to exceed
the expectations of our stakeholders. In turn we want our
workers to feel a great deal of pride to be part of the MACA
brand. We actively engage our people, we work to nurture
them to be the best they can be, but our highest priority is to
keep them safe as we conduct our business.
It takes a certain type of person to work in such a dynamic
business, where change is inevitable, and individuals need
to be adaptive and flexible. We hear it all the time, “people
are our greatest asset”, but we certainly don’t take this asset
for granted. We endeavour to form long-term partnerships
with our people.
DIVERSITY
MACA acknowledges that cultural diversity is key to
providing a culturally sensitive and respectful workplace.
MACA prides itself in being an equal opportunity employer
where cultural diversity is demonstrated through our Core
Value of People First. We embrace diversity and are mindful
of related sensitivities, to help provide a welcoming and
enriching place to work.
We recognise the cultural, social and economic impact when
interacting and working with communities. We embrace
this opportunity to encourage local employment, to support
local business and commit to provide other legacies this
opportunity will bring. We are fully committed to providing
direct and indirect employment and/or contracting
opportunities to the Aboriginal community. Currently
4% of MACA’s workforce identify themselves to be of
Aboriginal heritage and there is a clear plan to increase this
participation rate over the next twelve months. MACA is also
committed to increasing female diversity across all levels of
its business.
19MACA LIMITED ANNUAL REPORT 2019

LEARNING AND DEVELOPMENT
We recognise the importance of investing in the
future of our people at MACA and offer an array of
opportunities for those who show promise, work
hard and actively seek it. With a diverse company
work portfolio, our people have the opportunity
to gain a vast range of differing experience across
a multi-disciplined, national and international
contracting environment.
In 2019, MACA designed, developed and
introduced its own internal Leadership
Development Program. With over 85 of its
emerging and existing leaders having completed
or undertaking this development, our clients
are noticing excellent improvements benefitting
their projects. This program and a number of
related development initiatives will build our in-
house training capability to meet the demand of
a growing order book, a shrinking skilled labour
market and the ever-evolving world of technology
and industry change.
In an environment of growth and emerging
systems, building strong leadership on the
frontline is essential. The MACA ‘Leading with
Intention’ program has resulted in a marked shift
in safety leadership attitudes and performance.
Recognising we operate in this challenging labour
environment, we have a firm belief we have an
obligation to help build the next tier of qualified
tradespeople, professionals and support roles
for our industry. MACA currently employ 53
Apprentices and 43 Trainees across a vast range
of disciplines. In addition, MACA is proud to be in
partnership with ‘Working Spirit’, a not-for-profit
organisation, where we have employed in excess
of 38 ex-ADF (Australian Defence Force) personnel
who have successfully transitioned into a range of
positions across our business.
As we grow, we expect the level of sophistication
of our people systems, our leadership capability
and our service delivery to grow too. To facilitate
this growth, MACA has made a conscious decision
to drive a continuous improvement culture across
all aspects of our business.
REVIEW OF OPERATIONS CONTINUED
20 MACA LIMITED ANNUAL REPORT 2019

HEALTH, SAFETY, ENVIRONMENT AND QUALITY
MACA maintains an integrated HSEQ management
system, externally accredited by SAI Global (AS/
NZS4801:2001, ISO9001:2015 and ISO14001:2015)
and the Office of the Federal Safety Commissioner
(OFSC). These management systems encompass all
the processes and procedures we rely on to conduct
our work safely and efficiently and is consistently
being improved from lessons learnt and industry
updates. These improvements continue MACA’s
focus on our objective of Zero Harm to provide a safe
and healthy workplace for the prevention of work-
related injury and / or ill health to our employees,
contractors and visitors. There is a genuine belief
amongst our leaders that you can’t have a good
business unless it is a safe business. We are
continuing to work towards a sustainable safety
culture based on strong leadership, clear lines of
accountability, high levels of employee engagement
and sound safety performance over time.
MACA is committed to minimising the impact
on the environment in which we live and work.
MACA always considers the lifecycle aspect to
environmental decision-making to reduce emission
discharges, wastes, energy usage and resource
consumption. We work closely with our clients and
traditional custodians of the land to identify items
or areas of cultural heritage which may be impacted
by our work activities, create an awareness of the
significance and establish systems to preserve and
protect its value.
MACA has established measurable objectives and
targets to evaluate how closely MACA is achieving
the health, safety and environmental expectations,
requirements and obligations of stakeholders.
VETERANS EMPLOYMENT
MACA acknowledges the service that all ADF
members have given to all Australians, and
as a company MACA is committed to assisting
Veterans and their families through employment
opportunities. To date MACA has employed
approximately 38 Veterans over the last 12 months
with the assistance of Working Spirit. Currently
Veteran retention over the last 12 months is at 92%
and represents 4% of our total workforce.
MACA has successfully registered its public
commitment to Veteran Employment with the
Department of Veteran Affairs and in doing so has
become the first Mining and Civil contractor in
Australia to make this public commitment.
COMMUNITY
MACA acknowledges the significance of our social
licence to operate, and that it is both earned and
maintained on an ongoing basis, as a result of our
many relationships with our stakeholders.
Community and People First are two of MACA’s core
values, and we are proud to have meaningful and
positive connections with both the communities we
work in and the people we employ.
During FY19, MACA contributed significantly to the
communities in which it operates, including the
MACA Cancer 200, The Harry Perkins Institute of
Medical Research, the Hawaiin Ride for Youth, WASO
and other charities in the states in which we operate.
In closing, MACA highly values its hard working,
dedicated and loyal employees. The Board would
like to extend its thanks to them and all of our
stakeholders who remain an integral part of
our success.
CHRIS TUCKWELL
Managing Director, CEO
21MACA LIMITED ANNUAL REPORT 2019

DIRECTORS’ REPORTThe Directors present their report, together with the financial statements, of the
consolidated entity (referred to hereafter as the ‘consolidated entity’) consisting
of MACA Limited (referred to hereafter as the ‘company’ or ‘parent entity’) and the
entities it controlled for the year ended 30 June 2019.
DIRECTORS
The following persons were directors of MACA Limited during the whole or part of
the financial year and up to the date of this report:
Mr (Hugh) Andrew Edwards (Chairman, Non-Executive Director)
Mr Christopher Mark Tuckwell (Chief Executive Officer and Managing Director)
Mr Geoffrey Alan Baker (Executive Director)
Mr Linton John Kirk (Non-Executive Director)
Mr Robert Neil Ryan (Non-Executive Director)
PRINCIPAL ACTIVITIES AND ANY SIGNIFICANT CHANGES IN NATURE
The principal activities of the Group during the year were in three businesses and
two geographical segments being the provision of contract mining services, civil
contracting services and mineral processing services throughout Australia, and
contract mining services in Brazil, South America.
There were no significant changes in the nature of the Group’s principal activities
during the financial year.
DIVIDENDS PAID OR RECOMMENDED
Dividends that were fully franked and paid or declared for payment since the end
of the previous financial year were as follows:
2019 2018
Interim dividend declared and paid per ordinary share (cps) 2.0 3.0
Final dividend declared and paid per ordinary share (cps) 2.5 3.5
The final fully franked dividend was paid on 20th September 2019.
DIVIDEND REINVESTMENT PLAN
There is no dividend reinvestment plan in place.
22 MACA LIMITED ANNUAL REPORT 2019

REVIEW OF OPERATIONS
A summary of key financial indicators is set out in the table below.
2019
$’m
2018
$’m
CHANGE
Revenue 665.7 562.6 18%
EBITDA 70.7 76.7 (8)%
EBIT 28.1 29.4 (4)%
Net Profit before tax 32.0 31.6 1%
Net Profit after tax (attributable to members) 20.6 23.6 (13)%
Work in Hand 2,110 1 1051 2
Operating Cashflow 57.5 8.7
Dividend per share (fully franked) 4.5 cents 6.5 cents
Basic earnings per share 7.7 cents 9.1 cents
Net tangible asset backing per share (basic) 119.5 cents 118.8 cents
1 As at 31 August 2019 / 2 As at 30 June 2018
A review of, and information about the operations of the consolidated entity for the financial year and the results of those
operations are set out in the Chairman’s Address and the Managing Director’s Review of Operations that forms part of this
Directors’ Report.
ENVIRONMENTAL ISSUES
MACA is aware of its environmental obligations with regard to its principal activities and ensures it complies with all
regulations.
SIGNIFICANT CHANGES IN STATE OF AFFAIRS
There have not been any significant changes in the state of affairs of the Group.
CHANGES IN CONTROLLED ENTITIES
During the period MACA gained control of the following entities:
• OPMS Cambodia Co. Ltd
EVENTS SUBSEQUENT TO BALANCE DATE
After balance date events include the following:
• Award of the Karratha / Tom Price road - an approximately $81 million Construct Only road construction contract for 45km
of roadworks for the MRWA in the Pilbara region (see ASX announcement 19th August 2019)
Other than the matters detailed above no circumstances have arisen since the end of the financial year which significantly
affected or may significantly affect the operations of the Group, the results of those operations, or the state of affairs of the
Group in future financial years.
23MACA LIMITED ANNUAL REPORT 2019

INFORMATION ON CURRENT DIRECTORS
NAME: Mr Andrew Edwards
TITLE: Independent Non-Executive Chairman
QUALIFICATIONS: B Com FCA SF Finsia FAICD
EXPERIENCE AND EXPERTISE:
Mr Edwards is a former Managing Partner of PricewaterhouseCoopers (PwC) Perth Office, a former
national Vice President of the Securities Institute of Australia (now the Financial Services Institute of
Australasia) and a former President of the Western Australian division of that Institute. Mr Edwards
is a Fellow of Chartered Accountants Australia and New Zealand and has served as a state councillor
of that Institute.
CURRENT DIRECTORSHIPS:
Mr Edwards has been a board member of MACA Limited since 10th November 2010.
Mr Edwards is currently Non-executive Chairman of MMA Offshore Limited (appointed December
2009).
FORMER DIRECTORSHIPS (IN LAST 3 YEARS):
Non-Executive Director of Nido Petroleum Limited (appointed December 2009 and resigned
December 2018) (delisted from ASX June 2017).
SPECIAL RESPONSIBILITIES:
Mr Edwards is currently a member of the Board’s Remuneration Committee, Audit Committee and
Risk Committee.
INTEREST IN SHARES: 20,000
NAME: Mr Chris Tuckwell
TITLE: Chief Executive Officer and Managing Director
QUALIFICATIONS: B Eng (Construction)
EXPERIENCE AND EXPERTISE:
Mr Tuckwell holds a Bachelor of Engineering - Construction and has spent his entire career within
the mining industry, working with both mining contractors and mining companies over the past 35
years. During his career Mr Tuckwell has also fulfilled senior off-shore management and executive
positions in West and East Africa, South America, Indonesia and the West Indies.
CURRENT DIRECTORSHIPS:
Mr Tuckwell has been a board member of MACA Limited since 4th August 2014.
FORMER DIRECTORSHIPS (IN LAST 3 YEARS):
Mr Tuckwell was a board member of MACA Limited from 10th November 2010 to 25th July 2012.
SPECIAL RESPONSIBILITIES:
Mr Tuckwell is currently a member of the Board’s Risk Committee.
INTEREST IN SHARES 1,288,801
INTEREST IN PERFORMANCE RIGHTS:
184,619 vesting 30 June 2020
256,599 vesting 30 June 2021
NAME: Mr Geoff Baker
TITLE: Executive Director
QUALIFICATIONS: MAICD
EXPERIENCE AND EXPERTISE:
Mr Baker is a founding shareholder of MACA. Geoff is responsible for planning, operating strategy,
capital expenditure and delivery of safety and financial outcomes on all projects for the business. Mr
Baker has worked in the sector for 40 years focusing on plant maintenance and asset management.
CURRENT DIRECTORSHIPS:
Mr Baker has been a board member of MACA Limited since 10th November 2010.
FORMER DIRECTORSHIPS (IN LAST 3 YEARS):
Nil.
SPECIAL RESPONSIBILITIES:
Mr Baker is currently a member of the Board’s Risk Committee.
INTEREST IN SHARES: 12,863,816
INTEREST IN PERFORMANCE RIGHTS:
146,775 vesting 30 June 2020
215,514 vesting 30 June 2021
DIRECTOR’S REPORT CONTINUED
24 MACA LIMITED ANNUAL REPORT 2019

NAME: Mr Linton Kirk
TITLE: Independent Non-Executive Director
QUALIFICATIONS: B Eng (Mining) FAusIMM (CP)
EXPERIENCE AND EXPERTISE:
Mr Kirk has over 40 years’ experience in mining and earthmoving,
covering both open pit and underground operations in several
commodities. He has held technical, operational and management
positions in a variety of mining and mining service companies
throughout the world prior to becoming a consultant in 1997. Mr Kirk
holds a Bachelor of Engineering (Mining) degree from the University
of Melbourne, is a Fellow and Charted Professional of the Australian
Institute of Mining and Metallurgy and has completed a Company
Directors course.
CURRENT DIRECTORSHIPS:
Mr Kirk has been a board member of MACA Limited since 1st October
2012.
FORMER DIRECTORSHIPS (IN LAST 3 YEARS)
Mr Kirk was a Non-Executive Director of Middle Island Resources
from September 2011 to July 2016.
SPECIAL RESPONSIBILITIES:
Mr Kirk is currently the Chair of the Board’s Audit Committee and
Risk Committee and a member of the Remuneration Committee.
INTEREST IN SHARES: 75,000
NAME: Mr Robert Ryan
TITLE: Independent Non-Executive Director
QUALIFICATIONS: CP Eng MIEAust MAICD
EXPERIENCE AND EXPERTISE:
Mr Ryan has extensive civil contracting and construction engineering
experience with particular expertise in engineering, project, asset
and senior management. His experience in infrastructure projects
is substantial. Mr Ryan has extensive experience at senior levels of
a significant public company and was a partner in a successful civil
earthmoving business for over 12 years.
CURRENT DIRECTORSHIPS:
Mr Ryan has been a board member of MACA Limited since 18th
August 2015.
FORMER DIRECTORSHIPS (IN LAST 3 YEARS):
Nil.
SPECIAL RESPONSIBILITIES:
Mr Ryan is currently the Chair of the Board’s Remuneration
Committee and member of the Audit Committee and Risk Committee.
INTEREST IN SHARES: 38,604
NAME: Mr Peter Gilford
TITLE: Chief Financial Officer / Company Secretary
QUALIFICATIONS: B Com CA AGIA ACIS
EXPERIENCE AND EXPERTISE:
Mr Gilford has significant experience in the areas of financial
management, accounting, business and taxation services. He has
provided services to a large number of mining, exploration and
construction companies. Mr Gilford has acted in roles of Director,
Company Secretary and CFO for a number of privately owned
businesses. Peter is a member of the Chartered Accountants
Australia and New Zealand and is a member of the Governance
Institute of Australia.
25MACA LIMITED ANNUAL REPORT 2019
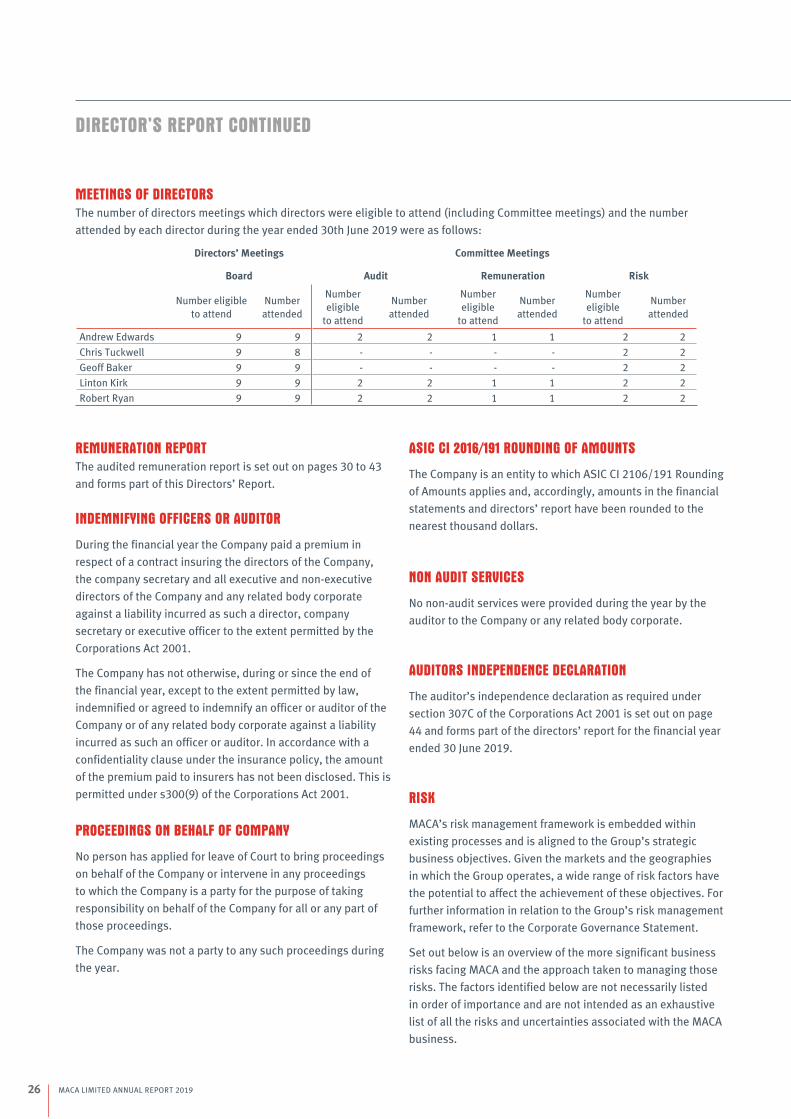
MEETINGS OF DIRECTORS
The number of directors meetings which directors were eligible to attend (including Committee meetings) and the number
attended by each director during the year ended 30th June 2019 were as follows:
Directors’ Meetings Committee Meetings
Board Audit Remuneration Risk
Number eligible
to attend
Number
attended
Number
eligible
to attend
Number
attended
Number
eligible
to attend
Number
attended
Number
eligible
to attend
Number
attended
Andrew Edwards 9 9 2 2 1 1 2 2
Chris Tuckwell 9 8 - - - - 2 2
Geoff Baker 9 9 - - - - 2 2
Linton Kirk 9 9 2 2 1 1 2 2
Robert Ryan 9 9 2 2 1 1 2 2
REMUNERATION REPORT
The audited remuneration report is set out on pages 30 to 43
and forms part of this Directors’ Report.
INDEMNIFYING OFFICERS OR AUDITOR
During the financial year the Company paid a premium in
respect of a contract insuring the directors of the Company,
the company secretary and all executive and non-executive
directors of the Company and any related body corporate
against a liability incurred as such a director, company
secretary or executive officer to the extent permitted by the
Corporations Act 2001.
The Company has not otherwise, during or since the end of
the financial year, except to the extent permitted by law,
indemnified or agreed to indemnify an officer or auditor of the
Company or of any related body corporate against a liability
incurred as such an officer or auditor. In accordance with a
confidentiality clause under the insurance policy, the amount
of the premium paid to insurers has not been disclosed. This is
permitted under s300(9) of the Corporations Act 2001.
PROCEEDINGS ON BEHALF OF COMPANY
No person has applied for leave of Court to bring proceedings
on behalf of the Company or intervene in any proceedings
to which the Company is a party for the purpose of taking
responsibility on behalf of the Company for all or any part of
those proceedings.
The Company was not a party to any such proceedings during
the year.
ASIC CI 2016/191 ROUNDING OF AMOUNTS
The Company is an entity to which ASIC CI 2106/191 Rounding
of Amounts applies and, accordingly, amounts in the financial
statements and directors’ report have been rounded to the
nearest thousand dollars.
NON AUDIT SERVICES
No non-audit services were provided during the year by the
auditor to the Company or any related body corporate.
AUDITORS INDEPENDENCE DECLARATION
The auditor’s independence declaration as required under
section 307C of the Corporations Act 2001 is set out on page
44 and forms part of the directors’ report for the financial year
ended 30 June 2019.
RISK
MACA’s risk management framework is embedded within
existing processes and is aligned to the Group’s strategic
business objectives. Given the markets and the geographies
in which the Group operates, a wide range of risk factors have
the potential to affect the achievement of these objectives. For
further information in relation to the Group’s risk management
framework, refer to the Corporate Governance Statement.
Set out below is an overview of the more significant business
risks facing MACA and the approach taken to managing those
risks. The factors identified below are not necessarily listed
in order of importance and are not intended as an exhaustive
list of all the risks and uncertainties associated with the MACA
business.
DIRECTOR’S REPORT CONTINUED
26 MACA LIMITED ANNUAL REPORT 2019

HEALTH, SAFETY, SUSTAINABILITY AND
ENVIRONMENT RISK
The industry sectors in which we operate involve a high
degree of operational risk. MACA believes it takes reasonable
precautions to manage safety and environmental risks
to ensure the continued sustainability of the business.
However, there can be no assurance that the Group will
avoid significant costs, liability and penalties or criminal
prosecution. This risk is mitigated by progressively improving
on already high safety performance standards across the
business and by maintaining independently reviewed health
and safety, environmental and quality certifications.
PROJECT DELIVERY RISK
The execution and delivery of projects involves judgment
regarding the planning, development and operation of
complex operating facilities and equipment. Some parts of
MACA’s business are involved in large-scale projects that may
occur over extended time periods. As a result, the Group’s
operations, cash flows and liquidity could be affected if MACA
miscalculates the resources or time needed to complete
a project, if it fails to meet contractual obligations, or if it
encounters delays or unspecified conditions. MACA maintains
a strict project monitoring regime, proactive management and
decision making to mitigate project delivery risks.
ORDER BOOK RISK
Generally in the mining industry, most contracts can be
terminated for convenience by the client at short notice and
without penalty, with the client paying for all work completed
to date, unused material and in most cases demobilisation
from the site and redundancies. As a result, there can be no
assurance that work in hand will be realised as revenue in
any future period. MACA seeks to manage this risk by being
selective in the contracts that it enters into and always seeks
to extend contracts where possible in an effort to maximise its
return on capital.
27MACA LIMITED ANNUAL REPORT 2019

DEMAND RISK
MACA is a contractor operating predominantly in the mining
resources and civil sectors. As a result, failure to obtain
contracts, delays in awards of contracts, cancellations or
terminations of contracts, delays in completion, changes in
economic conditions and the volatile and cyclical nature of
commodity prices means that the demand for MACA’s goods
and services can vary markedly over relatively short periods.
Accordingly, changes in market conditions could impact
MACA’s financial performance. The Group seeks to manage
demand risk as best it can by maintaining a diversified
client base and commodity mix and having a proportion of
equipment and labour on hire.
BUSINESS ACQUISITIONS
When MACA acquires a business there is a risk of not being
able to realise or sustain expected benefits of the acquisition.
The goodwill represents the amounts paid for the business,
less the fair value of the net assets acquired. MACA, at least
annually, reviews the carrying value of goodwill and may incur
impairment charges related to goodwill if the businesses or
markets they serve deteriorate. In addition, businesses that
MACA acquires may have liabilities that MACA was unaware of
in the course of performing due diligence investigations. Any
such liabilities may have material adverse impact on MACA’s
business and financial position. As part of the due diligence
process, MACA thoroughly reviews all contracts to mitigate
the risk of acquiring onerous contracts and change in control
provisions, and historic liabilities and integration risks.
COMPETITION RISK
The market in which MACA operates is highly competitive,
which may result in downward pressure on prices and
margins. If MACA is unable to compete effectively in its
markets, it runs the risk of losing market share. MACA
continues to focus on delivering quality services to make us a
contractor of choice as a means of mitigating this risk.
DIRECTOR’S REPORT CONTINUED
28 MACA LIMITED ANNUAL REPORT 2019

CONTRACT PRICING RISK
MACA has a mixed exposure to contract types. However, if
the Group materially underestimates the cost of providing
services, equipment, or plant, there is a risk of a negative
impact on MACA’s financial performance. MACA follows a
proven tender review process to reduce the risk of under-
pricing contracts.
LIQUIDITY RISK
The risk of MACA not being able to meet its financial
obligations as they fall due is managed by maintaining
adequate cash reserves and available borrowing facilities,
as required. Errors or unforeseen changes in actual and
forecast cash flows that then create a mismatch against
the maturity profiles of financial assets and liabilities could
have a detrimental effect on the Group’s liquidity. The
Group’s approach to managing liquidity is to ensure, as far
as possible, that it will always have sufficient liquidity to
meet its liabilities when due, under both normal and stressed
conditions, without incurring unacceptable losses or risking
damage to the Group’s reputation.
PARTNER RISK
MACA, in some cases, may undertake services through
and participate in, joint ventures or partnering/alliance
arrangements. The success of these partnering activities
depends on the satisfactory performance by MACA’s partners.
The failure of partners to meet performance obligations could
impose additional financial and performance obligations that
could cause significant impact on MACA’s reputation and
financial results. MACA completes due diligence on potential
partners prior to forming any business relationship and
regularly monitors these relationships.
LABOUR COSTS AND AVAILABILITY
Labour represents a significant portion of operating expenses.
In order to compete for work and to service clients, the
Group needs to be able to continue to attract and retain
skilled employees. Consequently, the Group is exposed to
increased labour costs in markets where the demand for
labour is strong. Within more stable labour markets, the
group’s labour costs are typically protected by rise and fall
mechanisms within client contracts, which help neutralise the
impact of rising labour costs.
CURRENCY FLUCTUATION
As a Group with international operations, MACA is exposed to
fluctuations in the value of the Australian dollar versus other
currencies. Because MACA’s consolidated financial results
are reported in Australian dollars, if MACA generates sales
or earnings or has assets and liabilities in other currencies,
the translation into Australian dollars for financial reporting
purposes can result in a significant increase or decrease in
the amount of those sales or earnings and net assets. MACA
uses cash backed deposits to mitigate some of the US dollar
currency risk. Currently the company has unhedged exposure
to the Brazilian Real.
Other material risks that could affect MACA include:
• public liability risk incurred maintaining road assets
requiring identified defects to be closed out within a
specified timeframe;
• a major operational failure or disruption at key facilities
or to communication systems which interrupt MACA’s
business;
• changing government regulation including tax,
occupational health and safety, and changes in policy and
spending;
• loss of reputation through poor project outcomes,
unsafe work practices, unethical business practices,
and not meeting the market’s expectation of its financial
performance;
• operating in international markets, potentially exposing
MACA to country specific adverse economic conditions,
civil unrest, conflicts, bribery and corrupt practices;
• foreign exchange rates and interest rates in the ordinary
course of business, and
• loss of key Board, management or operational personnel.
29MACA LIMITED ANNUAL REPORT 2019
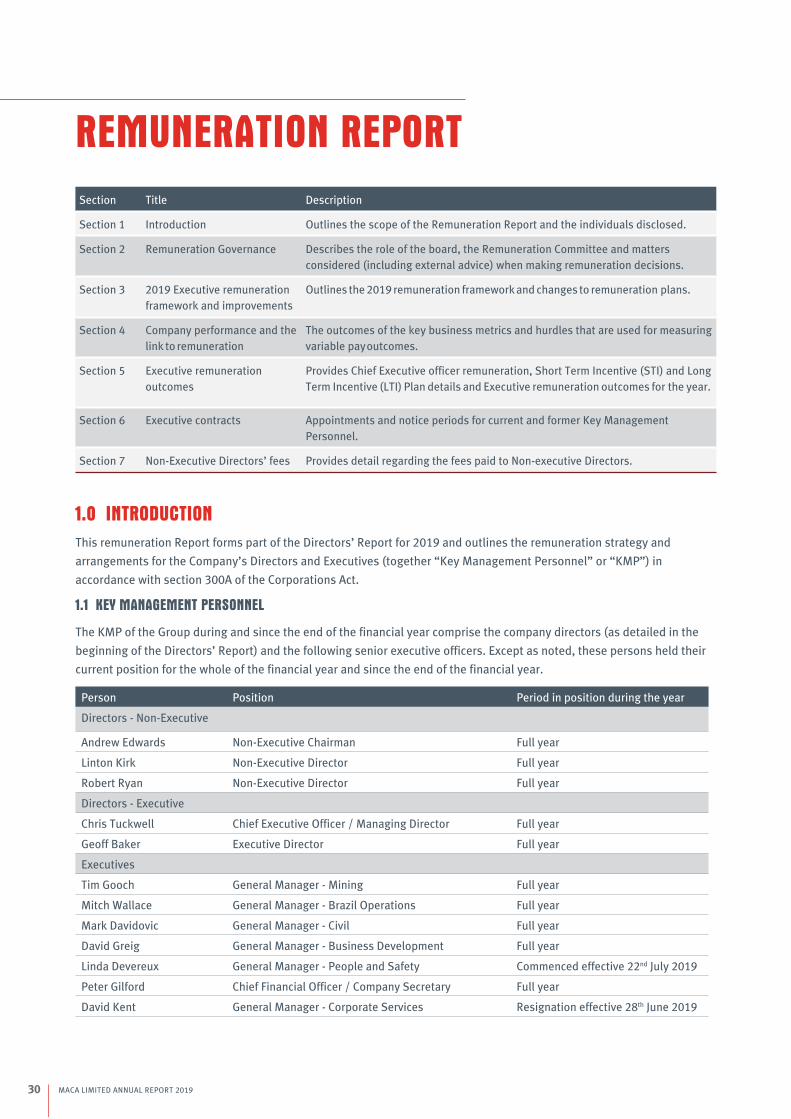
REMUNERATION REPORT
Section Title Description
Section 1 Introduction Outlines the scope of the Remuneration Report and the individuals disclosed.
Section 2 Remuneration Governance Describes the role of the board, the Remuneration Committee and matters
considered (including external advice) when making remuneration decisions.
Section 3 2019 Executive remuneration
framework and improvements
Outlines the 2019 remuneration framework and changes to remuneration plans.
Section 4 Company performance and the
link to remuneration
The outcomes of the key business metrics and hurdles that are used for measuring
variable pay outcomes.
Section 5 Executive remuneration
outcomes
Provides Chief Executive officer remuneration, Short Term Incentive (STI) and Long
Term Incentive (LTI) Plan details and Executive remuneration outcomes for the year.
Section 6 Executive contracts Appointments and notice periods for current and former Key Management
Personnel.
Section 7 Non-Executive Directors’ fees Provides detail regarding the fees paid to Non-executive Directors.
1.0 INTRODUCTION
This remuneration Report forms part of the Directors’ Report for 2019 and outlines the remuneration strategy and
arrangements for the Company’s Directors and Executives (together “Key Management Personnel” or “KMP”) in
accordance with section 300A of the Corporations Act.
1.1 KEY MANAGEMENT PERSONNEL
The KMP of the Group during and since the end of the financial year comprise the company directors (as detailed in the
beginning of the Directors’ Report) and the following senior executive officers. Except as noted, these persons held their
current position for the whole of the financial year and since the end of the financial year.
Person Position Period in position during the year
Directors - Non-Executive
Andrew Edwards Non-Executive Chairman Full year
Linton Kirk Non-Executive Director Full year
Robert Ryan Non-Executive Director Full year
Directors - Executive
Chris Tuckwell Chief Executive Officer / Managing Director Full year
Geoff Baker Executive Director Full year
Executives
Tim Gooch General Manager - Mining Full year
Mitch Wallace General Manager - Brazil Operations Full year
Mark Davidovic General Manager - Civil Full year
David Greig General Manager - Business Development Full year
Linda Devereux General Manager - People and Safety Commenced effective 22nd July 2019
Peter Gilford Chief Financial Officer / Company Secretary Full year
David Kent General Manager - Corporate Services Resignation effective 28th June 2019
30 MACA LIMITED ANNUAL REPORT 2019

2.0 REMUNERATION GOVERNANCE
The Board oversees the remuneration arrangements of the KMP.
In performing this function the Remuneration Committee reviews the remuneration packages of all Directors, the Chief
Executive Officer and other Executives (collectively the KMP).
The Committee makes recommendations to the Board on an annual basis with benchmarking against comparable industry
packages and adjusting to recognise the specific performance of both the company and the individual.
The Remuneration Committee may also engage an external remuneration consultant to review the levels of senior
executive and non- executive remuneration. No external remuneration consultant was engaged over the past financial
year.
3.0 2019 EXECUTIVE REMUNERATION FRAMEWORK
Remuneration practices are continuously developed in line with the Company’s business demands, industry conditions
and overall market trends. The primary goal is to link executive remuneration with the achievement of MACA’s business
and strategic objectives with the aim to increase shareholder value over the short and longer term. The nature and
amount of compensation for executive KMP is designed to retain and stimulate individuals on a market competitive basis.
Remuneration Framework
Total fixed remuneration (TFR) Short-term incentive (STI) Long-term incentive (LTI)
� TFR takes into account similar
positions in peer companies,
length of service, experience and
contribution
� Peer companies are those with
broadly similar revenue and in
related industries
� TFR is reviewed annually
Financial metrics comprise some or all of:
� Net profit after tax - company and divisional
� Earnings per share
Non-financial metrics comprise some or all of:
� Safety indicators - LTI and TRIFR
� Personal performance
� Maximum STI is 15 - 25% of TFR depending on
the individual
� Relative TSR using a benchmark
index namely the S&P/ASX
Small Ordinaries Accumulation
Index (XSOAI) measured over a 3
year period (100% component)
� Number of performance rights
issued up to 25% of fixed annual
remuneration divided by the
independently assessed value of
a performance right
4.0 COMPANY PERFORMANCE AND THE LINK TO REMUNERATION
Key Performance Indicators (‘KPIs’) for both short-term and long-term Executive incentive schemes are linked to
the Company’s strategic and business objectives and as a result, pay outcomes are directly aligned with Company
performance against these objectives.
The following Company performance measures are among those that may be included in incentive plans for relevant
executives. KPIs may be adjusted for individually large or unusual items to derive an underlying performance measure
outcome. The Board believes these KPIs are aligned to Shareholder wealth and returns to investors.
31MACA LIMITED ANNUAL REPORT 2019

2019 2018 2017 2016 2015
Reported net profit/(loss) attributable to equity 20.6 23.6 31.2 24.2 54.4
holders of the parent ($m)
Reported return on equity (%) 6.9 7.4 11.6 9.5 21.7
Reported basic earnings per share (cents) 7.7 9.1 13.7 10.4 24
Lost time injury frequency rate (LTIFR) 0.5 0 0 0 0
Total recordable injury frequency rate (TRIFR) 6.4 6.8 7.8 13.7 14.8
Shareholders’ Wealth
Interim dividend declared (cents) 2.0 3.0 4.5 4.0 7
Final dividend declared (cents) 2.5 3.5 4.5 4.5 7.5
Special dividend declared (cents) - - - - 25
Share price at 30 June (cents) 90 120 165 132 77
Total shareholder return (TSR %) 1 (21.3) (23.3) 38.1 74.6 (37.0)
3 year Annual Compound TSR 1 (5.2) 23.2 6.3 8 (9.0)
1 All dividends in the TSR (Total Shareholder Return) calculation are on a declared (rather than paid) basis in respect to each
financial year.
5.0 EXECUTIVE REMUNERATION OUTCOMES
5.1 MANAGING DIRECTOR AND CEO ARRANGEMENTS
Mr Tuckwell’s remuneration package as CEO was determined by benchmarking it against that paid to CEOs in similar
organisations. The remuneration package comprises the following components:
- Total Fixed Remuneration (TFR) is $677,423 per annum inclusive of superannuation plus the use of a company motor
vehicle.
- An STI which includes the opportunity to earn an annual cash bonus of up to 25% of total fixed remuneration, subject
to achieving performance hurdles. Mr Tuckwell’s STI plan has been aligned with other senior executives under similar
plan rules with KPIs that align to profitable performance and safety. The CEO’s STI Plan comprises 40% for key financial
KPI’s, 30% for safety KPI’s and 30% for personal KPI’s. The financial KPIs comprise Net Profit after Tax and Earnings per
Share growth. The safety KPIs are based on the Lost Time Injury Frequency Rate (LTIFR) and the Total Recordable Injury
Frequency Rate (TRIFR).
There was no STI payable for Mr Tuckwell for 2019 as most KPI’s were not met - refer 5.4 below.
- An LTI under which Mr Tuckwell may receive share performance rights convertible into fully paid shares, subject to
performance criteria being met. At the 2018 Annual General Meeting the Board sought and received approval for the
grant of 256,599 Performance Rights pursuant to the Company’s Performance Rights Plan (PRP). Subject to the relevant
performance hurdles being met, these may vest in June 2021.
4.0 COMPANY PERFORMANCE AND THE LINK TO REMUNERATION (CONTINUED)
REMUNERATION REPORT CONTINUED
32 MACA LIMITED ANNUAL REPORT 2019

5.2 TOTAL FIXED REMUNERATION (TFR)
All Executives received TFR as outlined in page 31 of this report. TFR comprises base salary and superannuation plus the
use of a company motor vehicle or motor vehicle allowance.
Fixed pay has been reviewed and set against peer companies with whom MACA competes. MACA also benchmarks
through industry surveys and reports and may seek external advice for KMP remuneration.
5.3 SHORT-TERM INCENTIVE PLAN (STI PLAN)
Key features of the STI Plan are outlined in the table below.
Objective KPIs are set to encourage a profit and safety driven culture with the ultimate aim of driving
Stakeholder returns. The STI payments are structured to recognise and motivate employees to
align their performance with the Company’s goals. The amount of bonus actually earned will
depend on performance against predetermined KPIs with payment commencing upon reaching
those hurdles.
Eligibility All Executive key management personnel.
At risk payments 2018: The STI is a component of ‘at risk’ pay provided to Executives and KMP.
% of TFR paid on Target Achievement
CEO 25%
Executive Directors 25%
Other Executive KMP 15%
2019: The STI is a component of ‘at risk’ pay provided to Executives and KMP.
% of TFR paid on Target Achievement
CEO 25%
Executive Directors 25%
Other Executive KMP 15%
Performance conditions Financial and safety targets are all agreed with the Board and personal KPIs are set in
consultation with the relevant Executive.
Each KPI is weighted according to its importance in driving profitable performance and returns to
Shareholders. In order to be eligible to receive an STI there is a minimum financial requirement
or gate which must be met before other KPI’s are considered.
KPIs for the CEO and Executive Directors comprise Earnings per Share (EPS), Net Profit after Tax
(NPAT), Lost Time Injury Frequency Rate (LTIFR), Total Recordable Injury Frequency Rate (TRIFR)
and personal assessment.
KPIs for other Executive KMP comprise Net Profit after Tax (NPAT), business operating unit profit
performance, Lost Time Injury Frequency Rate (LTIFR), Total Recordable Injury Frequency Rate
(TRIFR) and personal assessment.
Setting of KPIs Financial and safety targets are all agreed with the Board and personal KPIs are set in
consultation with the relevant Executive.
Assessment of KPIs Performance is measured quantitatively and progress against key targets measured at half year
and full year.
Trigger for payment Any performance target met will trigger the calculation of total or part payment of the STI. The
board may exercise its discretion in relation to the payment of STI’s.
Cessation of employment STI forfeited if an Executive or KMP resigns or is terminated before the payment date. In
exceptional circumstances this may be reviewed by the Board.
33MACA LIMITED ANNUAL REPORT 2019

5.4 STI OUTCOMES
Given the minimum financial requirement was not met no STI was paid to any Executive in either 2019 or 2018.
5.5 LONG-TERM INCENTIVE PLAN (LTI PLAN)
Key features of the LTI Plan are outlined in the table below.
Overview of the LTI Plan The Plan offers Executive KMP performance rights with the opportunity to receive fully paid
ordinary shares in MACA Limited for no consideration, subject to specified time restrictions,
continued employment and performance conditions being met. Each performance right will
entitle participants to receive one fully paid ordinary share at the time of vesting.
Objective The Plan is designed to assist with Executive and KMP retention and to incentivise employees to
maximise returns and earnings for Shareholders.
Eligibility Executive KMP as determined by the Board.
At risk payments 2018: The LTI is a component of ‘at risk’ pay offered to Executive KMP. The number of
performance rights issued will depend on performance against predetermined KPIs with vesting
occurring upon reaching those hurdles.
The number of performance rights that vest is linked to relative Total Shareholder Return (TSR).
% of TFR applied in LTI
CEO 25%
Executive Directors 25%
Other Executive KMP 20%
2019: No changes
% of TFR applied in LTI
CEO 25%
Executive Directors 25%
Other Executive KMP 20%
Performance conditions KPIs are set for the Group (where relevant). Each KPI is weighted according to its importance in
driving profitable performance and returns to Shareholders.
KPIs for the CEO, Executive Directors and other Executive KMP comprise 100% against a Total
Shareholder Return (TSR) using a benchmark index namely the S&P/ASX Small Ordinaries
Accumulation Index (XSOAI) measured over a 3 year period.
TSR Comparator Group Assessed 100% against TSR using a benchmark index namely the S&P/ASX Small Ordinaries
Accumulation Index (XSOAI).
Assessment of KPIs Performance is measured quantitatively and progress against key targets reported at full year.
Trigger for vesting Assessed 100% against TSR using a benchmark index namely the S&P/ASX Small Ordinaries
Accumulation Index (XSOAI). The Board has discretion to not approve the vesting of the rights if
the TSR is negative.
Cessation of employment LTI forfeited if an Executive resigns or is terminated before the payment date. In exceptional
circumstances this may be reviewed by the Board.
REMUNERATION REPORT CONTINUED
34 MACA LIMITED ANNUAL REPORT 2019

5.6 LTI OUTCOMES
None of the applicable hurdles were met for the period 1 July 2016 to 30 June 2019 (3 year period) for rights to vest in the
LTI performance conditions above for Executives and KMP. No LTI was paid to any Executive in the 2019 financial year.
1,486,053 shares were issued during the year in relation to performance rights which vested on 30 June 2018.
5.7 UNVESTED ENTITLEMENTS
It is the Company’s policy to prohibit Executives from entering into transactions or arrangements which limit the economic
risk of participating in unvested entitlements under any equity-based remuneration schemes.
5.8 KMP OPTIONS
No options were granted during the period and no options were vested or were exercised during the period. At 30 June
2019 no options were held by KMP.
5.9 KMP PERFORMANCE RIGHTS
During the 2019 financial year 1,473,586 (2018: 972,231) performance rights were granted under the Group’s
Performance Rights Plan (1,136,392 to KMP) and 209,941 (2018: 334,637) performance rights were forfeited. Subject to
the achievement of designated performance hurdles, these performance rights will vest in June 2021. As at 30 June 2019
there were 2,235,877 (2018: 2,014,485) performance rights outstanding. On 14 November 2018 shareholders approved
the issue of 256,599 performance rights to the Managing Director Mr Chris Tuckwell and 215,515 performance rights to
the Operations Director Mr Geoff Baker.
35MACA LIMITED ANNUAL REPORT 2019

5.9 KMP PERFORMANCE RIGHTS (CONTINUED)
The number of rights over ordinary shares held by each KMP of the Group during the financial year is as follows:
30 June 2019
Balance at
beginning
of year
Granted as
remuneration
during the year
Exercised
during the
year
Other
changes
during the
year
Balance at
end of year
Vested and
exercisable
Vested and
unexercisable
Unvested at
end of year
Hugh (Andrew) Edwards
Chairman
- - - - - - - -
Linton Kirk
Non-Executive Director
- - - - - - - -
Robert Ryan
Non-Executive Director
- - - - - - - -
Chris Tuckwell
Managing Director /
Chief Executive Officer
452,873 256,599 - - 709,472 - 268,254 441,218
Geoff Baker
Executive Director
362,251 244,600 - - 577,765 - 215,476 362,289
Tim Gooch
General Manager - Mining
251,617 215,514 - - 381,726 - 146,261 235,465
Mitch Wallace
General Manager -
Brazil Operations
137,126 138,107 - - 389,724 - 150,310 239,414
Mark Davidovic
General Manager -
Civil and Infrastructure
103,781 148,212 - - 251,993 - - 251,993
David Greig
General Manager -
Business Development
221,045 125,015 - - 346,060 - 136,556 209,504
Peter Gilford
Chief Financial Officer /
Company Secretary
217,897 115,819 - - 333,716 - 125,396 208,320
Total 1,854,064 1,136,392 - - 2,990,456 - 1,042,253 1,948,203
Performance rights totaling 287,674 have been issued to employees not classes as KMP and remain unvested as at
30 June 2019
REMUNERATION REPORT CONTINUED
36 MACA LIMITED ANNUAL REPORT 2019

5.10 KMP SHAREHOLDINGS
The number of ordinary shares in MACA Limited held by each KMP of the Group during the financial year is as follows:
30 June 2019
Balance at
beginning of
year
Granted as
remuneration
during the year
Increase
other
Issued on
exercise of
rights during
the year
Other changes
during the year
Balance at
end of year
Hugh (Andrew) Edwards
Chairman20,000 - - - - 20,000
Linton Kirk
Non-Executive Director50,000 - 25,000 - - 75,000
Robert Ryan
Non-Executive Director28,604 - 10,000 - - 38,604
Chris Tuckwell
Managing Director /
Chief Executive Officer
774,064 - 70,000 444,737 - 1,288,801
Geoff Baker
Executive Director12,500,000 - - 363,816 - 12,863,816
Tim Gooch
General Manager - Mining43,012 - - 241,450 (119,300) 164,962
Mitch Wallace
General Manager -
Brazil Operations
40,343 - - 249,932 - 290,275
Mark Davidovic
General Manager -
Civil and Infrastructure
- - - - - -
David Greig
General Manager -
Business Development
- - - - - -
Peter Gilford
Chief Financial Officer / Company
Secretary
59,258 - - 186,118 - 245,376
Total 13,515,281 - 105,000 1,486,053 (119,300) 14,986,834
37MACA LIMITED ANNUAL REPORT 2019

5.11 KMP REMUNERATION
5.11.1 Employment benefi ts and payments for the year ended 30 June 2019
The following table sets out the benefits and payment details, in respect to the financial year, and the components of
remuneration for members of key management personnel of the consolidated Group.
Short-term benefi tsPost-employment
benefi tsLong-term benefi ts
Equity-settled sharebased payments
Salary, fees and leave
Comm-ittee fees
Cash bonus/
STI
Non-monetary
Other Super-annuation
Other Incentive plans
LSL Share / Units
Options /Rights
Total
Year $ $ $ $ $ $ $ $ $ $ $ $
Executive Directors
Chris Tuckwell
Managing Director /
Chief Executive Officer
2019 652,423 - - - 44,384 25,000 - - - - 168,171 889,978
2018 643,566 - - - 44,384 25,000 - - - - 185,859 898,809
Geoff Baker
Operations Director
2019 568,957 - - - - - - - - - 136,696 705,653
2018 557,390 - - - - - - - - - 143,819 701,209
Total compensation for
Executive Directors
2019 1,221,380 - - - 44,384 25,000 - - - - 304,867 1,595,631
2018 1,200,956 - - - 44,384 25,000 - - - - 329,678 1,600,018
Non-Executive Directors
Andrew Edwards
Chairman
2019 141,553 - - - - 13,447 - - - - - 155,000
2018 141,552 - - - - 13,447 - - - - - 154,999
Linton Kirk 12019 104,769 - - - - 8,042 - - - - - 112,811
2018 125,517 8,042 - - - - - 133,559
Robert Ryan 22019 96,978 - - - - - - - - - - 96,978
2018 115,168 - - - - - - 115,168
Total compensation
for Non-Executive
Directors
2019 343,300 - - - - 21,489 - - - - - 364,789
2018 382,237 - - - - 21,489 - - - - - 403,726
Executives (KMP)
Tim Gooch
General Manager -
Mining
2019 413,258 - - - 22,684 39,259 - - - - 90,384 565,585
2018 407,648 - - - 25,006 38,726 - - - - 96,371 567,751
Mitch Wallace
General Manager -
Brazil Operations
2019 466,197 - - - - - - - - - 92,340 558,537
2018 495,028 - - - - - - - - - 99,402 594,430
Mark Davidovic
General Manager -
Civil and Infrastructure
2019 464,100 - - - - 25,203 - - - - 96,045 585,348
2018 456,103 - - - - 24,411 - - - - 26,812 507,326
David Greig
General Manager -
Business Development
2019 402,399 - - - - 35,853 - - - - 81,527 519,779
2018 397,276 - - - - 35,176 - - - - 50,504 482,956
Peter Gilford
Chief Financial Officer /
Company Secretary
2019 379,014 - - - 24,918 23,544 - - - - 79,563 507,039
2018 361,421 - - - 27,204 24,129 - - - - 81,257 494,011
Total compensation for
Executives
2019 2,124,968 - - - 47,602 123,859 - - - - 439,859 2,736,288
2018 2,117,476 - - - 52,210 122,442 - - - - 354,346 2,646,474
REMUNERATION REPORT CONTINUED
38 MACA LIMITED ANNUAL REPORT 2019

5.11 KMP REMUNERATION (CONTINUED)
Short-term benefi tsPost-employment
benefi tsLong-term benefi ts
Equity-settled sharebased payments
Salary, fees and leave
Comm-ittee fees
Cash bonus/
STI
Non-monetary
Other Super-annuation
Other Incentive plans
LSL Share / Units
Options /Rights
Total
Year $ $ $ $ $ $ $ $ $ $ $ $
Former KMP
David Kent
General Manager -
Corporate Services
2019 405,150 - - - - 26,084 - - - - 53,407 484,641
2018 429,778 - - - - 23,330 - - - - 23,314 476,422
Total compensation for
former KMP
2019 405,150 - - - - 26,084 - - - - 53,407 484,641
2018 429,778 - - - - 23,330 - - - - 23,314 476,422
Total compensation
for KMP
2019 4,094,798 - - - 91,986 196,432 - - - - 798,133 5,181,349
2018 4,130,447 - - - 96,594 192,261 - - - - 707,338 5,126,640
1 Linton Kirk was engaged on a contract basis through his business Kirk Mining Consultants to perform consulting work.
The engagement was charged at hourly rates and is included in the amount of salary and fees above.
2 Robert Ryan was engaged on a contract basis through his business Hensman Properties to perform consulting work in
business development. The engagement was charged at hourly rates and is included in the amount of salary and fees
above.
39MACA LIMITED ANNUAL REPORT 2019

5.11.2 Employment details of members of key management personnel and other executives
The following table provides details of persons who were, during the financial year, members of key management
personnel of the consolidated Group. The table also sets out the proportion of remuneration that was performance and
non-performance based and the proportion of remuneration received in the form of options and performance rights.
Proportions of elements of remuneration related to performance
Proportions of elements of
remuneration not related to performance
Non-salary cash-based incentives
Shares / Units Options / Rights Fixed Salary / Fees Total
Year % % % % %
Executive Directors
Chris Tuckwell
Managing Director / Chief Executive Officer
2019 - - 18.9 81.1 100.0
2018 - - 20.7 79.3 100.0
Geoff Baker
Operations Director
2019 - - 19.4 80.6 100.0
2018 - - 20.5 79.5 100.0
Non-Executive Directors
Andrew Edwards
Chairman
2019 - - - 100.0 100.0
2018 - - - 100.0 100.0
Linton Kirk2019 - - - 100.0 100.0
2018 - - - 100.0 100.0
Robert Ryan2019 - - - 100.0 100.0
2018 - - - 100.0 100.0
Executives (KMP)
Tim Gooch
General Manager - Mining
2019 - - 16.0 84.0 100.0
2018 - - 17.0 83.0 100.0
Mitch Wallace
General Manager - Brazil Operations
2019 - - 16.5 83.5 100.0
2018 - - 16.7 83.3 100.0
Mark Davidovic
General Manager - Civil andInfrastructure
2019 - - 16.4 83.6 100.0
2018 - - 5.3 94.7 100.0
David Greig
General Manager - Business Development
2019 - - 15.7 84.3 100.0
2018 - - 10.5 89.5 100.0
Peter Gilford
Chief Financial Officer /Company Secretary
2019 - - 15.7 84.3 100.0
2018 - - 16.4 83.6 100.0
Former KMP
David Kent 1
General Manager - Corporate Services
2019 - - 11.0 89.0 100.0
2018 - - 4.9 95.1 100.0
1 David Kent - resigned as General Manager - Corporate Services effective 28th June 2019.
REMUNERATION REPORT CONTINUED
40 MACA LIMITED ANNUAL REPORT 2019

6.0 EXECUTIVE CONTRACTS
Executive contracts of service between the Company or company within the Group and KMP are on a continuing basis, the
terms of which are not expected to change in the immediate future. The notice period for termination varies from one to
three months.
Executive Appointment to KMP Notice period for contract cessation
Chris TuckwellManaging Director / Chief Executive Officer
4th August 2014
The contract is ongoing and has
no fixed term
The contract can be terminated by either party
with 3 months’ notice or payment in lieu
Geoff BakerOperations Director
3rd November 2010
The contract is ongoing and has
no fixed term
The contract can be terminated by either party
with 3 months’ notice or payment in lieu
Tim GoochGeneral Manager - Mining
20th June 2011
The contract is ongoing and has
no fixed term
The contract can be terminated by either party
with 3 months’ notice or payment in lieu
Mitch WallaceGeneral Manager - Brazil Operations
3rd November 2010
The contract is ongoing and has
no fixed term
The contract can be terminated by either party
with 3 months’ notice or payment in lieu
Mark DavidovicGeneral Manager - Civil and Infrastructure
20th February 2017
The contract is ongoing and has
no fixed term
The contract can be terminated by either party
with 3 months’ notice or payment in lieu
David GreigGeneral Manager - Business Development
18th July 2016
The contract is ongoing and has
no fixed term
The contract can be terminated by either party
with 3 months’ notice or payment in lieu
Linda DevereuxGeneral Manager - People and Safety
22nd July 2019
The contract is ongoing and has
no fixed term
The contract can be terminated by either party
with 3 months’ notice or payment in lieu
Peter GilfordChief Financial Officer / Company Secretary
23rd July 2014
The contract is ongoing and has
no fixed term
The contract can be terminated by either party
with 3 months’ notice or payment in lieu
41MACA LIMITED ANNUAL REPORT 2019

7.0 NON-EXECUTIVE DIRECTORS FEES
Non-Executive Directors fees are determined within an aggregate directors fee pool which is periodically recommended
for approval to shareholders. The current aggregate directors’ fee pool is $600,000. This provides for any future increases
to Non-Executive Directors fees and to allow for any changes to the Board make up and potential increases in the number
of Non-Executive Directors.
Fees paid to Non-Executive Directors are set at levels which reflect both the responsibilities of, and time commitments
required from, each Non-Executive Director to discharge their duties and are not linked to the financial performance of the
Company. Non-Executive Directors fees are reviewed annually by the Board to ensure they are appropriate for the duties
performed, including Board committee duties, and are in line with the market. Other than statutory superannuation, Non-
Executive Directors are not entitled to retirement benefits.
Non-Executive Directors $ / Chairman Member
Andrew Edwards $155,000Board
Audit CommitteeRisk Committee
Remuneration Committee
Linton Kirk $92,700Audit CommitteeRisk Committee
Remuneration Committee
Robert Ryan $92,700Remuneration Committee
Audit CommitteeRisk committee
REMUNERATION REPORT CONTINUED
42 MACA LIMITED ANNUAL REPORT 2019
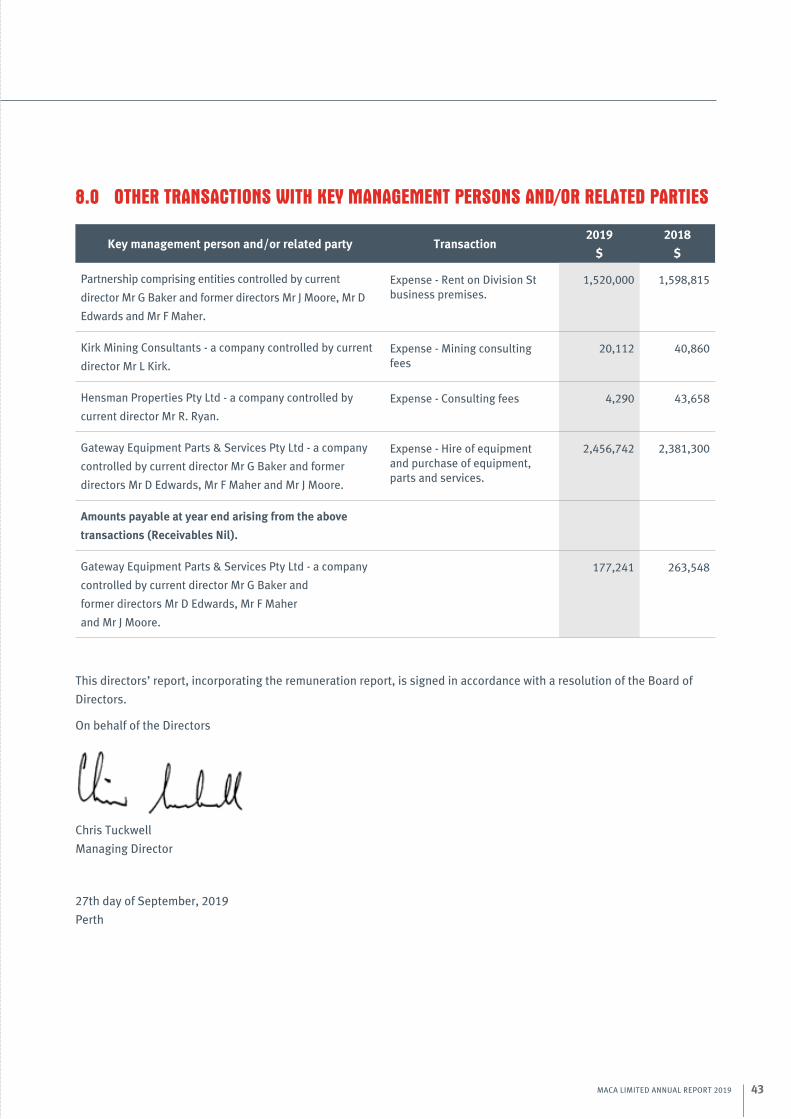
8.0 OTHER TRANSACTIONS WITH KEY MANAGEMENT PERSONS AND/OR RELATED PARTIES
Key management person and/or related party Transaction2019
$
2018
$
Partnership comprising entities controlled by current
director Mr G Baker and former directors Mr J Moore, Mr D
Edwards and Mr F Maher.
Expense - Rent on Division St business premises.
1,520,000 1,598,815
Kirk Mining Consultants - a company controlled by current
director Mr L Kirk.
Expense - Mining consulting fees
20,112 40,860
Hensman Properties Pty Ltd - a company controlled by
current director Mr R. Ryan.
Expense - Consulting fees 4,290 43,658
Gateway Equipment Parts & Services Pty Ltd - a company
controlled by current director Mr G Baker and former
directors Mr D Edwards, Mr F Maher and Mr J Moore.
Expense - Hire of equipment and purchase of equipment, parts and services.
2,456,742 2,381,300
Amounts payable at year end arising from the above
transactions (Receivables Nil).
Gateway Equipment Parts & Services Pty Ltd - a company
controlled by current director Mr G Baker and
former directors Mr D Edwards, Mr F Maher
and Mr J Moore.
177,241 263,548
This directors’ report, incorporating the remuneration report, is signed in accordance with a resolution of the Board of
Directors.
On behalf of the Directors
Chris Tuckwell
Managing Director
27th day of September, 2019
Perth
43MACA LIMITED ANNUAL REPORT 2019

AUDITOR’S INDEPENDENCE DECLARATION
Liability limited by a scheme approved under Professional Standards Legislation. Moore Stephens - ABN 16 874 357 907. An independent member of Moore Global Network
Limited - members in principal cities throughout the world. The Perth Moore Stephens firm is not a partner or agent of any other Moore Global Network Limited member firm.
44 MACA LIMITED ANNUAL REPORT 2019

The Board of MACA Limited
is committed to ensuring that
the Company’s obligations and
responsibilities to its stakeholders
are fulfilled through its corporate
governance practices. MACA is
committed to the development of a
culture that delivers our Promise – We
Care, We are Flexible and We Deliver,
and the Core Values of the Company
– People First, Exceed Expectations,
Continuous Improvement,
Accountability and Community. We
believe that operating in accordance
with the corporate governance
guidelines enhances the delivery of the
above expectations.
This checklist reports on MACA’s key
governance principles and practices
which are reviewed and revised as
appropriate to reflect changes in
law and developments in corporate
governance. A complete Corporate
Governance Statement (“CGS”) and
all Charters, Policies, Procedures,
Disclosures, Definitions, Codes and
Strategies are available for viewing
on the Company’s website under the
Corporate Governance tab.
As required by the Australian Securities
Exchange Limited (“ASX”) Listing
Rules, the Corporate Governance
Statement contained on the Company
website and in reference to this
checklist reports on:
- The extent to which the Company
has followed the Corporate
Governance recommendations
contained in the ASX Corporate
Governance Council’s Corporate
Governance Principles and
Recommendations (4th Edition);
and
- The reasons for any departures
from the Corporate Governance
Council’s Corporate Governance
Principles and Recommendations
(4th Edition), in compliance with
the “if not, why not” regime.
OVERALL APPROACH TO
CORPORATE GOVERNANCE
The Board as a whole reviews
and makes changes in line with
recommendations made by
individual Board members and as
a result of this focus, the Board is
satisfied that the Company meets
the Corporate Governance Council’s
Corporate Governance Principles and
Recommendations with departures
as disclosed below. There were
no departures during the year. A
checklist cross-referencing the
Corporate Governance Council’s
Corporate Governance Principles and
Recommendations to the relevant
sections of the Companies Corporate
Governance Statement (CGS) is shown
below.
CORPORATE GOVERNANCE STATEMENT CHECKLIST
ASX CORPORATE GOVERNANCE
PRINCIPLES AND BEST PRACTICE RECOMMENDATIONS
REFERENCE AND
IF COMPLIANT
PRINCIPLE 1 - LAY SOLID FOUNDATIONS FOR MANAGEMENT AND OVERSIGHT
A listed entity should clearly delineate the respective roles and responsibilities of its board
and management and regularly review their performance.
Recommendation 1.1 1.1
Board Charter in CGS A listed entity should have and disclose a board charter setting out:
(a) the respective roles and responsibilities of its board and management; and
(b) those matters expressly reserved to the board and those delegated to management.
Recommendation 1.2 1.2
A listed entity should:
(a) undertake appropriate checks before appointing a director or senior executive or putting
someone forward for election as a director; and
(b) provide security holders with all material information in its possession relevant to a
decision on whether or not to elect or re-elect a director.
Recommendation 1.3 1.3
Remuneration Report in CGSA listed entity should have a written agreement with each director and senior executive
setting out the terms of their appointment.
Recommendation 1.4 1.4
Board Charter in CGSThe company secretary of a listed entity should be accountable directly to the board,
through the chair, on all matters to do with the proper functioning of the board.
✓
✓
✓
✓
45MACA LIMITED ANNUAL REPORT 2019

ASX CORPORATE GOVERNANCE
PRINCIPLES AND BEST PRACTICE RECOMMENDATIONS
REFERENCE AND
IF COMPLIANT
Recommendation 1.5 1.5
Diversity Procedure in CGSA listed entity should:
(a) have and disclose a diversity policy;
(b) through its board or a committee of the board set measurable objectives for achieving
gender diversity in the composition of its board, senior executives and workforce generally;
and
(c) disclose in relation to each reporting period:
(1) the measurable objectives set for that period to achieve gender diversity;
(2) the entity’s progress towards achieving those objectives;
(3) either:
(A) the respective proportions of men and women on the Board, in senior executive
positions and across the whole workforce (including how the entity has defined
“senior executive” for these purposes); or
(B) if the entity is a “relevant employer” under the Workplace Gender Equality Act,
the entity’s most recent “Gender Equality Indicators”, as defined in and published
under the Act.
Recommendation 1.6 1.6
Disclosure - Performance
Evaluation in CGS
A listed entity should:
(a) have and disclose a process for periodically evaluating the performance of the board, its
committees and individual directors; and
(b) disclose for each reporting period whether a performance evaluation has been undertaken
in accordance with that process during or in respect of that period.
Recommendation 1.7 1.7
Disclosure - Performance
Evaluation in CGS
A listed entity should:
(a) have and disclose a process for evaluating the performance of its senior executives at least
once every reporting period; and
(b) disclose for each reporting period whether a performance evaluation has been undertaken
in accordance with that process during or in respect of that period.
PRINCIPLE 2 - STRUCTURE THE BOARD TO BE EFFECTIVE AND ADD VALUE
The board of a listed entity should be an appropriate size and collectively have the skills,
commitment and knowledge of the entity and the industry in which it operates, to enable it to
discharge its duties effectively and to add value.
Recommendation 2.1 2.1
Directors Report
Board Charter in CGS
Nomination Committee
Charter in CGS
The board of a listed entity should:
(a) have a nomination committee which:
(1) has at least three members, a majority of whom are independent directors; and
(2) is chaired by an independent director, and disclose:
(3) the charter of the committee;
(4) the members of the committee; and
(5) as at the end of each reporting period, the number of times the committee met throughout
the period and the individual attendances of the members at those meetings; or
(b) if it does not have a nomination committee, disclose the fact and the processes it employs
to address board succession issues and to ensure that the board has the appropriate balance
of skills, knowledge, experience, independence and diversity to enable it to discharge its
duties and responsibilities effectively.
CORPORATE GOVERNANCE STATEMENT CHECKLIST CONTINUED
✓
✓
✓
✓
46 MACA LIMITED ANNUAL REPORT 2019

ASX CORPORATE GOVERNANCE
PRINCIPLES AND BEST PRACTICE RECOMMENDATIONS
REFERENCE AND
IF COMPLIANT
Recommendation 2.2 2.2
A listed entity should have and disclose a Board skills matrix setting out the mix of skills that
the Board currently has or is looking to achieve in its membership.
Recommendation 2.3 2.3
Definition of
Independence in CGS
A listed entity should disclose:
(a) the names of the directors considered by the Board to be independent directors;
(b) if a Director has an interest, position, or relationship of the type described in the
recommendations but the board is of the opinion that it does not compromise the
independence of the director, the nature of the interest, position or relationship in question
and an explanation of why the board is of that opinion; and
(c) the length of service of each director.
Recommendation 2.4 2.4
A majority of the board of a listed entity should be independent directors.
Recommendation 2.5
The chair of the board of a listed entity should be an independent director and, in particular,
should not be the same person as the CEO of the entity.
2.5
Recommendation 2.6 2.6
Board Charter in CGS
Nomination Committee
Charter in CGS
A listed entity should have a program for inducting new directors and for periodically
reviewing whether there is a need for existing directors to undertake professional
development to maintain the skills and knowledge needed to perform their role as directors
effectively.
PRINCIPLE 3 - INSTIL A CULTURE OF ACTING LAWFULLY, ETHICALLY AND RESPONSIBLY
A listed entity should instil and continually reinforce a culture across the organisation of acting
lawfully, ethically and responsibly.
Recommendation 3.1 3.1
Corporate Code of
Conduct in CGS
A listed entity should articulate and disclose its values.
Recommendation 3.2
A listed entity should:
3.2
Corporate Code of
Conduct in CGS(a) have and disclose a code of conduct for its directors, senior executives and employees; and
(b) ensure that the board or a committee of the board is informed of any material breaches of
that code.
Recommendation 3.3 3.3
Whistleblower
Procedure in CGS
A listed entity should:
(a) have and disclose a whistleblower policy; and
(b) ensure that the board or a committee of the board is informed of any material incidents
reported under that policy.
Recommendation 3.4 3.4
Anti-Bribery and
Corruption Procedure
in CGS
A listed entity should:
(a) have and disclose an anti-bribery and corruption policy; and
(b) ensure that the board or a committee of the board is informed of any material incidents
reported under that policy.
✓
✓
✓
✓
✓
✓
✓
✓
✓
47MACA LIMITED ANNUAL REPORT 2019

ASX CORPORATE GOVERNANCE
PRINCIPLES AND BEST PRACTICE RECOMMENDATIONS
REFERENCE AND
IF COMPLIANT
PRINCIPLE 4 - SAFEGUARD THE INTEGRITY OF CORPORATE REPORTS
A listed entity should have appropriate processes to verify the integrity of its corporate reports.
Recommendation 4.1 4.1
Audit Committee Charter in
CGS
The board of a listed entity should :
(a) have an audit committee which:
(1) has at least three members, all of whom are non-executive directors and a majority of
whom are independent directors; and
(2) is chaired by an independent director, who is not chair of the board, and disclose:
(3) the charter of the committee;
(4) the relevant qualifications and experience of the members of the committee; and
(5) in relation to each reporting period, the number of times the committee met throughout
the period and the individual attendances of the members at those meetings.
Recommendation 4.2 4.2
The Board of a listed entity should, before it approves the entity’s financial statements for a
financial period, receive from its Managing Director and Chief Financial Officer a declaration
that, in their opinion the financial records of the entity have been properly maintained and that
the financial statements comply with the appropriate accounting standards and give a true
and fair view of the financial position and performance of the entity and that the opinion has
been formed on the basis of a sound system of risk management and internal control which is
operating effectively.
Recommendation 4.3 4.3
A listed entity should disclose its process to verify the integrity of any periodic corporate
report it releases to the market that is not audited or reviewed by an external auditor.
PRINCIPLE 5 - MAKE TIMELY AND BALANCED DISCLOSURE
A listed entity should make timely and balanced disclosure of all matters concerning it that a
reasonable person would expect to have a material effect on the price or value of its securities.
Recommendation 5.1 5.1
Continuous
Disclosure in CGS
Compliance
Procedure in CGS
A listed entity should have and disclose a written policy for complying with its continuous
disclosure obligations under Listing Rule 3.1.
Recommendation 5.2 5.2
A listed entity should ensure that its board receives copies of all material announcements
promptly after they have been made.
Recommendation 5.3 5.3
A listed entity that gives a new and substantive investor or analyst presentation should release
a copy of the presentation materials on the ASX Market Announcements Platform ahead of the
presentation.
CORPORATE GOVERNANCE STATEMENT CHECKLIST CONTINUED
✓
✓
✓
✓
✓
✓
48 MACA LIMITED ANNUAL REPORT 2019

ASX CORPORATE GOVERNANCE
PRINCIPLES AND BEST PRACTICE RECOMMENDATIONS
REFERENCE AND
IF COMPLIANT
PRINCIPLE 6 - RESPECT THE RIGHTS OF SECURITY HOLDERS
A listed entity should provide its security holders with appropriate information and facilities to
allow them to exercise their rights as security holders effectively.
Recommendation 6.1 6.1
Shareholder
Communication
Strategy in CGS
A listed entity should provide information about itself and its governance to investors via its
website.
Recommendation 6.2 6.2
A listed entity should have an investor relations program that facilitates effective two-way
communication with investors.
Recommendation 6.3 6.3
Investor Centre in CGSA listed entity should disclose how it facilitates and encourages participation at meetings of
security holders.
Recommendation 6.4 6.4
Shareholder
Communication
Strategy
in CGS
A listed entity should ensure that all substantive resolutions at a meeting of security holders
are decided by a poll rather than by a show of hands.
Recommendation 6.5 6.4
Shareholder
Communication
Strategy in CGS
A listed entity should give security holders the option to receive communications from, and
send communications to, the entity and its security registry electronically.
PRINCIPLE 7 - RECOGNISE AND MANAGE RISK
A listed entity should establish a sound risk management framework and periodically review
the effectiveness of that framework.
Recommendation 7.1 7.1
Risk Committee
Charter in CGSThe Board of a listed entity should:
(a) have a committee or committees to oversee risk, each of which:
(1) has at least three members, a majority of whom are independent directors; and
(2) is chaired by an independent director, and disclose:
(3) the charter of the committee;
(4) the members of the committee; and
(5) as at the end of each reporting period, the number of times the committee met throughout
the period and the individual attendances of the members at those meetings.
Recommendation 7.2 7.2
Disclosure -
Risk Management in CGS
The board or a committee of the board should:
(a) review the entity’s risk management framework at least annually to satisfy itself that it
continues to be sound and that the entity is operating with due regard to the risk appetite set
by the board; and
(b) disclose, in relation to each reporting period, whether such a review has taken place.
✓
✓
✓
✓
✓
✓
✓
49MACA LIMITED ANNUAL REPORT 2019

ASX CORPORATE GOVERNANCE
PRINCIPLES AND BEST PRACTICE RECOMMENDATIONS
REFERENCE AND
IF COMPLIANT
Recommendation 7.3 7.3
In CGSA listed entity should disclose:
(a) if it has an internal audit function, how the function is structured and what role it performs;
and
(b) if it does not have an internal audit function, that fact and the processes it employs for
evaluating and continually improving the effectiveness of its governance, risk management
and internal control processes.
Recommendation 7.4
A listed entity should disclose whether it has any material exposure to environmental or social
risks and, if it does, how it manages those risks.
7.4
In CGS
PRINCIPLE 8 - REMUNERATE FAIRLY AND RESPONSIBLY
A listed entity should pay director remuneration sufficient to attract and retain high quality
directors and design its executive remuneration to attract, retain and motivate high quality
senior executives and to align their interests with the creation of value for security holders and
with the entity’s values and risk appetite.
Recommendation 8.1 8.1
Remuneration Report
in CGS
Remuneration Committee
Charter in CGS
The board of a listed entity should:
(a) have a remuneration committee which:
(1) has at least three members, a majority of whom are independent directors; and
(2) is chaired by an independent director, and disclose:
(3) the charter of the committee;
(4) the members of the committee; and
as at the end of each reporting period, the number of times the committee met throughout the
period and the individual attendances of the members at those meetings.
Recommendation 8.2 8.2
Remuneration Report
in CGS A listed entity should separately disclose its policies and practices regarding the remuneration
of non-executive directors and the remuneration of executive directors and other senior
executives.
Recommendation 8.3 8.3
Remuneration Report
in CGSA listed entity which has an equity-based remuneration scheme should :
(a) have a policy on whether participants are permitted to enter into transactions (whether
through the use of derivatives or otherwise) which limit the economic risk of participating in
the scheme; and
(b) disclose that policy or a summary of it.
CORPORATE GOVERNANCE STATEMENT CHECKLIST CONTINUED
✓
✓
✓
✓
✓
50 MACA LIMITED ANNUAL REPORT 2019

DIRECTORS’ DECLARATION
The directors of the company declare that:
1. The financial statements set out on pages 52 to 95 are in accordance with the Corporations Act 2001 and:
(a) comply with Accounting Standards which as stated in the accounting policies included in the financial statements,
constitutes explicit and unreserved compliance with International Financial Reporting Standards (IFRS); and
(b) give a true and fair view of the financial position as at 30 June 2019 and of the performance for the year ended on
that date of the company and consolidated group;
2. The Managing Director (acting as Chief Executive Officer) and Chief Finance Officer have each declared that:
(a) the financial records of the Group for the financial year have been properly maintained in accordance with s286 of
the Corporations Act 2001;
(b) the financial statements and notes for the financial year comply with the International Financial Reporting
Standards; and
(c) the financial statements and notes for the financial year give a true and fair view of the financial performance and
results of the entity.
In the directors’ opinion there are reasonable grounds to believe that the Group will be able to pay its debts as and when
they become due and payable.
This declaration is made in accordance with a resolution of the Board of Directors and is signed for and on behalf of the
directors by:
Chris Tuckwell
Managing Director
Dated at Perth this 27 day of September, 2019
51MACA LIMITED ANNUAL REPORT 2019
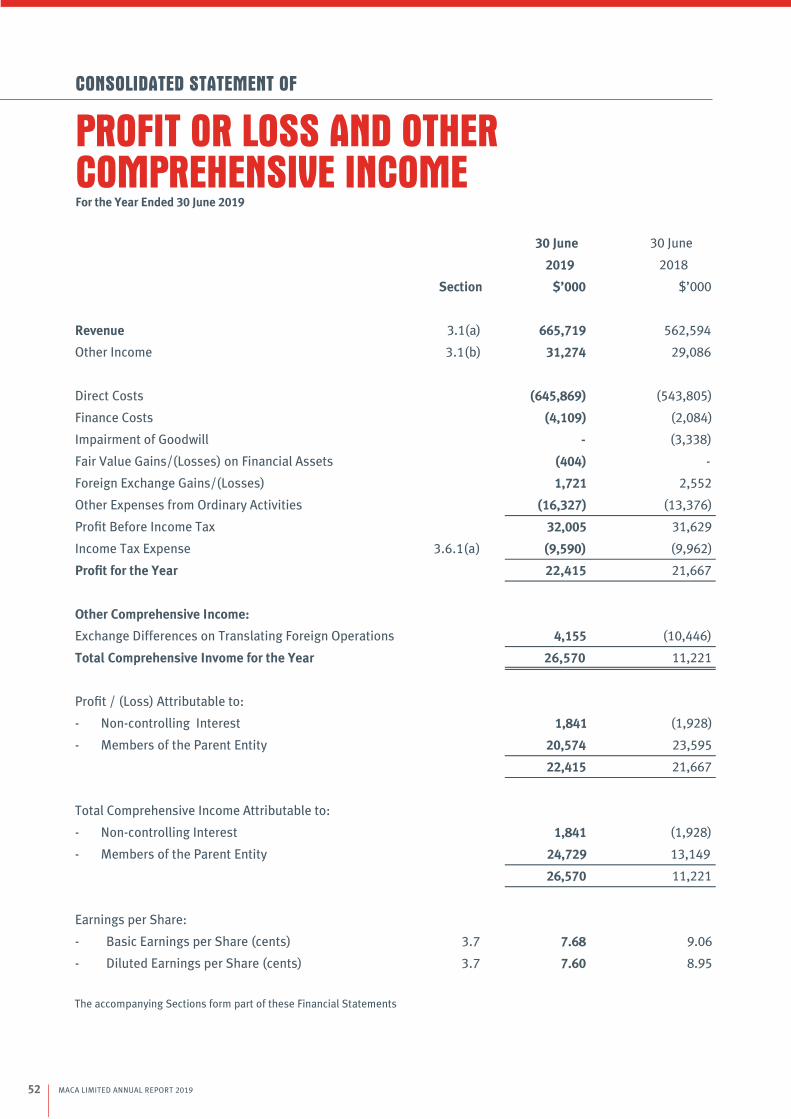
CONSOLIDATED STATEMENT OF
30 June 30 June
2019 2018
Section $’000 $’000
Revenue 3.1(a) 665,719 562,594
)b(1.3Other Income 31,274 29,086
Direct Costs (645,869) (543,805)
Finance Costs (4,109) (2,084)
Impairment of Goodwill - (3,338)
Fair Value Gains/(Losses) on Financial Assets (404) -
Foreign Exchange Gains/(Losses) 1,721 2,552
Other Expenses from Ordinary Activities (16,327) (13,376)
Profit Before Income Tax 32,005 31,629
)a(1.6.3Income Tax Expense (9,590) (9,962)
514,22Profit for the Year 21,667
Other Comprehensive Income:
Exchange Differences on Translating Foreign Operations 4,155 (10,446)
075,62Total Comprehensive Invome for the Year 11,221
Profit / (Loss) Attributable to:
- Non-controlling Interest 1,841 (1,928)
- Members of the Parent Entity 20,574 23,595
22,415 21,667
Total Comprehensive Income Attributable to:
- Non-controlling Interest 1,841 (1,928)
- Members of the Parent Entity 24,729 13,149
26,570 11,221
Earnings per Share:
7.3Basic Earnings per Share (cents) - 7.68 9.06
7.3Diluted Earnings per Share (cents) - 7.60 8.95
The accompanying Sections form part of these Financial Statements
PROFIT OR LOSS AND OTHER COMPREHENSIVE INCOMEFor the Year Ended 30 June 2019
52 MACA LIMITED ANNUAL REPORT 2019

CONSOLIDATED STATEMENT OF
30 June 30 June
2019 2018
000’$SectionCurrent Assets $’000
1.1.5Cash and Cash Equivalents 59,292 108,239
1.4Trade and Other Receivables 175,649 124,687
1.4Loans to Other Companies 22,300 7,618
2.4Inventory 14,306 13,649
2.4Work in Progress 1,717 (2,023)
1.4Financial Assets 7,076 2,257
3.4Other Assets 1,815 1,395
551,282Total Current Assets 255,822
Non-Current Assets
1.4Trade and Other Receivables 15,139 39,165
4.4Property, Plant and Equipment 238,280 114,785
1.4Loans to Other Companies 25,655 19,975
1.4Financial Assets 6,514 2,179
5.4Goodwill 3,187 3,187
)a(2.6.3Deferred Tax Assets 13,513 11,265
882,203Total Non-Current Assets 190,556
344,485Total Assets 446,378
Current Liabilities
6.4Trade and Other Payables 87,942 64,620
1.2.5Financial Liabilities 42,272 14,991
)b(2.6.3Current Tax Liabilities 3,732 1,226
7.4Short-Term Provisions 13,657 11,838
206,741Total Current Liabilities 92,675
Non-Current Liabilities
)b(2.6.3Deferred Tax Liabilities 4,325 2,958
1.2.5Financial Liabilities 99,848 29,910
471,401Total Non-Current Liabilities 32,868
677,152Total Liabilities 125,543
666,233Net Assets 320,835
Equity
5.5Issued Capital 269,806 269,806
6.5Reserves (13,793) (17,948)
Retained Profits 73,496 67,661
Parent Interest 329,509 319,519
Non-Controlling Interest 3,157 1,316
666,233Total Equity 320,835
The accompanying Sections form part of these Financial Statements
FINANCIAL POSITIONAs at 30 June 2019
53MACA LIMITED ANNUAL REPORT 2019

Issued Capital
Retained Profits
Outside Equity
Interest
General Reserves
Option Reserve
FX Reserve
Total
$’000 $’000 $’000 $’000 $’000 $’000 $’000
Balance at 1 Jul 2017 211,333 62,652 3,244 (5,887) 590 (2,205) 269,727
Profit/(Loss) for the Period - 23,595 (1,928) - - - 21,667
SUB-TOTAL 211,333 86,247 1,316 (5,887) 590 (2,205) 291,394
Other Comprehensive Income:
Forex in Translating Foreign Operations
- - - - - (10,446) (10,446)
SUB-TOTAL 211,333 86,247 1,316 (5,887) 590 (12,651) 280,948
Shares Issued 60,176 - - - - - 60,176
Options/Rights Issued (1,703) - - - - - (1,703)
Dividends Paid - (18,586) - - - - (18,586)
Balance at 30 Jun 2018 269,806 67,661 1,316 (5,887) 590 (12,651) 320,835
Balance at 1 Jul 2018 269,806 67,661 1,316 (5,887) 590 (12,651) 320,835
Profit for the Period - 20,574 1,841 - - - 22,415
SUB-TOTAL 269,806 88,235 3,157 (5,887) 590 (12,651) 343,251
Other Comprehensive Income:
Forex in Translating Foreign Operations
- - - - - 4,155 4,155
SUB-TOTAL 269,806 88,235 3,157 (5,887) 590 (8,496) 347,406
Shares Issued - - - - - - -
Options/Rights Issued - - - - - - -
Dividends Paid - (14,740) - - - - (14,740)
Balance at 30 Jun 2019 269,806 73,496 3,157 (5,887) 590 (8,496) 332,666
The accompanying Sections form part of these Financial Statements
CONSOLIDATED STATEMENT OF
CHANGES OF EQUITYFor the Year Ended 30 June 2019
54 MACA LIMITED ANNUAL REPORT 2019

30 June 30 June
2019 2018
Section $’000 $’000
Cash Flows from Operating Activities
Receipts from Customers 629,567 529,526
Payments to Suppliers and Employees (568,027) (509,532)
Dividends Received - 147
Interest Received 8,055 4,342
Interest Paid (4,109) (2,811)
Income Tax Paid (7,965) (12,990)
Net Cash Provided By Operating Activities 5.1.2 57,521 8,682
Cash Flow from Investing Activities
Proceeds from Sale of Investments 10,348 -
Proceeds from Sale of Property, Plant and Equipment 1,620 5,633
Purchase of Property, Plant and Equipment (89,318) (38,769)
Net Loans Provided to Customers (19,925) (17,918)
Purchase of Investments (19,755) -
)030,711(Net Cash Used In Investing Activities (51,054)
Cash Flow from Financing Activities
Net Proceeds from Share Issue - 58,473
Proceeds from Borrowings 47,965 -
Repayment of Borrowings (27,337) (694)
Dividends Paid by the Parent (14,740) (18,586)
788,5Net Cash Provided by Financing Activities 39,193
Net Increase/(Decrease) in Cash Held (53,622) (3,179)
Effect of Forex Rate Changes on Translating Foreign Operations 4,676 (590)
Cash and Cash Equivalents at the Beginning of the Period 108,239 112,008
Cash and Equivalents at the End of Period 5.1.1 59,292 108,239
The accompanying Sections form part of these Financial Statements
CONSOLIDATED STATEMENT OF
CASH FLOWSFor the Year Ended 30 June 2019
55MACA LIMITED ANNUAL REPORT 2019

SECTION 1 GENERAL INFORMATION
1.1 REPORTING ENTITY
MACA Limited (MLD) is a limited company incorporated
in Australia. The addresses of the Company’s registered
office and principal places of business are disclosed in
the Corporate Directory. The Principal activities of the
Group are described in the Directors’ Report.
1.2 STATEMENT OF COMPLIANCE
The consolidated financial statements and notes
represent those of MACA Limited and Controlled Entities
(the Group).
The Financial Statements comprise the consolidated
Financial Statements of the Group. For the purposes
of preparing the consolidated Financial Statements,
the Group is a for-profit entity. Accounting Standards
include Australian Accounting Standards. Compliance
with Australian Accounting Standards ensures that
the Financial Statements and Sections comply with
International Financial Reporting Standards (“IFRS”).
1.3 BASIS OF PREPARATION
The financial statements are general purpose financial
statements that have been prepared in accordance with
Australian Accounting Standards, Australian Accounting
Interpretations, other authoritative pronouncements
of the Australian Accounting Standards Board and the
Corporations Act 2001. The Group is a for profit entity for
financial reporting purposes under Australian Accounting
Standards. These financial statements also comply with
International Financial Reporting standards as issued by
the International Accounting Standards Board (IASB).
Australian Accounting Standards set out accounting
policies that the AASB has concluded would result in
financial statements containing relevant and reliable
information about transactions, events and conditions.
Compliance with Australian Accounting Standards
ensures that the financial statements and notes also
comply with International Financial Reporting Standards
as issued by the IASB. Material accounting policies
adopted in the preparation of these financial statements
are presented below and have been consistently applied
unless otherwise stated.
These financial statements have been prepared on an
accruals basis and are based on historical costs,
modified, where applicable, by the measurement at fair
value of selected non-current assets, financial assets
and financial liabilities. These financial statements are
presented in Australian dollars.
1.4 BASIS OF CONSOLIDATION
The consolidated financial statements incorporate the
assets and liabilities of all subsidiaries of MACA Limited
(the ‘Company’) as at 30 June 2019 and the results of
all subsidiaries for the year then ended. MACA Limited
and its subsidiaries together are referred to in these
financial statements as the ‘Group’.
Subsidiaries are all those entities over which the
Company has control. The Company controls an
entity when it is exposed to, or has rights to, variable
returns from its involvement with the entity and has
the ability to affect those returns through its power
to direct the activities of the entity. Subsidiaries are
fully consolidated from the date on which control is
transferred to the Group. They are de-consolidated from
the date that control ceases.
Intercompany transactions, balances and unrealised
gains on transactions between entities in the Group
are eliminated. Unrealised losses are also eliminated
unless the transaction provides evidence of the
impairment of the asset transferred. Accounting policies
of subsidiaries have been changed where necessary
to ensure consistency with the policies adopted by the
Group.
The acquisition of subsidiaries is accounted for using
the acquisition method of accounting. A change in
ownership interest, without the loss of control, is
accounted for as an equity transaction, where the
difference between the consideration transferred and
the book value of the share of the non-controlling
interest acquired is recognised directly in equity
attributable to the parent.
Non-controlling interest in the results and equity of
subsidiaries are shown separately in the statement
of profit or loss and other comprehensive income,
statement of financial position and statement of
changes in equity of the Group. Losses incurred by the
Group are attributed to the non-controlling interest
in full.
SECTIONS TO THE FINANCIAL STATEMENTSFor the Year Ended 30 June 2019
56 MACA LIMITED ANNUAL REPORT 2019

1.5 NEW ACCOUNTING STANDARDS APPLIED DURING THE
PERIOD
The Group has adopted all of the new and revised
Standards and Interpretations issued by the Australian
Accounting Standards Board (the AASB) that are
relevant to its operations and effective for an accounting
period that begins on or after 1 January 2018.
New and revised Standards and amendments thereof
and Interpretations effective for the current year that are
relevant to the Group include:
- AASB 9 Financial Instruments and related amending
Standards
- AASB 15 Revenue from Contracts with Customers
and related amending Standards
In the current year, the Group has applied AASB 9
Financial Instruments (as amended) and the related
consequential amendments to other Accounting
Standards that are effective for an annual period
that begins on or after 1 January 2018. The transition
provisions of AASB 9 allow an entity not to restate
comparatives, which the Group has adopted.
AASB 9 requires an expected credit loss (ECL) model for
trade receivables and loans as opposed to an incurred
credit loss model under AASB 139. The ECL model
requires the Group to account for expected credit losses
in trade receivables and financial instruments at an
amount equal to the lifetime expected credit losses if
the credit risk on that receivable or financial instrument
has increased significantly since initial recognition, or
if the receivable or financial instrument is a purchased
or originated credit impaired financial asset. However,
if the credit risk has not increased significantly since
initial recognition (except for a purchased or originated
credit impaired financial asset), the Group is required to
measure the loss allowance at an amount equal to 12
months ECL. AASB 9 also allows a simplified approach
for measuring the loss allowance at an amount equal to
lifetime ECL for trade receivables, contract assets and
lease receivables in certain circumstances.
The directors of the Company reviewed and assessed
the Group’s existing financial assets as at 1 July 2018
based on the facts and circumstances that existed at
that date and concluded that the application of AASB
9 has had no material impact on the Group’s financial
performance or position. In summary AASB 9 introduced
new requirements for:
- The classification and measurement of financial
assets and financial liabilities,
- Impairment of financial assets, and
- General hedge accounting
AASB 15 Revenue from Contracts with Customers and
related amending Standards
In the current year, the Group has applied AASB 15
Revenue from Contracts with Customers (as amended)
which is effective for an annual period that begins on
or after 1 January 2018. AASB 15 introduced a 5-step
approach to revenue recognition. Far more prescriptive
guidance has been added in AASB 15 to deal with
specific scenarios.
The Group has applied AASB 15 in accordance with
the fully retrospective transitional approach. The
Group’s accounting policies for its revenue streams are
disclosed in more detail in note 3.1
The directors of the Company have reviewed and
assessed the Group’s contracts with customers and
determined that the application of AASB 15 has not
had a material impact on the financial position and/
or financial performance of the Group. There was no
material impact on adoption of the standard and no
adjustment made to current or prior period amounts.
The adoption of AASB15 Revenue from contracts with
customers has not resulted in any significant changes
to accounting policies nor has it materially impacted on
amounts recognised in the financial statements.
1.6 NEW ACCOUNTING STANDARDS FOR APPLICATION IN
FUTURE PERIODS
The AASB has issued a number of new and amended
Accounting Standards that have mandatory application
dates for future reporting periods, some of which are
relevant to the Group. The directors have decided
not to early-adopt any of the new and amended
pronouncements. The following sets out their
assessment of the pronouncements that are relevant to
the Group but applicable in future reporting periods.
- AASB 16: Leases (applicable to annual reporting
periods beginning on or after 1 January 2019)
The Group has chosen not to early-adopt AASB 16.
However, the Group has conducted a preliminary
assessment of the impact of this new Standard, as
follows.
A core change resulting from applying AASB 16 is that
most leases will be recognised on the balance sheet
by lessees as the standard no longer differentiates
between operating and finance leases. An asset and
SECTIONS TO THE FINANCIAL STATEMENTSFor the Year Ended 30 June 2019
57MACA LIMITED ANNUAL REPORT 2019

a financial liability are recognised in accordance to this new Standard. There are, however, two exceptions allowed: short-term and low-value leases. The accounting for the Group’s operating leases will be primarily affected by this new Standard.
AASB 16 will be applied by the Group from its mandatory adoption date of 1 July 2019. The comparative amounts for the year prior to first adoption will not be restated, as the Group has chosen to apply AASB 16 retrospectively with cumulative effect. While the right-of-use assets for property leases will be measured on transition as if the new rules had always been applied, all other right-of-use assets will be measured at the amount of the lease liability on adoption.
The Group’s non-cancellable operating lease commitments amount to $16.1m as at the reporting date, see section 3.4(a). The Group intends to adopt the short term lease exception for leases with terms of less than 12 months, which would equate to rental expense of approximately $1m. All impacts are based on current estimates which are subject to finalisation prior to final implementation.
Based on a preliminary assessment, the Group has estimated that on 1 July 2019, a right-of-use asset of approximately $12.1m and lease liabilities of approximately $12.7m will be required to be recognised.
The Group expects that net profit after tax will decrease by approximately $0.3m for 2020 as a result of adopting the new standard. Adjusted EBITDA used to measure segment results is expected to increase by approximately $1.5m as the operating lease payments were included in EBITDA,
but the amortisation of the right-of-use assets and interest on the lease liability are excluded from this measure.
The repayment of the principal portion of the lease liabilities will be classified as cash flows from financing activities, thus increasing operating cash flows and decreasing financing cash flows by approximately $1.85m.
Given that the Group’s activities as a lessor will not be materially impacted by this new Standard, the Group does not expect any significant impact on its financial statement from a lessor perspective. Nonetheless, starting from 2020, additional disclosures will be required.
1.7 COMPARATIVE FIGURES
When required by Accounting Standards, comparative figures have been adjusted to conform to changes in presentation for the current financial year.
When the Group applies an accounting policy retrospectively, makes a retrospective restatement or reclassifies items in its financial statements, a statement of financial position as at the beginning of the earliest comparative period will be disclosed.
1.8 ROUNDING OF AMOUNTS
The Company has applied the relief available to it under ASIC CI 2016/191 and accordingly, amounts in the financial statements and directors’ report have been
rounded off to the nearest $1,000.
1.6 NEW ACCOUNTING STANDARDS FOR APPLICATION IN FUTURE PERIODS (CONTINUED)
SECTION 2 CRITICAL ACCOUNTING ESTIMATES AND JUDGEMENTS
The Directors evaluate estimates and judgments incorporated into the financial report based on historical knowledge and
best available current information. Estimates assume a reasonable expectation of future events and are based on current
trends and economic data, obtained both externally and within the Group.
KEY ESTIMATES AND JUDGEMENTS
Impairment – other assets
The Group assesses impairment at the end of each reporting
period by evaluating conditions and events specific to
the Group that may be indicative of impairment triggers.
Recoverable amounts of relevant assets are reassessed
using value-in-use calculations which incorporate various
key assumptions.
The value in use calculations with respect to assets require
an estimation of the future cash flows expected to arise
from each cash generating unit and a suitable discount rate
to apply to these cash flows to calculate net present value.
The Directors have determined that there is no adjustment
required to the carrying value of assets in the current
reporting period.
Impairment – trade and other receivables
As at 30 June 2019, the Group’s trade and other receivables
amounted to $190,787,000 (2018: $163,852,000).
Based on the Group’s historical credit loss experience,
trade receivables exhibited different loss patterns for each
revenue segment. Within each revenue segment, the Group
has common customers across the different geographical
regions and applies credit evaluations by customer.
Accordingly, management has determined the expected
loss rates by grouping the receivables across geographical
regions in each revenue segment. No allowance for
impairment for trade and other receivables and contract
assets respectively was recognised as at 30 June 2019
(2018: nil).
SECTIONS TO THE FINANCIAL STATEMENTSFor the Year Ended 30 June 2019
58 MACA LIMITED ANNUAL REPORT 2019
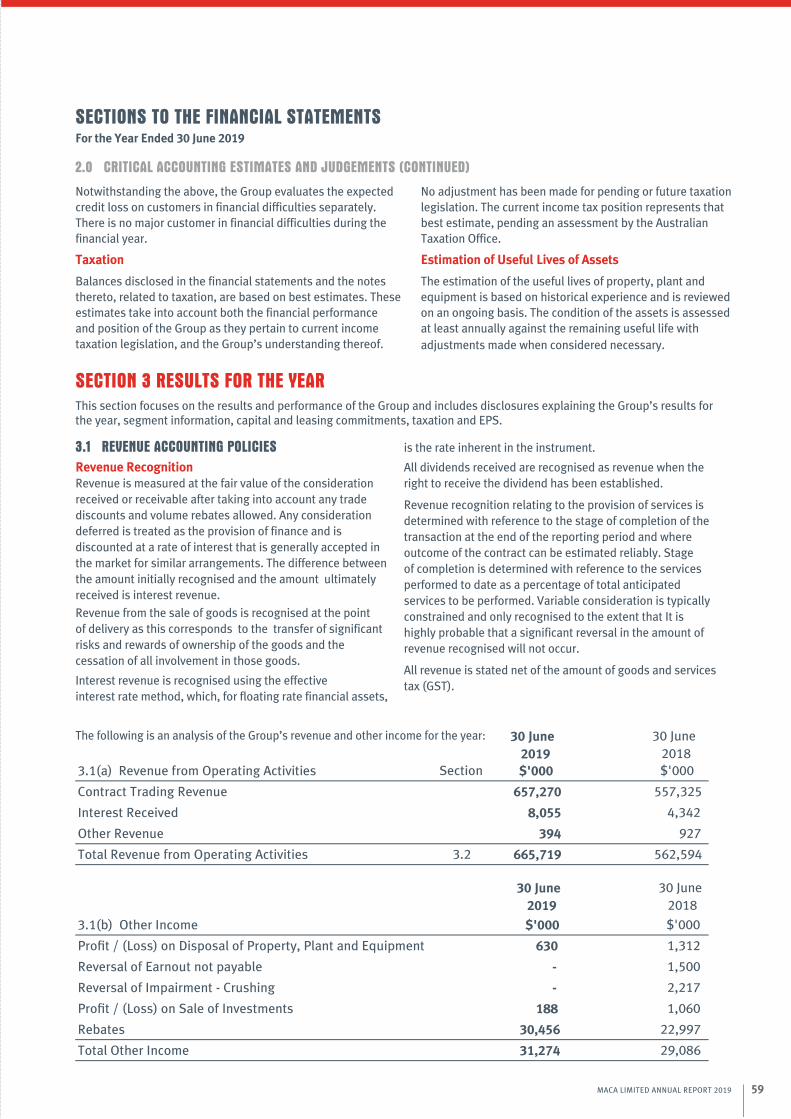
Notwithstanding the above, the Group evaluates the expected
credit loss on customers in financial difficulties separately.
There is no major customer in financial difficulties during the
financial year.
Taxation
Balances disclosed in the financial statements and the notes
thereto, related to taxation, are based on best estimates. These
estimates take into account both the financial performance
and position of the Group as they pertain to current income
taxation legislation, and the Group’s understanding thereof.
No adjustment has been made for pending or future taxation
legislation. The current income tax position represents that
best estimate, pending an assessment by the Australian
Taxation Office.
Estimation of Useful Lives of Assets
The estimation of the useful lives of property, plant and
equipment is based on historical experience and is reviewed
on an ongoing basis. The condition of the assets is assessed
at least annually against the remaining useful life with
adjustments made when considered necessary.
30 June 30 June
2019 2018
3.1(a) Revenue from Operating Activities Section $'000 $'000
Contract Trading Revenue 657,270 557,325
Interest Received 8,055 4,342
Other Revenue 394 927
Total Revenue from Operating Activities 3.2 665,719 562,594
30 June 30 June
2019 2018
3.1(b) Other Income $'000 $'000
Profit / (Loss) on Disposal of Property, Plant and Equipment 630 1,312
Reversal of Earnout not payable - 1,500
Reversal of Impairment - Crushing - 2,217
Profit / (Loss) on Sale of Investments 188 1,060
Rebates 30,456 22,997
Total Other Income 31,274 29,086
The following is an analysis of the Group’s revenue and other income for the year:
SECTIONS TO THE FINANCIAL STATEMENTSFor the Year Ended 30 June 2019
SECTION 3 RESULTS FOR THE YEAR
This section focuses on the results and performance of the Group and includes disclosures explaining the Group’s results for the year, segment information, capital and leasing commitments, taxation and EPS.
3.1 REVENUE ACCOUNTING POLICIES
Revenue RecognitionRevenue is measured at the fair value of the consideration
received or receivable after taking into account any trade
discounts and volume rebates allowed. Any consideration
deferred is treated as the provision of finance and is
discounted at a rate of interest that is generally accepted in
the market for similar arrangements. The difference between
the amount initially recognised and the amount ultimately
received is interest revenue.
Revenue from the sale of goods is recognised at the point
of delivery as this corresponds to the transfer of significant
risks and rewards of ownership of the goods and the
cessation of all involvement in those goods.
Interest revenue is recognised using the effective
interest rate method, which, for floating rate financial assets,
is the rate inherent in the instrument.
All dividends received are recognised as revenue when the
right to receive the dividend has been established.
Revenue recognition relating to the provision of services is
determined with reference to the stage of completion of the
transaction at the end of the reporting period and where
outcome of the contract can be estimated reliably. Stage
of completion is determined with reference to the services
performed to date as a percentage of total anticipated
services to be performed. Variable consideration is typically
constrained and only recognised to the extent that It is
highly probable that a significant reversal in the amount of
revenue recognised will not occur.
All revenue is stated net of the amount of goods and services
tax (GST).
2.0 CRITICAL ACCOUNTING ESTIMATES AND JUDGEMENTS (CONTINUED)
59MACA LIMITED ANNUAL REPORT 2019

3.2 OPERATING SEGMENTS
Identifi cation of Reportable Segment
The Group identifies its operating segments based on internal reports that are reviewed and used by the Board of Directors
(chief operating decision maker) in assessing performance and determining the allocation of resources.
The Group operates in three business and two geographical segments, being the provision of civil, SMP and contract mining
services throughout Australia and mining services to the mining industry in Brazil, South America.
BASIS OF ACCOUNTING FOR PURPOSES OF REPORTING BY OPERATING SEGMENTS
Accounting Policies Adopted
Unless otherwise stated, all amounts reported to the Board
of Directors as the chief operating decision maker, are in
accordance with accounting policies that are consistent to
those adopted in the financial statements of the Group.
Inter-segment transactions
Inter-segment loans payable and receivable are initially
recognised at the consideration received net of transaction
costs. If inter-segment loans receivable and payable are
not on commercial terms, these are not adjusted to fair
value based on market interest rates. This policy represents
a departure from that applied to the statutory financial
statements.
Segment assets
Where an asset is used across multiple segments, the asset
is allocated to the segment that receives the majority of
economic value from the asset. In the majority of instances,
segment assets are clearly identifiable on the basis of their
nature and physical location.
Unless indicated otherwise in the segment assets note,
investments in financial assets, deferred tax assets and
intangible assets have not been allocated to operating
segments.
Segment liabilities
Liabilities are allocated to segments where there is direct
nexus between the incurrence of the liability and the
operations of the segment. Segment liabilities include trade
and other payables and certain direct borrowings.
Unallocated items
The following items of revenue and expense are not
allocated to operating segments as they are not considered
part of the core operations of any segment:
- Dividends, interest, head office and other administration
expenditure
SECTIONS TO THE FINANCIAL STATEMENTSFor the Year Ended 30 June 2019
60 MACA LIMITED ANNUAL REPORT 2019

SECTIONS TO THE FINANCIAL STATEMENTSFor the Year Ended 30 June 2019
Consolidated - June 2019 MiningCivil /
InfrastructureInterquip Unallocated Total
$’000 $’000 $’000 $’000 $’000
Reportable Segment Revenue 467,883 138,906 50,481 - 657,270
5,579 15 48 2,807 8,449
473,462 138,920 50,530 2,807 665,719
EBITDA* 65,574 (1,405) 5,761 792 70,722
Depreciation and Amortisation (40,849) (1,041) (772) - (42,663)
Impairment - - - - -
Interest Revenue 5,185 15 48 2,807 8,055
(3,910) (179) (19) - (4,109)
Net Profit/(Loss) Before Tax 26,000 (2,611) 5,018 3,599 32,005
Income Tax Expense (9,590)
Net Profit After Tax 22,415
*EBITDA is Earnings Before Interest, Tax, Depreciation and Amortisation
13.8% of Interquip segment revenue has been derived at a point in time. All other Group revenue is derived over time.
451,635 31,233 26,785 74,789 584,443
584,443
214,136 24,219 8,903 4,518 251,776
251,776
Capital Expenditure 164,675 491 754 - 165,920
Assets
Segment Assets
Total Assets
Finance Costs
Total Revenue
Revenue
Other Revenue
Total Liabilities
Liabilities
Segment Liabilities
3.2 OPERATING SEGMENTS (CONTINUED)
61MACA LIMITED ANNUAL REPORT 2019

SECTIONS TO THE FINANCIAL STATEMENTSFor the Year Ended 30 June 2019
Consolidated - June 2018 MiningCivil /
InfrastructureInterquip Unallocated Total
$’000 $’000 $’000 $’000 $’000
Revenue
Reportable Segment Revenue 398,368 138,243 20,714 - 557,325
Other Revenue 3,018 954 38 1,259 5,269
401,386 139,197 20,752 1,259 562,594
EBITDA* 77,793 2,921 (4,131) - 76,583
Depreciation and Amortisation (44,171) (1,224) (696) - (46,091)
Impairment 2,217 - (3,338) - (1,121)
Interest Revenue 3,018 27 38 1,259 4,342
(1,745) (306) (33) - (2,084)
Net Profit/(Loss) Before Tax 37,112 1,418 (8,160) 1,259 31,629
Income Tax Expense (9,962)
Net Profit After Tax 21,667
*EBITDA is Earnings Before Interest, Tax, Depreciation and Amortisation
288,788 41,382 18,181 98,027 446,378
446,378
93,391 24,524 5,215 2,413 125,543
125,543
Capital Expenditure 38,056 668 735 163 39,622
Assets
Segment Assets
Finance Costs
Total Revenue
Segment Liabilities
Total Liabilities
Total Assets
Liabilities
3.2 OPERATING SEGMENTS (CONTINUED)
62 MACA LIMITED ANNUAL REPORT 2019

30 June 30 June
2019 2018
Expenses Section $'000 $'000
Depreciation and Amortisation
– Plant and Equipment 41,753 44,989
– Motor Vehicles 662 789
– Other 248 313
Total Depreciation and Amortisation Expense 4.4 42,663 46,091
Employee Benefits Expense 279,015 219,851
Repairs, Service and Maintenance 59,335 50,870
Materials and Supplies 128,938 105,843
30 June 30 June 30 June 30 June
Geographical Information 2019 2018 2019 2018
$'000 $'000 $'000 $'000
Australia 639,948 492,755 266,492 130,445
Brazil 25,772 69,839 35,796 60,111
917,566latoT 562,594 302,288 190,556
Revenue Non-current Assets
SECTIONS TO THE FINANCIAL STATEMENTSFor the Year Ended 30 June 2019
Major Customers
The Group has a number of customers to whom it provides both products and services. The Group supplies 3 single external
customers in the mining segment which account for 35.6%, 9% and 7.9% of external revenue. (2018: 31.3%, 8.9% and
8.7%). The next most significant client accounts for 7.2% (2018: 8%) of external revenue.
3.3 OPERATING COSTS FROM CONTINUING OPERATIONS
3.2 OPERATING SEGMENTS (CONTINUED)
63MACA LIMITED ANNUAL REPORT 2019

30 June 30 June
2019 2018
SectionOperating Lease Commitments )a( $'000 $'000
Non-cancellable Operating Leases
Payable — Minimum Lease Payments
– Not Later Than 12 Months 2,979 1,650
– Between 12 Months and 5 Years 8,816 6,038
– Greater Than 5 Years 4,268 7,500
Total Operating Lease Commitments 16,064 15,188
(b) Finance Lease Commitments
Payable — Minimum Lease Payments
– Not Later Than 12 Months 47,892 16,405
– Between 12 Months and 5 Years 106,865 30,804
– Greater Than 5 Years - -
Minimum Lease Payments 154,758 47,209
Less: Future Finance Charges (12,637) (2,308)
Total Finance Lease Commitments 5.2.1 142,120 44,901
(c) Capital Expenditure Commitments
Plant and Equipment Purchases 21,100 28,005
Payable
– Not Later Than 12 Months 21,100 28,005
– Between 12 Months and 5 Years - -
– Greater Than 5 Years - -
Total Minimum Commitments 21,100 28,005
$21.1M of commitments for property, plant and equipment expenditure existed at 30 June 2019 (2018: $28M).
SECTIONS TO THE FINANCIAL STATEMENTSFor the Year Ended 30 June 2019
3.4 CAPITAL AND LEASING COMMITMENTS
Accounting Policies
Leases
Leases are classified as finance leases whenever the terms of the lease transfer substantially all the risks and rewards of
ownership to the lessee. All other leases are classified as operating leases. Finance leases are capitalised by recording
an asset and a liability at the lower of the amounts equal to the fair value of the leased property or the present value of the
minimum lease payments, including any guaranteed residual values. Lease payments are allocated between the reduction of
the lease liability and the lease interest expense for the period.
Leased assets are depreciated on a straight-line basis over the shorter of their estimated useful lives or the lease term.
Lease payments for operating leases, where substantially all the risks and benefits remain with the lessor, are charged as
expenses in the periods in which they are incurred.
Operating lease payments are recognised as an expense in profit and loss on a straight-line basis over the lease term.
Operating lease incentives are recognised as a liability when received and subsequently reduced by allocating lease
payments between rental expense and a reduction of the liability.
64 MACA LIMITED ANNUAL REPORT 2019

30 June 30 June
2019 2018
Auditor's Remuneration - Moore Stephens $'000 $'000
Audit or Review of the Financial Report 230 220
Other Non-audit Services - -
Taxation Services - -
Total Auditor's Remuneration 230 220
SECTIONS TO THE FINANCIAL STATEMENTSFor the Year Ended 30 June 2019
3.6 TAXATION
Accounting Policies
Income tax
The income tax expense (revenue) for the year comprises
current income tax expense (income) and deferred tax
expense (income).
Current income tax expense charged to the profit or loss
is the tax payable on taxable income calculated using
applicable income tax rates enacted, or substantially
enacted, as at the end of the reporting period. Current tax
liabilities (assets) are therefore measured at the amounts
expected to be paid to (recovered from) the relevant taxation
authority.
Deferred income tax expense reflects movements in deferred
tax asset and deferred tax liability balances during the year
as well as unused tax losses. Current and deferred income
tax expense (income) is charged or credited directly to
equity instead of the profit or loss when the tax relates to
items that are credited or charged directly to equity.
Deferred tax assets and liabilities are ascertained based
on temporary differences arising between the tax bases
of assets and liabilities and their carrying amounts in the
financial statements. Deferred tax assets also result where
amounts have been fully expensed but future tax deductions
are available. No deferred income tax will be recognised
from the initial recognition of an asset or liability, excluding
a business combination, where there is no effect on
accounting or taxable profit or loss.
Deferred tax assets and liabilities are calculated at the tax
rates that are expected to apply to the period when the
asset is realised or the liability is settled, based on tax rates
enacted or substantively enacted at the end of the reporting
period. Their measurement also reflects the manner in
which management expects to recover or settle the carrying
amount of the related asset or liability.
Deferred tax assets relating to temporary differences and
unused tax losses are recognised only to the extent that it is
probable that future taxable profit will be available against
which the benefits of the deferred tax asset can be utilised.
Where temporary differences exist in relation to investments
in subsidiaries, branches, associates, and joint ventures,
deferred tax assets and liabilities are not recognised where
the timing of the reversal of the temporary difference can be
controlled and it is not probable that the reversal will occur
in the foreseeable future.
Current tax assets and liabilities are offset where a legally
enforceable right of set-off exists and it is intended that net
settlement or simultaneous realisation and settlement of the
respective asset and liability will occur. Deferred tax assets
and liabilities are offset where a legally enforceable right of
set-off exists, the deferred tax assets and liabilities relate to
income taxes levied by the same taxation authority on either
the same taxable entity or different taxable entities where it
is intended that net settlement or simultaneous realisation
and settlement of the respective asset and liability will occur
in future periods in which significant amounts of deferred tax
assets or liabilities are expected to be recovered or settled.
3.5 AUDITORS REMUNERATION
65MACA LIMITED ANNUAL REPORT 2019

30 June 30 June
2019 2018
3.6.1 Income Tax Expense Section $'000 $'000
(a) The Components of Tax Expense Comprise:
Current 10,491 12,735
Deferred (901) (2,773)
Income Tax Expense 9,590 9,962
9,602 9,489
Add Tax Effect of
– Dividend Imputation 1,895 2,408
– Other Non-allowable Items 124 1,948
– Other Taxable Items 4,286 10,069
– Research & Development Credit - -
Less Tax Effect of
– Franking Credits on Dividends Received (6,317) (8,028)
– Other Deductible Items (Losses Not Previously Brought to Account) - (5,924)
Income tax attributable to the Group 9,590 9,962
The Applicable Weighted Average Effective Tax Rate as 30.0% 31.5%
Prima Facie Tax Payable on Profit From Ordinary Activities Before Income Tax at 30% (2018: 30%)
(b) Reconciliation:
SECTIONS TO THE FINANCIAL STATEMENTSFor the Year Ended 30 June 2019
3.6 TAXATION (CONTINUED)
Goods and Services Tax (GST)
Revenues, expenses and assets are recognised net of the amount of GST, except where the amount of GST incurred is
not recoverable from the Australian Taxation Office. In these circumstances the GST is recognised as part of the cost of
acquisition of the asset or as part of an item of the expense. Receivables and payables in the statement of financial position
are shown inclusive of GST.
Cash flows are presented in the statement of cashflows on a gross basis, except for the GST component of investing and
financing activities, which are disclosed as operating cash flows.
66 MACA LIMITED ANNUAL REPORT 2019

30 June 30 June
2019 2018
3.6.2 Tax Assets and Liabilities Section $'000 $'000
(a) Tax Assets
Non-Current
Deferred Tax Assets comprise
Provisions 3.6.3(c) 4,671 3,980
Losses 3.6.3(c) 8,293 6,585
Other 3.6.3(c) 549 700
Total Non-Current Tax Assets 13,513 11,265
(b) Tax Liabilities
Current
Income tax 3,732 1,226
Total Non-Current Tax Liabilities
Total Non-Current Tax Liabilities
3,732 1,226
Non-Current
Deferred tax liability comprises:
Depreciation 4,305 2,835
Other 20 123
)b(3.6.3 4,325 2,958
3.6.3 Reconciliations
(a) Gross Movements
The Overall Movement In the Deferred Tax Account is as Follows
Opening Balance 8,307 7,930
(Charge)/Credit To Income Statement 882 739
(Charge)/Credit To Equity - (362)
Closing Balance 9,189 8,307
(b) Deferred Tax Liablities
The Movement In Deferred Tax Liabilities For Each Temporary Difference During the Year is as Follows:
Depreciation and Other:
Opening Balance 2,958 107
Charge/(Credit) To Income Statement 1,367 2,851
Charge/(Credit) To Equity - -
)a(2.6.3 Closing Balance 4,325 2,958
SECTIONS TO THE FINANCIAL STATEMENTSFor the Year Ended 30 June 2019
3.6 TAXATION (CONTINUED)
67MACA LIMITED ANNUAL REPORT 2019

30 June 30 June
2019 2018
$'000 $'000
a. Reconciliation Of Earnings To Profit and Loss
Profit 22,415 21,667
(Profit)/loss Attributable To Non-controlling Interest (1,841) 1,928
Earnings Used To Calculate Basic EPS 20,574 23,595
Earnings Used in the Calculation of Dilutive EPS 20,574 23,595
Weighted Avg. No. of Ord. Shares Outstanding During the Year (Basic EPS) 268,008 260,428
Weighted Average Number of Dilutive Options Outstanding 2,592 3,115
Weighted Avg. No. of Ord. Shares Outstanding During the Year (Dilutive EPS) 270,600 263,543
(c) Deferred Tax Assets
The Movement In Deferred Tax Assets For Each Temporary Difference During the Year is as follows:
Provisions:
Opening Balance 3,980 3,611
Credit To Income Statement 691 369
Closing Balance 3.6.2(a) 4,671 3,980
Losses:
Opening Balance 6,585 3,596
(Charge)/Credit To Income Statement 1,708 2,989
Closing Balance 3.6.2(a) 8,293 6,585
Other:
Opening Balance 700 830
(Charge)/Credit To Income Statement (151) 232
Charge/(Credit) To Equity - (362)
Closing Balance 3.6.2(a) 549 700
SECTIONS TO THE FINANCIAL STATEMENTSFor the Year Ended 30 June 2019
3.6 TAXATION (CONTINUED)
3.7 EARNINGS PER SHARE
Accounting Policies
Basic EPS
Basic EPS is calculated by dividing the profit attributable to equity holders of the Company, excluding any costs of servicing
equity other than ordinary shares, by the weighted average number of ordinary shares during the financial year.
Diluted EPS
Diluted EPS is calculated by dividing the profit attributable to equity holders of the Company, excluding any costs of servicing
equity other than ordinary shares, by the weighted average number of ordinary shares and performance rights for the effects
of all dilutive potential ordinary shares.
68 MACA LIMITED ANNUAL REPORT 2019

30 June 30 June
2019 2018
SectionTrade and Other Receivables $'000 $'000
Trade Debtors - Current 155,405 116,502
Debtors subject to Payment Arrangements - Current 20,244 8,185
Total Current 175,649 124,687
Debtors Subject to Payment Arrangements - Non-Current 15,139 39,165
3.5selbavieceR rehtO dna edarT latoT 190,787 163,852
Loans to Other Companies
Loans to Other Companies - Current 22,300 7,618
Loans to Other Companies - Non-Current 25,655 19,975
3.5seinapmoC rehtO ot snaoL latoT 47,955 27,593
Financial Assets - Fair Value Profit or Loss
Shares in Listed corporations at Fair Value - Current 7,076 2,257
Shares in Listed corporations at Fair Value - Non-Current 6,514 2,179
Total Financial Assets 5.3 13,590 4,436
SECTIONS TO THE FINANCIAL STATEMENTSFor the Year Ended 30 June 2019
SECTION 4 ASSETS AND LIABILITIES
This Section shows the assets used to generate the Group’s trading performance and the liabilities incurred as a result.
Liabilities relating to the Group’s financing activities are addressed in Section 5. Current and deferred tax assets and
liabilities are shown in Section 3.6.
4.1 TRADE AND OTHER RECEIVABLES
Accounting Policies
Trade and other receivables represent the asset outstanding at the end of the reporting period for goods and services
provided by the Group during the reporting period which remain unpaid. The balance is recognised as a current asset with
the amount normally being received within 30 to 60 days of recognition of the receivable.
Credit risk
The Group has approximately 23.4% (2018: 28.7%) of credit risk with a single counterparty or group of counterparties.
Failure or default of a major counterparty would have a material impact on earnings. Management of credit risk is discussed
in Section 5.3 Financial Risk Management. The class of assets described as “trade and other receivables” and “loans to other
companies” are considered to be the main source of credit risk related to the Group. The Group holds first ranking security
over the assets of both Blackham Resources Ltd and and Carabella Resources Pty Ltd, which is expected to be sufficient to
cover the exposure in respect of the Loans to Other Companies totalling $47,955.
69MACA LIMITED ANNUAL REPORT 2019

119,386
119,386
5,301
39,165
44,466
$’000 $’000 $’000 $’000
30-Jun-2019
Trade and Term Receivables 175,649 144,963
931,51selbavieceR rehtO
Total Trade and Other Receivables 190,787 144,963
30-Jun-2018
Trade and Term Receivables 124,687
561,93selbavieceR rehtO -
Total Trade and Other Receivables 163,852
30 June 30 June
2019 2018
Financial Assets Classified as Loans and Receivables $'000 $'000
Trade and Other Receivables
- Total Current 175,649 124,687
- Total Non-Current 15,139 39,165
190,787 163,852
Other loans
- Total Current 22,300 7,618
- Total Non-Current 25,655 19,975
47,955 27,593
30,686
15,139
45,825
Gross amount
Past due and impaired
Past due but not impaired
Within initial trade terms
-
-
-
-
-
-
SECTIONS TO THE FINANCIAL STATEMENTSFor the Year Ended 30 June 2019
4.1 TRADE AND OTHER RECEIVABLES (CONTINUED)
The following table details the Group’s trade and other receivables exposed to credit risk (prior to collateral and other credit
enhancements) with ageing analysis and impairment provided for thereon. Amounts are considered as ‘past due’ when the
debt has not been settled within the terms and conditions agreed between the Group and the customer or counterparty to
the transaction. The Group’s credit evaluation practices and basis for recognition and measurement of expected credit losses
are disclosed in Section 5.3.
The balance of receivables that remain within initial trade terms (as detailed in the table) are considered to be of acceptable
credit quality.
70 MACA LIMITED ANNUAL REPORT 2019

30 June 30 June2019 2018
Inventories and Work In Progess (WIP) $'000 $'000
Inventories 14,306 13,649
WIP 1,717 (2,023)
Total Inventories and Work in Progress (WIP) 16,023 11,626
30 JunestessA tnerruC rehtO 3.4 30 June2019 2018
Other Current Assets $'000 $'000
Prepayments 894 544
Deposit 921 851
Total Other Current Assets 1,815 1,395
SECTIONS TO THE FINANCIAL STATEMENTSFor the Year Ended 30 June 2019
4.2. INVENTORIES AND WORK IN PROGRESS (WIP)
Accounting Policies
Inventories and work in progress are measured at the lower of cost or net realisable value. The cost of manufactured
products includes direct materials, direct labour and an appropriate portion of variable and fixed overheads. Overheads are
applied on the basis of normal operating capacity. Costs are assigned on the basis of weighted average costs.
4.3 OTHER CURRENT ASSETS
4.4 PROPERTY, PLANT AND EQUIPMENT
Accounting Policies
Each class of property, plant and equipment is carried at cost or fair value as indicated less, where applicable, any
accumulated depreciation and impairment losses.
Property
Freehold land and buildings are shown at their fair value (being the amount for which an asset could be exchanged between
knowledgeable willing parties in an arm’s length transaction), based on periodic, but at least triennial, valuations by external
independent valuers, less subsequent depreciation for buildings.
Increases in the carrying amount arising on revaluation of land and buildings are credited to a revaluation surplus in equity.
Decreases that offset previous increases of the same asset are charged against fair value reserves directly in equity, all other
decreases are charged to the statement of comprehensive income. Each year the difference between depreciation based on
the revalued carrying amount of the asset charged to the statement of profit or loss and other comprehensive income and
depreciation based on the asset’s original cost is transferred from the revaluation reserve to retained earnings.
Any accumulated depreciation at the date of revaluation is eliminated against the gross carrying amount of the asset and
the net amount is restated to the revalued amount of the asset.
71MACA LIMITED ANNUAL REPORT 2019

SECTIONS TO THE FINANCIAL STATEMENTSFor the Year Ended 30 June 2019
4.4 PROPERTY, PLANT AND EQUIPMENT (CONTINUED)
Plant and equipment
Plant and equipment are measured on the cost basis.
The carrying amount of plant and equipment is reviewed
annually by directors to ensure it is not in excess of the
recoverable amount from these assets. The recoverable
amount is assessed on the basis of the expected net cash
flows that will be received from the asset’s employment
and subsequent disposal. The expected net cash flows have
been discounted to their present values in determining
recoverable amounts.
The cost of fixed assets constructed within the Group
includes the cost of materials, direct labour, borrowing
costs and an appropriate proportion of fixed and variable
overheads.
Subsequent costs are included in the assets carrying amount
or recognised as a separate asset, as appropriate, only when
it is probable that future economic benefits associated with
the item will flow to the Group and the cost of the item can
be measured reliably. All other repairs and maintenance are
charged to the profit and loss statement during the financial
period in which they are incurred.
Depreciation
The depreciable amount of all fixed assets including
buildings and capitalised lease assets, but excluding
freehold land, is depreciated on a diminishing value or
straight line basis over the asset’s useful life to the Group
commencing from the time the asset is held ready for use.
Leasehold improvements are depreciated over the shorter
of either the unexpired period of the lease or the estimated
useful lives of the improvements.
The depreciation rates used for each class of depreciable
assets are:
Class of Fixed Asset Depreciation Rate
Improvements 2.50%
Plant and Equipment 10.00% – 40.00%
Low Value Pool 18.75% – 37.50%
Motor Vehicles 18.75% – 50.00%
The asset’s residual values and useful lives are reviewed,
and adjusted if appropriate, at the end of each reporting
period.
An asset’s carrying amount is written down immediately
to its recoverable amount if the asset’s carrying amount is
greater than its estimated recoverable amount.
Gains and losses on disposals are determined by comparing
proceeds with the carrying amount. These gains and losses
are included in the statement of profit or loss and other
comprehensive income. When revalued assets are sold,
amounts included in the revaluation surplus relating to that
asset are transferred to retained earnings.
Leases
Leases of fixed assets where substantially all the risks and
benefits incidental to the ownership of the asset, but not the
legal ownership that is transferred to entities in the Group,
are classified as finance leases.
Finance leases are capitalised by recording an asset and a
liability at the lower of the amounts equal to the fair value
of the leased property or the present value of the minimum
lease payments, including any guaranteed residual values.
Lease payments are allocated between the reduction of the
lease liability and the lease interest expense for the period.
Leased assets are depreciated on a diminishing or straight-
line basis over the shorter of their estimated useful lives or
the lease term.
Lease payments for operating leases, where substantially all
the risks and benefits remain with the lessor, are charged as
expenses in the periods in which they are incurred.
Lease incentives under operating leases are recognised as a
liability and amortised on a straight-line basis over the life of
the lease term.
72 MACA LIMITED ANNUAL REPORT 2019

30 June 30 June
2019 2018
$'000 $'000
Plant and Equipment – at Cost 634,613 479,623
Accumulated Depreciation and Impairment (403,198) (372,355)
231,415 107,268
Motor Vehicles – at Cost 10,005 12,436
Accumulated Depreciation (7,311) (9,283)
2,694 3,153
Land and Building – at cost 3,272 3,272
Accumulated Depreciation (464) (440)
2,808 2,832
Low Value Pool – at Cost 466 409
Accumulated Depreciation (372) (281)
94 128
Leasehold Improvements – at Cost 2,591 2,529
Accumulated Depreciation (1,322) (1,125)
1,269 1,404
Total plant and equipment 234,203 110,549
Total property, plant and equipment 238,280 114,785
SECTIONS TO THE FINANCIAL STATEMENTSFor the Year Ended 30 June 2019
4.4 PROPERTY, PLANT AND EQUIPMENT (CONTINUED)
Movements in Carrying Amounts
Movements in carrying amounts for each class of property, plant and equipment between the beginning and the end of the
current financial period are as follows:
73MACA LIMITED ANNUAL REPORT 2019

Growth Rate
CGU FY20 FY21 FY22 FY23 FY24 Terminal Year
Crushing 331.60% 6.80% 3.50% 2.90% 2.70% 0.00%
Mining 14.80% 2.30% 2.30% 2.30% 2.30% 2.00%
Discount Rate
CGU
Crushing
Mining
14.00%
13.00%
16.60%
17.72%
Post-Tax Discount Rate Pre-Tax Discount rate
SECTIONS TO THE FINANCIAL STATEMENTSFor the Year Ended 30 June 2019
4.4 PROPERTY, PLANT AND EQUIPMENT (CONTINUED)
The Group monitors market conditions for indications of impairment of its operating assets. Where a trigger event occurs
which indicates an impairment may have occurred, a formal impairment assessment is performed. The following trigger
events have occured at 30 June 2019:
- The carrying amount of the Group’s net assets exceed the Company’s market capitalisation
As a result, an assessment has been made of the recoverable amounts of each of the Mining and Crushing Cash Generating
Units (CGU’s) as at 30 June 2019 on a value in use basis. Both CGUs form part of the Group’s core Mining Services operating
segment. For this purpose, cash flows have been projected for 5 years from the continuing use of assets within each CGU
as well as the disposal of any assets, and have been discounted using a pre-tax discount rate that reflects the assessed
risks specific to the CGU’s. Projected future cash flows from the continuing use of assets have been based on the current
contracted work in hand plus, in the case of the Mining CGU, a modest allowance for estimated new work. No terminal
growth rate has been applied to the Crushing CGU cash flows and a 2% terminal growth rate (beyond FY2024) has been
applied to the Mining CGU cash flows. The pre-tax discount rates which have been applied to each of these CGU’s are 16.6%
and 17.7% respectively.
The assessment has resulted in no impairment to the plant and equipment employed within both the Crushing CGU and the
Mining CGU.
Key Assumptions used for value in use calculations
- EBITDA Margin
- Discount Rates
- Growth rates used to extrapolate cash flows beyond the forecast period
- Capital expenditure
The EBITDA Margin is based on management’s best estimate taking into account past performance and expected market
conditions. Working Capital has been adjusted to reflect the required working capital for the forecast future cashflows.
Capital expenditure has considered both required replacement capital and idle equipment which could be utilised to sustain
the current Work in Hand schedule. Capital expenditure has been matched to depreciation levels in the terminal year.
Growth rates and discount rates applied are shown below.
74 MACA LIMITED ANNUAL REPORT 2019

SECTIONS TO THE FINANCIAL STATEMENTSFor the Year Ended 30 June 2019
4.4 PROPERTY, PLANT AND EQUIPMENT (CONTINUED)
Mining CGU
This CGU is included in the Mining Segment. The impairment test conducted at 30 June 2019 did not result in an impairment
as the recoverable amount of the CGU exceeded the carrying value.
Sensitivity Analysis
As disclosed above management have made judgements and estimates in respect of impairment testing of plant and
equipment. Any adverse changes to key assumptions may result in a further impairment in the future. The sensitivities are as
follows
- Revenue would need to decrease by 12% from the estimate used in the Value in Use calculation before Mining CGU plant
and equipment would be impaired; or
- The discount rate would need to increase by 33% before Mining CGU plant and equipment would be impaired.
Crushing CGU
This CGU is included in the Mining Segment. The impairment test conducted at 30 June 2019 did not result in the CGU being
impaired as the recoverable amount of the CGU exceeded the carrying value
Sensitivity Analysis.
As disclosed above management have made judgements and estimates in respect of impairment testing of plant and
equipment. As the assets of the Crushing CGU have been written down to their carrying value, the sensitivities are as follows;
- Revenue would need to decrease by 39% from the estimate used in the Value in Use calculation before Crushing CGU
plant and equipment would be impaired; or
- The discount rate would need to increase by 39% before Crushing CGU plant and equipment would be impaired.
75MACA LIMITED ANNUAL REPORT 2019

Plant and
Equipment
Motor
Vehicles
Land and
Buildings
Leased
Plant and
Equipment
Low Value
Pool
Leasehold
Improv.Total
Consolidated: $’000 $’000 $’000 $’000 $’000 $’000 $’000
Balance at 01 Jul 17 120,826 3,589 2,761 - 273 1,456 128,905
Additions 38,767 564 123 - - 168 39,622
Disposals (6,589) (211) (31) - (74) - (6,905)
Reversal of Impairment 2,217 - - - - - 2,217
Forex movements (2,963) - - - - - (2,963)
Depreciation expense (44,990) (789) (21) - (71) (220) (46,091)
Balance at 30 Jun 18 107,268 3,153 2,832 - 128 1,404 114,785
Plant and
Equipment
Motor
Vehicles
Land and
Buildings
Leased
Plant and
Equipment
Low Value
Pool
Leasehold
Improv.Total
$’000 $’000 $’000 $’000 $’000 $’000 $’000
Balance at 01 Jul 18 107,268 3,153 2,832 - 128 1,404 114,785
Additions 165,431 427 - - - 62 165,920
Disposals (769) (225) - - (6) - (1,000)
Reversal of Impairment - - - - - - -
Forex movements 1,238 - - - - - 1,238
Depreciation expense (41,753) (662) (24) - (28) (197) (42,663)
Balance at 30 Jun 19 231,415 2,694 2,808 - 94 1,269 238,280
SECTIONS TO THE FINANCIAL STATEMENTSFor the Year Ended 30 June 2019
4.5 INTANGIBLE ASSETS ACCOUNTING POLICIES
Goodwill
Goodwill is carried at cost less any accumulated impairment losses. Goodwill is calculated as the excess of the sum of:
(i) the consideration transferred;
(ii) any non-controlling interest (determined under either the full goodwill or proportionate interest method); and
(iii) the acquisition date fair value of any previously held equity interest;
over the acquisition date fair value of net identifiable assets acquired.
The acquisition date fair value of the consideration transferred for a business combination plus the acquisition date fair value
of any previously held equity interest shall form the cost of the investment in the separate financial statements.
Fair value remeasurements in any pre-existing equity holdings are recognised in profit or loss in the period in which they
arise. Where changes in the value of such equity holdings had previously been recognised in other comprehensive income,
such amounts are recycled to profit or loss.
4.4 PROPERTY, PLANT AND EQUIPMENT (CONTINUED)
76 MACA LIMITED ANNUAL REPORT 2019

30 June 30 June
2019 2018
Goodwill and Other Tangibles $'000 $'000
Carrying Value of Goodwill and Other Tangibles 3,187 3,187
Allocation of Goodwill to Cash Generating Unit
Goodwill and Other Tangibles
MACA Infrastructure 3,187 3,187
MACA Interquip - -
Goodwill Carrying Amount 3,187 3,187
Goodwill is allocated to the Group’s cash generating units identified according to operating segment. Goodwill isnot amortised but is subject to impairment testing on an annual basis or whenever there is an indication ofimpairment. The carrying amount of goodwill was allocated to cash generating units as follows:
SECTIONS TO THE FINANCIAL STATEMENTSFor the Year Ended 30 June 2019
4.5 INTANGIBLE ASSETS (CONTINUED)
The amount of goodwill recognised on acquisition of
each subsidiary in which the Group holds less than 100%
interest will depend on the method adopted in measuring
the non-controlling interest. The Group can elect in most
circumstances to measure the non-controlling interest in
the acquiree either at fair value (full goodwill method) or
at the non-controlling interest’s proportionate share of the
subsidiary’s identifiable net assets (proportionate interest
method). In such circumstances, the Group determines
which method to adopt for each acquisition and this is
stated in the respective notes to these financial statements
disclosing the business combination.
Under the full goodwill method, the fair value of the non-
controlling interest is determined using valuation techniques
which make the maximum use of market information where
available. Under this method, goodwill attributable to the
non-controlling interest is recognised in the consolidated
financial statements.
Goodwill on acquisition of subsidiaries is included in
intangible assets. Goodwill on acquisition of associates is
included in investments in associates.
Goodwill is tested for impairment annually and is allocated
to the Group’s cash-generating units or groups of cash-
generating units, representing the lowest level at which
goodwill is monitored and not larger than an operating
segment. Gains and losses on the disposal of an entity
include the carrying amount of goodwill related to the entity
disposed of.
Changes in the ownership interests in a subsidiary that do
not result in a loss of control are accounted for as equity
transactions and do not affect the carrying amounts of
goodwill.
Impairment of Assets
At the end of each reporting period, the Group assesses
whether there is any indication that an asset may be
impaired. The assessment will include the consideration
of external and internal sources of information including
dividends received from subsidiaries, associates or jointly
controlled entities deemed to be out of pre-acquisition
profits. If such an indication exists, an impairment test
is carried out on the asset by comparing the recoverable
amount of the asset, being the higher of the asset’s fair
value less costs to sell and value in use, to the asset’s
carrying value. Any excess of the asset’s carrying value over
its recoverable amount is expensed to the statement of
profit or loss and other comprehensive income.
Where it is not possible to estimate the recoverable amount
of an individual asset, the Group estimates the recoverable
amount of the cash-generating unit to which the asset
belongs.
77MACA LIMITED ANNUAL REPORT 2019

30 June 30 June
2019 2018
Payables Section $'000 $'000
Current
Unsecured Liabilities:
Trade Creditors 69,263 45,723
Sundry Creditors and Accruals 18,679 18,897
Total Trade and Other Payables 87,942 64,620
Creditors are non-interest bearing and settled at various terms up to 45 days.
Financial Liabilities at Amortised Cost Classified as Trade and Other Payables
Trade and Other Payables
- Total Current 87,942 64,620
- Total Non-Current - -
Total Trade and Other Payables 5.3 87,942 64,620
SECTIONS TO THE FINANCIAL STATEMENTSFor the Year Ended 30 June 2019
4.5 INTANGIBLE ASSETS (CONTINUED)
Impairment Test for Goodwill
The recoverable amount of the goodwill in each cash generating unit is based on value in use calculations. These
calculations use cash flow projections based on the following year’s budget and increased for growth at 2.5% for the
forecast period being five years.
The key assumptions used in the value in use calculations as at 30 June 2019 and 30 June 2018 were as follows:
- growth rate used to extrapolate cash flows beyond the forecast period: 2.5% (2018: 2.5%);
- pre-tax discount rate: 16.3% (2018: 16.6%); and
- divisional Revenue, EBIT, working capital adjustments and maintenance capital expenditure.
4.6. TRADE AND OTHER PAYABLES ACCOUNTING POLICIES
Trade and other payables represent the liability outstanding at the end of the reporting period for goods and services
received by the Group during the reporting period which remains unpaid. The balance is recognised as a current liability with
the amount being normally paid within 45 days of recognition of the liability.
4.7 PROVISIONS
Accounting Policies
Employee Benefi ts
Provision is made for the Group’s liability for employee benefits arising from services rendered by employees to balance
date. Employee benefits that are expected to be settled within one year have been measured at the amounts expected to
be paid when the liability is settled. Employee benefits payable later than one year have been measured at the present
value of the estimated future cash outflows to be made for those benefits. In determining the liability, consideration is
given to employee wages increases and the probability that the employee may satisfy vesting requirements. Those cash
outflows are discounted using market yields on national government bonds with terms to maturity that match the expected
timing of cash flows.
78 MACA LIMITED ANNUAL REPORT 2019

30 June 30 June
2019 2018
$'000 $'000
Employee Entitlments 13,657 11,838
Movement in Provisions
Opening Balance 11,838 10,402
Additional Provisions 8,598 13,236
Amounts Used (6,779) (11,800)
Closing balance 13,657 11,838
SECTIONS TO THE FINANCIAL STATEMENTSFor the Year Ended 30 June 2019
4.7 PROVISIONS (CONTINUED)
Provisions are recognised when the Group has a legal or constructive obligation, as a result of past events, for which it is
probable that an outflow of economic benefits will result and that outflow can be reliably measured.
SECTION 5 CAPITAL STRUCTURE AND FINANCING COSTS
This Section outlines how the Group manages its capital structure, including its balance sheet liquidity and access to capital
markets.
The Directors determine the appropriate capital structure of MLD, specifically, how much is raised from shareholders (equity)
and how much is borrowed from financial institutions (debt) in order to finance the Group’s activities both now and in the
future. The Directors consider the Group’s capital structure and dividend policy at least annually and do so in the context of
its ability to continue as a going concern, to execute the strategy and to deliver its business plan.
During FY19, the Group complied with all the financial covenants of its borrowing facilities.
79MACA LIMITED ANNUAL REPORT 2019

30 June 30 June
2019 2018
5.1.1 Cash and Cash Equivalents Section $'000 $'000
5.5 59,292 108,239
30 June 30 June
2019 2018
5.1.2 Cash Flow Information Section $'000 $'000
Reconciliation of Cash Flow from Operations with Operating Profit After Tax
Operating Profit After Income Tax 22,415 21,667
Non-cash Flows in Profit
3.3noitasitroma dna noitaicerpeD 42,663 46,092
Impairment - 3,338
Net (Gain)/Loss on Disposal of Plant and Equipment (630) (2,010)
Net (Gain)/Loss on Disposal of Investments 216 212
Net (Gain)/Loss on Intangibles - -
Foreign Exchange (Gains)/Losses (1,721) (1,228)
Total Non-Cash Flows in Profit 40,528 46,404
Movements in Working Capital
(Increase)/Decrease in Trade and Other Receivables (27,372) (58,825)
(Increase)/Decrease in Other Assets (420) (746)
(Increase)/Decrease in Inventories and Work-In-Progress (4,397) 654
Increase/(Decrease) in Trade and Other Payables 23,322 1,119
Increase/(Decrease) in Income Tax Payable 2,506 (3,222)
Increase/(Decrease) in Deferred Tax Payable (881) 195
Increase/(Decrease) in Provisions 1,818 1,437
Total Working Capital Movements (5,423) (59,389)
Net Cash Increase/(Decrease) from Operating Activities 57,521 8,682
SECTIONS TO THE FINANCIAL STATEMENTSFor the Year Ended 30 June 2019
5.1 CASH AND CASH EQUIVALENTS ACCOUNTING POLICIES
Cash and cash equivalents include cash on hand, deposits held at call with banks, other short-term highly liquid investments
with original maturities of three months or less, and bank overdrafts. The Group does not have any bank overdraft facilities.
5.1.3 Non-Cash Financing and Investing Activities
During the year the Group acquired $76.6 million in plant
and equipment (2018: $19.5M) by means of finance leases.
These acquisitions are not reflected in the statement of
cash flows.
There were no business combinations for the year ended
30 June 2019 and 30 June 2018.
Shares Issued
During 2019 no shares were issued as a result of performance
rights vesting to KMPs and other Executives (2018: 233,506).
1,486,053 performance rights vested via the MACA ERT Trust.
Insurance Bonding and Bank Guarantee Facilities
The Group has insurance bonding and bank guarantee
facilities totalling $42 million. At 30 June 2019 the amount
drawn on the facility was $15.4 million (2018: $14.9 million).
80 MACA LIMITED ANNUAL REPORT 2019

30 June 30 June
2019 2018
5.2.1 Financial Liablities Section $'000 $'000
Current
Secured Liabilities
Finance Lease Liability 42,272 14,991
Total Current Financial Liabilities 5.3 42,272 14,991
Non-Current
Secured Liabilities
Finance Lease liability 99,848 29,910
Total Non-Current Financial Liabilities 5.3 99,848 29,910
Finance Lease Liability 142,120 44,901
Total Current and Non-Current Secured Liabilities: 3.4(b) 142,120 44,901
Carrying Amounts of Non-Current Assets Pledged as Security 161,695 45,230
SECTIONS TO THE FINANCIAL STATEMENTSFor the Year Ended 30 June 2019
5.2 INTEREST BEARING LOANS AND BORROWINGS ACCOUNTING POLICIES
Borrowing costs directly attributable to the acquisition, construction or production of assets that necessarily take a substantial
period of time to prepare for their intended use or sale, are added to the cost of those assets, until such time as the assets are
substantially ready for their intended use or sale.
All other borrowing costs are recognised in the statement of profit and loss in the period in which they are incurred.
5.3 FINANCIAL RISK MANAGEMENT
The Group’s financial instruments consist mainly of deposits with banks, local money market instruments, short-term
investments, accounts receivable and payable, loans to and from subsidiaries, loans to other companies and leases.
The totals for each category of financial instruments, measured in accordance with AASB 139 as detailed in the accounting
policies to these financial statements are as follows:
Accounting Policies
The Board of Directors (“the Board”) is responsible for, amongst other issues, monitoring and managing financial risk
exposures of the Group. The Board monitors the Group’s financial risk management policies and exposures and approves
financial transactions within the scope of its authority. It also reviews the effectiveness of internal controls relating to
commodity price risk, counterparty credit risk, liquidity risk, currency risk, financing risk and interest rate risk.
The Board’s overall risk management strategy seeks to assist the Group in meeting its financial targets, while minimising
potential adverse effects on financial performance. Its functions include the review of the use of hedging derivative
instruments (if any), credit risk policies and future cash flow requirements.
81MACA LIMITED ANNUAL REPORT 2019

30 June 30 June
2019 2018
Financial Assets Section $'000 $'000
Cash and Cash Equivalents 5.1.1 59,292 108,239
Loans and Receivables
— Trade and Other Receivables 4.1 190,787 163,852
— Other Loans 4.1 47,955 27,593
Available-for-Sale Financial Assets:
— Listed Investments 4.1 13,590 4,436
Total Financial Assets 311,624 304,120
Financial Liabilities
— Trade and Other Payables 4.6 87,942 64,620
— Borrowings 5.2.1 142,120 44,901
Total Financial Liabilities 230,062 109,521
SECTIONS TO THE FINANCIAL STATEMENTSFor the Year Ended 30 June 2019
Specifi c Financial Risk Exposures and Management
The main risks the Group is exposed to through its financial
instruments are credit risk, liquidity risk and market risk
consisting of interest rate risk, foreign currency risk and
commodity and equity price risk.
Credit Risk
Exposure to credit risk relating to financial assets arises from
the potential non-performance by counterparties of contract
obligations that could lead to a financial loss to the Group.
Credit risk is managed through the maintenance of
procedures (such procedures include the utilisation of
systems for the approval, granting and renewal of credit
limits, regular monitoring of exposures against such limits
and monitoring of the financial stability of significant
customers and counterparties), ensuring to the extent
possible, that customers and counterparties to transactions
are of sound credit worthiness. Such monitoring is used
in assessing receivables for impairment. Depending on
the division within the Group, credit terms are generally
30 to 60 days from the invoice date. The Group considers
various debt recovery methedologies and has entered into
repayment arrangements with Beadell Resources Ltd (Great
Panther Mining Ltd) and Blackham Resources Ltd. Since the
commencement of the arrangement in June 2018, Beadell
Resources Ltd has reduced debt by $33million as at the date
of this report.
Where the Group is unable to ascertain a satisfactory credit
risk profile in relation to a customer or counterparty, the
risk may be further managed through credit insurance,
title retention clauses over goods or obtaining security by
way of personal or commercial guarantees over assets of
sufficient value which can be claimed against in the event
of any default. In addition MACA is a secured debt holder of
Blackham Resources Ltd and Carabella Respirces Ltd. Risk is
also minimised through investing surplus funds in financial
institutions that maintain a high credit rating, or in entities
that the Board has otherwise cleared as being financially
sound.
Credit risk also arises through the provision of financial
guarantees, as approved at Board level, given to parties
securing the liabilities of certain subsidiaries (refer Section
6.6 Parent Entity Disclosures for details).
Trade Receivables and Contract Assets
The Group applies the simplified approach to provide for
the ECL for all trade receivables and contract assets. The
simplified approach required the loss allowance to be
measured at an amount equal to the lifetime ECL.
The Group uses a provision matrix to measure the lifetime
ECL allowance for trade receivables and contract assets. In
measuring the ECL, trade receivables and contract assets are
grouped based on shared credit risk characteristics and days
past due.
5.3 FINANCIAL RISK MANAGEMENT (CONTINUED)
82 MACA LIMITED ANNUAL REPORT 2019

SECTIONS TO THE FINANCIAL STATEMENTSFor the Year Ended 30 June 2019
5.3 FINANCIAL RISK MANAGEMENT (CONTINUED)
In calculating the ECL rates, the Group considers historical
loss rates for each category of customers and adjust for
forward looking macroeconomic data.
The Group considers a financial asset as in default when
the counterparty fail to make contractual payments for a
prolonged period of time when they fall due, and the Group
may also consider financial or economic conditions that
are expected to cause a significant change to the debtors
ability to meet its obligations. Financial assets are written off
when there is no reasonable expectation of recovering the
contractual cash flow. When receivables have been written
off, the Group continues to engage in enforcement activity to
attempt to recover the receivables due. Where recoveries are
made, these are recognised in profit or loss.
Management has assessed and concluded that the ECL
rate for trade receivables past due and less than 1 year
approximates Nil and is immaterial, while the ECL rate
for trade receivables past due and more than 1 year
approximates 50% to 100%, except for specific cases
where management has assessed the amount is still fully
recoverable.
The Group’s credit risk exposure in relation to trade
receivables and contract assets at 30 June 2019 are set out
in section 4.1
The Group has assessed and concluded that trade
receivables are subject to immaterial credit loss. There has
been no change in the estimation techniques or significant
assumptions made during the current reporting year.
Other receivables
The Group applies the general approach to provide for the
ECL for other receivables. Under the general approach,
the loss allowance is measured at an amount equal to the
12-month ECL at initial recognition.
At each reporting date, the Group assesses whether
the credit risk of a financial instrument has increased
significantly since initial recognition. When credit risk
has increased significantly since initial recognition, loss
allowance is measured at an amount equal to lifetime ECL.
The Group has approximately 23.4% (2018: 28.7%) of credit
risk with a single counterparty or group of counterparties.
Failure or default of a major counterparty would have a
material impact on earnings. Details with respect to credit
risk of Trade and Other Receivables are provided in Section
4.1. MACA carries a credit risk insurance policy. The amount
of cover varies on a client by client basis dependant on the
counterparty.
Trade and other receivables that remain within initial trade
terms are considered to be of acceptable quality.
Credit risk related to balances held with banks and other
financial institutions are only invested with counterparties
with a Standard & Poors rating of at
least AA-.
Liquidity Risk
Liquidity risk arises from the possibility that the Group might
encounter difficulty in settling its debts or otherwise meeting
its obligations related to financial liabilities. The Group
manages this risk through the following mechanisms:
- preparing forward looking cashflow analysis in relation
to its operational, investing and financing activities;
- monitoring undrawn credit facilities;
- obtaining funding from a variety of sources;
- maintaining a reputable credit profile;
- managing credit risk related to financial assets;
- only investing surplus cash with major financial
institutions; and
- comparing the maturity profile of financial liabilities with
the realisation profile of financial assets.
The Group’s policy is to ensure that all lease agreements
entered into, are over a period that will ensure that adequate
cash flows will be available to meet repayments.
The tables below reflect an undiscounted contractual
maturity analysis for financial liabilities. Financial guarantee
liabilities are treated as payable on demand since the Group
has no control over the timing of any potential settlement of
the liabilities.
Cash flows realised from financial assets reflect
management’s expectation as to the timing of realisation.
Actual timing may therefore differ from that disclosed. The
timing of cash flows presented in the table to settle financial
liabilities reflects the earliest contractual settlement dates
and does not reflect management’s expectations that
banking facilities will be rolled forward.
INTERNAL RATING GRADES DEFINITION BASIS FOR RECOGNITION AND MEASUREMENT OF ECL
¡. Performing The counterparty has a low risk of default and does not have any past-due amounts
12-month ECL
¡ ¡. Under-performing There has been a significant increase in credit risk since initial recognition
Lifetime ECL (not credit-impaired)
¡ ¡ ¡. Non-performing There is evidence indicating that the asset is credit-impaired
Lifetime ECL (credit-impaired)
83MACA LIMITED ANNUAL REPORT 2019

Within 1 Year 1 to 5 Years
2019 2018 2019 2018 2019 2018 2019 2018 2019 2018 2019 2018
‘000 ‘000 ‘000 ‘000 ‘000 ‘000 ‘000 ‘000 ‘000 ‘000 % %
Financial Assets
Cash 59,292 108,239 - - - - - - 59,292 108,239 0.80 1.56
Trade, Other Receivables - 20,244 8,185 15,139 39,165 155,405 116,502 190,787 163,852 6.4 6.8
Loans to Other Companies - 22,300 7,618 25,655 19,975 - - 47,955 27,593 9.5 10
Total Financial Assets 59,292 108,239 42,544 15,803 40,793 59,140 155,405 116,502 298,034 299,684
Financial Liabilities
Finance Lease - - 42,272 14,991 99,848 29,910 - - 142,120 44,901 4.00 4.66
Trade and Other Payables - - - - - 87,942 64,620 87,942 64,620 N/A N/A
Total Financial Liabilities - - 42,272 14,991 99,848 29,910 87,942 64,620 230,062 109,521
Floating Interest
Rate
Fixed Interest Rate Non-interest
BearingTotal
Weighted Average Effective Interest
Rate
Liquidity Risk (continued)
2019 2018 2019 2018 2019 2018 2019 2018
Section ‘000 ‘000 ‘000 ‘000 ‘000 ‘000 ‘000 ‘000
Financial Liabilities Due for Payment
Trade and Other Payables 4.6 87,942 64,620 - - - - 87,942
Finance Lease Liabilities 5.2.1 42,272 14,991 99,848 29,910 - - 142,120 44,901
Total Contractual Outflows 130,214 79,611 99,848 29,910 - - 230,062 109,521
Total Expected Outflows 130,214 79,611 99,848 29,910 - - 230,062 109,521
Financial Assets - Cash Flows Realisable
Cash and Cash Equivalents 5.1.1 59,292 108,239 - - - - 59,292 108,239
Trade and Other Receivables 4.1 175,649 124,687 15,139 39,165 - - 190,787 163,852
Other Investments 4.1 29,376 9,875 32,169 22,154 - - 61,545 32,029
Total Anticipated Inflows 264,317 242,801 47,308 61,319 - - 311,624 304,120
Net (Outflow)/Inflow on Financial Instruments 134,103 163,190 (52,541) 31,409 - - 81,562 194,599
TotalFinancial Liability and Financial Asset Maturity Analysis
Within 1 Year 1 to 5 Years Over 5 Years
64,620
SECTIONS TO THE FINANCIAL STATEMENTSFor the Year Ended 30 June 2019
No financial assets have been pledged as security for debt.
MARKET RISK
Interest Rate Risk
The Group’s exposure to interest rate risk, which is the risk that a financial instrument’s value will fluctuate as a result of
changes in market interest rates and the effective weighted average interest rates on those financial assets and financial
liabilities, is as follows:
5.3 FINANCIAL RISK MANAGEMENT (CONTINUED)
84 MACA LIMITED ANNUAL REPORT 2019
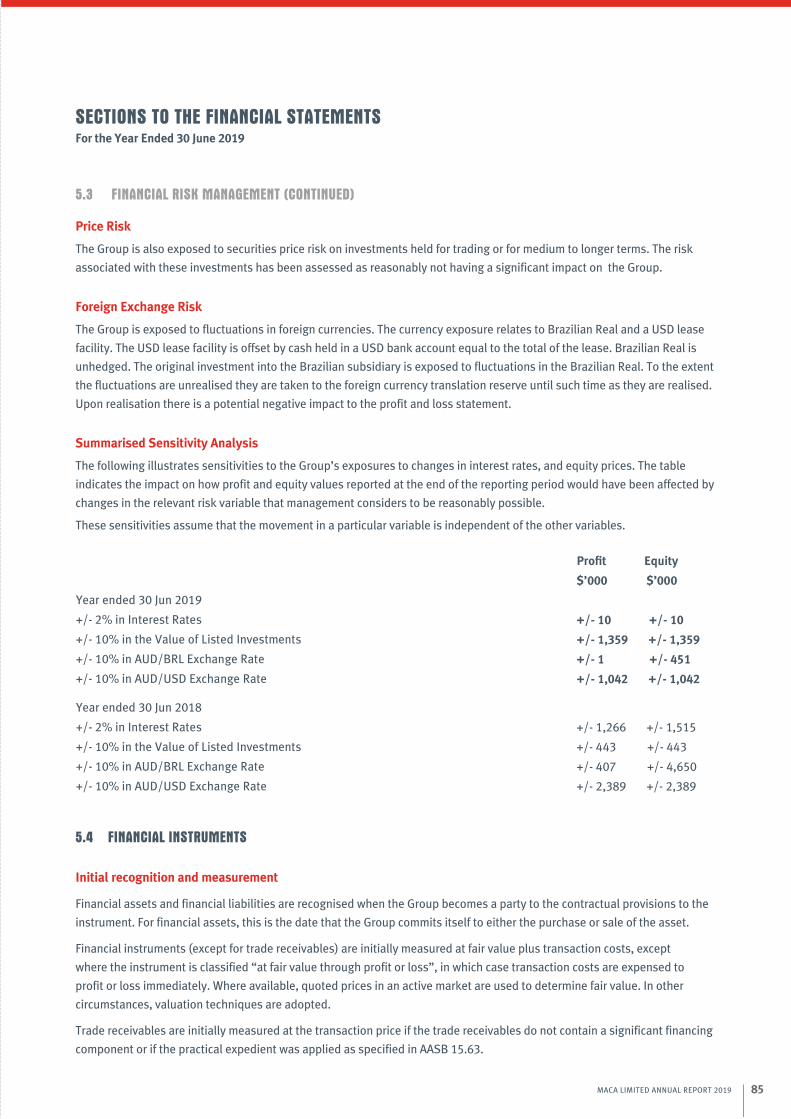
Profit Equity
$’000 $’000
Year ended 30 Jun 2019
+/- 2% in Interest Rates +/- 10 +/- 10
+/- 10% in the Value of Listed Investments +/- 1,359 +/- 1,359
+/- 10% in AUD/BRL Exchange Rate +/- 1 +/- 451
+/- 10% in AUD/USD Exchange Rate +/- 1,042 +/- 1,042
Year ended 30 Jun 2018
+/- 2% in Interest Rates +/- 1,266 +/- 1,515
+/- 10% in the Value of Listed Investments +/- 443 +/- 443
+/- 10% in AUD/BRL Exchange Rate +/- 407 +/- 4,650
+/- 10% in AUD/USD Exchange Rate +/- 2,389 +/- 2,389
SECTIONS TO THE FINANCIAL STATEMENTSFor the Year Ended 30 June 2019
Price Risk
The Group is also exposed to securities price risk on investments held for trading or for medium to longer terms. The risk
associated with these investments has been assessed as reasonably not having a significant impact on the Group.
Foreign Exchange Risk
The Group is exposed to fluctuations in foreign currencies. The currency exposure relates to Brazilian Real and a USD lease
facility. The USD lease facility is offset by cash held in a USD bank account equal to the total of the lease. Brazilian Real is
unhedged. The original investment into the Brazilian subsidiary is exposed to fluctuations in the Brazilian Real. To the extent
the fluctuations are unrealised they are taken to the foreign currency translation reserve until such time as they are realised.
Upon realisation there is a potential negative impact to the profit and loss statement.
Summarised Sensitivity Analysis
The following illustrates sensitivities to the Group’s exposures to changes in interest rates, and equity prices. The table
indicates the impact on how profit and equity values reported at the end of the reporting period would have been affected by
changes in the relevant risk variable that management considers to be reasonably possible.
These sensitivities assume that the movement in a particular variable is independent of the other variables.
5.3 FINANCIAL RISK MANAGEMENT (CONTINUED)
5.4 FINANCIAL INSTRUMENTS
Initial recognition and measurement
Financial assets and financial liabilities are recognised when the Group becomes a party to the contractual provisions to the
instrument. For financial assets, this is the date that the Group commits itself to either the purchase or sale of the asset.
Financial instruments (except for trade receivables) are initially measured at fair value plus transaction costs, except
where the instrument is classified “at fair value through profit or loss”, in which case transaction costs are expensed to
profit or loss immediately. Where available, quoted prices in an active market are used to determine fair value. In other
circumstances, valuation techniques are adopted.
Trade receivables are initially measured at the transaction price if the trade receivables do not contain a significant financing
component or if the practical expedient was applied as specified in AASB 15.63.
85MACA LIMITED ANNUAL REPORT 2019

SECTIONS TO THE FINANCIAL STATEMENTSFor the Year Ended 30 June 2019
5.4 FINANCIAL INSTRUMENTS (CONTINUED)
Classifi cation and subsequent measurement
Financial liabilities
Financial instruments are subsequently measured at:
– amortised cost; or
– fair value through profit or loss.
A financial liability is measured at fair value through profit
and loss if the financial liability is:
– a contingent consideration of an acquirer in a business
combination to which AASB 3: Business Combinations applies;
– held for trading; or
– initially designated as at fair value through profit or loss.
All other financial liabilities are subsequently measured at
amortised cost using the effective interest method.
The effective interest method is a method of calculating
the amortised cost of a debt instrument and of allocating
interest expense in profit or loss over the relevant period.
The effective interest rate is the internal rate of return of the
financial asset or liability. That is, it is the rate that exactly
discounts the estimated future cash flows through the
expected life of the instrument to the net carrying amount at
initial recognition.
A financial liability is held for trading if:
– it is incurred for the purpose of repurchasing or repaying
in the near term;
– part of a portfolio where there is an actual pattern of
short-term profit taking; or
– a derivative financial instrument (except for a derivative
that is in a financial guarantee contract or a derivative that
is in an effective hedging relationships).
Any gains or losses arising on changes in fair value are
recognised in profit or loss to the extent that they are not
part of a designated hedging relationship are recognised in
profit or loss.
The change in fair value of the financial liability attributable
to changes in the issuer’s credit risk is taken to other
comprehensive income and are not subsequently
reclassified to profit or loss. Instead, they are transferred
to retained earnings upon derecognition of the financial
liability. If taking the change in credit risk in other
comprehensive income enlarges or creates an accounting
mismatch, then these gains or losses should be taken to
profit or loss rather than other comprehensive income.
Financial assets
Financial assets are subsequently measured at:
– amortised cost;
– fair value through other comprehensive income; or
– fair value through profit or loss.
Measurement is on the basis of two primary criteria:
– the contractual cash flow characteristics of the financial
asset; and
– the business model for managing the financial assets.
A financial asset that meets the following conditions is
subsequently measured at amortised cost:
– the financial asset is managed solely to collect contractual
cash flows; and
– the contractual terms within the financial asset give rise
to cash flows that are solely payments of principal and
interest on the principal amount outstanding on specified
dates.
A financial asset that meets the following conditions
is subsequently measured at fair value through other
comprehensive income:
– the contractual terms within the financial asset give rise
to cash flows that are solely payments of principal and
interest on the principal amount outstanding on specified
dates;
– the business model for managing the financial assets
comprises both contractual cash flows collection and the
selling of the financial asset.
By default, all other financial assets that do not meet the
measurement conditions of amortised cost and fair value
through other comprehensive income are subsequently
measured at fair value through profit or loss.
The Group initially designates a financial instrument as
measured at fair value through profit or loss and it is in
accordance with the documented risk management or
investment strategy, and information about the groupings
was documented appropriately, so that the performance
of the financial liability that was part of a group of financial
liabilities or financial assets can be managed and evaluated
consistently on a fair value basis;
Equity instruments
At initial recognition, as long as the equity instrument is
not held for trading and not a contingent consideration
recognised by an acquirer in a business combination to
which AASB 3:Business Combinations applies, the Group
election to measure any subsequent changes in fair value
of the equity instruments in other comprehensive income,
while the dividend revenue received on underlying equity
instruments investment will still be recognised in profit or
loss.
Regular way purchases and sales of financial assets
are recognised and derecognised at settlement date in
accordance with the Group’s accounting policy.
86 MACA LIMITED ANNUAL REPORT 2019

SECTIONS TO THE FINANCIAL STATEMENTSFor the Year Ended 30 June 2019
5.4 FINANCIAL INSTRUMENTS (CONTINUED)
Derecognition
Derecognition refers to the removal of a previously
recognised financial asset or financial liability from the
statement of financial position.
Derecognition of fi nancial liabilities
A liability is derecognised when it is extinguished. An
exchange of an existing financial liability for a new one with
substantially modified terms, or a substantial modification
to the terms of a financial liability is treated as an
extinguishment of the existing liability and recognition of a
new financial liability.
The difference between the carrying amount of the financial
liability derecognised and the consideration paid and
payable, including any non-cash assets transferred or
liabilities assumed, is recognised in profit or loss.
Derecognition of fi nancial assets
A financial asset is derecognised when the holder’s
contractual rights to its cash flows expires, or the asset is
transferred in such a way that all the risks and rewards of
ownership are substantially transferred.
All of the following criteria need to be satisfied for
derecognition of financial asset:
– the right to receive cash flows from the asset has expired
or been transferred;
– all risk and rewards of ownership of the asset have been
substantially transferred; and
– the Group no longer controls the asset.
On derecognition of a financial asset measured at amortised
cost, the difference between the asset’s carrying amount
and the sum of the consideration received and receivable is
recognised in profit or loss.
On derecognition of a debt instrument classified as at fair
value through other comprehensive income, the cumulative
gain or loss previously accumulated in the investment
revaluation reserve is reclassified to profit or loss.
On derecognition of an investment in equity which was
elected to be classified under fair value through other
comprehensive income, the cumulative gain or loss
previously accumulated in the investment revaluation
reserve is not reclassified to profit or loss but is transferred
to retained earnings.
Impairment
The Group recognises a loss allowance for expected credit
losses on:
– financial assets that are measured at amortised cost or fair
value through other comprehensive income;
– lease receivables;
– contract assets;
– loan commitments that are not measured at fair value
through profit or loss; and
– financial guarantee contracts that are not measured at fair
value through profit or loss.
Loss allowance is not recognised for:
– financial assets measured at fair value through profit or
loss; or
– equity instruments measured at fair value through other
comprehensive income.
Expected credit losses are the probability-weighted
estimate of credit losses over the expected life of a financial
instrument. A credit loss is the difference between all
contractual cash flows that are due and all cash flows
expected to be received, all discounted at the original
effective interest rate of the financial instrument.
The Group uses the following approach to impairment, as
applicable under AASB 9: Financial Instruments:
General approach
Under the general approach, at each reporting period, the
Group assesses whether the financial instruments are credit-
impaired, and if:
– the credit risk of the financial instrument has increased
significantly since initial recognition, the Group measures
the loss allowance of the financial instruments at an
amount equal to the lifetime expected credit losses; or
– there is no significant increase in credit risk since initial
recognition, the Group measures the loss allowance for
that financial instrument at an amount equal to 12-month
expected credit losses.
Recognition of expected credit losses in fi nancial statements
At each reporting date, the Group recognises the movement
in the loss allowance as an impairment gain or loss in the
statement of profit or loss and other comprehensive income.
The carrying amount of financial assets measured at
amortised cost includes the loss allowance relating to that
asset.
Assets measured at fair value through other comprehensive
income are recognised at fair value, with changes in fair
value recognised in other comprehensive income. Amounts
in relation to change in credit risk are transferred from other
comprehensive income to profit or loss at every reporting
period.
For financial assets that are unrecognised, a provision
for loss allowance is created in the statement of financial
position to recognise the loss allowance.
87MACA LIMITED ANNUAL REPORT 2019

30 June 30 June
2019 2018
Section $’000 $’000
Total Borrowings 5.2.1 142,120 44,901
Less Cash and Cash Equivalents 5.1.1 (59,292) (108,239)
Net Debt/(Cash) 82,828 (63,338)
Total Equity 332,666 320,835
Total Capital 415,494 257,497
Gearing ratio 20% (25%)
SECTIONS TO THE FINANCIAL STATEMENTSFor the Year Ended 30 June 2019
The Company has no authorised share capital. Ordinary shares participate in dividends and the proceeds on winding up of
the parent entity in proportion to the number of shares held. At the shareholders’ meetings each ordinary share is entitled to
one vote when a poll is called, otherwise each shareholder has one vote on a show of hands.
Performance Rights
For information relating to performance rights, including details of performance rights issued, excercised and lapsed during
the financial year, refer to Section 5.8.
Capital Management
Management controls the capital of the Group in order to maintain a prudent debt to equity ratio, provide the shareholders
with adequate returns and ensure that the Group can fund its operations and continue as a going concern.
The Group’s debt and capital includes ordinary share capital and financial liabilities, supported by financial assets.
There are no externally imposed capital requirements. Management effectively manages the Group’s capital by assessing
the Group’s financial risks and adjusting its capital structure in response to changes in these risks and in the market. These
responses include the management of debt levels, distributions to shareholders and share issues.
30 June 30 June
2019 2018
Issued Capital $’000 $’000
269,806 269,806
Ordinary Shares No. No.
At the Beginning of the Reporting Period 268,007,708 234,343,334
Shares Issued During the Year
- 6 September 2017 Conversion of Performance Rights - 233,506
- 20 September 2017 Placement of Securities @ $1.80 per share - 33,430,868
Shares at Reporting Date 268,007,708 268,007,708
268,007,708 (2018: 268,007,708) Fully Paid Ordinary Shares With No Par Value
5.5 EQUITY
88 MACA LIMITED ANNUAL REPORT 2019
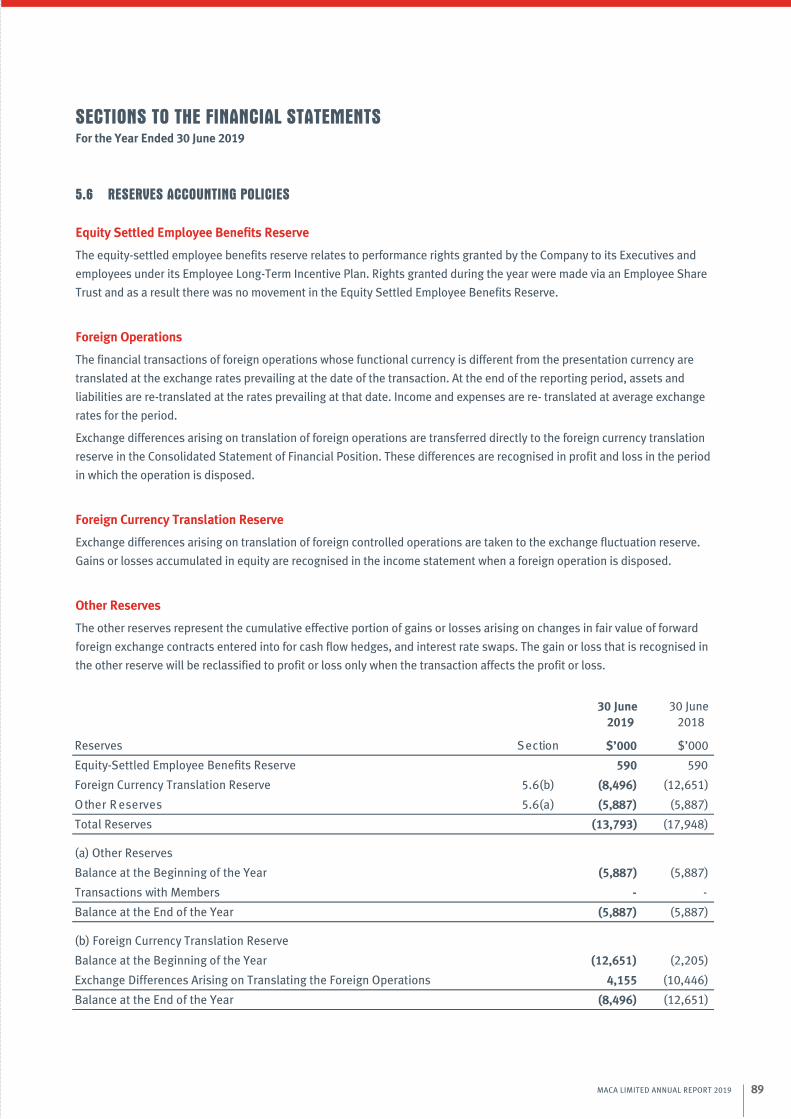
SECTIONS TO THE FINANCIAL STATEMENTSFor the Year Ended 30 June 2019
5.6 RESERVES ACCOUNTING POLICIES
Equity Settled Employee Benefi ts Reserve
The equity-settled employee benefits reserve relates to performance rights granted by the Company to its Executives and
employees under its Employee Long-Term Incentive Plan. Rights granted during the year were made via an Employee Share
Trust and as a result there was no movement in the Equity Settled Employee Benefits Reserve.
Foreign Operations
The financial transactions of foreign operations whose functional currency is different from the presentation currency are
translated at the exchange rates prevailing at the date of the transaction. At the end of the reporting period, assets and
liabilities are re-translated at the rates prevailing at that date. Income and expenses are re- translated at average exchange
rates for the period.
Exchange differences arising on translation of foreign operations are transferred directly to the foreign currency translation
reserve in the Consolidated Statement of Financial Position. These differences are recognised in profit and loss in the period
in which the operation is disposed.
Foreign Currency Translation Reserve
Exchange differences arising on translation of foreign controlled operations are taken to the exchange fluctuation reserve.
Gains or losses accumulated in equity are recognised in the income statement when a foreign operation is disposed.
Other Reserves
The other reserves represent the cumulative effective portion of gains or losses arising on changes in fair value of forward
foreign exchange contracts entered into for cash flow hedges, and interest rate swaps. The gain or loss that is recognised in
the other reserve will be reclassified to profit or loss only when the transaction affects the profit or loss.
30 June 30 June
2019 2018
noitceSReserves $’000 $’000
Equity-Settled Employee Benefits Reserve 590 590
)b(6.5Foreign Currency Translation Reserve (8,496) (12,651)
)a(6.5 sevreseR rehtO (5,887) (5,887)
Total Reserves (13,793) (17,948)
(a) Other Reserves
Balance at the Beginning of the Year (5,887) (5,887)
Transactions with Members - -
Balance at the End of the Year (5,887) (5,887)
(b) Foreign Currency Translation Reserve
Balance at the Beginning of the Year (12,651) (2,205)
Exchange Differences Arising on Translating the Foreign Operations 4,155 (10,446)
Balance at the End of the Year (8,496) (12,651)
89MACA LIMITED ANNUAL REPORT 2019

Distributions Paid
Cents Per Share
$’000Cents Per
Share$’000
Interim Dividend in Respect of FY19/FY18 0.020 5,360 0.030 8,040
Final Dividend in Respect of FY19/FY18 0.025 6,700 0.035 9,380
Total 0.045 12,060 0.065 17,421
Balance of franking account at year end 44,576 37,069
30 June 2019 30 June 2018
SECTIONS TO THE FINANCIAL STATEMENTSFor the Year Ended 30 June 2019
5.7 DIVIDENDS
In respect of FY19, the Directors declared the payment of a Final Dividend of 2.5 cents per share fully franked to the holders
of fully paid ordinary shares on the Company’s register at 5th September 2019 with payment date of 20th September 2019
The amount of the Final Dividend is $6.7 million. No provision has been made for the Final Dividend in the Financial
Statements as the final dividend was not declared or determined by the Directors on or before the end of the financial year.
90 MACA LIMITED ANNUAL REPORT 2019

Unlisted Performance Rights
Unlisted Performance Rights
Outstanding at the Beginning of the Year
Granted
Vested
Cancelled or Expired
Outstanding at the End of the Year
Number
2018
Number
972,231
30-Jun-21
30-Jun-20
Expiry Date
1,263,646
2019
Number
2,014,485
1,473,586
-
(1,252,194)
2,235,877 2,014,485
(1,820,690)
(233,506)
972,231
3,096,450
SECTIONS TO THE FINANCIAL STATEMENTSFor the Year Ended 30 June 2019
5.8 SHARE-BASED COMPENSATION
Options
There were no options issued for the year ended 30 June 2019. The weighted average fair value of options granted during the
previous year was Nil.
Performance Rights
The Company issues performance rights to Senior executives in accordance with the terms of the Long-Term Incentive Plan
and the Performance Rights Plan as approved by Shareholders. When vested, each performance right is converted into one
ordinary share for no consideration. Performance rights granted carry no dividend or voting rights.
During the 2019 financial year 1,473,586 (2018: 972,231) performance rights were granted under the Group’s Performance
Rights Plan and 209,941 (2018: 334,637) performance rights were forfeited. Subject to the achievement of designated
performance hurdles, these performance rights will vest in June 2021. As at 30 June 2019 there were 2,235,877 (2018:
2,014,485) performance rights outstanding.
The following performance rights arrangement was in existence at 30 June 2019:
An independent valuation was completed on performance rights granted during the year. Market based vesting conditions
were valued using a hybrid share option pricing model that simulates the share price of the Company as at the test date using
a Monte-Carlo simulation model. For non-market based vesting conditions no discount was made to the underlying valuation
model.
The weighted average fair value of the performance rights granted during the year ended 30 June 2019 was $0.66 per
right. Payments were made to the MACA ERT Trust for delivery of shares under the Performance Rights Plan. Inputs used to
determine the fair value of performance rights granted during the year ended 30 June 2019 were:
- Share price $1.19 being the 30 day VWAP of the Company on the last trading day prior to 30 June 2018
- Exercise price: Nil
- Volatility: 44.08%
- Option life: 3 years
- Dividend yield: 5.1%
- Risk Free Rate 2.07%
91MACA LIMITED ANNUAL REPORT 2019

Country of Incorporation
30 June 30 June
2019 2018
Parent Entity:
AustraliaMACA Limited - -
Subsidiaries:
Australia 100% 100%
Australia 100% 100%
Australia 100% 100%
Australia 100% 100%
Australia 100% 100%
Brazil 100% 100%
Australia 100% 100%
Australia 100% 100%
Australia 50% 50%
Australia 60% 60%
Cambodia 100% -
Percentage Owned (%)
MACA Mining Pty Ltd
MACA Plant Pty Ltd
MACA Crushing Pty Ltd
MACA Civil Pty Ltd
Riverlea Corporation Pty Ltd
MACA Mineracaoe Construcao Civil Ltda
Alliance Contracting Pty Ltd
MACA Infrastructure Pty Ltd
Marniyarra Mining and Civils Pty Ltd
Interquip Pty Ltd
OPMS Cambodia Co Ltd
SECTIONS TO THE FINANCIAL STATEMENTSFor the Year Ended 30 June 2019
SECTION 6 OTHER
6.1 BUSINESS COMBINATIONS ACCOUNTING POLICIES
Business combinations occur where an acquirer obtains
control over one or more businesses.
A business combination is accounted for by applying the
acquisition method, unless it is a combination involving
entities or businesses under common control. The business
combination will be accounted for from the date that control
is obtained, whereby the fair value of the identifiable
assets acquired and liabilities (including contingent
liabilities) assumed is recognised (subject to certain limited
exemptions).
When measuring the consideration transferred in the
business combination, any asset or liability resulting from
a contingent consideration arrangement is also included.
Subsequent to initial recognition, contingent consideration
classified as equity is not remeasured and its subsequent
settlement is accounted for within equity.
Contingent consideration classified as an asset or liability
is remeasured in each reporting period to fair value,
recognising any change to fair value in profit or loss,
unless the change in value can be identified as existing at
acquisition date.
All transaction costs incurred in relation to business
combinations, other than those associated with the issue of
a financial instrument, are recognised as expenses in profit
or loss when incurred.
The acquisition of a business may result in the recognition of
goodwill or a gain from a bargain purchase.
Refer 4.5 Intangible Assets for treatment and calculation of
goodwill.
There were no business combinations during the year ended
30 June 2019 and 30 June 2018.
6.2 CONTROLLED ENTITIES
Details of the Company’s subsidiaries at the end of the reporting period are as follows:
92 MACA LIMITED ANNUAL REPORT 2019

30 June 30 June
2019 2018
$’000 $’000
Short-Term Employee Benefits 4,187 4,228
Post-Employment Benefits 196 192
Other Long-Term Benefits - -
Long-Term Incentive Payments 798 707
Total Remuneration 5,181 5,127
SECTIONS TO THE FINANCIAL STATEMENTSFor the Year Ended 30 June 2019
6.3 RELATED PARTY TRANSACTIONS
Transactions between related parties are on normal commercial terms and conditions no more favourable than those
available to other parties unless otherwise stated. Transactions with related parties:
Key Management Personnel
Any person(s) having authority and responsibility for planning, directing and controlling the activities of the entity, directly or
indirectly, including any director (whether executive or otherwise) of that entity, are considered key management personnel.
Information regarding individual directors or executives remuneration is provided in the Remuneration Report included in
the Directors Report.
Controlled Entities
Interests in controlled entities are set out Section 6.2.
During the year, funds have been advanced between
entities within the Group for the purposes of working capital
requirements.
Other Related Parties
Other related parties include entities over which key
management personnel exercise significant influence.
Transactions between related parties are on normal
commercial terms and conditions no more favourable than
those available to other parties unless otherwise stated.
30 June 30 June
2019 2018
$'000 $'000
1,520 1,599
10 48
5 44
2,456 2,381
- -
Amounts payable at year end arising from the above transactions
177 264
Partnership comprising entities controlled by current director Mr G.Baker and former directors Mr J.Moore, Mr D.Edwards & Mr F.Maher.
Kirk Mining Consultants - a company controlled by current director Mr L.Kirk.
Gateway Equipment Parts & Services Pty Ltd - a company controlled by current director Mr G.Baker and former directors Mr D.Edwards, Mr F.Maher and Mr J.Moore.
Gateway Equipment Parts & Services Pty Ltd - a company controlled by current director Mr G.Baker and former directors Mr D.Edwards, Mr F.Maher and Mr J.Moore.
Hensman Properties Pty Ltd - a company controlled by current director Mr R.Ryan.
Gateway Equipment Parts & Services Pty Ltd - a company controlled by director Mr G.Baker and former directors Mr D.Edwards, Mr F.Maher and Mr J.Moore.
Expense - Rent on Division St Business premises.
Expense - Mining consulting fees
Expense - Consulting fees
Expense - hire of equipment and purchase of equipment, parts and services.
Revenue - sale of equipment
Key Management Person and/or Related Party Transaction
93MACA LIMITED ANNUAL REPORT 2019

SECTIONS TO THE FINANCIAL STATEMENTSFor the Year Ended 30 June 2019
6.4 CONTINGENT LIABILITIES
Performance Guarantees
MLD has indemnified its bankers and insurance bond providers in respect of bank guarantees, insurance bonds and
letters of credit to various customers and suppliers for satisfactory contract performance and warranty security, in the
following amounts:
30 June 2019: $15.4 million 30 Jun 2018: $14.9 million
Claims
Certain claims arising out of engineering and construction contracts have been made by, or against, controlled entities
in the ordinary course of business. The Directors do not consider the outcome of any of these claims will be materially
different to the position taken in the financial accounts of the Group.
6.5 EVENTS AFTER BALANCE SHEET DATE
The Directors have recommended a final dividend payment of 2.5 cents per share. Refer to Section 5.7 for details.
Subsequent to the year end, the following major contracts have been awarded to the Group:
- Award of Karratha / Tom Price Road Contract by Main Roads Western Australia which is expected to generate
revenue of $81 million.
Other than the above, there has not been any matter or circumstance occurring subsequent to the end of the financial
year that has significantly affected, or may significantly affect, the operations of the Group, the results of those
operations, or the state of affairs of the Group in future financial years.
94 MACA LIMITED ANNUAL REPORT 2019

SECTIONS TO THE FINANCIAL STATEMENTSFor the Year Ended 30 June 2019
6.6 PARENT ENTITY DISCLOSURES
The following information has been extracted from the books and records of the Company and has been prepared in
accordance with Accounting Standards
30 June 30 June
2019 2018
Statement of Financial Position $’000 $’000
Assets
Current Assets 46,761 85,310
Total Assets 380,157 375,418
Liabilities
Current Liabilities 4,498 2,148
Total Liabilities 4,498 2,148
Equity
Issued Capital 362,212 362,212
Reserves 707 707
(Accumulated Losses) / Retained Profits 12,739 10,351
Total Equity 375,659 373,270
Statement of Financial Performance
Profit For the Year (Including Interco Dividends) 17,128 22,852
Total Comprehensive Income 17,128 22,852
Guarantees
MACA Limited has entered into guarantees for certain equipment finance facilities in the current financial year, inrelation to the debts entered into by its subsidiaries.
95MACA LIMITED ANNUAL REPORT 2019

INDEPENDENT AUDIT REPORT
Liability limited by a scheme approved under Professional Standards Legislation. Moore Stephens - ABN 16 874 357 907. An independent member of Moore Global Network
Limited - members in principal cities throughout the world. The Perth Moore Stephens firm is not a partner or agent of any other Moore Global Network Limited member firm.
96 MACA LIMITED ANNUAL REPORT 2019

�
�
�
�
�
−
−
�
�
�
−−
−
�
�
97MACA LIMITED ANNUAL REPORT 2019

�
�
�
�
�
�
�
�
�
�
INDEPENDANT AUDIT REPORT CONTINUED
98 MACA LIMITED ANNUAL REPORT 2019
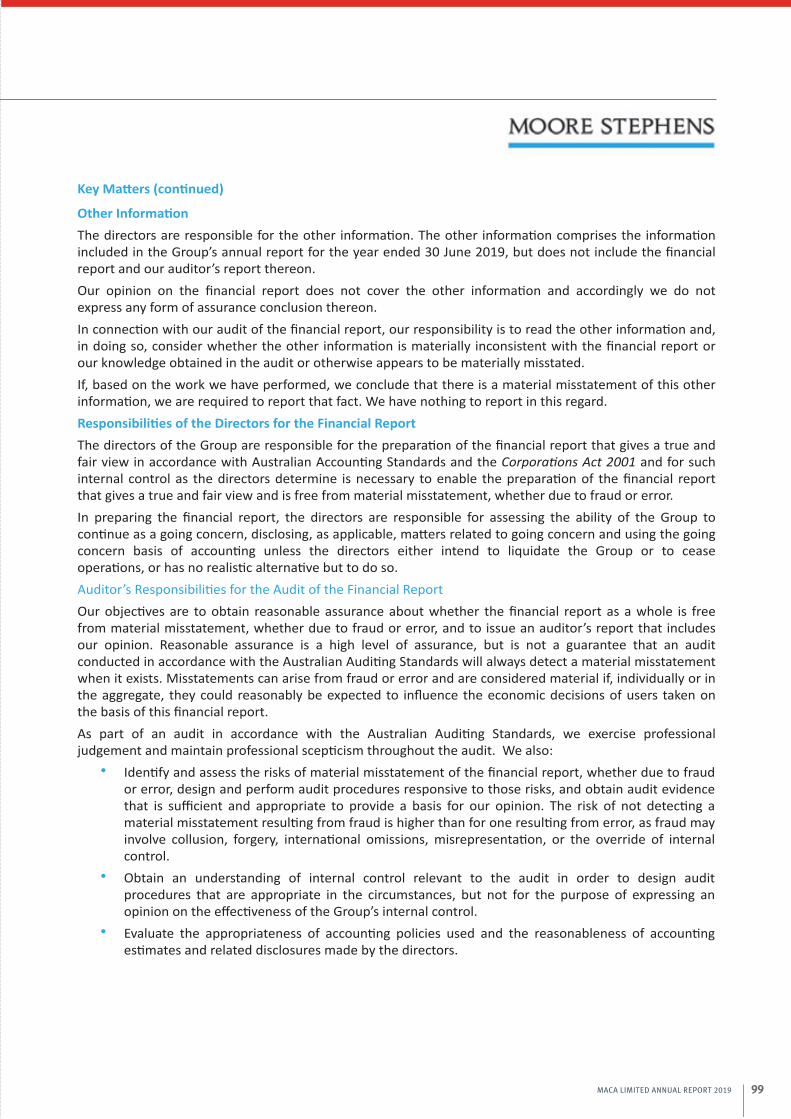
�
�
�
99MACA LIMITED ANNUAL REPORT 2019

�
�
�
9
INDEPENDANT AUDIT REPORT CONTINUED
100 MACA LIMITED ANNUAL REPORT 2019
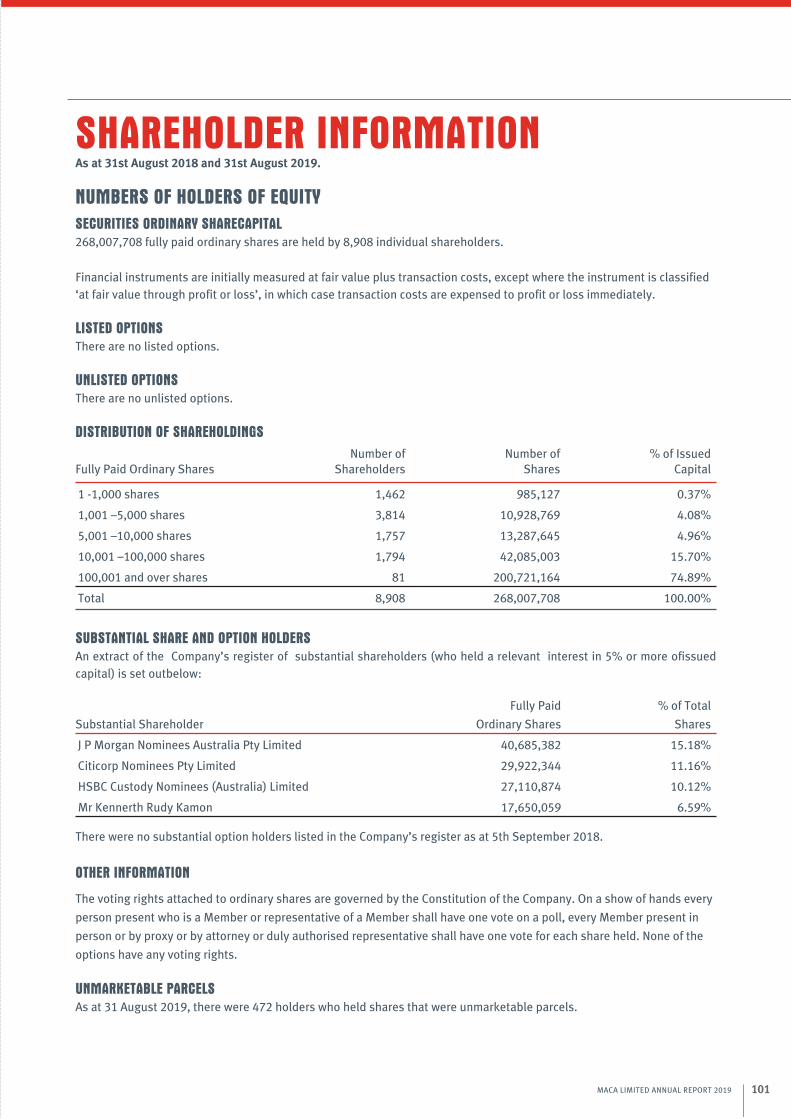
SHAREHOLDER INFORMATION
NUMBERS OF HOLDERS OF EQUITY
SECURITIES ORDINARY SHARECAPITAL
268,007,708 fully paid ordinary shares are held by 8,908 individual shareholders.
Financial instruments are initially measured at fair value plus transaction costs, except where the instrument is classified
‘at fair value through profit or loss’, in which case transaction costs are expensed to profit or loss immediately.
LISTED OPTIONS
There are no listed options.
UNLISTED OPTIONS
There are no unlisted options.
DISTRIBUTION OF SHAREHOLDINGS
Number of Number of % of IssuedFully Paid Ordinary Shares Shareholders Shares Capital
1 -1,000 shares 1,462 985,127 0.37%
1,001 –5,000 shares 3,814 10,928,769 4.08%
5,001 –10,000 shares 1,757 13,287,645 4.96%
10,001 –100,000 shares 1,794 42,085,003 15.70%
100,001 and over shares 81 200,721,164 74.89%
Total 8,908 268,007,708 100.00%
SUBSTANTIAL SHARE AND OPTION HOLDERS
An extract of the Company’s register of substantial shareholders (who held a relevant interest in 5% or more ofissued
capital) is set outbelow:
Substantial Shareholder
Fully Paid
Ordinary Shares
% of Total
Shares
J P Morgan Nominees Australia Pty Limited 40,685,382 15.18%
Citicorp Nominees Pty Limited 29,922,344 11.16%
HSBC Custody Nominees (Australia) Limited 27,110,874 10.12%
Mr Kennerth Rudy Kamon 17,650,059 6.59%
There were no substantial option holders listed in the Company’s register as at 5th September 2018.
OTHER INFORMATION
The voting rights attached to ordinary shares are governed by the Constitution of the Company. On a show of hands every
person present who is a Member or representative of a Member shall have one vote on a poll, every Member present in
person or by proxy or by attorney or duly authorised representative shall have one vote for each share held. None of the
options have any voting rights.
UNMARKETABLE PARCELS
As at 31 August 2019, there were 472 holders who held shares that were unmarketable parcels.
As at 31st August 2018 and 31st August 2019.
101MACA LIMITED ANNUAL REPORT 2019

MLD’S TOP TWENTY SHAREHOLDERS
Registered Shareholder
Fully paid
Ordinary shares
% of total
shares
J P MORGAN NOMINEES AUSTRALIA LIMITED 40,682,382 15.2%
CITICORP NOMINEES PTY LIMITED 29,922,344 11.2%
HSBC CUSTODY NOMINEES (AUSTRALIA) LIMITED 27,110,874 10.1%
MR KENNETH RUDY KAMON 17,650,059 6.6%
GEMBLUE NOMINEES PTY LTD <THE G A BAKER FAMILY A/C> 12,863,816 4.8%
MR FRANCIS JOSEPH MAHER + MS SHARON JANE MAHER 12,300,000 4.6%
NATIONAL NOMINEES LIMITED 10,657,927 4.0%
BNP PARIBAS NOMINEES PTY LTD <AGENCY LENDING DRP A/C> 9,522,353 3.6%
MR JAMES EDWARD MOORE + MS JULIA CATHERINE MOORE 5,350,000 2.0%
CITICORP NOMINEES PTY LIMITED <COLONIAL FIRST STATE INV A/C> 3,893,796 1.5%
SARGON CT PTY LTD <CHARITABLE FOUNDATION> 2,582,987 1.0%
BNP PARIBAS NOMINEES PTY LTD <IB AU NOMS RETAILCLIENT DRP> 2,445,057 0.9%
BNP PARIBAS NOMS PTY LTD <DRP> 2,073,040 0.8%
NEWECONOMY COM AU NOMINEES PTY LIMITED <900 ACCOUNT> 1,879,224 0.7%
MR KENNETH JOSEPH HALL <HALL PARK A/C> 1,590,352 0.6%
MS TINA HARDY <THE HARDY FAMILY A/C> 1,470,588 0.6%
WARBONT NOMINEES PTY LTD <UNPAID ENTREPOT A/C> 1,095,229 0.4%
BUTTONWOOD NOMINEES PTY LTD 1,049,235 0.4%
MR CHRISTOPHER MARK TUCKWELL <TUCKWELL FAMILY A/C> 1,288,801 0.4%
MR DAVID STEWARD 800,000 0.3%
Total Held by Top 20 185,884,000 69.4%
Total Ordinary Fully Paid Shares on Issue 268,007,708 100.0%
RESTRICTED SECURITIES
There were no restricted securities at the date of this report.
VOTING RIGHTS
ORDINARY SHARES
For all ordinary shares, voting rights are on a show of hands whereby every member present in person or by proxy shall
have one vote and upon a poll, each share shall have one vote.
OTHER INFORMATION
MLD Limited is incorporated and domiciled in Australia and is a publicly listed company by shares.
COMPANY DETAILS
The registered office is: The principal place of businesses:
MACA Limited MACA Limited
45 Division Street 45 Division Street
Welshpool, Western Australia, 6106 Welshpool, Western Australia, 6106
SHAREHOLDER INFORMATION CONTINUED
102 MACA LIMITED ANNUAL REPORT 2019

103MACA LIMITED ANNUAL REPORT 2019

MACA Limited and its Controlled Entities ABN 42 144 745 782
Perth
45 Division Street,
Welshpool WA 6106
T: +61 8 6242 2600
F: + 61 8 6242 2677
www.maca.net.au