machine learning 10-701 - carnegie mellon school of...
TRANSCRIPT
1
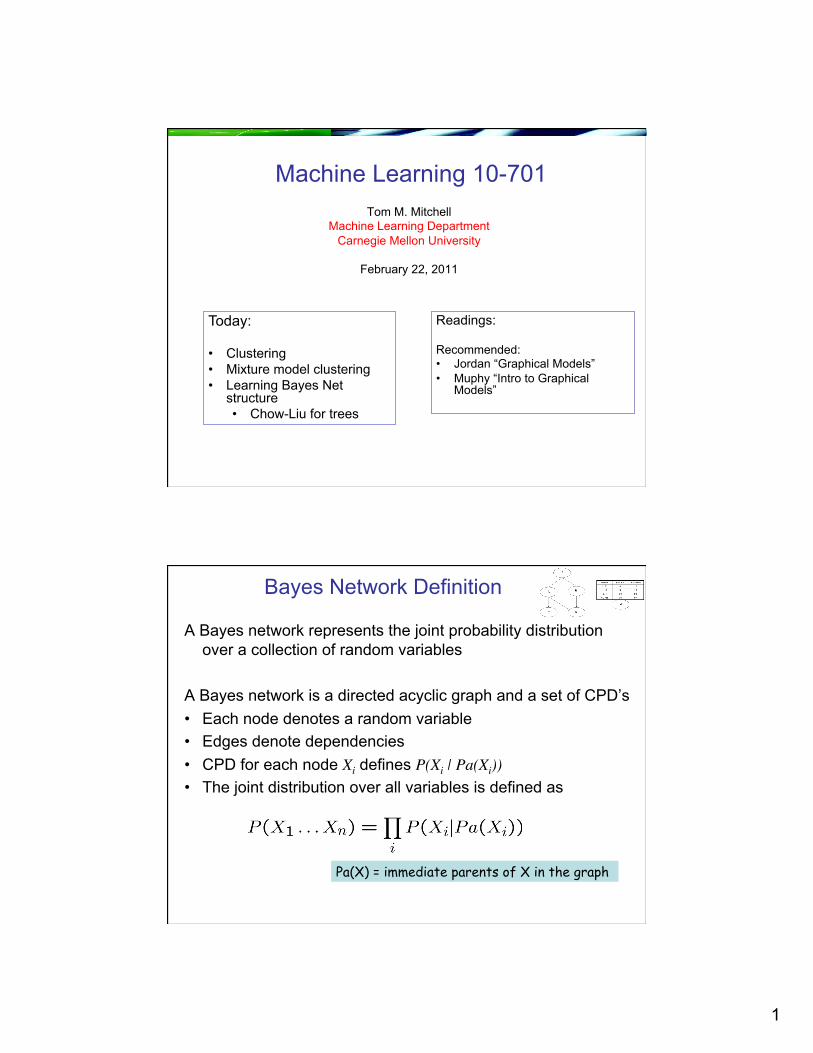
Machine Learning 10-701 Tom M. Mitchell
Machine Learning Department Carnegie Mellon University
February 22, 2011
Today:
• Clustering • Mixture model clustering • Learning Bayes Net
structure • Chow-Liu for trees
Readings:
Recommended: • Jordan “Graphical Models” • Muphy “Intro to Graphical
Models”
Bayes Network Definition
A Bayes network represents the joint probability distribution over a collection of random variables
A Bayes network is a directed acyclic graph and a set of CPD’s • Each node denotes a random variable • Edges denote dependencies • CPD for each node Xi defines P(Xi | Pa(Xi)) • The joint distribution over all variables is defined as
Pa(X) = immediate parents of X in the graph

2
Usupervised clustering
Just extreme case for EM with zero labeled examples…
Clustering
• Given set of data points, group them • Unsupervised learning • Which patients are similar? (or which earthquakes,
customers, faces, web pages, …)
3
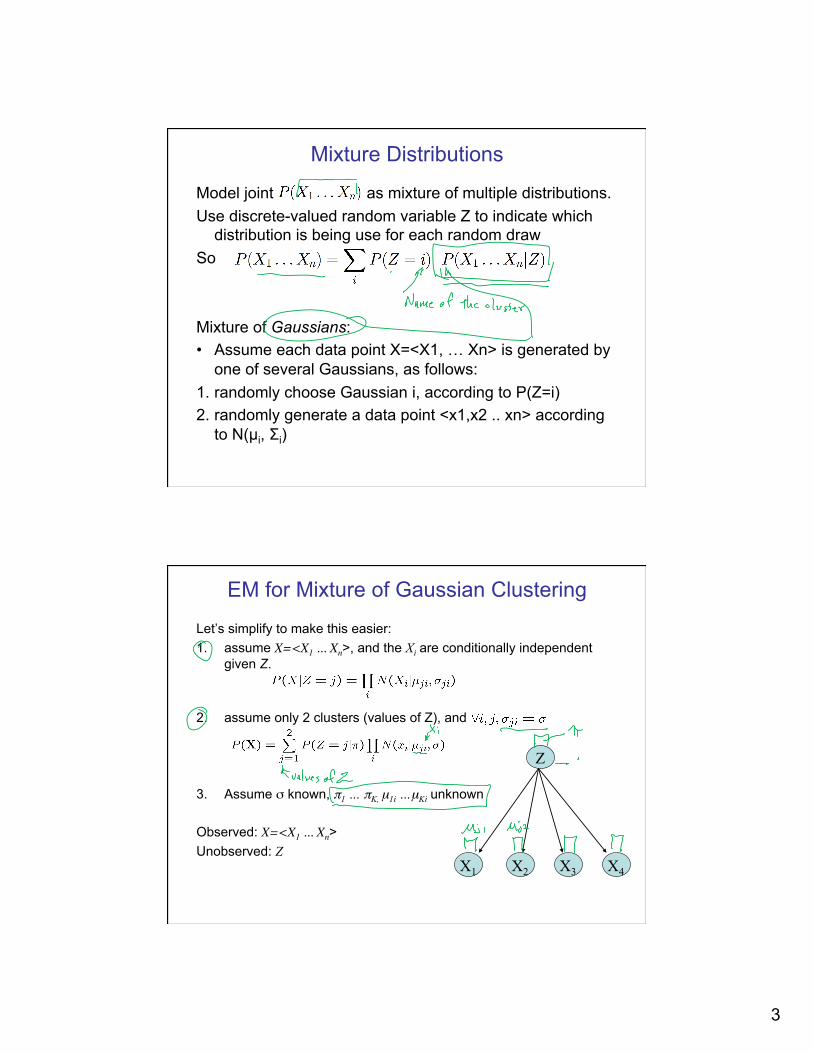
Mixture Distributions
Model joint as mixture of multiple distributions. Use discrete-valued random variable Z to indicate which
distribution is being use for each random draw So
Mixture of Gaussians: • Assume each data point X=<X1, … Xn> is generated by
one of several Gaussians, as follows: 1. randomly choose Gaussian i, according to P(Z=i) 2. randomly generate a data point <x1,x2 .. xn> according
to N(µi, Σi)
EM for Mixture of Gaussian Clustering
Let’s simplify to make this easier: 1. assume X=<X1 ... Xn>, and the Xi are conditionally independent
given Z.
2. assume only 2 clusters (values of Z), and
3. Assume σ known, π1 … πK, µ1i …µKi unknown
Observed: X=<X1 ... Xn> Unobserved: Z
Z
X1 X4 X3 X2
4
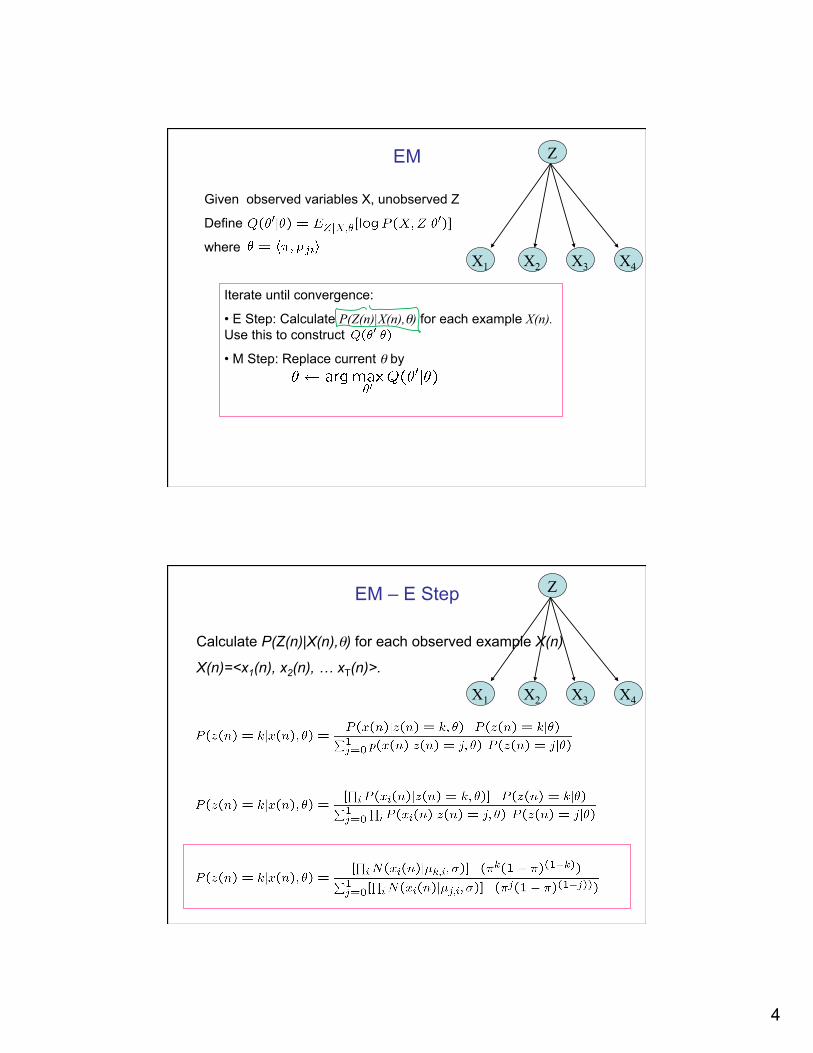
EM
Given observed variables X, unobserved Z
Define
where
Iterate until convergence:
• E Step: Calculate P(Z(n)|X(n),θ) for each example X(n). Use this to construct
• M Step: Replace current θ by
Z
X1 X4 X3 X2
EM – E Step
Calculate P(Z(n)|X(n),θ) for each observed example X(n)
X(n)=<x1(n), x2(n), … xT(n)>.
Z
X1 X4 X3 X2
5
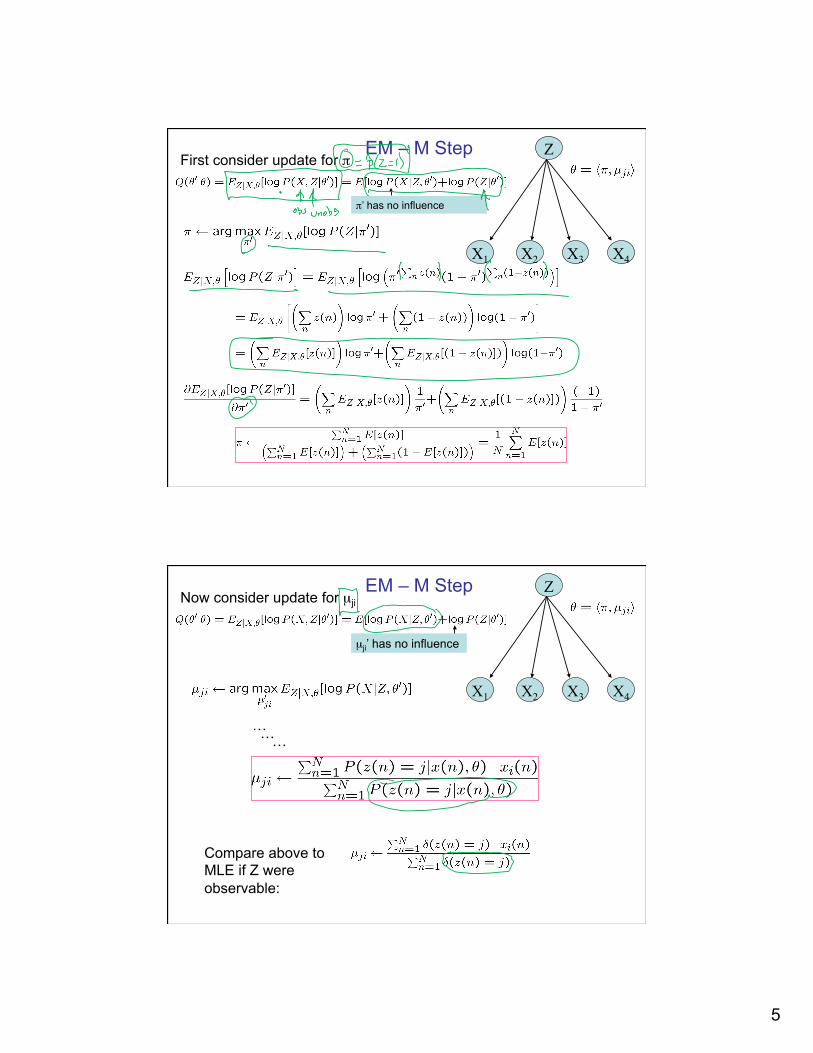
EM – M Step Z
X1 X4 X3 X2
First consider update for π
π’ has no influence
EM – M Step Z
X1 X4 X3 X2
Now consider update for µji
µji’ has no influence
… … …
Compare above to MLE if Z were observable:

6
EM – putting it together
Given observed variables X, unobserved Z
Define
where
Iterate until convergence:
• E Step: For each observed example X(n), calculate P(Z(n)|X(n),θ)
• M Step: Update
Z
X1 X4 X3 X2
Mixture of Gaussians applet
Go to: http://www.socr.ucla.edu/htmls/SOCR_Charts.html then go to Go to “Line Charts” SOCR EM Mixture Chart • try it with 2 Gaussian mixture components (“kernels”) • try it with 4
7
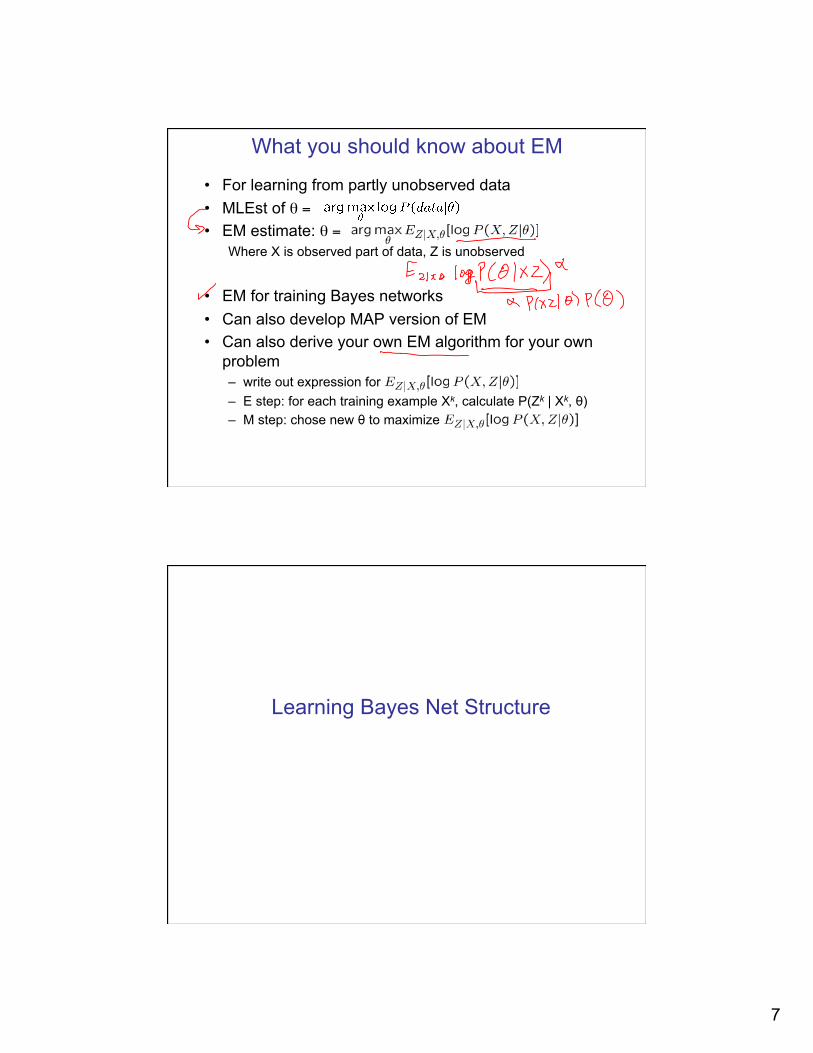
• For learning from partly unobserved data • MLEst of θ = • EM estimate: θ =
Where X is observed part of data, Z is unobserved
• EM for training Bayes networks • Can also develop MAP version of EM • Can also derive your own EM algorithm for your own
problem – write out expression for – E step: for each training example Xk, calculate P(Zk | Xk, θ) – M step: chose new θ to maximize
What you should know about EM
Learning Bayes Net Structure

8
How can we learn Bayes Net graph structure?
In general case, open problem • can require lots of data (else high risk of overfitting) • can use Bayesian methods to constrain search
One key result: • Chow-Liu algorithm: finds “best” tree-structured network • What’s best?
– suppose P(X) is true distribution, T(X) is our tree-structured network, where X = <X1, … Xn>
– Chou-Liu minimizes Kullback-Leibler divergence:
9
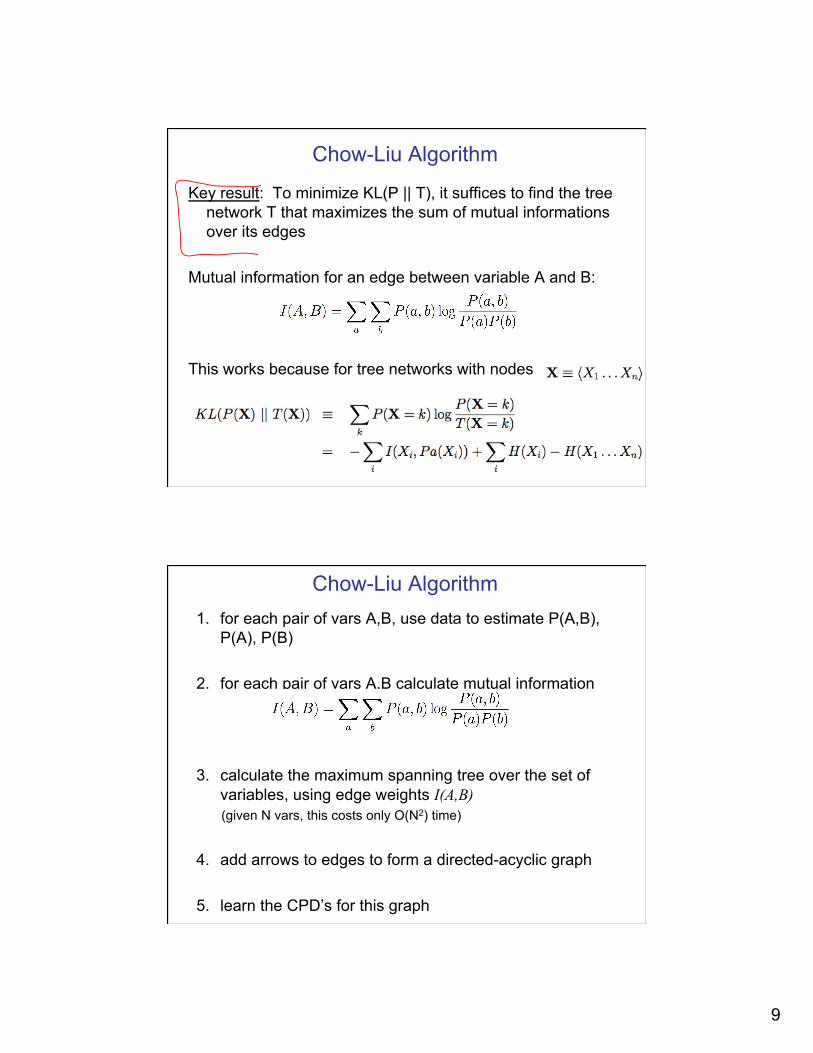
Chow-Liu Algorithm
Key result: To minimize KL(P || T), it suffices to find the tree network T that maximizes the sum of mutual informations over its edges
Mutual information for an edge between variable A and B:
This works because for tree networks with nodes
Chow-Liu Algorithm 1. for each pair of vars A,B, use data to estimate P(A,B),
P(A), P(B)
2. for each pair of vars A,B calculate mutual information
3. calculate the maximum spanning tree over the set of variables, using edge weights I(A,B) (given N vars, this costs only O(N2) time)
4. add arrows to edges to form a directed-acyclic graph
5. learn the CPD’s for this graph
10
1/
1/
1/
1/
1/
1/
1/
1/
1/
1/
1/
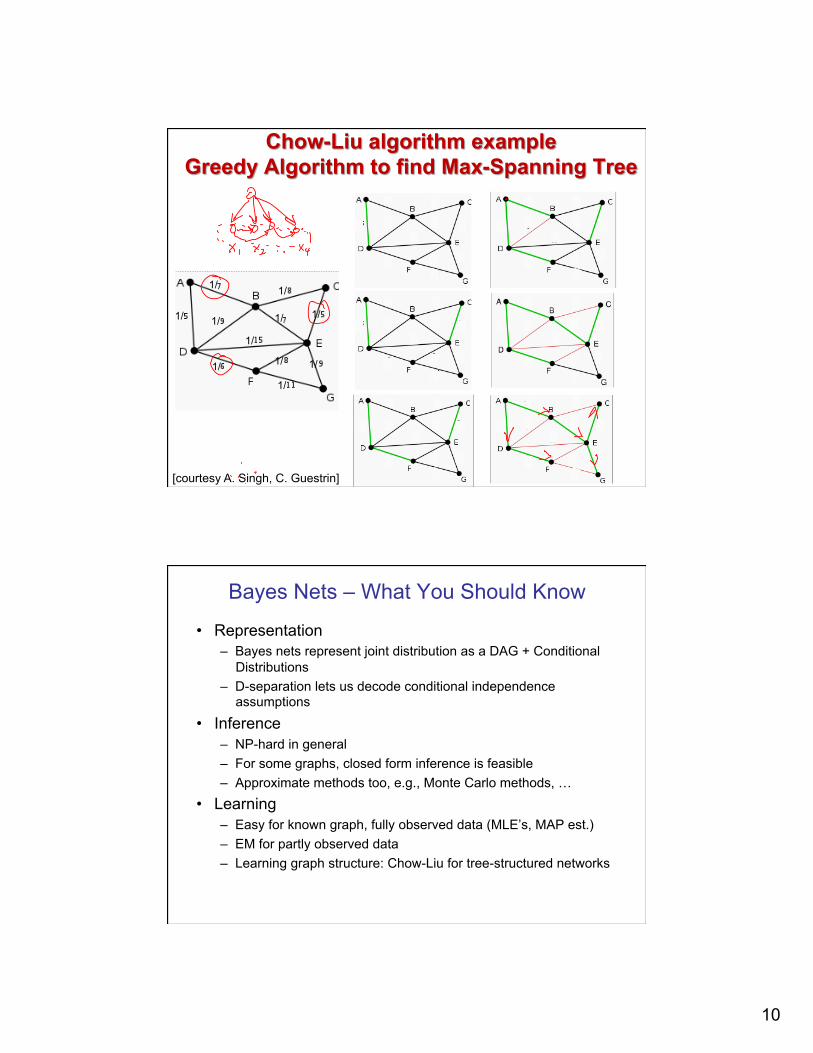
[courtesy A. Singh, C. Guestrin]
Bayes Nets – What You Should Know
• Representation – Bayes nets represent joint distribution as a DAG + Conditional
Distributions – D-separation lets us decode conditional independence
assumptions
• Inference – NP-hard in general – For some graphs, closed form inference is feasible – Approximate methods too, e.g., Monte Carlo methods, …
• Learning – Easy for known graph, fully observed data (MLE’s, MAP est.) – EM for partly observed data – Learning graph structure: Chow-Liu for tree-structured networks