machine learning and a computational fluid dynamic
TRANSCRIPT
Journal of Advanced Ceramics 2021, 10(3): 537–550 ISSN 2226-4108https://doi.org/10.1007/s40145-021-0456-3 CN 10-1154/TQ
Research Article
www.springer.com/journal/40145
Machine learning and a computational fluid dynamic
approach to estimate phase composition of chemical vapor deposition boron carbide
Qingfeng ZENGa,b,*, Yong GAOa, Kang GUANc,*, Jiantao LIUd, Zhiqiang FENGe,
f
aScience and Technology on Thermostructural Composite Materials Laboratory, School of Materials Science and Engineering, Northwestern Polytechnical University, Xi’an 710072, China
bMSEA International Institute for Materials Genome, Gu’an 065500, China cSchool of Materials Science and Engineering, South China University of Technology, Guangzhou 510640, China
dSchool of Mechanical Engineering, Southwest Jiaotong University, Chengdu 610031, China eSchool of Mechanics and Engineering, Southwest Jiaotong University, Chengdu 610031, China
fLMEE-UEVE, Université Paris-Saclay, Evry 91020, France
Received: August 10, 2020; Revised: December 24, 2020; Accepted: January 6, 2021
© The Author(s) 2021.
Abstract: Chemical vapor deposition is an important method for the preparation of boron carbide. Knowledge of the correlation between the phase composition of the deposit and the deposition conditions (temperature, inlet gas composition, total pressure, reactor configuration, and total flow rate) has not been completely determined. In this work, a novel approach to identify the kinetic mechanisms for the deposit composition is presented. Machine leaning (ML) and computational fluid dynamic (CFD) techniques are utilized to identify core factors that influence the deposit composition. It has been shown that ML, combined with CFD, can reduce the prediction error from about 25% to 7%, compared with the ML approach alone. The sensitivity coefficient study shows that BHCl2 and BCl3 produce the most boron atoms, while C2H4 and CH4 are the main sources of carbon atoms. The new approach can accurately predict the deposited boron–carbon ratio and provide a new design solution for other multi-element systems.
Keywords: machine learning (ML); computational fluid dynamic (CFD); chemical vapor deposition; boron carbide; B/C ratio; kinetic mechanisms
1 Introduction
Ceramic matrix composites (CMC) are ideal high- temperature materials because of their high-temperature resistance, wear resistance, low thermal conductivity, * Corresponding authors. E-mail: Q. Zeng, [email protected];
K. Guan, [email protected]
low thermal expansion coefficient, high chemical resistance, and high strength [1,2]. The common material systems of CMC are carbon fiber-reinforced silicon carbide matrix composite, carbon fiber-reinforced carbon matrix composite, and silicon carbide fiber- reinforced silicon carbide matrix composite (Cf/SiC, Cf/C, and SiCf/SiC) [3,4]. Because boron carbide (BxC) can react with oxygen to generate boron oxide glass phase (B2O3, HBO3, and H3BO3) and then seal cracks to
538 J Adv Ceram 2021, 10(3): 537–550
www.springer.com/journal/40145
prevent further oxidation [5–9], it is a good candidate for oxidation protective materials, and it is usually added to modify the interface and matrix of CMC.
Chemical vapor deposition (CVD) is a promising method for the preparation of boron carbide [7,10–12]. The deposition mechanism for BxC from a BCl3–CH4–H2
system has been previously studied. For instance, Berjonneau et al. [13,14] identified the main gaseous species in situ by Fourier transform infrared (FTIR) spectroscopy, such as BCl3, BHCl2, and HCl. The B/C ratio of the deposits decreased from 3.6 to 2 when the deposition temperature increased from 900 to 1100 . Karaman et al. [11,12] considered BHCl2 a by-product of the gas phase. Liu et al. [15] systematically studied the relationship between deposition morphology and processing conditions. They found that temperature has an effect on the phase composition and microstructure. At higher temperatures (1050–1100 ), the deposits consisted of two interlaced phases (PyC and boron carbide) with low boron content ranging from about 40 to 49 at%. At lower temperatures (900–950 ), layered and dense B4C was produced with uniform phase composition, and its boron content is 65–79 at%.
It was considered that BxC exists as a single stable phase in a large homogeneous region from about 8 to 20 at% carbon concentration (the corresponding B/C ratio is from 11.5 to 4) [7], and then a carbon-rich BxC coating was obtained when B/C ratio was lower than 4 [15,16]. Thus, it is important to elucidate the correlation between the B/C ratio of the deposit and the deposition conditions to achieve reproducibility and consistency in the process. Apart from experimental studies, some numerical studies have provided an in-depth understanding of deposition kinetics [17–19], but scarce modeling attempts have been reported in boron carbide. Only Reinisch et al. [20] reported it by combining experimental and reaction kinetics computations, and brought strong evidences of the presence of methydichloroborane (MDB, BCl2CH3) in the process.
This paper is concerned with the correlation between deposit composition and processing parameters, such as temperature, inlet gas concentration, pressure, and gas flow velocity. A novel approach that considers gas phase kinetics and heat and mass transfer, in combination with machine learning (ML), is proposed to better understand the actual deposition mechanism and design of the deposit composition. The approach was applied to a BCl3–CH4–H2 system, which provides a useful foundation in understanding other precursor systems, such as
SiCl4–BCl3–NH3–H2–Ar [21] and BCl3–MTS–H2 [13]. This paper is organized as follows: In Section 2, the
details of the reactor model (RM) and two machine learning (ML) methods, including error back propagation (BP) algorithm and support vector machine (SVM), are presented. In Section 3, ML was used to directly correlate the global processing parameters (temperature, inlet gas composition, total pressure, reactor inner diameter, and total flow rate) with the experimentally measured boron–carbon ratio of the deposits. However, no satisfactory functional relationship was found. Then, the proposed method was applied and validated by comparing the experimental data.
2 Model simulation and prediction
2. 1 Reactor-scale model
The experimental data reported by Berjonneau et al. [13,14] and Liu et al. [15] are adopted in this study. The specific deposition parameters for their experiments are listed in Table 1. In Ref. [15], B4C and pyrolytic carbon (PyC) were deposited onto graphite slices (30 mm × 15 mm × 2 mm) [15]. Boron trichloride (BCl3 ≥ 99.99 vol%) and methane (CH4 ≥ 99.95 vol%) were used as the boron and carbon sources, respectively. The reactor was a vertical, hot-wall deposition furnace with a 200 mm inner diameter (a diagram of the equipment is shown in Fig. 1). The temperature within the reactor was 900–1100 , and the pressure was fixed at 10 kPa. Berjonneau et al. [13,14] adopted the analogous CVD reactor, which was a vertical silica glass tube (700 mm in length and 34 mm in internal diameter) heated in its central part by a radio-frequency induction furnace. Their processing conditions are as follows: 850–1000 , 2–12 kPa, and total flow rate of 210–390 sccm.
Because the reactor is cylindrical and symmetrical, its CFD model can be simplified to a two-dimensional axisymmetric model. The mass and heat transfer values were accounted via conservation of mass and conservation of momentum:
( ) 0 u (1)
T 2( ) ( ( ) ) ( )
3p
u u I u u u I (2)
where p is the total fluid pressure, μ is the hydrodynamic viscosity, ρ is the fluid density, u is the fluid velocity field, and I is the unit tensor.

J Adv Ceram 2021, 10(3): 537–550 539
www.springer.com/journal/40145
Table 1 CVD experimental conditions from Refs. [13–15]
No. T () Q (sccm) ID (mm) P (kPa) In_BCl3 In_CH4 In_H2 B/C
1 900 125 200 10 10/23 2/23 11/23 4.34
2 900 125 200 10 2/19 2/19 15/19 0.31
3 900 125 200 10 2/5 2/15 11/15 4.70
4 950 125 200 10 8/23 2/23 13/23 2.31
5 950 125 200 10 4/15 2/15 9/15 1.83
6 950 125 200 10 8/21 2/21 11/21 0.99
7 1000 125 200 10 2/11 2/11 7/11 0.35
8 1000 125 200 10 4/19 2/19 13/19 0.42
9 1000 125 200 10 10/27 2/27 15/27 2.32
10 1050 125 200 10 6/17 2/17 9/17 0.91
11 1050 125 200 10 4/19 2/19 13/19 0.70
12 1050 125 200 10 8/19 2/19 9/19 0.84
13 1100 125 200 10 6/23 2/23 15/23 0.78
14 1100 125 200 10 10/19 2/19 7/19 0.98
15 1100 125 200 10 2/15 2/15 11/15 0.44
16 850 250 34 12 4/25 1/25 20/25 3.5
17 900 250 34 12 4/25 1/25 20/25 2.8
18 950 250 34 12 4/25 1/25 20/25 2.8
19 850 390 34 12 2/13 1/13 10/13 3.6
20 900 390 34 12 2/13 1/13 10/13 3.0
21 950 390 34 12 2/13 1/13 10/13 3.2
22 1000 390 34 12 2/13 1/13 10/13 2.0
23 850 390 34 12 4/13 1/13 8/13 2.9
24 900 390 34 12 4/13 1/13 8/13 3.1
25 950 390 34 12 4/13 1/13 8/13 2.6
26 850 210 34 12 2/7 1/7 4/7 2.4
27 900 210 34 12 2/7 1/7 4/7 2.3
28 950 210 34 12 2/7 1/7 4/7 2.9
Note: Q is the total flow rate. In_BCl3, In_CH4, and In_H2 are the input molar fractions of BCl3, CH4, and H2, respectively. ID is the reactor inner diameter and B/C is the boron–carbon ratio of the deposited products.
Fig. 1 CVD reactor equipment diagram.
The chamber was heated through the induction of the graphite layer by the radiation frequency (RF) coil
to generate eddy currents. Heat transfer occurred mainly through surface radiation and convection conduction, and the electromagnetic phenomenon was neglected. The main governing equations are as follows:
pC T q Q u (3)
where pC is the fluid heat capacity, T is the deposition temperature of the fluid, and q is the Fourier heat conduction. The radiative transfer equation (RTE) is used to describe the transfer process of radiant heat.
A beam of incident light propagates in the medium along the direction and interacts with the medium. Part of the light intensity ( )I Ω is partially absorbed by ( )kI Ω , where 1(m )k is the absorption coefficient; the other part of the light is along s ( )I Ω direction
540 J Adv Ceram 2021, 10(3): 537–550
www.springer.com/journal/40145
scattering, where 1s( , m ) is the scattering coefficient.
The intensity of directional light will be attenuated by scattering in different directions, and will be enhanced by radiation in different directions. Therefore, this radiation process is described by the following equation:
b s
4πs
0
( ) ( ) ( ) ( )
( ) ( , )d4π
I kI T k I
I
(4)
where the probability of ray scattering from the direction of to the direction of is described by the scattering phase function ( , ) . bkI represents the radiation of the medium in all directions, where bI is the intensity of the black body.
The most commonly used method for calculating the radiation transfer equation is the discrete coordinate method. The principle of this method is to calculate the ordinate component in the discrete direction. Therefore, it is still necessary to solve the intensity I by calculating the partial differential equation on each discrete ordinate:
b s1
( ) ( ) ( , )4π
ns
i i i j j j ij
S I kI T k I I S S
(5)
where iS is the discrete ordinate in the i-th direction and j is the orthogonal weight.
For multi-component diffusion, the balance of the i-th chemical species includes the contribution of diffusion, convection, and loss/production of species in K gas phase reactions.
1
( )( )
( ), 1, ,
ii i
Kg g
i ik k kk
wv J
t
M v i N
R R
(6)
Among them, i and iM represent the mass fraction and molecular weight of species i, respectively. The total mass and mole fraction are
1
1N
ii
(7)
1
1N
ii
x
(8)
Diffusion flux ( iJ
) is the sum of concentration ( ciJ
) and temperature gradient ( T
iJ
):
c Ti i iJ J J
(9)
, 1, ,T Ti i
TJ D i N
T
(10)
1
( ) , 1, ,N
ci ij j
j
J D i N
(11)
where ijD and TiD are the matrix of multi-component
diffusion coefficient and multi-component thermal diffusion coefficient, respectively. T
iD is calculated by gas kinetic theory, and specific information can be found in Ref. [22]. The following equation was used to calculate the binary diffusion rate (m2/s) [23]:
3
A B A B32
AB
( ) / ( )1.8829 10i
D
T M M M MD
p
(12)
where M is the molar mass, is the minimum energy value of the characteristic length; subscripts A and B indicate binary diffusion gas species; and D is the collision integral:
b
, , ,D DΩ f Tk
(13)
To calculate the collision integral DΩ , we need to define the minimum energy values of the characteristic length and Lennard–Jones interaction potential, which are (10–10 m) and b/ (K)k , respectively. It is also necessary to provide a material dipole moment D (Debye). The values were obtained from Ref. [24], databases, or experiments (Table 2). and b/k of BCl3 were approximated for the unknown coefficients of other boron-containing intermediates.
The density of the mixed gas is expressed by the ideal gas equation:
PM
RT (14)
1
N
i ii
M x M
(15)
where M is the molar mass of the mixed gas.
Table 2 Characteristic lengths of major substances / b k and Lennard–Jones interaction potential (σ)
Gas species b/ ( )k K σ (Å)
CH4 154 3.78
C2H2 209 4.1
C2H4 280 3.97
C2H6 252.3 4.302
HCl 344.7 3.339
H2 38 2.92
BCl3 337.7 5.127
Note: The material dipole moment D is uniformly zero.

J Adv Ceram 2021, 10(3): 537–550 541
www.springer.com/journal/40145
The detailed chemical kinetic model that describes gas-phase reactions in CVD has been presented in several studies. Table 3 lists 62 reversible reactions adopted for the gas model in the present case. Ge et al. [25–27] focused precisely on the thermodynamics of Si–C–H–Cl systems. Moreover, the temperature conditions they studied are within the range of our research temperature. Therefore, for C–H–Cl systems (G1–G44 in Table 3), we preferentially adopted Ge’s
calculated data. Based on the most favorable reaction path previously proposed, Liu et al. [28] studied the reaction rate of the BCl3/CH4/H2 gas-phase system. Their rate constants were calculated for temperatures within 200–2000 K and adopted G45–G58 [29]. Reinisch et al. [30] reported a set of theoretical experiments of the gas-phase decomposition of boron trichloride in the presence of hydrogen radicals, and their reactions are also included (G59–G62 in Table 3).
Table 3 A list of gas phase reaction models
No. Reaction A (s–1 or m3·mol–1·s–1) n E (kJ·mol–1)
G1 CH4→CH3 + H 8.3 × 10¹³ 0 434.4
Reverse rate 1.294 × 10⁹ –0.4 0
G2 C2H4→C2H2 + H2 5.317 × 10¹¹ 0.892 454.7
Reverse rate 430.4 1.273 271.2
G3 C2H5→C2H4 + H 1.66 × 10¹³ 0.093 171.5
Reverse rate 9.834 × 10⁷ 0.098 30.1
G4 C2H6→2CH3 1.2 × 10²² –1.79 381
Reverse rate 1.024 × 10⁹ –0.64 0
G5 C2H6 + CH2↔C2H5 + CH3 1.2 × 10⁸ 0 0
G6 2CH↔C2H2 1.204 × 10⁸ 0 0
G7 CH2 + H↔CH + H2 3.011 × 10⁷ 0 0
G8 CH2 + CH↔C2H2 + H 3.975 × 10⁷ 0 0
G9 2CH2↔C2H4 1.024 × 10⁶ 0 0
G10 2CH2↔C2H2 + 2H 1.084 × 10⁸ 0 3.3
G11 2CH2↔C2H2 + H2 1.204 × 10⁷ 0 3.3
G12 CH3 + CH↔C2H3 + H 3.011 × 10⁷ 0 0
G13 CH 3+ CH2↔C2H4 + H 1.807 × 10⁷ 0 0
G14 2CH3→C2H5 + H 1.148 × 10¹⁵ 0 110
Reverse rate 3.674 × 10⁷ 0 0
G15 CH4 + CH↔C2H5 1.626 × 10⁸ 0 0
G16 CH4 + CH↔C2H4 + H 3.011 × 10⁷ 0 –1.6
G17 CH4 + CH2↔C2H6 1.024 × 10⁷ 0 0
G18 C2H3 + M↔C2H2 + H + M 3.011 × 10⁹ 0 133
G19 C2H3 + H2→C2H4 + H 3.011 × 10⁻² 2.63 36
Reverse rate 1.325 2.53 51
G20 C2H3 + CH2↔C2H2 + CH3 1.807 × 10⁷ 0 0
G21 C2H3 + CH3↔C2H2 + CH4 3.914 × 10⁵ 0 0
G22 C2H4 + M↔C2H2 + H2 + M 1.5 × 10⁹ 0 233.6
G23 C2H4 + M↔C2H3 + H + M 1.4 × 10¹⁰ 0 344.8
G24 C2H4 + H2→C2H5 + H 1.024 × 10⁷ 0 285
Reverse rate 1.807 × 10⁶ 0 0
G25 C2H4 + C2H2↔2C2H3 2.409 × 10⁷ 0 286
G26 2C2H4→C2H3 + C2H5 4.818 × 10⁸ 0 299
Reverse rate 4.818 × 10⁵ 0 0
G27 CH4 + CH3↔C2H5 + H2 1.024 × 10⁷ 0 95.6

542 J Adv Ceram 2021, 10(3): 537–550
www.springer.com/journal/40145
(Continued)
No. Reaction A (s–1 or m3·mol–1·s–1) n E (kJ·mol–1)
G28 C2H5 + H2→C2H6 + H 3.071 × 10⁻⁶ 3.6 35
Reverse rate 1.445 × 10³ 1.5 31
G29 C2H5 + CH3↔C2H4 + CH4 1.987 × 10⁷ 0.5 0
G30 C2H6 + CH3→C2H5 + CH4 0.549 × 10⁻³ 4 34.6
Reverse rate 8.618 × 10⁻⁸ 4.14 52.6
G31 2C2H5↔C2H6 + C2H4 7.227 × 10⁶ 0 4.5
G32 C2H5 + C2H4→C2H6 + C2H3 6.624 × 10⁻⁴ 3.13 75.4
Reverse rate 6.022 × 10⁻⁴ 3.3 43.9
G33 C2H2 + C2H6→C2H3 + C2H5 104.4 2.05 292.8
Reverse rate 5.553 × 10⁷ –0.346 46.4
G34 C2H4→C2H3 + H 4.365 × 10¹² 0.945 451.6
Reverse rate 8.428 × 10⁷ 0 0
G35 2CH3→CH2 + CH4 0.0152 3.153 64.6
Reverse rate 62.25 2.451 54.8
G36 CH2 + HCl→CH3 + Cl 183.417 1.71 8.9
Reverse rate 39.6 2.24 31.8
G37 CH3 + Cl→CH2 + HCl 2.2 × 10⁷ 0 34.5
Reverse rate 1.698 × 10⁶ 0 3.63
G38 C2H5 + HCl→C2H6 + Cl 0.0123 2.29 0
Reverse rate 1.4365 × 10⁴ 1.476 8.4
G39 CH3 + HCl→CH4 + Cl 70.106 1.412 15.7
Reverse rate 1.642 × 10⁻⁷ 4.51 5.9
G40 H2 + H→3H 2.228 × 10⁸ 0 402
Reverse rate 9.792 × 10⁵ –1 0
G41 2H2→2H + H2 9.033 × 10⁸ 0 402
Reverse rate 9.792 × 10⁴ –0.6 0
G42 2H + M↔H2 + M 5.44 × 10¹² –1.3 0
G43 HCl→H + Cl 1.109 × 10¹⁷ –0.681 417.6
Reverse rate 96.39 1.87 –35.2
G44 Cl + H2→HCl + H 7.52 × 10⁻⁴ 3.39 –4.9
Reverse rate 4.379 × 10⁸ –0.091 35.4
G45 BCl3→BCl2 + Cl 5.85 × 10¹³ 0.31 464.1
Reverse rate 2.74 × 10⁸ 1.44 17.88
G46 CH4 + BCl3→CH3BCl2 + HCl 2.08 × 10⁷ 1.43 194.8
Reverse rate 2.4 × 10⁸ 0.5 148.4
G47 CH3BCl2→CH2BCl2 + H 1.98 × 10⁸ 1.6 348.2
Reverse rate 4.29 × 10⁸ 1.23 12.7
G48 CH3BCl2 + Cl→CH2BCl2 + HCl 8.67 × 10⁶ 1.79 5.43
Reverse rate 1.76 × 10⁶ 1.78 53.0
G49 CH2BCl2→CHBCl2 + H 1.5 × 10¹⁶ –0.79 218.75
Reverse rate 6.2 × 10¹⁵ –0.87 55.4
G50 CHBCl2 + H→CHBCl + HCl 1.05 × 10⁹ 1.36 38.58
Reverse rate 4.6 × 10⁵ 2.16 127.6
G51 CHBCl + Cl→CBCl + HCl 2.67 × 10¹⁴ –0.48 247.49
Reverse rate 6.4 × 10¹¹ 0.048 159.2

J Adv Ceram 2021, 10(3): 537–550 543
www.springer.com/journal/40145
(Continued)
No. Reaction A (s–1 or m3·mol–1·s–1) n E (kJ·mol–1)
G52 CBCl + H→CHBCl 4.58 × 10¹¹ 0.89 2.69
Reverse rate 1.05 × 1025 0.77 18.61
G53 CHBCl→BC + HCl 7.0 × 10¹³ –0.024 30.12
Reverse rate 1.17 × 10⁸ 1.64 39.2
G54 BCl3 + H2→BHCl2 + HCl 1.26 × 10⁹ 1.11 191.3
Reverse rate 2.24 × 10⁴ 2.13 99.65
G55 BHCl2 + H→BH2Cl2 3.29 × 10⁹ 1.28 7.15
Reverse rate 3.52 × 1025 0.58 0.98
G56 BH2Cl2→BCl2 + H2 2.25 × 10¹⁵ –0.69 54.83
Reverse rate 6.68 × 10⁹ 0.47 64.8
G57 BCl2→BCl + Cl 1.90 × 10¹² 0.47 305.5
Reverse rate 1.4 × 10¹⁰ 1.13 4.14
G58 BCl + H→B + HCl 2.37 × 10¹² 0.47 112.7
Reverse rate 3.27 × 10¹⁰ 1.05 4.76
G59 BCl3 + H→BHCl3 2.33 × 10⁷ –0.54 13.23
G60 BCl3 + H→BHCl2 + Cl 2.31 × 10³ 1.36 44.8
G61 BCl3 + H→BCl2 + HCl 4.09 × 10³ 0.97 49.8
G62 BCl3 + H→BCl2 + HCl 2.6 × 10⁴ 1.23 108.4
Note: The rate constants are written according to Arrhenius equation: K = ATne−E/RT. “↔” denotes the reverse rates calculated from equilibrium thermochemistry.
2. 2 ML
With the great success of data-driven modeling, ML has received increasing attention [31–34]. Considering the production of the variety of intermediate species and the complexity of the deposition process of the CVD–BxC, we combined a reactor model (RM) with ML, as shown in Fig. 2. Considering N arbitrary samples ( , )i iX t , where T
1 2[ , , ... , ] ,ni i i inX x x x R
T1 2, , ... ,[ ] m
i i i imt t t t R . iX represents the input data set, and it is the output data set.
1 1 3 1 4 1 2
2 2 3 2 4 2 2
3 4 2
( ), (BCl ), (CH ), (BHCl )...,
( ), (BCl ), (CH ), (BHCl )...,
..., ..., ..., ...,...,
( ), (BCl ), (CH ), (BHCl )...,
i
N N N N
x T x x x
x T x x xX
x T x x x
(16)
Error back propagation (BP) algorithm and support vector machine (SVM) are two commonly used machine learning algorithms. They have many applications in material studies [35,36]; thus, they are applied in ML. The BP algorithm is composed of two processes: forward calculation of data stream (forward propagation) and backward propagation of error signal. In forward propagation, the propagation direction is from the input layer to the hidden layer and then to the output layer. The state of each layer of neurons only affects the next layer of neurons. However, if the actual output does not match the expected output, the process of back propagation of errors is then entered. Error back propagation involves passing the output error back to the input layer through the hidden layer, layer by layer,
Fig. 2 ML model design for B/C prediction.

544 J Adv Ceram 2021, 10(3): 537–550
www.springer.com/journal/40145
apportioning the error to all units of each layer, and using the error signal obtained from each layer as the basis for adjusting the weight of each unit. Through these two processes alternately, the error function gradient descent strategy is performed in the weight vector space, and a set of weight vectors are dynamically studied to achieve the minimum network error function value. Learning rate and learning error of BP neural network structure are set as 0.01 and 0.001, respectively. Considering the network accuracy and calculation time, three layers of BP neural network structure are selected, and the number of the hidden layer nodes is chosen as 10 by trial-and-error techniques. The N arbitrary samples ( , )i iX t were entered into the BP neural algorithm program, and the specific steps are as follows:
1) Initialize the network, and randomly assign each connection weight and threshold values ,i tr ;
2) Compute hidden layers from a given input–output mode pair;
3) Calculate new connection weights and thresholds; 4) Select the next input mode pair to return to the
second step, and repeat the training until the network output error reaches the required training.
The SVM algorithm is very powerful; it not only supports linear and nonlinear classification but also linear and nonlinear regression [37]. In the process of determining the hyperplane with the largest geometric interval, only the sample points closest to the hyperplane play a role. Such sample points are called support vectors. This classification model is also called support vector machine. In practical problems, data is usually not linearly separable in a multidimensional space; that is, in the input space where the data is located, there is no hyperplane that can complete the required classification. A feasible solution is to apply kernel techniques to map data from the input space to a higher dimensional space through a specific function and look for hyperplanes in the higher dimensional space. We call this space a feature space. Because the input space is mapped to a higher dimensional feature space through specific mapping, the amount of calculation in the higher dimensional space will increase significantly, and the computational complexity will also increase significantly.
In the SVM regression, the system attempts to fit as many data as possible into the interval while limiting the margin violation. To reduce the amount of calculation, on the premise that the calculation of the support vector machine involves only the inner product calculation, a kernel function is introduced to convert the inner product
calculation in the feature space into a non-linear transformation of the inner product operation of the data in the input space. SVM needs to adjust the relevant parameters, mainly penalty parameter (denoted as C) and nuclear function parameter (denoted as G), to get a better predictive accuracy. C demonstrates how much the data range could be adapted for data fitting, the greater the C value, the wider the data range, and thus lead to overfitting more likely. G implicitly determines the distribution of the data after mapping to the new feature space. The larger the G, the less the support vector. The number of support vectors affects the speed of training and prediction. With regard to the optimization of C and G, the generally accepted method is to search the optimum values in a certain range. Here C and G are considered as 2.3 and 4 by grid-search techniques, respectively.
It is essential to assess the error during prediction in order to evaluate the performance of BP and SVM models. This could be carried out by comparing the model predicted value and the experimentally measured values. In this regard, mean absolute percentage error (MAPE) and mean square error (MSE) were employed to assess the closeness of prediction values and measured values.
1
| |100MAPE
ni i
ii
E P
n E
(17)
2
1
100MSE ( )
n
i ii
E Pn
(18)
where iE is the measured experimental value, iP indicates the ML model predicted result, and n refers to the total number of sample points.
3 Results and discussion
3. 1 Temperature field distribution
The temperature distribution of the reactor is shown in Fig. 3. The results show that the temperature distribution in the reactor shows a gradient distribution, and the temperature around the deposition substrate is the highest, which is consistent with the actual processing temperature. The temperature distribution in the middle deposition area is relatively uniform (isothermal zone). Due to the size effect of the reactor and the cooling effect of the gas, the temperature gradient near the inlet and outlet of the isothermal zone was relatively large. The precursor was gradually heated and decomposed

J Adv Ceram 2021, 10(3): 537–550 545
www.springer.com/journal/40145
Fig. 3 Axial temperature distribution curve in the reactor at different deposition temperatures.
into a large amount of intermediate species when entering the isothermal zone, and then these intermediate species reacted on the substrate surface.
3. 2 Distribution of intermediate species
The distribution of the molar fraction of the intermediate species in the reactor is shown in Fig. 4. The concentration of BCl3 dropped sharply as it approached the substrate, which was consistent with the temperature distribution trend inside the reaction chamber. The main decomposed gas species of BCl3 in the reaction chamber were BHCl2 and HCl, and the trends of BHCl2 and HCl were the same, which was consistent with the main reaction BCl3 + H2 → BHCl2 + HCl [13]. BHCl2 was considered an intermediate and/or by-product, which were formed by hydrogen reduction of BCl3, according to thermodynamic analysis and experimental work [13,38]. Berjonneau et al. [13] showed that in the case of a homogeneous reaction, CH4 still exists in a large amount at high temperatures, and in the case of a heterogeneous reaction, CH4 will decompose to form boron carbide and graphite as a carbon source. The above situation agrees with our prediction. In addition, we found that some intermediate gas phase components, such as BCl2, BCl, BH2Cl2, CHBCl2, CHBCl, CH3, C2H3, C2H5, and C2H6, have lower molar fractions, indicating that they do not play a dominant role in the B/C ratio of the deposited product during the homogeneous reaction. In addition, Reinisch et al. [20] proved that MDB (CH3BCl2) was a major intermediate component by FTIR apparatus. Correspondingly, Fig. 4 shows MDB is the third important boron intermediate whose concentration is only lower than BHCl3 and BHCl2. The results obtained from Reinisch et al. [20] and our model agrees well with each other.
Fig. 4 Plots of the gas-phase compositions for (a) boron and (b) carbon elements along the reactor height for deposition temperature of 1000 , total pressure of 12 kPa, total gas flow rate of 210 sccm, In_BCl3 is 2/7, and In_CH4 is 1/7.
Figure 5 shows the predicted mole fractions of important species at different temperatures, with a constant feed gas composition and inlet flow rate. The concentrations are the mean values at the substrate surface. Only the major chemical species having a molar fraction larger than 10−4 are shown. Low temperature (900 ) leads to less decomposition of BCl3 and CH4. BHCl2 has the highest concentration compared to other boron-containing intermediate species. The decomposition of CH4 is very sensitive to temperature. Remarkably, at 950 , the concentration of hydrocarbon increased with temperature, e.g., C2H2 and C2H4. The concentration of CH4 slightly decreased with increasing temperature, and C2H4 became the most abundant carbon intermediate. Further, C2H2 became the second largest hydrocarbon species at higher temperatures. The shift from CH4 to C2H2 at high temperatures has also been found in hydrocarbon cracking chemistry (C–H system, without B nor Cl). These results demonstrate that the major hydrocarbon species are CH4 and C2H4, and the major species containing boron are BCl3, BHCl2, BHCl3, and CH3BCl2 for a typical CMC processing

546 J Adv Ceram 2021, 10(3): 537–550
www.springer.com/journal/40145
Fig. 5 Influence of temperature on the mole fraction of intermediate components: Total pressure of 12 kPa, total gas flow rate of 210 sccm, In_BCl3 is 2/7, and In_CH4 is 1/7.
temperature. Our predictions are consistent with Berjonneau’s experimental results and thermodynamic calculation [38].
3. 3 Predicted boron to carbon ratio
Firstly, BP and SVM were used to directly correlate the deposition atomic ratio with deposition conditions (temperature, input gas ratio, total pressure, reactor inner diameter, and flow rate), without the RM. Figures 6 and 7 show that the functional relationship between them is not very good (R2 = 0.938). The average values of MSE and MAPE are approximately 25% and 30%, respectively.
Next, an RM was established to predict the molar fraction of the intermediate gas species generated in various deposition processes. Then, we used BP and SVM to relate the boron–carbon ratio values of MSE and MAPE were around 6.8% and 8.2%, respectively. Figures 8 and 9 show that the experimental measured
results and predicted values are close to overlapping (R2 = 0.975). As shown in Table 5, after inputting the intermediate gas species predicted by RM into the SVM algorithm, the prediction error was reduced from about 25% to 7%. Compared with the BP algorithm, the prediction of SVM was better. The prediction of SVM was determined by the algorithm itself and affected by the sample size. In the case of small sample data, SVM is recommended.
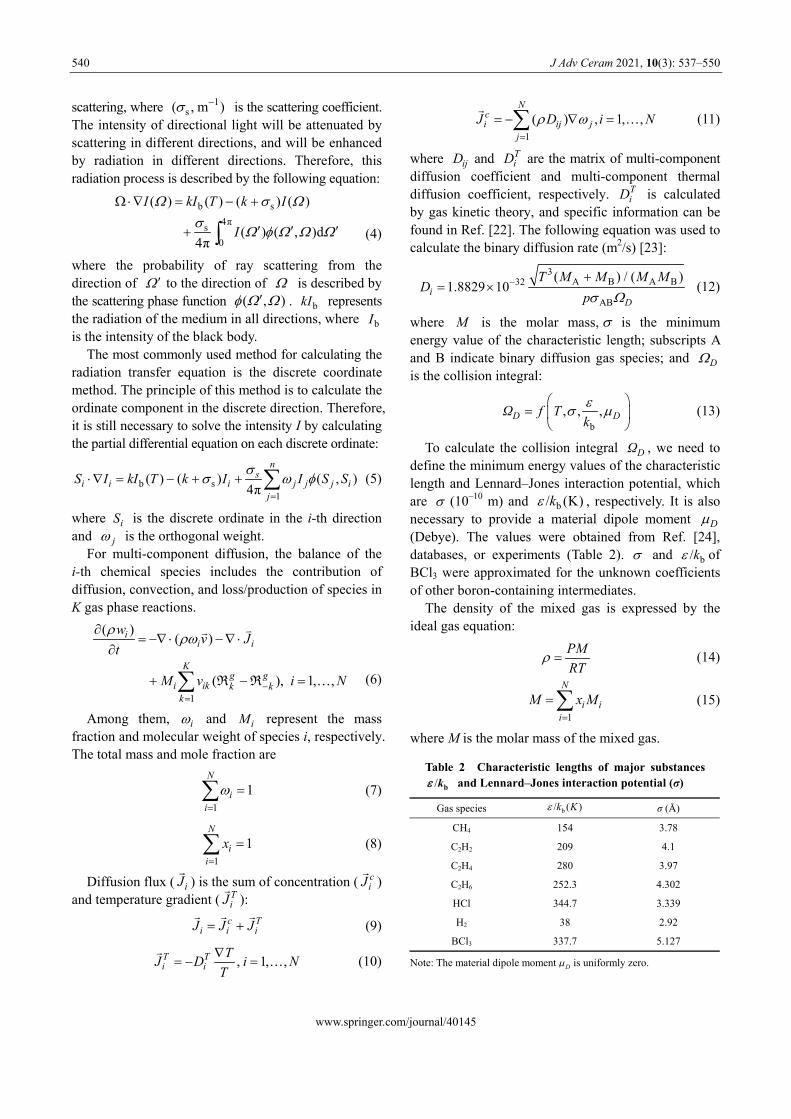
One important application of the ML approach is to interpolate the correlation of B/C ratio vs. experimental control parameters. Given the fixed processing para-meters, we calculate the B/C ratio with temperature in Fig. 10. Our model predicts that the B/C ratio attains a minimum at ~950 and then increases to the maximum at 1100 . Liu et al. [15] found that even at the same gas ratio, the atomic composition obtained at different deposition temperatures is different. Liu et al. [15] and we both reach the same conclusion that it is not possible to simply establish a relationship between the gas ratio and the deposition result.
Fig. 6 Goodness of fit (input variables are T, Q, P, In_BCl3, In_CH4, and In_H2).
Fig. 7 Predicted B/C without reactor scale (input variables are T, Q, P, ID, In_BCl3, In_CH4, and In_H2).

J Adv Ceram 2021, 10(3): 537–550 547
www.springer.com/journal/40145
Fig. 8 Goodness of fit (input variables are T, P, BCl3, CH4, BHCl2, BHCl3, BCl2, HCl, and H2).
Table 5 Mean absolute percentage error and mean square error of predicted results
SVM (%) BP (%) Average value (%)
MSE 16.5 34.2 25.35 Without RM
MAPE 15.8 45.6 30.7
MSE 1.7 11.9 6.8 With RM
MAPE 8.4 8.1 8.25
3. 4 Sensitivity coefficient analysis
After the training session, sensitivity analysis was performed with SVM. Sensitivity coefficients were calculated with respect to the B/C:
0( )v v
S kv
(19)
where 0v is the predicted deposition B/C by SVM training model when the molar fraction of the i-th gas species is fixed as zero, and the concentrations of the other species remain unchanged; v is the original deposition rate predicted by SVM training model.
Therefore, “sensitivity” indicates the degree of influence on the predicted ratio of the components of the deposited product when the studied species is removed. Sensitivity analysis can be used to identify core species in a deposition mechanism. Obviously, a larger S(k) value for a certain substance indicates that it plays a dominant role in the deposition process.
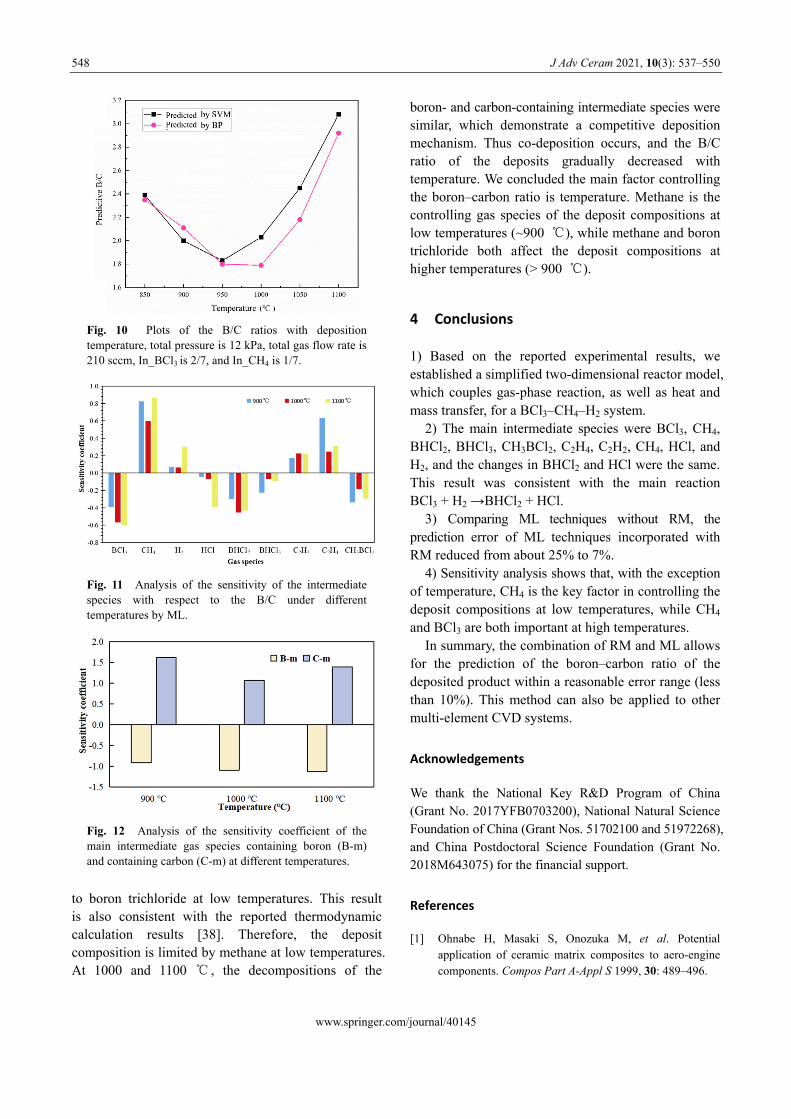
Corresponding to 900, 1000, and 1100 , we selected samples 2, 7, and 15 to study S. The sensitivity analysis results (Fig. 11) show that the intermediate species with molar fractions that limit the B/C ratio are BCl3, CH4, BHCl2, BHCl3, CH3BCl2, C2H4, C2H2, CH4, HCl, and H2. The sensitivity coefficients of other species were below 0.01, which suggested they minimally influence the B/C ratio. BHCl2 and BCl3 provide the most productivity for boron atoms, while C2H4 and CH4 are the main sources of carbon atoms. The S of CH4 was the largest, which is consistent with the deposition mechanism proposed by Vandenbulcke [39]. Lartigue et al. [40] also indicated that the production of CH4 is a predominant step toward deposition. The intermediate BHCl2 was found to be very important to the deposition process, which is also consistent with Vandenbulcke’s experimental results [39].
To compare with the effects of boron- and carbon- containing intermediate species on the composition of deposited products, the S of the main boron- and carbon-containing intermediate species were separately calculated and then compared in Fig. 12. The S of the boron-containing intermediate species increased with temperature. On the contrary, the S values of carbon- containing intermediates were larger at 900 , and the values were higher than that of boron-containing species. This is consistent with the reported mechanism, which states that methane decomposes less as compared
Fig. 9 Predicted B/C with reactor scale (input variables are T, P, BCl3, CH4, BHCl2, BHCl3, BCl2, HCl, and H2).
548 J Adv Ceram 2021, 10(3): 537–550
www.springer.com/journal/40145
Fig. 10 Plots of the B/C ratios with deposition temperature, total pressure is 12 kPa, total gas flow rate is 210 sccm, In_BCl3 is 2/7, and In_CH4 is 1/7.
Fig. 11 Analysis of the sensitivity of the intermediate species with respect to the B/C under different temperatures by ML.
Fig. 12 Analysis of the sensitivity coefficient of the main intermediate gas species containing boron (B-m) and containing carbon (C-m) at different temperatures.
to boron trichloride at low temperatures. This result is also consistent with the reported thermodynamic calculation results [38]. Therefore, the deposit composition is limited by methane at low temperatures. At 1000 and 1100 , the decompositions of the
boron- and carbon-containing intermediate species were similar, which demonstrate a competitive deposition mechanism. Thus co-deposition occurs, and the B/C ratio of the deposits gradually decreased with temperature. We concluded the main factor controlling the boron–carbon ratio is temperature. Methane is the controlling gas species of the deposit compositions at low temperatures (~900 ), while methane and boron trichloride both affect the deposit compositions at higher temperatures (> 900 ).
4 Conclusions
1) Based on the reported experimental results, we established a simplified two-dimensional reactor model, which couples gas-phase reaction, as well as heat and mass transfer, for a BCl3–CH4–H2 system.
2) The main intermediate species were BCl3, CH4, BHCl2, BHCl3, CH3BCl2, C2H4, C2H2, CH4, HCl, and H2, and the changes in BHCl2 and HCl were the same. This result was consistent with the main reaction BCl3 + H2 →BHCl2 + HCl.
3) Comparing ML techniques without RM, the prediction error of ML techniques incorporated with RM reduced from about 25% to 7%.
4) Sensitivity analysis shows that, with the exception of temperature, CH4 is the key factor in controlling the deposit compositions at low temperatures, while CH4 and BCl3 are both important at high temperatures.
In summary, the combination of RM and ML allows for the prediction of the boron–carbon ratio of the deposited product within a reasonable error range (less than 10%). This method can also be applied to other multi-element CVD systems.
Acknowledgements
We thank the National Key R&D Program of China (Grant No. 2017YFB0703200), National Natural Science Foundation of China (Grant Nos. 51702100 and 51972268), and China Postdoctoral Science Foundation (Grant No. 2018M643075) for the financial support.
References
[1] Ohnabe H, Masaki S, Onozuka M, et al. Potential application of ceramic matrix composites to aero-engine components. Compos Part A-Appl S 1999, 30: 489–496.

J Adv Ceram 2021, 10(3): 537–550 549
www.springer.com/journal/40145
[2] Inghels E, Lamon J. An approach to the mechanical
behaviour of SiC/SiC and C/SiC ceramic matrix composites.
J Mater Sci 1991, 26: 5411–5419.
[3] Christin F. Design, fabrication, and application of
thermostructural composites (TSC) like C/C, C/SiC, and
SiC/SiC composites. Adv Eng Mater 2002, 4: 903–912.
[4] Katoh Y, Snead LL, Henager CH, et al. Current status and
recent research achievements in SiC/SiC composites. J
Nucl Mater 2014, 455: 387–397.
[5] Naslain R, Guette A, Rebillat F, et al. Boron-bearing
species in ceramic matrix composites for long-term
aerospace applications. J Solid State Chem 2004, 30:
489–496.
[6] Liu YS, Cheng LF, Zhang LT, et al. Oxidation protection of
multilayer CVD SiC/B/SiC coatings for 3D C/SiC
composite. Mat Sci Eng A-Struct 2007, 466: 172–177.
[7] Sezer AO, Brand JI. Chemical vapor deposition of boron
carbide. Mater Sci Eng B-Adv 2001, 79: 191–202.
[8] Jacques S, Guette A, Langlais F, et al. C(B) materials as
interphases in SiC/SiC model microcomposites. J Mater
Sci 1997, 32: 983–988.
[9] Ruggles-Wrenn MB, Wallis TA. Creep in interlaminar
shear of an Hi-Nicalon™/SiC–B4C composite at 1300 in
air and in steam. J Compos Mater 2019, 54: 1819–1829.
[10] Deshpande SV, Gulari E, Harris SJ, et al. Filament
activated chemical vapor deposition of boron carbide
coatings. Appl Phys Lett 1994, 65: 1757–1759.
[11] Karaman M, Sezgi NA, Doğu T, et al. Kinetic investigation
of chemical vapor deposition of B4C on tungsten substrate.
AICHE J 2006, 52: 4161–4166.
[12] Karaman M, Sezgi NA, Doğu T, et al. Mechanism studies
on CVD of boron carbide from a gas mixture of BCl3, CH4,
and H2 in a dual impinging-jet reactor. AICHE J 2009, 55:
701–709.
[13] Berjonneau J, Langlais F, Chollon G, et al. Understanding
the CVD process of (Si)–B–C ceramics through FTIR
spectroscopy gas phase analysis. Surf Coat Tech 2017, 201:
7273–7285.
[14] Berjonneau J, Chollon G, Langlais F, et al. Deposition
process of Si–B–C ceramics from CH3SiCl3/BCl3/H2
precursor. Thin Solid Films 2008, 516: 2848–2857.
[15] Liu YS, Zhang LT, Cheng LF, et al. Uniform design and
regression analysis of LPCVD boron carbide from
BCl3–CH4–H2 system. Appl Surf Sci 2009, 255:
5729–5735.
[16] Zeng B, Feng ZD, Li SW, et al. Microstructural study of
oxidation of carbon-rich amorphous boron carbide coating.
Front Mater Sci 2008, 2: 375–380.
[17] Mollick PK, Venugopalan R, Srivastava D. CFD coupled
kinetic modeling and simulation of hot wall vertical tubular
reactor for deposition of SiC crystal from MTS. J Cryst
Growth 2017, 475: 97–109.
[18] Ni H, Lu S, Chen C. Modeling and simulation of silicon
epitaxial growth in siemens CVD reactor. J Cryst Growth
2014, 404: 89–99.
[19] Deck CP, Khalifa HE, Sammuli B, et al. Fabrication of
SiC–SiC composites for fuel cladding in advanced reactor
designs. Prog Nucl Energy 2012, 57: 38–45.
[20] Reinisch G, Patel S, Chollon G, et al. Methyldichloroborane
evidenced as an intermediate in the chemical vapour
deposition synthesis of boron carbide. J Nanosci
Nanotechnol 2011, 11: 8323–8327.
[21] Li J, Qin H, Liu Y, et al. Effect of the SiCl4 flow rate on
SiBN deposition kinetics in SiCl4–BCl3–NH3–H2–Ar
environment. Materials 2017, 10: 627-637.
[22] Kleijn CR. Modeling of Chemical Vapor Deposition of
Tungsten Films. Boston, USA: Birkhäuser Basel, 1993.
[23] Beek WJ, Muttzall KMK, van Heuven JW. Transport
Phenomena, 2nd edn. New York, USA: John Wiley & Sons,
1999.
[24] Cuadros F, Cachadiña I, Ahumada W. Determination of
Lennard-Jones interaction parameters using a new
procedure. Mol Eng 1996, 6: 319–325.
[25] Ge Y, Gordon M S, Battaglia F, et al. Theoretical study of
the pyrolysis of methyltrichlorosilane in the gas phase. 1.
Thermodynamics. J Phys Chem A 2007, 111: 1462–1474.
[26] Ge Y, Gordon M S, Battaglia F, et al. Theoretical study of
the pyrolysis of methyltrichlorosilane in the gas phase. 2.
Reaction paths and transition states. J Phys Chem A 2007,
111: 1475–1486.
[27] Ge Y, Gordon M S, Battaglia F, et al. Theoretical study of
the pyrolysis of methyltrichlorosilane in the gas phase. 3.
Reaction Rate Constant Calculations. J Phys Chem A 2010,
114: 2384–2392.
[28] Liu Y, Su KH, Zeng QF, et al. Reaction paths of BCl3 + CH4
+ H2 in the chemical vapor deposition process. Struct Chem
2012, 23: 1677–1692.
[29] Liu Y, Su KH, Zeng QF, et al. Decomposition reaction rate
of BCl3–CH4–H2 in the gas phase. Theor Chem Acc 2015,
134: 1–9.
[30] Reinisch G, Leyssale JM, Vignoles GL. Theoretical study
of the decomposition of BCl3 induced by a H radical. J
Phys Chem A 2011, 115: 4786–4797.
[31] Lee J H, Shin J, Realff M J. Machine learning: Overview of
the recent progresses and implications for the process
systems engineering field. Comput Chem Eng 2018, 114:
111–121.
[32] Moreno R, Corona F, Lendasse A, et al. Extreme learning
machines for soybean classification in remote sensing
hyperspectral images. Neurocomputing 2014, 128: 207–216.
[33] Basu A, Shuo S, Zhou H, et al. Silicon spiking neurons for
hardware implementation of extreme learning machines.
Neurocomputing 2013, 102: 125–134.
[34] Benoît F, Heeswijk M, Miche Y, et al. Feature selection for
nonlinear models with extreme learning machines.
Neurocomputing 2013, 102: 111–124.

550 J Adv Ceram 2021, 10(3): 537–550
www.springer.com/journal/40145
[35] Feng S, Zhou H, Dong H, et al. Using deep neural network
with small dataset to predict material defects. Mater Des
2019, 162: 300–310.
[36] Kushvaha V, Kumar S A, Madhushri P, et al. Artificial
neural network technique to predict dynamic fracture of
particulate composite. J Compos Mater 2021, 54:
3099–3108.
[37] Liu X, Gao C, Li P, et al. A comparative analysis of support
vector machines and extreme learning machines. Neural
Netw 2012, 33: 58–66.
[38] Berjonneau J, Chollon G, Langlais F, et al. Deposition
process of amorphous boron carbide from CH4/BCl3/H2
precursor. Proc Electrochem Soc 2006, 153: C795–C800.
[39] Vandenbulcke L G. Theoretical and experimental studies on
the chemical vapor deposition of boron carbide. Ind Eng
Chem Res 2002, 24: 568–575.
[40] Lartigue S, Cazajous D, Nadal M, et al. Study of boron
carbides vapor-deposited under low pressure. In Proceedings
of the Fifth European Conference on Chemical Vapor
Deposition, 1985: 413–419.
Open Access This article is licensed under a Creative Commons Attribution 4.0 International License, which permits use, sharing, adaptation, distribution and reproduction in any medium or format, as long as you give appropriate credit to the original author(s) and the source, provide a link to the Creative Commons licence, and indicate if changes were made. The images or other third party material in this article are included in the article’s Creative Commons licence, unless indicated otherwise in a credit line to the material. If material is not included in the article’s Creative Commons licence and your intended use is not permitted by statutory regulation or exceeds the permitted use, you will need to obtain permission directly from the copyright holder. To view a copy of this licence, visit http://creativecommons. org/licenses/by/4.0/.