machine learning and data mining - university of auckland · what is data mining? ... temperature,...
TRANSCRIPT

Machine Learning and Data Mining
Introduction

What is data mining?
• After years of data mining there is still no unique answer to this question.
• A tentative definition: Data mining is the use of efficient techniques for the analysis of very large collections of data and the extraction of useful and possibly unexpected patterns in data.

Why do we need data mining?
• Really, really huge amounts of raw data!! – In the digital age, TB to PB of data is generated by the
second • Mobile devices, digital photographs, web documents. • Facebook updates, Tweets, Blogs, User-generated
content • Transactions, sensor data, surveillance data • Queries, clicks, browsing
– Cheap storage has made possible to maintain this data
• Need to analyze the raw data to extract knowledge

Why do we need data mining?
• “The data is the computer” – Large amounts of data can be more powerful than complex
algorithms and models • Google has solved many Natural Language Processing problems,
simply by looking at the data • Example: misspellings, synonyms
– Data is power! • Today, the collected data is one of the biggest assets of an online
company – Query logs of Google – The friendship and updates of Facebook – Tweets and follows of Twitter – Amazon transactions
– We need a way to harness the collective intelligence

The data is also very complex
• Multiple types of data: tables, time series, images, graphs, etc
• Spatial and temporal aspects
• Interconnected data of different types: – From the mobile phone we can collect, location of the
user, friendship information, check-ins to venues, opinions through twitter, images though cameras, queries to search engines
Example: transaction data
• Billions of real-life customers:
– WALMART: 20M transactions per day
– AT&T 300 M calls per day
– Credit card companies: billions of transactions per day.
• The point cards allow companies to collect information about specific users

Example: document data
• Web as a document repository: estimated 50 billions of web pages
• Wikipedia: 40 million articles (and counting)
• Online news portals: steady stream of 100’s of new articles every day
• Twitter: ~500 million tweets every day

Example: network data
• Web: 50 billion pages linked via hyperlinks
• Facebook: 500 million users
• Twitter: 300 million users
• Instant messenger: ~1billion users
• Blogs: 250 million blogs worldwide, presidential candidates run blogs

Example: genomic sequences
• http://www.1000genomes.org/page.php
• Full sequence of 1000 individuals
• 3*109 nucleotides per person 3*1012
nucleotides
• Lots more data in fact: medical history of the persons, gene expression data

Example: environmental data
• Climate data (just an example) http://www.ncdc.gov/oa/climate/ghcn-monthly/index.php
• “a database of temperature, precipitation and
pressure records managed by the National Climatic Data Center, Arizona State University and the Carbon Dioxide Information Analysis Center”
• “6000 temperature stations, 7500 precipitation stations, 2000 pressure stations” – Spatiotemporal data

Behavioral data
• Mobile phones today record a large amount of information about the user behavior – GPS records position – Camera produces images – Communication via phone and SMS – Text via facebook updates – Association with entities via check-ins
• Amazon collects all the items that you browsed, placed into your basket,
read reviews about, purchased.
• Google and Bing record all your browsing activity via toolbar plugins. They also record the queries you asked, the pages you saw and the clicks you did.
• Data collected for millions of users on a daily basis

So, what is Data? • Collection of data objects and
their attributes
• An attribute is a property or characteristic of an object
– Examples: eye color of a person, temperature, etc.
– Attribute is also known as variable, field, characteristic, or feature
• A collection of attributes describe an object
– Object is also known as record, point, case, sample, entity, or instance
Tid Refund Marital Status
Taxable Income Cheat
1 Yes Single 125K No
2 No Married 100K No
3 No Single 70K No
4 Yes Married 120K No
5 No Divorced 95K Yes
6 No Married 60K No
7 Yes Divorced 220K No
8 No Single 85K Yes
9 No Married 75K No
10 No Single 90K Yes 10
Attributes
Objects
Size: Number of objects Dimensionality: Number of attributes Sparsity: Number of populated object-attribute pairs

Types of Attributes
• There are different types of attributes
– Categorical
• Examples: eye color, zip codes, words, rankings (e.g, good, fair, bad), height in {tall, medium, short}
• Nominal (no order or comparison) vs Ordinal (order but not comparable)
– Numeric
• Examples: dates, temperature, time, length, value, count.
• Discrete (counts) vs Continuous (temperature)
• Special case: Binary attributes (yes/no, exists/not exists)
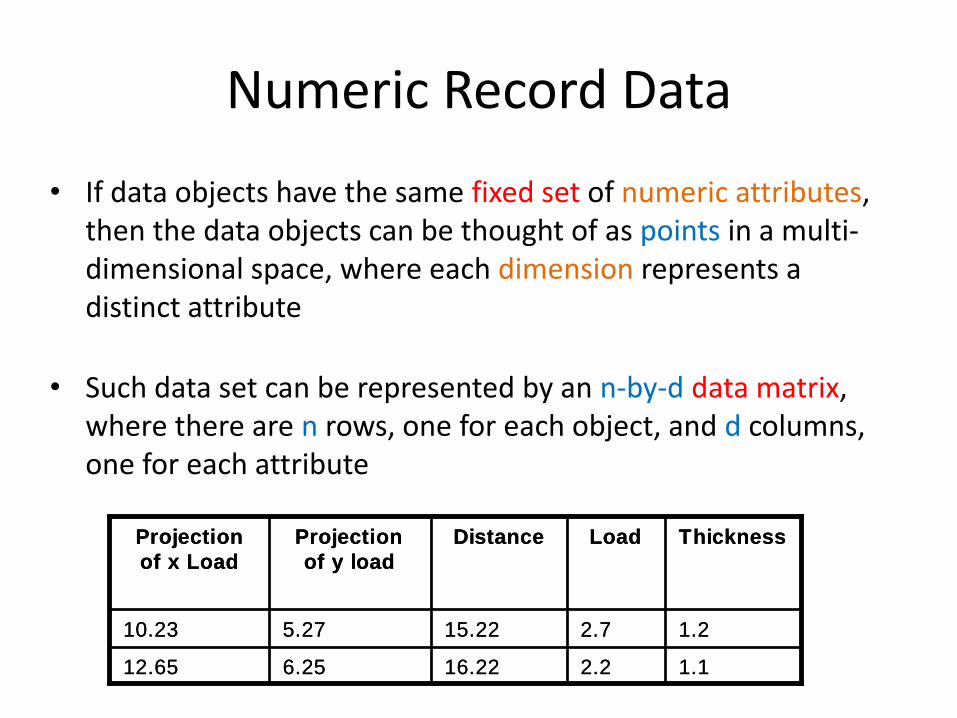
Numeric Record Data
• If data objects have the same fixed set of numeric attributes, then the data objects can be thought of as points in a multi-dimensional space, where each dimension represents a distinct attribute
• Such data set can be represented by an n-by-d data matrix, where there are n rows, one for each object, and d columns, one for each attribute
1.12.216.226.2512.65
1.22.715.225.2710.23
Thickness LoadDistanceProjection
of y load
Projection
of x Load
1.12.216.226.2512.65
1.22.715.225.2710.23
Thickness LoadDistanceProjection
of y load
Projection
of x Load
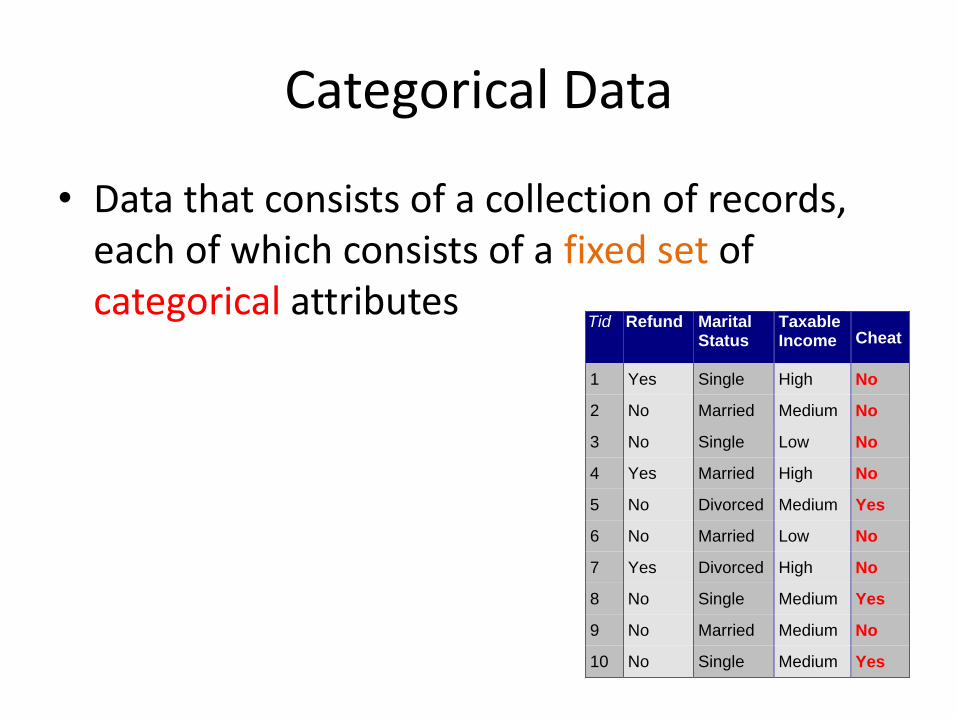
Categorical Data
• Data that consists of a collection of records, each of which consists of a fixed set of categorical attributes
Tid Refund Marital Status
Taxable Income Cheat
1 Yes Single High No
2 No Married Medium No
3 No Single Low No
4 Yes Married High No
5 No Divorced Medium Yes
6 No Married Low No
7 Yes Divorced High No
8 No Single Medium Yes
9 No Married Medium No
10 No Single Medium Yes 10

Document Data
• Each document becomes a `term' vector, – each term is a component (attribute) of the vector, – the value of each component is the number of times the
corresponding term occurs in the document. – Bag-of-words representation – no ordering
Document 1
se
aso
n
time
ou
t
lost
wi
n
ga
me
sco
re
ba
ll
play
co
ach
tea
m
Document 2
Document 3
3 0 5 0 2 6 0 2 0 2
0
0
7 0 2 1 0 0 3 0 0
1 0 0 1 2 2 0 3 0

Transaction Data
• Each record (transaction) is a set of items.
• A set of items can also be represented as a binary vector, where each attribute is an item.
• A document can also be represented as a set of words (no counts)
TID Items
1 Bread, Coke, Milk
2 Beer, Bread
3 Beer, Coke, Diaper, Milk
4 Beer, Bread, Diaper, Milk
5 Coke, Diaper, Milk
Sparsity: average number of products bought by a customer

Ordered Data
• Genomic sequence data
• Data is a long ordered string
GGTTCCGCCTTCAGCCCCGCGCC
CGCAGGGCCCGCCCCGCGCCGTC
GAGAAGGGCCCGCCTGGCGGGCG
GGGGGAGGCGGGGCCGCCCGAGC
CCAACCGAGTCCGACCAGGTGCC
CCCTCTGCTCGGCCTAGACCTGA
GCTCATTAGGCGGCAGCGGACAG
GCCAAGTAGAACACGCGAAGCGC
TGGGCTGCCTGCTGCGACCAGGG

Ordered Data
• Time series
– Sequence of ordered (over “time”) numeric values.
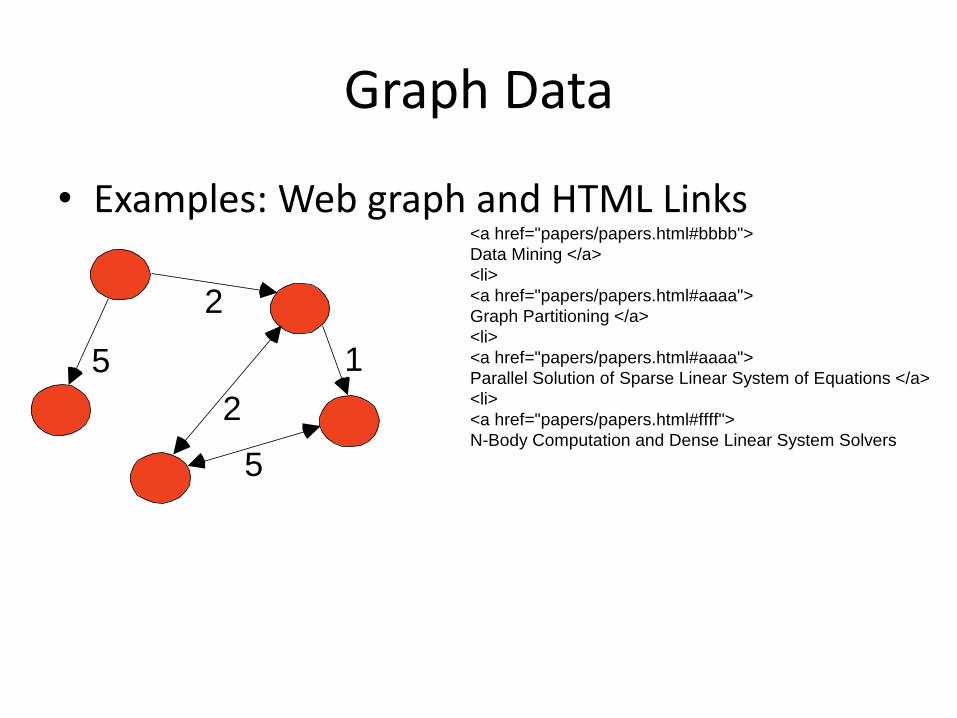
Graph Data
• Examples: Web graph and HTML Links
5
2
1
2
5
<a href="papers/papers.html#bbbb">
Data Mining </a>
<li>
<a href="papers/papers.html#aaaa">
Graph Partitioning </a>
<li>
<a href="papers/papers.html#aaaa">
Parallel Solution of Sparse Linear System of Equations </a>
<li>
<a href="papers/papers.html#ffff">
N-Body Computation and Dense Linear System Solvers

Types of data
• Numeric data: Each object is a point in a multidimensional space
• Categorical data: Each object is a vector of categorical values
• Set data: Each object is a set of values (with or without counts) – Sets can also be represented as binary vectors, or
vectors of counts
• Ordered sequences: Each object is an ordered sequence of values.
• Graph data

What can you do with the data?
• Suppose that you are the owner of a supermarket and you have collected billions of market basket data. What information would you extract from it and how would you use it?
• What if this was an online store?
TID Items
1 Bread, Coke, Milk
2 Beer, Bread
3 Beer, Coke, Diaper, Milk
4 Beer, Bread, Diaper, Milk
5 Coke, Diaper, Milk
Product placement
Catalog creation
Recommendations

What can you do with the data?
• Suppose you are a search engine and you have a toolbar log consisting of – pages browsed,
– queries,
– pages clicked,
– ads clicked
each with a user id and a timestamp. What information would you like to get our of the data?
Ad click prediction
Query reformulations
What can you do with the data?
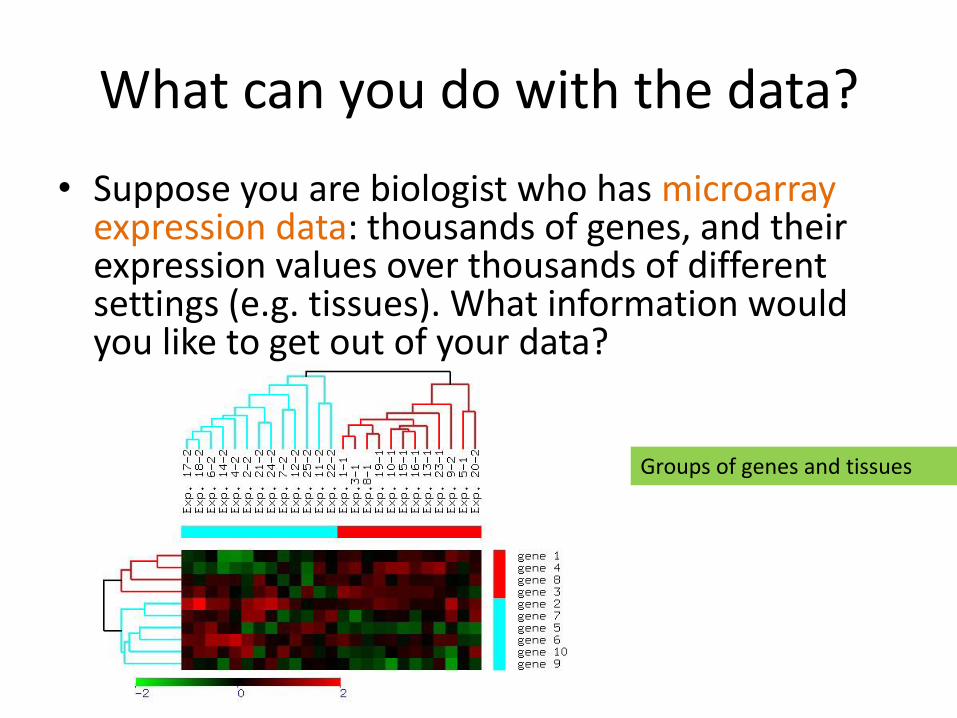
• Suppose you are biologist who has microarray expression data: thousands of genes, and their expression values over thousands of different settings (e.g. tissues). What information would you like to get out of your data?
Groups of genes and tissues

What can you do with the data?
• Suppose you are a stock broker and you observe the fluctuations of multiple stocks over time. What information would you like to get our of your data?
Clustering of stocks
Correlation of stocks
Stock Value prediction
What can you do with the data?
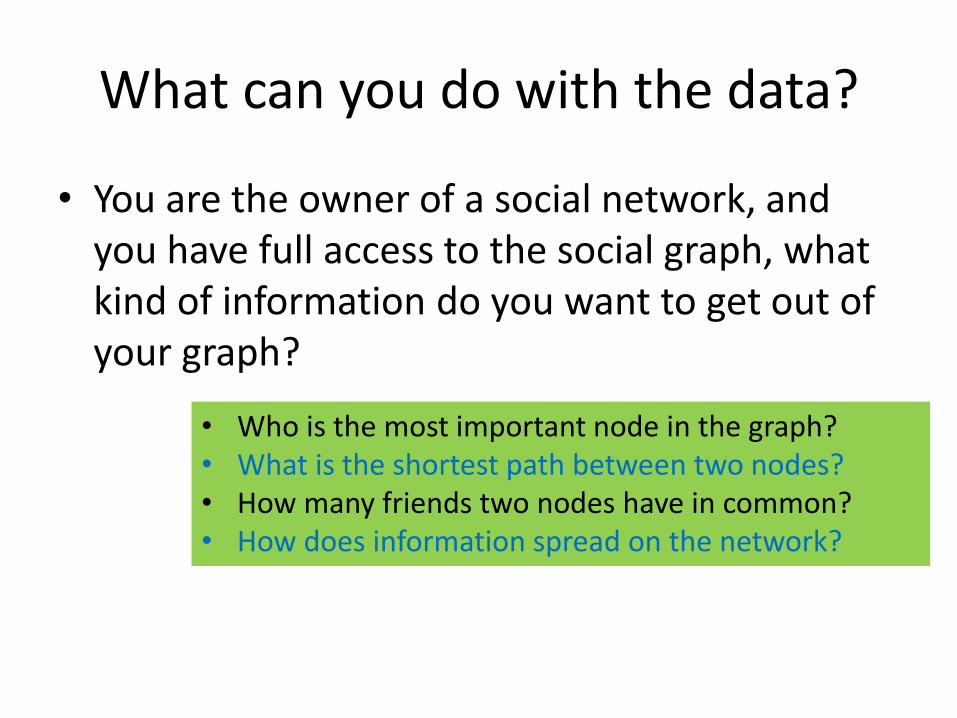
• You are the owner of a social network, and you have full access to the social graph, what kind of information do you want to get out of your graph?
• Who is the most important node in the graph? • What is the shortest path between two nodes? • How many friends two nodes have in common? • How does information spread on the network?

Why data mining?
• Commercial point of view – Data has become the key competitive advantage of companies
• Examples: Facebook, Google, Amazon
– Being able to extract useful information out of the data is key for exploiting them commercially.
• Scientific point of view – Scientists are at an unprecedented position where they can collect TB of
information • Examples: Sensor data, astronomy data, social network data, gene data
– We need the tools to analyze such data to get a better understanding of the world and advance science
• Scale (in data size and feature dimension) – Why not use traditional analytic methods? – Enormity of data, curse of dimensionality – The amount and the complexity of data does not allow for manual processing
of the data. We need automated techniques.

What is Data Mining again?
• “Data mining is the analysis of (often large) observational data sets to find unsuspected relationships and to summarize the data in novel ways that are both understandable and useful to the data analyst” (Hand, Mannila, Smyth)
• “Data mining is the discovery of models for data” (Rajaraman, Ullman) – We can have the following types of models
• Models that explain the data (e.g., a single function) • Models that predict the future data instances. • Models that summarize the data • Models the extract the most prominent features of the data.

Traditional Programming
Machine Learning
Computer Data
Program Output
Computer Data
Output Program

• A branch of artificial intelligence, concerned with the design and development of algorithms that allow computers to evolve behaviors based on empirical data.
• As intelligence requires knowledge, it is necessary for the computers to acquire knowledge.
What is machine learning?

Learning system model
Input Samples
Learning Method
System
Training
Testing
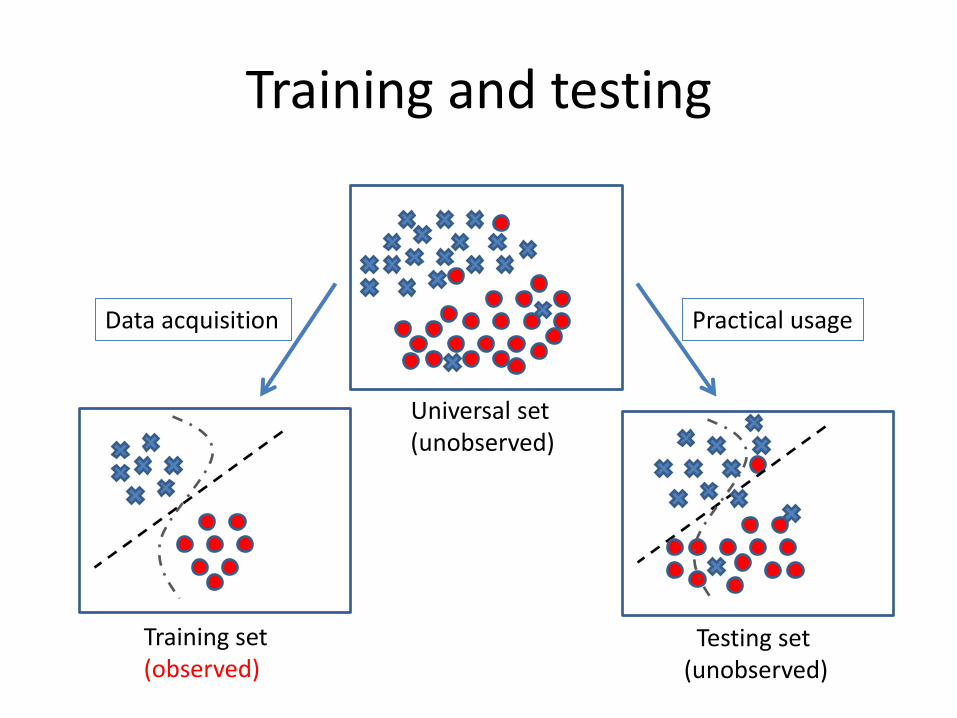
Training and testing
Training set (observed)
Universal set (unobserved)
Testing set (unobserved)
Data acquisition Practical usage

• Training is the process of making the system able to learn.
• No free lunch rule: – Training set and testing set come from the same distribution
– Need to make some assumptions or bias
Training and testing
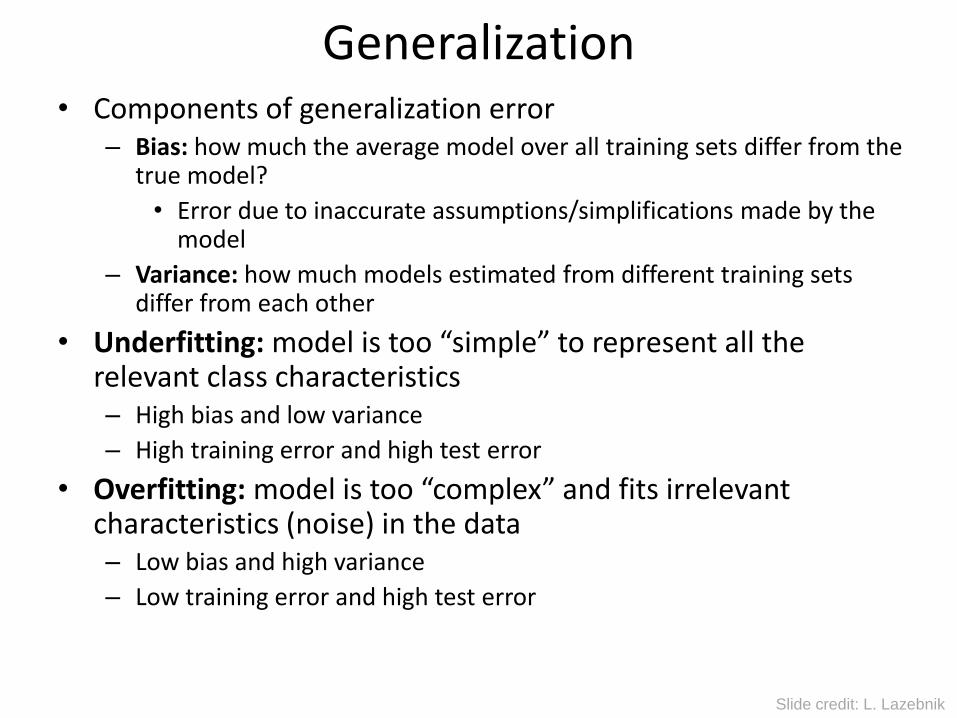
Generalization • Components of generalization error
– Bias: how much the average model over all training sets differ from the true model?
• Error due to inaccurate assumptions/simplifications made by the model
– Variance: how much models estimated from different training sets differ from each other
• Underfitting: model is too “simple” to represent all the relevant class characteristics – High bias and low variance
– High training error and high test error
• Overfitting: model is too “complex” and fits irrelevant characteristics (noise) in the data – Low bias and high variance
– Low training error and high test error
Slide credit: L. Lazebnik
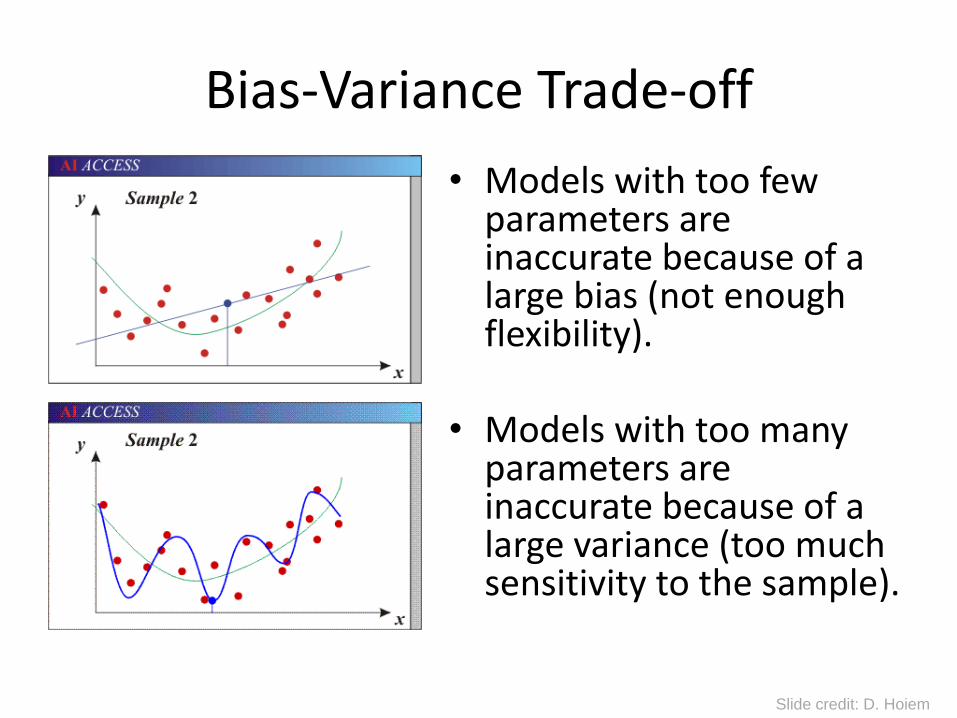
Bias-Variance Trade-off
• Models with too few parameters are inaccurate because of a large bias (not enough flexibility).
• Models with too many parameters are inaccurate because of a large variance (too much sensitivity to the sample).
Slide credit: D. Hoiem
• There are several factors affecting the performance: – Types of training provided
– The form and extent of any initial background knowledge
– The type of feedback provided
– The learning algorithms used
• Two important factors: – Modeling
– Optimization
Performance

• The success of machine learning system also depends on the algorithms.
• The algorithms control the search to find and build the knowledge structures.
• The learning algorithms should extract useful information from training examples.
Algorithms

• Supervised learning ( ) – Prediction
– Classification (discrete labels), Regression (real values)
• Unsupervised learning ( ) – Clustering
– Probability distribution estimation
– Finding association (in features)
– Dimension reduction
• Semi-supervised learning
• Reinforcement learning – Decision making (robot, chess machine)
Algorithms

40
Algorithms
Supervised learning Unsupervised learning
Semi-supervised learning
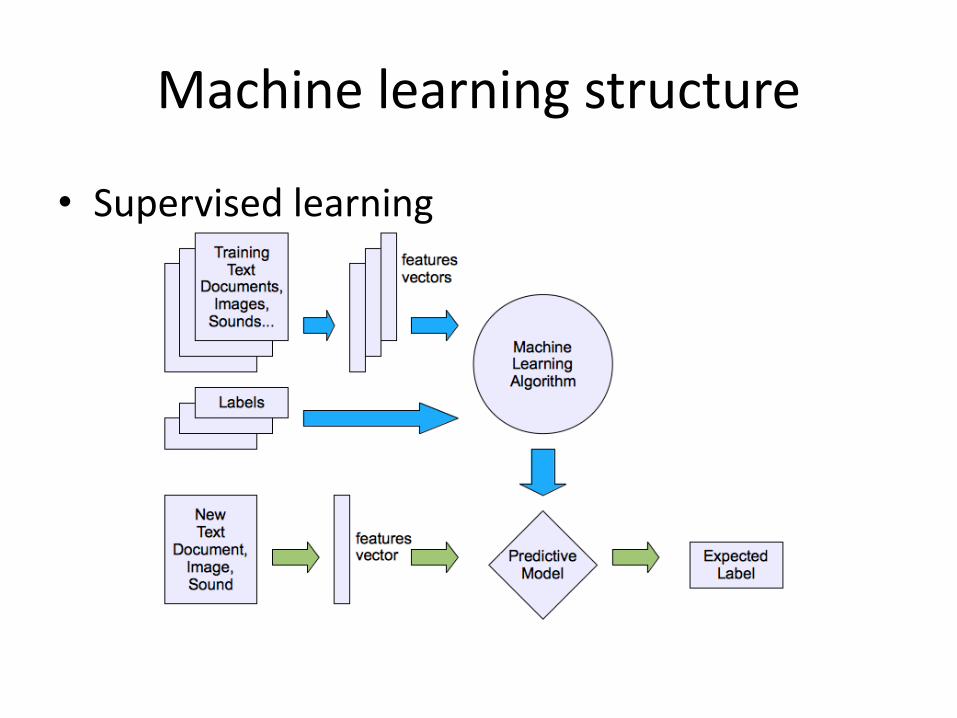
• Supervised learning
Machine learning structure

• Unsupervised learning
Machine learning structure
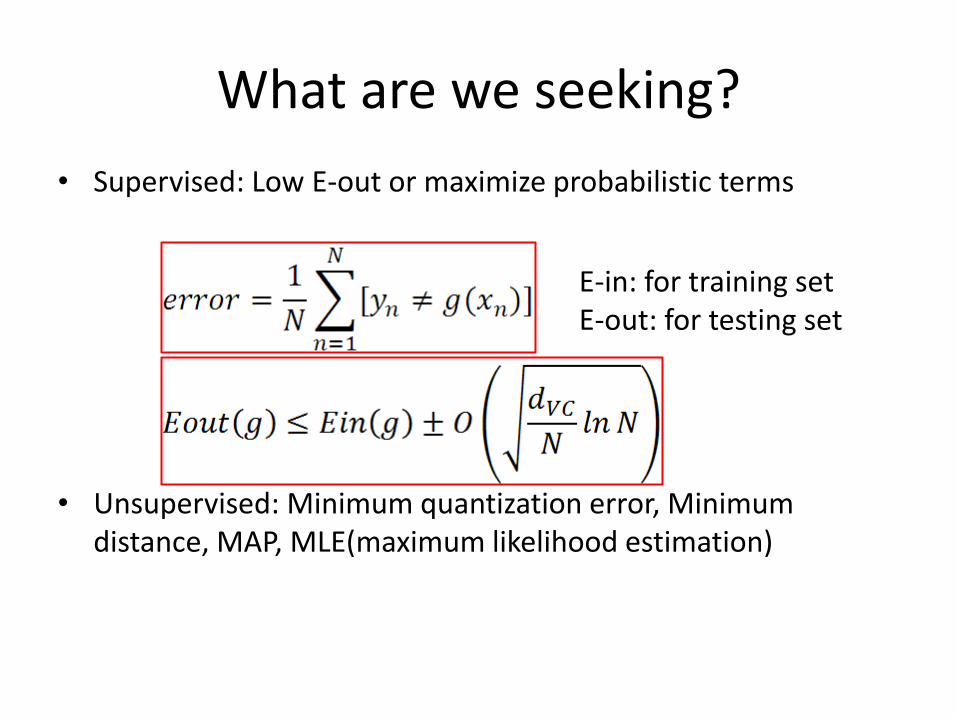
• Supervised: Low E-out or maximize probabilistic terms
• Unsupervised: Minimum quantization error, Minimum distance, MAP, MLE(maximum likelihood estimation)
What are we seeking?
E-in: for training set E-out: for testing set

Under-fitting VS. Over-fitting (fixed N)
What are we seeking?
error
(model = hypothesis + loss functions)

• Supervised learning categories and techniques – Linear classifier (numerical functions)
– Parametric (Probabilistic functions)
• Naïve Bayes, Gaussian discriminant analysis (GDA), Hidden Markov models (HMM), Probabilistic graphical models
– Non-parametric (Instance-based functions)
• K-nearest neighbors, Kernel regression, Kernel density estimation, Local regression
– Non-metric (Symbolic functions)
• Classification and regression tree (CART), decision tree
– Aggregation
• Bagging (bootstrap + aggregation), Adaboost, Random forest
Learning techniques
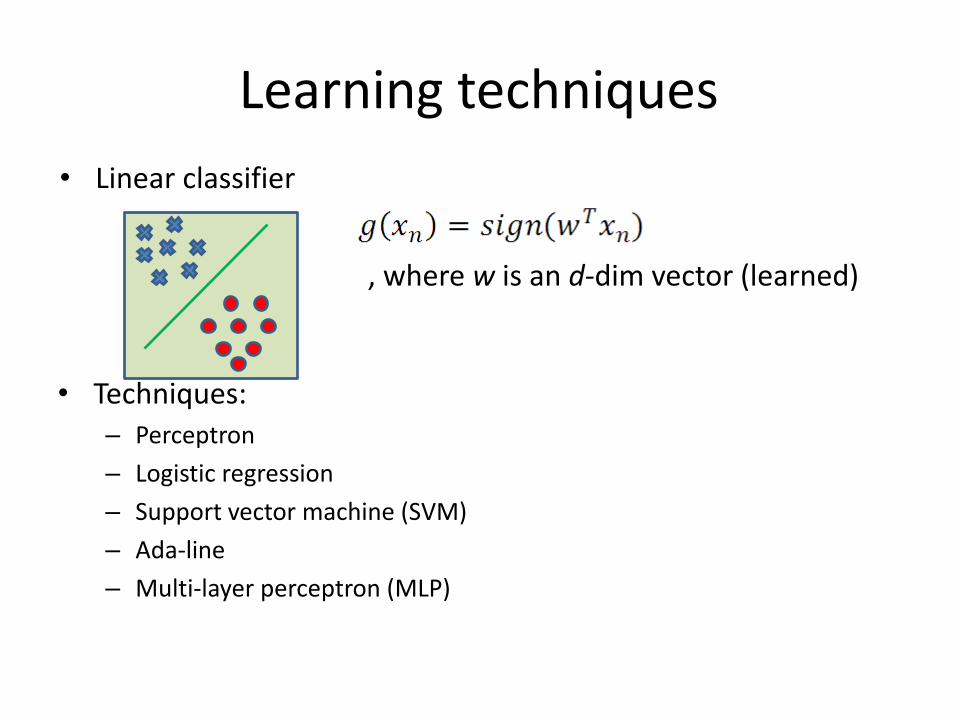
• Techniques: – Perceptron
– Logistic regression
– Support vector machine (SVM)
– Ada-line
– Multi-layer perceptron (MLP)
Learning techniques
, where w is an d-dim vector (learned)
• Linear classifier

Learning techniques
Using perceptron learning algorithm(PLA)
Training Testing
Error rate: 0.10 Error rate: 0.156
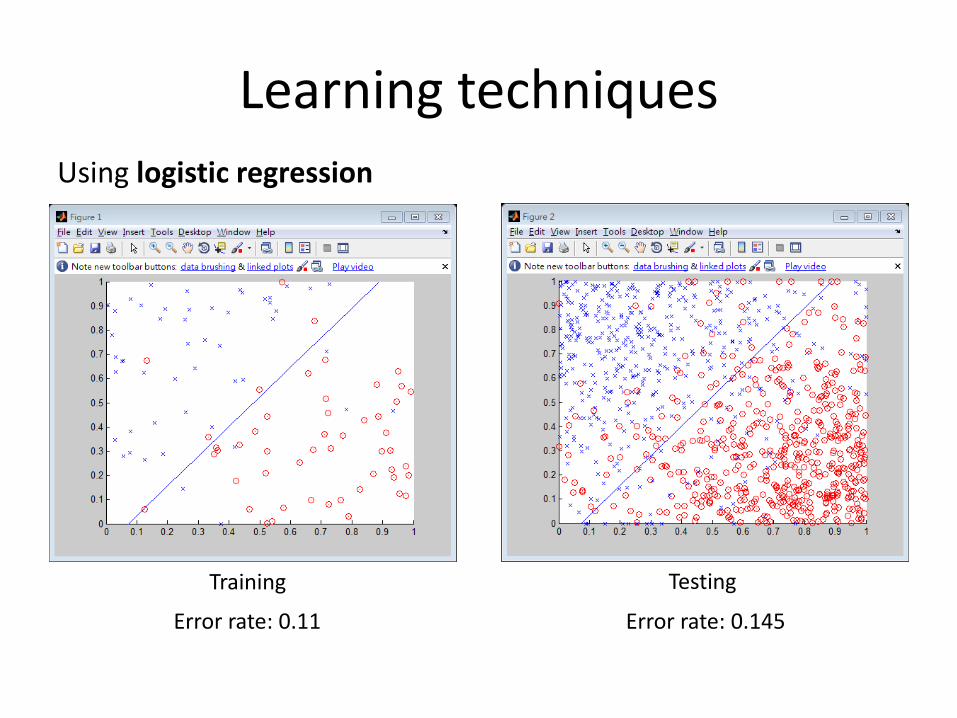
Learning techniques
Using logistic regression
Training Testing
Error rate: 0.11 Error rate: 0.145
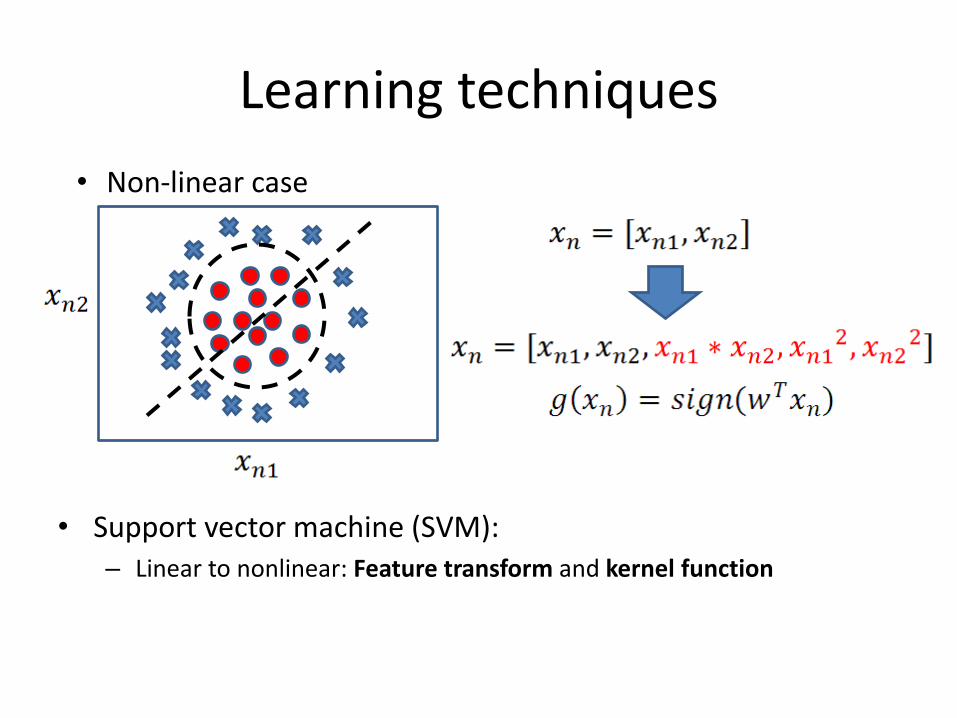
• Support vector machine (SVM): – Linear to nonlinear: Feature transform and kernel function
Learning techniques
• Non-linear case

• Unsupervised learning categories and techniques – Frequent Pattern mining
• Apriori
• FP-Tree
– Clustering
• K-means clustering
• Spectral clustering
– Density Estimation
• Gaussian mixture model (GMM)
• Graphical models
– Dimensionality reduction
• Principal component analysis (PCA)
• Factor analysis
Learning techniques

Challenges of Machine Learning and Data Mining
• Scalability
• Dimensionality
• Complex and Heterogeneous Data
• Data Quality
• Data Ownership and Distribution
• Privacy Preservation
• Streaming Data

Scope
• Covers a wide range of machine learning techniques—from basic to state-of-the-art.
• You will learn about the methods you heard about: decision trees (recap for some of you, and the others won’t be lost later on), pattern mining, clustering centering on K-means, EM, and DBSCAN, data stream mining, and social network mining.
• Covers algorithms, theory and applications • It’s going to be fun and hard work

Acknowledgments
• Slides here have been adapted from
– Introduction to Data Mining by Tan, Steinbach, Kumar.
– Mining Massive Datasets by Anand Rajaraman and Jeff Ullman, Jure Leskovec.