machine learning applications for analyzing sailboat race handicaps
TRANSCRIPT
Machine Learning Applications for Analyzing
Sailboat Race Handicaps
TCSS 702 Design Project in Computing and Software Systems
John C. Reed Jr.Committee Chair: Professor Isabelle Bichindaritz, Ph. D.
Committee Member: Professor Ankur M. Teredesai, Ph. D.
August 22, 2008

Contents
1 Introduction . . . . . . . . . . . . . . . . . . . . . . . . . . . . 1
2 Background . . . . . . . . . . . . . . . . . . . . . . . . . . . . 22.1 Performance Handicap Racing Fleet (PHRF) . . . . . . . . . . . 22.2 Rapidminer . . . . . . . . . . . . . . . . . . . . . . . . . . . . . . 22.3 Outlier Detection . . . . . . . . . . . . . . . . . . . . . . . . . . . 3
2.3.1 Density Based Cluster Analysis . . . . . . . . . . . . . . . 42.3.2 Distance Based Cluster Analysis . . . . . . . . . . . . . . 42.3.3 Local Outlier Factors . . . . . . . . . . . . . . . . . . . . 42.3.4 Support Vector Machines . . . . . . . . . . . . . . . . . . 5
2.4 Related Work . . . . . . . . . . . . . . . . . . . . . . . . . . . . . 5
3 Dataset . . . . . . . . . . . . . . . . . . . . . . . . . . . . . . . 73.1 Data Description . . . . . . . . . . . . . . . . . . . . . . . . . . . 73.2 Data Preprocessing . . . . . . . . . . . . . . . . . . . . . . . . . . 9
3.2.1 Data Integration . . . . . . . . . . . . . . . . . . . . . . . 103.2.2 Data Cleaning . . . . . . . . . . . . . . . . . . . . . . . . 103.2.3 Data Transformation . . . . . . . . . . . . . . . . . . . . . 103.2.4 Data Reduction . . . . . . . . . . . . . . . . . . . . . . . . 10
4 Sailboat Handicap Analysis . . . . . . . . . . . . . . . . . . . 114.1 Skill Detection . . . . . . . . . . . . . . . . . . . . . . . . . . . . 114.2 Outlier Detection . . . . . . . . . . . . . . . . . . . . . . . . . . . 144.3 Custom Analysis Algorithm . . . . . . . . . . . . . . . . . . . . . 144.4 Validation . . . . . . . . . . . . . . . . . . . . . . . . . . . . . . . 17
4.4.1 Actual Changes in the Database . . . . . . . . . . . . . . 174.4.2 Expert Analysis . . . . . . . . . . . . . . . . . . . . . . . 174.4.3 Global Constant . . . . . . . . . . . . . . . . . . . . . . . 18
4.5 Web Application . . . . . . . . . . . . . . . . . . . . . . . . . . . 184.5.1 Data Visualization . . . . . . . . . . . . . . . . . . . . . . 194.5.2 Security . . . . . . . . . . . . . . . . . . . . . . . . . . . . 194.5.3 Web Services . . . . . . . . . . . . . . . . . . . . . . . . . 20
5 Results . . . . . . . . . . . . . . . . . . . . . . . . . . . . . . . . 20
6 Discussion . . . . . . . . . . . . . . . . . . . . . . . . . . . . . . 24
7 Future Work . . . . . . . . . . . . . . . . . . . . . . . . . . . . 25
8 Conclusion . . . . . . . . . . . . . . . . . . . . . . . . . . . . . 26
References . . . . . . . . . . . . . . . . . . . . . . . . . . . . . . . 30
i
A Data Description . . . . . . . . . . . . . . . . . . . . . . . . . . 30A.1 Data Dictionary . . . . . . . . . . . . . . . . . . . . . . . . . . . 30A.2 Descriptive Data Summarization . . . . . . . . . . . . . . . . . . . 37
B Charts and Graphs . . . . . . . . . . . . . . . . . . . . . . . . 43
C Use Cases . . . . . . . . . . . . . . . . . . . . . . . . . . . . . . 46
D Source Code . . . . . . . . . . . . . . . . . . . . . . . . . . . . 61D.1 Rapidminer process files . . . . . . . . . . . . . . . . . . . . . . . 61
D.1.1 Main process file . . . . . . . . . . . . . . . . . . . . . . . 61D.1.2 SVM process file . . . . . . . . . . . . . . . . . . . . . . . 64
D.2 SQL Server Assembly . . . . . . . . . . . . . . . . . . . . . . . . 66D.3 MS Access VB Scripts . . . . . . . . . . . . . . . . . . . . . . . . 102D.4 Java Data Parser and Preprocessor . . . . . . . . . . . . . . . . . 118
List of Tables
1 Local Outlier Factor Results . . . . . . . . . . . . . . . . . . . . . 212 Distance Based Cluster Analysis Results . . . . . . . . . . . . . . 213 Support Vector Machine One Class Analysis Results . . . . . . . 234 Density Based Cluster Analysis Results . . . . . . . . . . . . . . 235 Custom Race Comparison Algorithm Results . . . . . . . . . . . 246 Expert Analysis Results . . . . . . . . . . . . . . . . . . . . . . . 24
List of Figures
1 Rapidminer user interface . . . . . . . . . . . . . . . . . . . . . . 32 Outlier detection algorithms . . . . . . . . . . . . . . . . . . . . . 63 Sailboat Racing Database . . . . . . . . . . . . . . . . . . . . . . 84 J Boat 24 class performance distribution . . . . . . . . . . . . . 125 Comparison of two boats races over time . . . . . . . . . . . . . . 156 Effect of performance before and after skill detection . . . . . . . 227 Sample PHRF-NW Protocol Change Notice (PCN) . . . . . . . 448 Sailboat Dimensions . . . . . . . . . . . . . . . . . . . . . . . . . 459 Effect of performance before skill detection . . . . . . . . . . . . 479 Effect of performance before skill detection . . . . . . . . . . . . 4810 Two dimensional view of data before skill detection . . . . . . . . 4910 Two dimensional view of data before skill detection . . . . . . . . 5011 Effect of performance after skill detection . . . . . . . . . . . . . 5111 Effect of performance after skill detection . . . . . . . . . . . . . 5212 Two dimensional view of data after skill detection . . . . . . . . 5312 Two dimensional view of data after skill detection . . . . . . . . 5413 Custom Algorithm Ratio Distribution . . . . . . . . . . . . . . . 5513 Custom Algorithm Ratio Distribution . . . . . . . . . . . . . . . 56
ii

14 Random Guessing Accuracy Distribution . . . . . . . . . . . . . . 5715 Project Usecase Diagram . . . . . . . . . . . . . . . . . . . . . . 58
iii

Abstract
Amateur sailboat racing is an exciting and challenging sport enjoyedby many people. However, to account for the large diversity of boatsa handicap system needs to be used that theoretically gives every boata chance to win. The most popular system, the Performance HandicapRacing Fleet (PHRF), only takes the sailboats speed potential, not thecrews skill or weather conditions, into account and because it rates eachboat individually questions sometimes arise as to the accuracy. The heartof the system is a rating in seconds per mile that allows for a correctedfinish time to fairly compare results of boats that may have actual finishtimes very far apart. The current handicap system accepts that mistakesare possible and procedures are in place to rectify improper handicaps.However, it can be very difficult for handicappers to analyze all of thedata in order to determine if a correction should be made. This paper de-tails the progress made in developing a system that uses several machinelearning techniques to analyze and detect potential outliers in a largereal-world dataset, with the overall goal of assisting the handicappers.After the data preprocessing a subset was chosen for outlier detection.However, each sailboats skill level had to be determined and factored outsince it is not accounted for in the actual handicap. Then several dif-ferent methods of outlier detection were used, including Support VectorMachines (SVMs), distance based cluster analysis, density based clusteranalysis, and local outlier factor analysis. In the end, the performance ofgeneric algorithms proved to be poor, so a custom algorithm tailored tothe specific dataset was created. The algorithm, which tries to emulatehow humans detect outlier boats, greatly improved the outlier predictionaccuracy. Finally, to tie everything together, a web application was cre-ated to enable the handicappers to visualize the data and results of theoutlier detection algorithms.
iv

1 Introduction
Sailing is a pastime enjoyed by many people. It is prized for its serenity butat the same time for its complexity. The skill required has led to the longstanding and exciting sport of racing. However, not everyone can afford a milliondollar racing boat or likes the sometimes rough rides of smaller racing boats.To accommodate the everyday amateur racer a system of rules and handicapshas been set up to try to put everyone on an even playing field. This canbe difficult as the sailboats can be just as different as the racers themselves.An amateur race between twenty teams may contain twenty different sailboatsin various sizes and shapes. To make everything fair each boat is assigned ahandicap based on how well it should perform under ideal conditions. This isin the form of a number representing seconds per mile to be subtracted fromthe boats finish time giving a corrected finish time that is compared to all otherrace participants corrected times to determine the winner. In the end though,the handicap system is not perfect, due to the massive amount of factors usedto determine it, and sailors can become frustrated when they are unable tobeat a boat whose handicap is too high. This paper details a system that willhelp experts better set handicaps using outlier detection and data visualization,creating an environment that is more enjoyable for everyone.
The main difficulty in this project is the complexity of the data. Not onlyis the amount of variables large, in the current database the sailboat table has67 fields (see figure 3), but there is also an amount of randomness to it. Thatis, sometimes a chance event, such as a wind gust or equipment failure, canaffect a race. Any algorithm created needs to be smart enough to detect whensomething is not right and not use that particular piece of data as there is toomuch data for that task to be done by hand. Even a much simpler field of horserace odds prediction with only 12 input variables requires sophisticated datamining algorithms. [11] Sailboat racing has many more determining factors totake into account.
Extensive research[15, 19, 22, 17] has been done and so far no project hasbeen found that attempts to solve the same problem as this one. One possibleexplanation is the lack of commercial interest. Most amateur racing organi-zations are non-profit and are run by volunteers with few paid employees. Incontrast, millions of dollars are pored into professional races such as the Amer-icas Cup and extensive research is done on boat performance. However, mostprofessional racing does not use handicaps, either all the boats are the same orthe goal is to make the sailboat go as fast as it can go, so research funding isgeared more towards design and simulation. Another possible reason this areahas not been explored academically is the small size of the community. ThePHRF Northwest currently has only 891 active sailboats, which is minusculecompared to the population of the region even considering many people mayrace on one boat. With such a small community one has to wonder how manyare researchers in the computer science field.
The lack of prior computer science projects in this area has both good andbad aspects. It is good in the sense that the idea may be novel and thus garner a
1
lot of merit. However, at the same time there are no sources to gain insight frombecause even if another project has the same goal there are usually many waysto achieve it. Possible methods for approaching the problem in an intelligentway include case-based reasoning [2, 26] and support vector machines [6, 27]both of which offer extensive areas of new research.
2 Background
The following sections detail the background knowledge necessary for the projectand related work that helps further the project.
2.1 Performance Handicap Racing Fleet (PHRF)
In the United States the most popular handicapping system is the PerformanceHandicap Racing Fleet1 (PHRF) 2. It is an administered handicap system,meaning local committees subjectively decide on the ratings, as apposed toa strict measurement-based system so the same boat can have different rat-ings depending on what region inspects it. As a result, it can sometimes becontroversial.[9]
One of the benefits of the PHRF is that it is constantly adapting throughobservation. A handicap reflects an estimate of a sailboats speed potentialbased on knowledge of previous racing experience supported by a consensus ofthe effect of differential hull and rigging parameters. Handicaps are arrived atthrough an empirical process based upon observation and analysis of race results.The basic process when rating a sailboat is to start with a standard, base boat,rating and make adjustments based on set rules concerning the hull and riggingparameters.[1] However, as technology advances and more information is gainedthe rules are changed accordingly, although be it with much debate. Once thecommittee agrees on a rule change, a protocol change notice is issued. A samplenotice can be seen in appendix B. This projects main aim is to make the entireprocess along with conflict resolution easier.
2.2 Rapidminer
The primary tool chosen to perform the outlier detection on the data is RapidMiner.[23] It is an open source data mining tool written in Java that is ableto perform various types of regressions, classifications, and other data miningtasks, including outlier detection. Additionally, many third party packages havebeen incorporated into Rapidminer such as LIBSVM, which uses support vector
1http://www.ussailing.org/phrf/index.asp2There is some confusion as to what the P stands for in PHRF. When first formed, in
Southern California, the organizations name was the Pacific Handicap Racing Fleet. Asthe system became more popular and spread to the east coast the system was renamed thePerformance Handicap Racing Fleet.[1] However, most clubs on the west coast have stayedwith the term Pacific, so the exact meaning comes down to which coast you live on, althoughthe system is the same.
2

machines to perform outlier detection. The interface requires some learning, butgreatly facilitates experimentation, as components can be easily swapped out oreven just disabled for a particular run.
Figure 1: Rapidminer user interface
2.3 Outlier Detection
According to Hodge and Austin[16]outliers are defined as an outlying observa-tion, or outlier, is one that appears to deviate markedly from other members ofthe sample in which is occurs or as an observation (or subset of observations)which appears to be inconsistent with the remainder of that set of data. Manyterms have been used including novelty detection, anomaly detection, noisedetection, deviation detection, or exception mining, but all involve a similarprocess or goal. In addition to the many different names, there are many morealgorithms for solving them. However, only a few are supported by Rapidminer.These being density based cluster analysis, distance based cluster analysis, localoutlier factors, and support vector machines.
3
2.3.1 Density Based Cluster Analysis
The first step in density based cluster analysis is to find clusters with a specifiedminimum density and radius. Then it is simply a matter of identifying pointsnot contained in any cluster as outliers. For example, see Figure 22b. The bluepoints are in dense regions and thus belong to clusters, while the red points,which are outliers, are in much less dense regions. One of the primary advantagesof this method is the ability to find unusually shaped clusters, like the donutshaped one in Figure 22b.
Rapidminer uses a distance based (DB) outlier detection algorithm whichcalculates the DB(p,D)-outliers for an example set passed to the algorithm.DB(p,D)-outliers are Distance based outliers according to Knorr and Ng. ADB(p,D)-outlier is an object to which at least a proportion of p of all objects arefarther away than distance D. It essentially implements a global homogeneousoutlier search.[20, 21]Even though the algorithm is labeled as distance based, itis effectively calculating the density and Rapidminer lists it as such.
2.3.2 Distance Based Cluster Analysis
The first step in distance based cluster analysis is to compute the optimal clus-ters using a distance based algorithm such a K-Means, which groups data pointswith the centroid they are closest too. After the clustering algorithm is executed,finding the outliers is as simple as finding the points farthest from the centroid.A graphical example of the end result can be seen in Figure 22a.
Rapidminers distance based cluster analysis is a little more complicated. Itperforms a D(k n) Outlier Search according to the outlier detection approachrecommended by Ramaswamy, Rastogi and Shim in ”Efficient Algorithms forMining Outliers from Large Data Sets”. It is primarily a statistical outliersearch based on a distance measure similar to the DB(p,D)-Outlier Search fromKnorr and Ng. However, it utilizes a distance search through the k-th nearestneighborhood, so it implements some sort of locality as well. Basically, themethod states that those objects with the largest distance to their k-th nearestneighbors are likely to be outliers because it can be assumed that those objectshave a sparser neighborhood than the average object. This effectively providesa simple ranking over all the objects in the data set according to the distanceto their k-th nearest neighbors.[25] Even though this sounds very similar to thedensity based method, Rapidminer lists this algorithm as distance based.
2.3.3 Local Outlier Factors
The Local Outlier Factors (LOF) algorithm in Rapidminer is a type of densitybased cluster analysis. It measures the density of objects and their relation toeach other, called the local reachability density. The LOF is computed based onthe average ratio of the local reachability density of an object and its k-nearestneighbors
The LOF algorithm in Rapidminer consists of two basic steps. In the firststep, the objects are grouped into containers. For each object, using a radius
4

screening of all other objects, all the available distances between that object andanother object, or group of objects, on the same radius of a given distance areassociated with a container. The container then has the distance information,the list of objects within that distance, and the number of objects recorded in it.In the second step, three things are done. First, the containers for each objectare counted in ascending order, according to the cardinality of the object listwithin, to find the k-distances for each object and the objects in that k-distance,which are all of the objects in all of the subsequent containers that have asmaller distance. Next, using this information, the local reachability densitiesare computed by using the maximum of the actual distances and the k-distancefor each object pair, averaging it by the cardinality of the k-neighborhood, andthen taking the reciprocal value. Lastly, the LOF is computed for each objectvalue in the specified range, up to the upper bound, by averaging the ratiobetween the local reachability density of all objects in the k-neighborhood andthe object itself. The maximum LOF in the specified range is passed as thefinal LOF for each object.[5]
2.3.4 Support Vector Machines
SVM methodologies have their roots in Vladimir Vapniks 1979 work Estimationof Dependencies Based on Empirical Data. [6] However, using SVMs for regres-sion was not proposed until 1997.[10] Once SVMs were developed for performingregression it was a natural step to use them for outlier detection.
Even more recent research on weighted margin SVMs[27] looks promising asit allows for the incorporation of prior knowledge. SVMs already work well whenthe size of the input variables is large relative to the amount of training data,but incorporating prior knowledge pushes this benefit even farther. However,one problem is that the large amount of coefficients outputted in the regressionmake it almost impossible for a human to interpret thus artificial intelligence-based knowledge extraction routines could also be helpful. Experiments doneby Jordaan and Smits have shown that SVMs can work well finding outliersin high dimensionality industrial data.[18] The actual implementation used byRapidminer is LibSVM created by Chang and Lin.[8]In the most basic sense, itfinds the hyperplane that separates the data and then determines the outliersby finding the points farthest from the hyperplane, as can be seen in Figure 22c.
2.4 Related Work
It can be difficult to find projects directly related to setting handicaps. One caninfer that this is due either to the simplicity of many handicapping algorithms,such as in golf, bowling, or tennis, that rely only on past performance or thatpossibly researchers have yet to explore certain areas due to a lack of interestor unfamiliarity of the underlying fields. One area of research that may provideideas is that of skill-based systems for racing sailboats. One such system, Ro-bosail, uses a combination of agent technology, machine learning, data mining,
5

(a) Distance based (b) Density based
Margins
Hyperplane
SupportVectors
(c) Support Vector Machine
Figure 2: Outlier detection algorithms
6

and rule-based reasoning to maneuver a sailboat in a race. [3] A more relatedproject uses support vector machine (SVM) methods to predict horserace oddsbased on twelve input variables. [11]Odds are very similar to handicaps in thatthe lower the handicap the more likely that participant is to win if the handicapwas not used, so this research involving SVMs proved useful.
Research by Graves et al. analyzed NASCAR races using permutationmodels.[14] They used performance metrics for each driver and were able topredict the winner of one series with 88% accuracy, although not all of their re-sults were as good. The study used mainly custom analyzation tools and focusedmore on simulation, even so, it still provided some insight into methodologiesfor analyzing this type of data.
The hardest part in finding useful information is that the majority of re-search involving sailboats deals mainly with simulation. Such as Pjilipott etal.’s work that uses velocity prediction programs and other models to predictrace outcomes.[24] Though not necessarily related to this project, the studiescan give some insight into the nature of the data and could be potentially usefulin the future in detecting a boat’s skill level by comparing predicted perfor-mance to actual performance. However, they do not tend to deal with any racehandicap issues.
3 Dataset
The dataset for this project is fairly complex. The following sections describehow the data was collected, the structure of the data, and how the data wasprocessed.
3.1 Data Description
The database was created in the summer of 2006 in an effort to accumulatedall of the wide spread data into one place. It was designed to accommodatemultiple sailboat clubs and races. As a result, there are many tables withvarious functions. See figure 3 for the structure of the database, includingattribute types and entity relationships. A detailed explanation of each table isalso presented below in figure 3. The main tables used for this project being theBoat, Race, and Result. The full dataset contains 14325 race results for 1060races with 639 boats of 299 distinct types participating.
The Member table contains information relating to a member. The usernameand password are allowed to be blank only if the account is a non-login onefor data storage purposes only. This would be the case if a member did nothave computer access, but their information is needed to be in the database foranalysis purposes. The Boat table contains all the information relating to a boat.The MemberID would be considered the owner or administrator of the boatthough more than one member can be associated with a boat as seen below onlythis member can edit it. The Club table contains all the information relating to aclub. The AdminID is the member who is not already an administrator who has
7
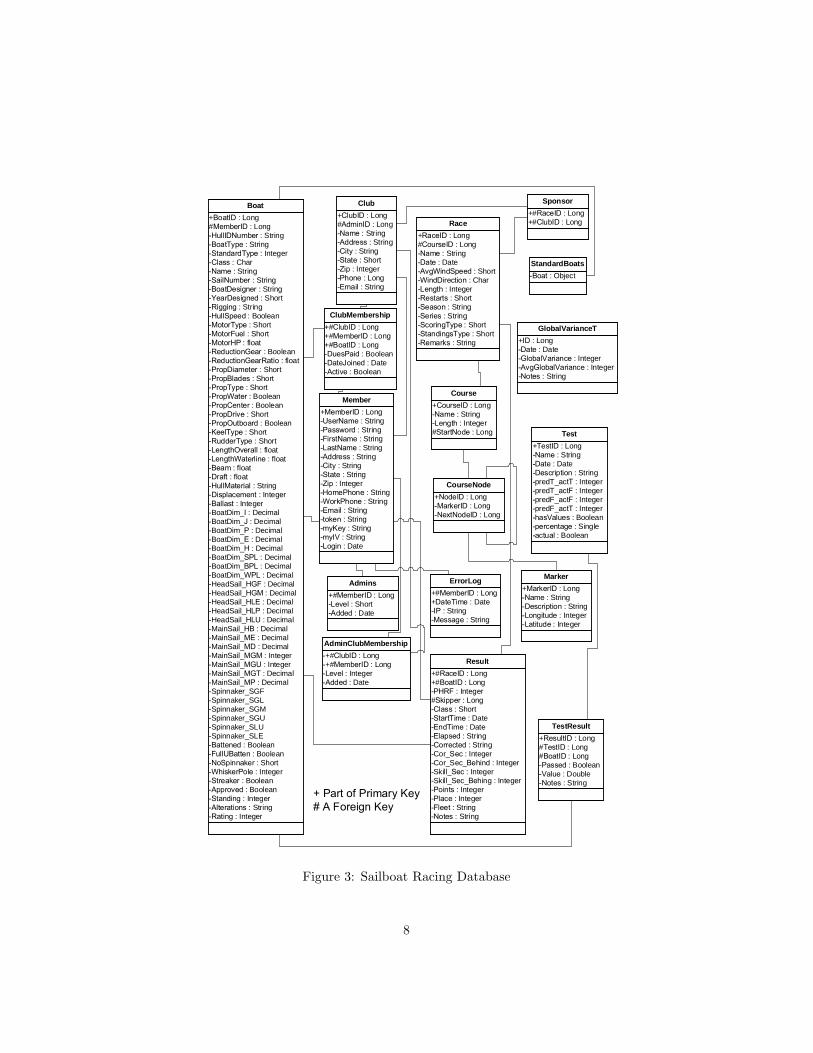
+BoatID : Long#MemberID : LongHullIDNumber : StringBoatType : StringStandardType : IntegerClass : CharName : StringSailNumber : StringBoatDesigner : StringYearDesigned : ShortRigging : StringHullSpeed : BooleanMotorType : ShortMotorFuel : ShortMotorHP : floatReductionGear : BooleanReductionGearRatio : floatPropDiameter : ShortPropBlades : ShortPropType : ShortPropWater : BooleanPropCenter : BooleanPropDrive : ShortPropOutboard : BooleanKeelType : ShortRudderType : ShortLengthOverall : floatLengthWaterline : floatBeam : floatDraft : floatHullMaterial : StringDisplacement : IntegerBallast : IntegerBoatDim_I : DecimalBoatDim_J : DecimalBoatDim_P : DecimalBoatDim_E : DecimalBoatDim_H : DecimalBoatDim_SPL : DecimalBoatDim_BPL : DecimalBoatDim_WPL : DecimalHeadSail_HGF : DecimalHeadSail_HGM : DecimalHeadSail_HLE : DecimalHeadSail_HLP : DecimalHeadSail_HLU : DecimalMainSail_HB : DecimalMainSail_ME : DecimalMainSail_MD : DecimalMainSail_MGM : IntegerMainSail_MGU : IntegerMainSail_MGT : DecimalMainSail_MP : DecimalSpinnaker_SGFSpinnaker_SGLSpinnaker_SGMSpinnaker_SGUSpinnaker_SLUSpinnaker_SLEBattened : BooleanFullUBatten : BooleanNoSpinnaker : ShortWhiskerPole : IntegerStreaker : BooleanApproved : BooleanStanding : IntegerAlterations : StringRating : Integer
Boat
+RaceID : Long#CourseID : LongName : StringDate : DateAvgWindSpeed : ShortWindDirection : CharLength : IntegerRestarts : ShortSeason : StringSeries : StringScoringType : ShortStandingsType : ShortRemarks : String
Race
+#RaceID : Long+#BoatID : LongPHRF : Integer#Skipper : LongClass : ShortStartTime : DateEndTime : DateElapsed : StringCorrected : StringCor_Sec : IntegerCor_Sec_Behind : IntegerSkill_Sec : IntegerSkill_Sec_Behing : IntegerPoints : IntegerPlace : IntegerFleet : StringNotes : String
Result
+CourseID : LongName : StringLength : Integer#StartNode : Long
Course
+ClubID : Long#AdminID : LongName : StringAddress : StringCity : StringState : ShortZip : IntegerPhone : LongEmail : String
Club
+MarkerID : LongName : StringDescription : StringLongitude : IntegerLatitude : Integer
Marker
+NodeID : LongMarkerID : LongNextNodeID : Long
CourseNode
+MemberID : LongUserName : StringPassword : StringFirstName : StringLastName : StringAddress : StringCity : StringState : StringZip : IntegerHomePhone : StringWorkPhone : StringEmail : Stringtoken : StringmyKey : StringmyIV : StringLogin : Date
Member
+#MemberID : LongLevel : ShortAdded : Date
Admins+#MemberID : Long+DateTime : DateIP : StringMessage : String
ErrorLog
+#ClubID : Long+#MemberID : Long+#BoatID : LongDuesPaid : BooleanDateJoined : DateActive : Boolean
ClubMembership
Boat : ObjectStandardBoats
+#RaceID : Long+#ClubID : Long
Sponsor
+ Part of Primary Key# A Foreign Key
+#ClubID : Long+#MemberID : LongLevel : IntegerAdded : Date
AdminClubMembership
+ID : LongDate : DateGlobalVariance : IntegerAvgGlobalVariance : IntegerNotes : String
GlobalVarianceT
+TestID : LongName : StringDate : DateDescription : StringpredT_actT : IntegerpredT_actF : IntegerpredF_actF : IntegerpredF_actT : IntegerhasValues : Booleanpercentage : Singleactual : Boolean
Test
+ResultID : Long#TestID : Long#BoatID : LongPassed : BooleanValue : DoubleNotes : String
TestResult
Figure 3: Sailboat Racing Database
8

the ability to edit the information. The Race table contains general informationabout a race such as a description and race conditions. Most race informationis allowed to be null since it will not be known at race time. The Result tablewill contain the results for all of the races. Since a boats class can change perrace the class a boat raced under for a particular race is stored here where asthe boats default class is stored in the Boat table. The Sponsor table contains arelationship between a race and a club, since more than one club can sponsor arace or more the one clubs boats may be racing in a race. The ClubMembershipcontains the relationship between members, boats, and clubs. A boat can be nullbecause a member can belong to a club without a boat, but the member can notbe null. In this relationship you can also have many members associated withone boat. There is a flag to set for due paying and active members of the clubfor filtering and analysis purposes. The Course table contains basic informationabout a course and a link to its first node. The CourseNode table represents acourse node and is basically a pointer to a marker. Since markers can be usedrepeatedly, the information is not duplicated. Also, with a pointer to the nextnode an effective linked list is created that supports an infinite course length.The Marker table contains the information about a marker used in race courses.The Admins table defines which members are administrators and what level ofaccess they have, i.e. whether they are handicappers, race administrators, etc.Whenever an exception is caught it is saved in the ErrorLog table along withany user information. Stored procedures and triggers in the database will deleteold errors and keep the log from growing too large. The StandardBoats tablecontains standard boat types with the same attributes as the boats table exceptfor identifying information, since these boats do not exist. It can be used to fillin missing information in the Boat table. However, the same attributes need tobe maintained in the Boat table because physical modifications can be made toindividual boats that change them from the standard.
3.2 Data Preprocessing
The following sections detail various aspects of the data preprocessing, includ-ing data integration, cleaning, transformation, and reduction. The data wasobtained from race results published on the web. As a result, much preprocess-ing was needed. The first step involved creating a parsing program in Java toextract the information and put it into comma separated value text files. Thetext files were cleaned and processed using regular expressions before importingthem into Microsoft Access upon which more cycles of cleaning and process-ing were performed. Microsoft Access was chosen for the majority of the dataprocessing for several reasons. The graphical interfaces allow easy manual ma-nipulation of the data. The built in SQL engine allows powerful filtering andprocessing of the data. Lastly, the built in Visual Basic language allows scriptsto be created in the database that are quick and easy to write, yet very powerful.After the preprocessing was completed the data was migrated to Microsoft SQLServer using the Upsizing Wizard in Access.
9

3.2.1 Data Integration
This was probably one of the most difficult parts of the data preprocessing.Since results from three separate clubs were obtained in different formats, onejust in plain text, one in html tables, and one in html spans and divisions,processing took a lot of time. It had to be determined which fields were thesame, although corrected time was one of the most universal. Also misspellingsor different spellings had to be corrected along with differences in abbreviations.For instance, one club uses RANG to abbreviate Ranger and another club usesRANC.
3.2.2 Data Cleaning
The data cleaning involved removing records that had too many missing valuesor improperly formatted values. The second scenario was mostly dealt with byMS Access as improperly formatted fields were automatically identified uponimporting the data. They could then either be fixed or removed. Findingrecords with missing information is also relatively easy with simple SQL queriesin MS Access. However, many bad records were removed from the text file,prior to importing, using Textpads regular expression features. For example,if a record contained DNF, meaning did not finish, a replace operation couldbe run with the regular expression ˆ.*DNF,.*\n to remove all those lines. Thistool was used to remove many bad records that fit known patterns.
One problem that appeared when running visual basic scripts was the pres-ence of a in the boat name, or any text field for that matter. The simplestsolution was to remove this character from all of the data. Although MS Accessusually does not make a distinction between upper and lowercase letters, thisproblem also needed to be fixed, though most of the attributes chosen for thisproject are numeric.
3.2.3 Data Transformation
The corrected time was transformed from a textual representation into numer-ical seconds. This allowed for easier mathematical calculations, such as deter-mining the seconds behind or missing information such as the race distance.Other than that, no data was discretized or otherwise transformed. However,it is being debated whether it may be useful to discretize the race distance oreven the seconds behind, which would actually be akin to the finishing place.Initial experiments with such transformation have provided no improvement.
3.2.4 Data Reduction
The overall dataset was significantly reduced for the purposes of outlier detectionby selecting only the attributes that were the most relevant. Although thereare many attributes describing a boat there are only a few, critical ones, thatcontribute most to its performance. These being the ones related to the sailarea, I, J, P, and E, and water displacement, DISP, LWL, and DRFT. The
10

more sail area the faster a boat will go and the more water it displaces theslower it will go with the same sail area. See Figure 8 in Appendix B for avisual representation of these attributes.
In the Results table, these are the distance, corrected seconds behind, whichdetermines place, and the PHRF rating, all of which are numeric. The PHRFrating was chosen because it encapsulates a boats performance, which should bean excellent predictor, even though the race times are already corrected basedon this factor. Additionally, initial experiments on the full set of race resultsfailed with out of memory exceptions. As a result, the race information wasaggregated into averages that significantly reduced the size of the dataset.
4 Sailboat Handicap Analysis
The following sections detail the different aspects of the sailboat handicap anal-ysis project.
4.1 Skill Detection
Skill detection was deemed a very important aspect of the project. It is clearfrom analysis on the original dataset that performance was a key contributor tothe selection of outliers, as can be seen in figure 9 Appendix B. These diagramsshow that initial experiments on the original data produce clear patterns
Actual handicaps are determined by performance somewhat independentof skill. The national organization that assigns handicaps factors out skill bylooking at only the top 25% of racers.[4] In other words, ignoring 75% of thedata. Their dataset is so large this is not a problem for them. However, itis more desirable to be able to look at all racers, so skill needs to be factoredout some other way. The simplest way to determine skill is to compare howdifferent people perform on the same type of boat. If one person consistentlyperforms better than another and they have the same boat, then the personwho performs better can be considered to have a higher skill level. Figure 4shows the performance of one of the largest classes of boats. The Y axis is theaverage seconds behind, or performance, and the X axis is each individual boatspaced evenly. As can be seen, there is quite a wide distribution.
However, the majority of boat types have only a few members, or evenjust one. In that case, similar handicap ratings can be used for comparisoninstead of exact boat types. The theory being that two boats with the samerating should perform similarly. The only problem is that two boats with thesame rating might perform differently under different conditions. Therefore,comparisons based on ratings are less accurate, so they are given a lower weightin the overall formula. Since, intuitively, skill changes over time it was decidedto consider skill as a linear function instead of as a static value. The slope ofthe function being the rate of improvement, positive or negative, and the YIntercept being the performance difference from average at year zero, which isthe first year data was collected. In the current dataset that year is 1996, but
11

Figure 4: J Boat 24 class performance distribution
the algorithm finds it every time it is run, so it will be updated if new datais added. Even though a boat’s average performance was calculated per year,each value was compared against the global average of the specific boat type orhandicap rating. Taking the global average, as opposed to the average of thesame year being calculated, should be more accurate, as it contains much moredata than the latter.
Since the skill calculation requires most of the data from the database, itwas decided to perform the calculations locally, as opposed to remotely. Eventhough the web application runs locally, on the same machine, it is designedto run remotely. Thus a different approach was needed for the skill detection.With Microsoft SQL Server there are several different methods of performingcalculations within the database itself. The most basic way is to create a SQLfunction or stored procedure. The code is stored and ran in the database, whichis desirable, but does not support some of the more advance features that fullprogramming languages have making it less functional.
A second method to perform calculations in SQL Server is through the DataTransformation Services (DTS) component. Using DTS, code can be written inVisual Basic (VB) Script that manipulates the data in the database. Using VBScript is a plus, as much data manipulation code had already been written init for MS Access during the data preprocessing stage. The biggest drawback ofDTS, and the primary reason for not using it, is that it is not supported in freeversion of SQL Server, which is used by this project. A final way to manipulatethe data in SQL Server, and ultimately the one chosen, is to use managed codecompiled into a DLL assembly that can be loaded directly into SQL Server.
A major obstacle in creating the SQL Server assemblies was the lack of gooddocumentation. The tutorials online and on MSDN were very general. Goingso far as to say load some template, add some lines of code, and compile it.However, the templates were missing from the express and standard editionsof visual studio, which were the versions used at home and school respectively.Once the assembly is compiled and loaded the methods in the DLL can belinked to custom SQL functions or stored procedures. These functions or stored
12

procedures can then be called from a client or from custom code such as theweb application. One of the major advantages of a SQL Server assembly is thatit can easily be modified to run externally because the only difference in thecode base is how the connection is made. This means the code is not explicitlytied to SQL Server. If the database server is changed in the future, only afew modifications would be necessary to enable the same code to run on it.Psuedocode for the skill detection algorithm can be seen in Source 1.
Source Code 1 Skill Detection Algorithm Psuedocode
create hashtable HC to store class average objectscreate hashtable HR to store rating average objectscreate hashtable HB to store boat data objectsforeach boat B in the database
get average seconds behind Aget number of races Rcreate boat data object and add to HBget B.class object BC from HC or create a new one if it does not existadd A,R to BC and add, or overwrite, BC to HCget B.rating object BR from HR or create a new one if it does not existadd A,R to BR and add, or overwrite, BR to HR
end for eachfor each average performance A per boat B per year Y
add A,Y to B in HBend for eachfor each boat B in HB
get B.class average CA and count CC from HC and add to Bget B.rating average RA and count RC from HR and add to Badjust each years average in B based on CA,CC, RA, and RCperform linear regression on adjusted year averages in B
end for eachupdate skill function of all boats in database
After the skill detection algorithm is executed and the corresponding func-tion values are added to the database, the last step is to recalculate all of therace results. Race results are looked at year by year and each boat’s results areadjusted based on the value outputted from its skill function with the year asinput. To this end, extra attributes are added to the Results table to store thenew corrected times and the new corrected seconds behind. This ensures theold values are preserved.
13

4.2 Outlier Detection
After the data preprocessing, the subset of data defined earlier was obtainedby running the batch file seen in Appendix D source code 6. The output is acomma separated file that can be loaded directly into Rapidminer. Both theoriginal data and the skill corrected data are present, so a filter is needed inRapidminer to ignore one or the other depending on which tests are being run.Since all of the algorithms were very similar, except SVM, only two process filesneeded to be created in Rapidminer. One for SVM outlier detection and onefor the others, both of which can be found in appendix D. The process files arein XML format which is text based and allows for easy sharing. There was abug in the current version, 4.1, so in order to run the SVM outlier detection theHEAD of the cvs at Sourceforge needed to be checked out and compiled.
4.3 Custom Analysis Algorithm
As a result of poor performance of Rapidminer outlier detection algorithms, anew custom algorithm was designed and implemented. The approach of thisalgorithm is similar one of the methods a handicapper might use to decideif a boat is an outlier. The process starts by looking at one boat and thencomparing it to each individual boat raced against. Like a handicapper, it looksfor patterns between individual boats, such as if one consistently finishes beforeor after the other. For example, a handicapper would look at figure 5, graphs oftwo boats finishing times for the same races superimposed on each other, andsee a clear pattern in the first but not in the second. A human is able to seethis, but a computer needs to do some analysis. The simplest way to see howthe boats compare to each other is to subtract their times for every race. If allthe differences were added up, the end result could be used to determine if apattern is present. The closer to zero the less likely there is a pattern becauseany pattern would continue to add in the same direction, either positive ornegative. However, the dataset is prone to outliers, so it is likely to have anextreme difference between any two boats and all it takes is just one to cancelout a potentially large pattern in the opposite direction. For instance, if twoboats had 10 races with a difference of 10, all it would take is one difference of-100 to bring the sum back to zero, even though there is a clear pattern in over90% of the data. To smooth out the outliers the differences are discretized intotwo bins, either positive or negative with zeros being ignored. This essentiallyignores the degree of difference, which could be an important factor, but requiresfuture work to make a determination.
The next step is to divide the number of positive and negative differencescreating a ratio. This could be done in the same order in which the boatsare compared. However, dividing the smaller value by larger instead has severalbenefits. First, it ignores whether the overall difference was positive or negative.This allows for a better comparison between values, as all negative differences isjust as significant as all positive differences. Second it normalizes values between0 and 1. If one boat always wins over another, the numerator will be zero and
14

zero divided by anything is zero. It can never go below zero because there are nonegative numbers. The largest possible value is when both boats have won anequal number of times and it is known the x/x is 1 no matter what x is. If eithernumber is decreased it will go on top and the number will be less than 1, sothe maximum is 1. Thus the closer the number is to zero the more of a patternthere is and the more likely that ratio is an outlier. A final benefit is that thesame value can be added to both boats so redundant or extra calculations canbe eliminated.
Along with the ratio a count of the number of races is also recorded, showingthe magnitude of the ratio. These two values together constitute a score for bothof the boats being compared. For instance figure 55a has a discernible patternwith 32 positive differences and 0 negative ones. This gives it a ratio of 0/32 anda magnitude of 32. Figure 55b, which has much less of a pattern, has 17 positivedifferences and 18 negative ones, giving it a ratio of 17/18 and a magnitude of35.
(a) Clear Pattern Present (b) No Distinct Pattern
Figure 5: Comparison of two boats races over time
After all of the scores are computed they are analyzed to find a thresh-old above which the score would be considered an outlier. In computing thethreshold both the ratio and the magnitude are used. The magnitude thresholdchosen was just the global average. So a score would have to have a magnitudegreater than average. Similarly, the ratio threshold is based on boat averages,as opposed to all values. It would be more accurate if every ratio was used, butthis would require more memory and processing time. Also, a boats averageratio is a good indicator of whether or not it is an outlier. A simple statisticalanalysis is done on the averages to find the bottom x percent of ratios, wherex is a user settable value. From this the threshold is found, which is simplythe highest value in the bottom x percent. Anything lower than this thresholdcan be considered an outlier. Finally, points are assigned based on the scorethreshold. A boat is awarded one point for every score whose ratio is below the
15

ratio threshold and magnitude is above the magnitude threshold.One problem with assigning points is that boats who have participated in
more races have a greater chance to get more points, so the values are notdirectly comparable to each other. To compensate for this the points must benormalized. It is usually best to normalize on the same or most similar attribute,so the first test divided the points by the number of boats raced against, whichwould be the theoretical maximum points. Other tests were done normalizingon the number of races, the number of years raced, and other variables. In theend, no matter what normalization method is used, the more points a boat hasthe more likely it is an outlier.
Psuedocode for the algorithm can be seen in Source Code 2. The theoreticalworst case performance of the algorithm is N2 + K. This would be the case isevery boat had to be compared to every other boat for every race. However,on the actual dataset only 32664 comparisons were performed in 15 minutesvs. 408321 comparisons in roughly 3 hours if it was n2. Out of 639 boats,102 boats had an average count of 1. Since the average number of points forcomparison was 5, none of these boats would ever receive any points and neverget marked as outliers. This fact helps emphasize the need for more data. Onelast observation found that the distribution of ratios was much closer to 0 thanexpected, as can be seen in Appendix figure .
Source Code 2 Custom Analysis Algorithm Psuedocode
create statistics object statget list of boats and create boat objectsforeach boat object A
foreach boat raced against Bif A does not contain B
forall races between A and Bcount Positive P and Negative N differences
calculate ratio of P and N Cadd value C to Aadd value C to B
end ifend for eachcalculate outlier value D based on race comparisonsadd A,D to stat
end for eachhave stat determine most probable outliersadd each boat outlier result to database
16

4.4 Validation
To test the accuracy of any of the outlier detection algorithms it must first beknow which boats are actually outliers. This can be difficult to determine on areal world dataset such as the one used in this project. Some of the outliers maynot have even been identified yet. To overcome this difficulty several methodsof validation were employed, as described below.
4.4.1 Actual Changes in the Database
One of the simplest ways to determine which boats are outliers is to look at whatchanges to their ratings have been made in the past. To this end, the databasewas scanned using the SQL query in Source 3 to find actual adjustments whichare then used to test the accuracy of the outlier detection algorithms. In theactual data, 174 of 639 boats have been adjusted at least once, which is over 27percent. Of those,48 have been adjusted by 20 seconds or more. Since so manyboats have been adjusted in the past only the top 10
Source Code 3 SQL query to find changesSELECT b.Name, b.BoatType, q2.bid, q2.low, q2.high, q2.diff,q2.num - 1 As changes FROM (SELECT q.bid, min (q.p)As low,max(q.p)As high, max(q.p)-min(q.p) As diff ,COUNT(*) As numFROM (SELECT r.BOAT ID as bid, r.PHRF As p FROM ResultAs r GROUP BY r.BOAT ID,r.PHRF)As q GROUP BY q.bid) Asq2, Boat as b WHERE b.BoatID=q2.bid AND q2.num ¿ 1 ANDq2.low ¡¿ 0 ORDER BY q2.diff DESC;
The major problem with these actual outliers is that they do not take timeinto account, or in other words it is not recorded when a change was made.Since none of the outlier detection algorithms take time into account anywaythe information is not necessary. However, in the future, better results will mostlikely be obtainable by taking time into account as one of the variables.
In addition to actual changes the actual appeals can also be used to testaccuracy. Both contain the same type of information, but the appeals are moreformal. However, with 10 years of meeting minutes and many records only onpaper, it is an enormous undertaking to process all of the appeals.
4.4.2 Expert Analysis
To make up for some of the limitations of the primary validation method, expertsin the field of handicapping were asked to generate a list of outliers, both pastand current highly suspected ones. The list was quite long at first, but wasreduced by putting a 10 race limit on the boats. A boat had to have participatedin at least 10 races to be included. The reason being, no outlier detectionalgorithm could be expected to detect a boat as an outlier if it has only doneone or two races. In fact, the custom algorithms magnitude threshold ended up
17

being 7, so it was impossible for any boat with less than 7 races to be markedas an outlier.
4.4.3 Global Constant
In the perfect system a global constant would arise across all races where thestandard deviation between sailboats corrected finish times would be as close tozero as possible, that is all sailboats should finish at about the same time. Inthe web application the global constant is calculated by averaging the numberof seconds behind first place over all races. The average for each boat’s averagecould be used, but many boats have been in few races, so a few boats thathave not been in many races and have an extremely high value could skew theoverall average. The average speed could also be used, but distance informationis not present in all races. If the scoring was done based on distance, then itcan be derived, but some clubs only score based on time not distance. However,no system is perfect, but handicaps are designed to equalize all boats, so thevariance should be minimized.
The main benefit of the global constant is that the effect of changes can becalculated. For instance, if a boat is identified as an outlier, its handicap can becorrected and all of the results recalculated in the database. If the new globalconstant is lower after the recalculations, then changing the boats handicap hada positive effect.
4.5 Web Application
Finally, to tie everything together a web application was developed in MicrosoftVisual Web Developer Express using the c# language. The current web appli-cation consists of 82 source files ranging in size from only a few lines to over3400 lines for the main web service. The web structure was designed so that amember or administrator did not have to browse through a web of links to beable to perform a certain task. Almost all the necessary tasks can be reachedfrom the main homepage and link back to the homepage so very little navigatingis needed.
A use case diagram can be seen in appendix C. Most of the use cases dealwith managing data. Things such as adding boats and editing race results.
Along with managing data, the web application provides several tools forhandicappers. First, the web application calculates and displays statistics forhandicappers. The simplest are just counts of the number of members, clubs,boats, boat classes, races, and results. More complex statistics include the globalconstant and the linear skill function, both of which were described in a priorsection. Also, the average global constant is displayed, which is the average ofeach boat’s average. A unique statistic compiled by the national organizationis the PHRF minimum, maximum, and average. This helps show if a boat’scurrent rating is within the range of the national average for the same type ofboat.
18
In addition to displaying simple statistics the web application is also able tocreate charts and graphs. Charts and graphs include boats per races, races perboats, PHRF race distribution, PHRF boat distribution, boat class distribution,performance by race, performance by boat, overall boat performance, and boatperformance by year. The boat in class performance and boat in PHRF perfor-mance graphs are helpful because they show where a boat falls within a class orwithin a PHRF rating range. Finally, one major, and very useful, feature is theability to compare boats’ race results. On an individual boat’s page is a list ofevery boat it has ever raced against. Selecting a boat from that list will displaya graph of both boats finishing times behind first for every race they were bothin. From this graph it is easy to see if one boat always finishes in front of orbehind another or if they are highly competitive.
One thing the web application does not do, which it was originally intendedto, is perform the actual outlier tests in real time. This was deemed impracticaldue to long run times. However, running the test independently has someadvantages. First, the presentation is kept separate from mining, so there isno need write code to integrate the separate components. Second, the webapplication is able to display the results of any test instantaneously. Finally,since all of the outlier test results are precomputed and stored in the database,the web application is able to use polling or voting techniques. The theory beingthat the more tests that predict that a boat is an outlier the more likely it isone. A future step would be to add weighting to the polling, so if one algorithmis deemed more accurate than another it is given a higher weight, or more votes.
4.5.1 Data Visualization
The primary tool used to visualize the data was ZedGraph[7], an open sourcecharting class library. ZedGraphs compiled library was call directly from theweb application to produce, on the fly, graphs and charts. Also, to aide invisualization, a relatively new technology to web applications called Ajax[13]was used. The basic concept is to load only the parts of the page that needupdated. Since the entire page is not reloaded, the user benefits by having amore persistent interface that uses less bandwidth. Also, server load is decreasedbecause complex calculations, like creating a graph, do not need to be performedon every page update.
4.5.2 Security
As with any internet based application security is a major concern. Outlinedhere are the security steps taken to help protect the application and its users.Input validation is probably one of the most crucial aspects of security. If yourinput is validated then you have mitigated a very large number of attacks fromcross side scripting to denial of service. To help with the validation of input allthe data from the user is put into objects prior to it being used for any purpose.Inside the objects the data must pass a validation in order to be saved otherwiseit is discarded and the objects corresponding validity flag is set to false. This
19

way, if code somewhere forgets to check if the object is valid before using it,then the invalid data is simply not there to cause any problems.
The passwords are hashed using a 160 bit SHA1 algorithm prior to beingstored in the database. A hashing algorithm is one way in that you can make ahash from a password, but if the user constructs their password effectively it isalmost impossible to derive the password from the hash. This allows the appli-cation to validate passwords without actually knowing them so if the databaseis compromised no passwords will be revealed. One drawback of this is that youcan not send the user their password via email if they have forgotten it. Thesolution to this is to email the user a reset link enabling them to input a newpassword.
To avoid sending the password back and forth once the user is authenticatedthey are given a token. The token contains encrypted information that helpsthe system validate the user. Every method in the application deemed sensitiverequires a valid token in order to operate. Tokens are encrypted with the secureDES algorithm and contain time information so that a token will expire aftera certain amount of time and also user information such as their IP so a tokencannot be used from different addresses. Also, the token is checked against theone the user was issued to make sure it has not been tampered with. The reasonfor implementing our own system is to create more open and simple standards.If Microsoft technologies were used it is unclear whether they could be used onall platforms.
4.5.3 Web Services
Web Services provide a way for just about any application, no matter whatlanguage it was written in, to access the methods on the server. Using webservice interfaces requires the implementation of additional security measures,but allows other applications to manipulate the database. In ASP.Net webservices are implemented by simply inheriting the web services class and definingthe public methods as web services. No additional programming was needed.
5 Results
After countless hours of running tests in Rapidminer, the top results were col-lected and are reported here. Even though numerous settings were tried, it isnear impossible to iterate through every possible combination, so there mayexist configurations that yield better results. To see if the results are signifi-cant, they can be compared to random chance. Statistics predict that randomlyguessing should yield about 8.6% of the outliers. Any percentage significantlyabove this is highly unlikely to be due to random chance. However, after run-ning numerous outlier tests with countless variations a common accuracy of 14%emerged, even for some tests that were expected to not perform well. So, tomake sure there was not a miss calculation and the actual accuracy of guessingwas 8.6%, a test was devised to repeatedly make guesses and score them. The
20

test, whose code can be seen in appendix D, made the same number of guessesas there were actual outliers for each test so the precision and recall would bethe same. After a thousand iterations the average accuracy turned out to be8.4%, which is very close to the calculated value. A distribution of the accuracyof the thousand tests can be seen in appendix B figure 14.
As previously mentioned, skill detection is a very important aspect in outlierdetection. Every algorithm was executed on the data both before and after skilldetection. What emerged were clear patterns that skill was a factor and evidencethat the skill detection algorithm was working, as can be seen in Figure 6.The chart shows that before skill detection the distance based cluster analysisalgorithm found the boats that either performed very well or very poorly asoutliers. Performance is charted on the X axis with the larger numbers havingworse performance. The Y axis is the boat’s rating and is just used to spreadthe data out, as the distribution is fairly uniform. The boat ID could be usedinstead, but that would make the Y axis too large, as one line would be needfor each boat. If performance is a factor, vertical patterns will be seen, as in thefigure. After skill detection no clear patterns can be seen, showing that the skilldetection algorithm was effective at reducing the effect of skill. An extensivecollection of charts for every algorithm can be seen in appendix B.
One of the first, and best performing, algorithms in Rapidminer was LOF.The results are presented in Table 1 in the standard precision recall format.After the skill detection algorithm was applied all of the LOF’s output valueschanged, however large values remained large and small values small, so therewas not much change in the order and thus no change in the results.
Outlier Test Results Before and After Skill DetectionOutlier Not Outlier Precision
Predicted Outlier 13 52 20%Predicted Not 42 532 92.68293%
Recall 23.63636% 91.09589%
Table 1: Local Outlier Factor Results
Like the LOF algorithm, the distance based cluster analysis algorithm hadlittle change in accuracy before and after skill detection, though the actualoutliers found was not exactly the same. The results can be seen in Table 2.
Outlier Test Results Before and After Skill DetectionOutlier Not Outlier Precision
Predicted Outlier 8 52 13.33333%Predicted Not 47 532 91.88255%
Recall 14.54545% 91.09589%
Table 2: Distance Based Cluster Analysis Results
The SVM test results, as seen in table 3, seem good at first, but the output
21

(a) Distance Based Before
(b) Distance Based After
Figure 6: Effect of performance before and after skill detection
of the algorithm was poor. The predictions either contained too many or toofew outliers. In the end, too many outlier predictions yielded better results.So although the algorithm found 25% of the outliers, its precision was onlyabout as good as the distance based cluster analysis. After the skill detectionalgorithm was applied to the data, the SVM algorithm predicted far too manyoutliers to be useful. Given ample time to fine tune the algorithm’s settingsthese shortcomings could potentially be overcome, as the SVM outlier detectionwas expected to be one of the best for this type of data.
Of particular note, the SVM outlier detection algorithm was the only onethat was able to run on the full fourteen thousand plus dataset, but the resultswere very poor. Before skill detection it was only able to find 9% of the outlierswith about the same precision. After skill detection it was only able to find 2%of the outliers. To try to help to algorithm, extra attributes were added, butthat only decreased the performance further. Overall, the SVM outlier detectionperformed much better on the aggregated dataset.
The only algorithm to show a significant change after skill detection was thedensity base cluster analysis. During the course of experiments it was found that
22

Outlier Test Results Before Skill DetectionOutlier Not Outlier Precision
Predicted Outlier 14 85 14.14141%Predicted Not 41 499 92.40741%
Recall 25.45455% 85.44521%
Table 3: Support Vector Machine One Class Analysis Results
removing the BoatType attribute, which was the only non numeric, increasedthe performance significantly. The results presented here, in Table 4, are theones derived from the same set of data used for the other algorithms, in orderto make a fair comparison. The other algorithms performed the same with orwithout this attribute.
Outlier Test Results Before Skill DetectionOutlier Not Outlier Precision
Predicted Outlier 2 66 2.941176%Predicted Not 53 518 90.71804%
Recall 3.636364% 88.69863%Outlier Test Results After Skill Detection
Outlier Not Outlier PrecisionPredicted Outlier 9 53 14.51613%
Predicted Not 46 531 92.02773%Recall 16.36364% 90.92466%
Table 4: Density Based Cluster Analysis Results
Even though the custom algorithm was designed with the exact problem inmind, it is still unbiased. That is, it had no direct knowledge of the informa-tion from which the list of outliers was based, that being the ratings and theirchanges. The algorithm only looked at corrected times not the ratings. Keepingthat fact in mind, the results presented below are very good, especially whencompared to the generic algorithms.
As stated in the section describing the custom algorithm, several methods ofnormalization were tried. However, after normalization the accuracy dropped to18% in the best case. So the results presented here are from the unnormalizedresults. It can be theorized that boats that have more data are more likely tohave been identified as outliers and thus be on the list. Similarly, the unnormal-ized score has a better chance of being higher when there is more data for a boat,so the two have a better chance to be correlated. The normalized scores maybe good at finding previously undetected outliers, but that is difficult to test.In other matters, skill detection only changed the results by one boat, thoughthe order of boats was changed due to scores being different. The results canbe seen in Table 5.The results after skill detection are not presented as they areessentially the same.
23

Outlier Test ResultsOutlier Not Outlier Precision
Predicted Outlier 24 39 38.09524%Predicted Not 31 545 94.61806%
Recall 43.63636% 93.32191%
Table 5: Custom Race Comparison Algorithm Results
Finally, the expert generated list of outliers was used to score the top per-forming algorithms. To show the importance of the amount of data, the numberof races is listed next to each boat’s name in Table 6. It can be seen that themore races a boat has been in, or in other words the more data, the more likelyit will be detected as an outlier. Each column represents a specific test, whetherthat boat passes the test, and a ranking, if available. Even with limited datain the database, all of the algorithms performed well in detecting the expert se-lected outliers. In fact, the custom algorithm was able to find four out of seven.The odds of which are similar to drawing seven playing cards from a deck andgetting four aces. The percentage of selections made is about the same, but thepercentage of outliers is much less than the percentage of aces in a deck, so itis not an exact comparison.
Expert Selected BoatsBoat Name(races) Comp(rank) LOF(rank) SVM DistMiss Conduct(228) 110(1) 3.92(2) Yes YesKoosah(212) 102(4) 0.51(51) Yes NoFlasher(78) 73(31) 0.17(No) No NoFjord(83) 68(35) 0.38(61) Yes NoUFO(28) 45(No) 0.1(No) No NoAquarius(41) 39(No) 0.16(No) Yes NoTime Warp(10) 4(No) 0.12(No) No No
Accuracy 57% 43% 57% 14%
Table 6: Expert Analysis Results
6 Discussion
In the course of this project Rapidminer released several major bug fixes. Exper-iments done in the very beginning produced some very interesting results thatcouldn’t be reproduced exactly with later versions. Specifically, the distancebased cluster analysis algorithm initially predicted almost all of the outlierswith a very poor performance metric. However, the latest version with thesame data and settings predicts outliers with both very poor and very good
24

performance metrics, but no where in between. This still shows that perfor-mance is the main factor before skill detection is applied and is actually more inline with what one would expect, the best and worst performers being detectedas outliers.
The second set of data, with the skill detection, showed some markedlydifferent results, even when running on the original data which was present,but initially ignored. The only observed difference was that the original datasetperformance metric was defined as integer, whereas all numeric attributes weredefined as real numbers in the second dataset. Otherwise, all the settings werethe same.
One of the primary problems with the data is its variable nature over time.Though not necessarily time series data, as one race can be compared to an-other independent of when they occurred, some things such as skill theoreticallychange over time. In fact, the main reasoning for making skill detection a func-tion of time was to try to factor out the effects of time and make the data morestatic. Also, some races, especially long ones have very large courses that allowboats to take dramatically different routes. Even though two boats taking com-pletely different routes makes them seem incomparable, this could be considereda factor of skill. Boats with a higher skill level will take the better route. Sofactoring out skill may help mitigate this problem.
7 Future Work
Probably one of the best ways to improve upon this project would be the col-lection of more data. Clear trends were seen where outlier boats with moredata than others were more likely to be detected, so it can be inferred thatmore data will help with the detection of previously unknown outliers. Also, forskill detection, many boats had nothing to compare against, so additional datawould improve this area of the project too. In addition to more data, it may bebeneficial to use more data transformations such as weighting and normalizing.
In the very begging just about everything, such as scoring and inputtingresults, was done by hand in excel, but as the project progressed tasks becamemore automated as can be seen in appendix Dsource code 4 which loads resultsfrom a text file and adds them to the database the runs a stored procedure toscore them. However, the test information still needs to be added manually andthe proper id number substituted. Ideally, the whole process, from downloadingthe dataset to uploading the result, would be completely automated, runningon a defined schedule.
All of the planned data visualization uses cases were completed, howeverthere are still some data manipulation use cases that need to be finished. Thoughnot necessarily academic, they are essential to the functioning of the web ap-plication. Completing the web application is a simple task, it will just taketime.
Since this project ’s main goal is to find improper handicaps, a model basedoutlier detection methodology could be employed. The simplest methodology
25
would be to use any algorithm that creates a model of the data. Once a modelhas been generated, it can be used on the same data to predict attributes, mostnotably the handicap. The further the actual value is away from the predictedone the more likely it is an outlier.
Even though more than one method was used to test algorithm results, thereare still addition ways in which they can be tested. One such way would be toinsert bad boats into the database or intentionally make boats already thereoutliers. These fake outliers could then be used to test the different algorithmsaccuracies. Another additional testing method could be to create an entirelysynthetic set of data. In this way, it would be precisely known which boats areoutliers and which are not. In addition to additional tests, Gao and Tan[12]proposed some interesting methods for converting outlier algorithm scores intoprobabilities that would be very useful for this project.
8 Conclusion
Overall, the project proved to be very challenging. The data preprocessingconsumed a large amount of time in the beginning and put the project behindschedule. Also, a lot of time was spent on skill detection because it is important,but at present it has not helped in outlier detection. Although the skill detectionalgorithm did significantly change the data, it did not significantly improve mostof the algorithms results. At the same time though, it did not make any of theresults significantly worse and one algorithm, the density based, was actuallyimproved enough to put it on par with the others.
The main difficulty in the project was the complexity of the data. Althoughthe data is not exactly time series, some variables, such as skill, do change overtime. Also, there are many unknown variables that affect each race. Some ofthose variables, such as wind speed and direction, can actually vary greatly overthe course of a race.
In the end, the results are not fantastic, but very encouraging. Two of thegeneric algorithms, LOF and density based clustering with skill detection, wereable to perform far enough above random chance to be considered significant.The custom algorithm was able to further improve on the ability to detectoutliers by almost a factor of 2. Overall, significant progress has been made.Even though all of the project use cases have not been completed, a usable webapplication has been developed that allows handicappers to view the results ofoutlier tests and visually inspect the data in the database. These tools willgreatly improve the handicappers ability to detect and correct improperly ratedboats.
References
[1] Handicap information and regulations, 2006. This is an electronic docu-ment. Date of publication: [unavailable]. Date retrieved: May 26, 2007.
26

Date last modified: April 11, 2006.
[2] Aamodt, A., and Plaza, E. Case-based reasoning: Foundational issues,methodological variations, and system approaches. AI Communications 7,1 (1994), 39–59.
[3] Adriaans, P. From knowledge-based to skill-based systems: Sailing as amachine learning challenge. In 7th European Conference on Principles andPractice of Knowledge Discovery in Databases (September 2003), Springer,pp. 1–8.
[4] Ansfield, P. J. Analysis tools imputed handicaps and their graphicdisplay, 2007. This is an electronic document. Date of publication: July 12,2007. Date retrieved: October 28, 2007. Date last modified: [unavailable].
[5] Breunig, M. M., Kriegel, H.-P., Ng, R. T., and Sander, J. Lof:identifying density-based local outliers. SIGMOD Rec. 29, 2 (2000), 93–104.
[6] Burges, C. J. A tutorial on support vector machines for pattern recog-nition. Data Mining and Knowledge Discovery 2, 2 (June 1998), 121–167.
[7] Champion, J. Zedgraph, 2005. This is an electronic document. Date ofpublication: [unavailable]. Date retrieved:June 01, 2008. Date last modified:November 29, 2007.
[8] Chang, C.-C., and Lin, C.-J. LIBSVM: a libraryfor support vector machines, 2001. Software available athttp://www.csie.ntu.edu.tw/c̃jlin/libsvm.
[9] Cort, A., and Stearns, R. Getting Started in Sailboat Racing. TheMcGraw-Hill Companies, Blacklick, OH, USA, 2005, ch. 12, pp. 184–188.
[10] Drucker, H., Burges, C. J. C., Kaufman, L., Smola, A., and Vap-nik, V. Support vector regression machines. In Advances in Neural In-formation Processing Systems (Cambridge, MA, 1997), M. C. Mozer, M. I.Jordan, and T. Petsche, Eds., vol. 9, MIT Press, pp. 155–161.
[11] Edelman, D. Adapting support vector machine methods for horseraceodds prediction. Annals of Operations Research 151, 1 (April 2007), 325–336.
[12] Gao, J., and Tan, P.-N. Converting output scores from outlier detec-tion algorithms into probability estimates. In Proceedings of the IEEEInternational Conference on Data Mining, ICDM (Piscataway, NJ, USA,December 2006), IEEE, pp. 212–221.
[13] Garrett, J. J. Ajax: A new approach to web applications, 2005. Thisis an electronic document. Date of publication: February 18, 2005. Dateretrieved:June 01, 2008. Date last modified: [unavailable].
27
[14] Graves, T., Reese, C. S., and Fitzgerald, M. Hierarchical modelsfor permutations: Analysis of auto racing results. Journal of the AmericanStatistical Association 98, 462 (June 2003), 282–291.
[15] Hand, D., Mannila, H., and Smyth, P. Principles of Data Mining.The MIT Press, Cambridge, MA, USA, 2001.
[16] Hodge, V. J., and Austin, J. A survey of outlier detection methodolo-gies. Artificial Intelligence Review 22, 2 (October 2004), 85–126.
[17] Jonsson, G. K., Anguera, M. T., Blanco-Villaseor, A., Losada,J. L., Hernandez-Mendo, A., Arda, T., Camerino, O., andCastellano, J. Hidden patterns of play interaction in soccer using sof-coder. Behavior Research Methods 38, 3 (August 2006), 372–381.
[18] Jordaan, E. M., and Smits, G. F. Robust outlier detection using svmregression. In Proceedings of the 2004 IEEE International Joint Confer-ence on Neural Networks (Piscataway, NJ, USA, July 2004), vol. 3, IEEE,pp. 2017–2022.
[19] Kantardzic, M. Data Mining: Concepts, Models, Methods, and Algo-rithms. John Wiley and Sons, Inc., New York, NY, USA, 2003.
[20] Knorr, E. M., and Ng, R. T. Algorithms for mining distance-basedoutliers in large datasets. In VLDB ’98: Proceedings of the 24rd Interna-tional Conference on Very Large Data Bases (San Francisco, CA, USA,1998), Morgan Kaufmann Publishers Inc., pp. 392–403.
[21] Knorr, E. M., Ng, R. T., and Tucakov, V. Distance-based outliers:algorithms and applications. The VLDB Journal 8, 3-4 (2000), 237–253.
[22] Larose, D. T. Data Mining Methods and Models. John Wiley and Sons,Inc., Hoboken, NJ, USA, 2006.
[23] Mierswa, I., Wurst, M., Klinkenberg, R., Scholz, M., and Euler,T. Yale: rapid prototyping for complex data mining tasks. In Proceedings ofthe 12th ACM SIGKDD International Conference on Knowledge Discoveryand Data Mining (New York, NY, USA, 2006), ACM Press, pp. 935–940.
[24] Philpott, A. B., Henderson, S. G., and Teirney, D. A simulationmodel for predicting yacht match race outcomes. Operations Research 52,1 (Jan.-Feb. 2004), 1–16.
[25] Ramaswamy, S., Rastogi, R., and Shim, K. Efficient algorithms formining outliers from large data sets. SIGMOD Rec. 29, 2 (2000), 427–438.
[26] Watson, I., and Marir, F. Case-based reasoning: A review. KnowledgeEngineering Review 9, 4 (December 1994), 327–354.
28

[27] Wu, X., and Srihari, R. Incorporating prior knowledge with weightedmargin support vector machines. In KDD ’04: Proceedings of the tenthACM SIGKDD international conference on Knowledge discovery and datamining (New York, NY, USA, 2004), ACM Press, pp. 326–333.
29

A Data Description
A.1 Data Dictionary
30
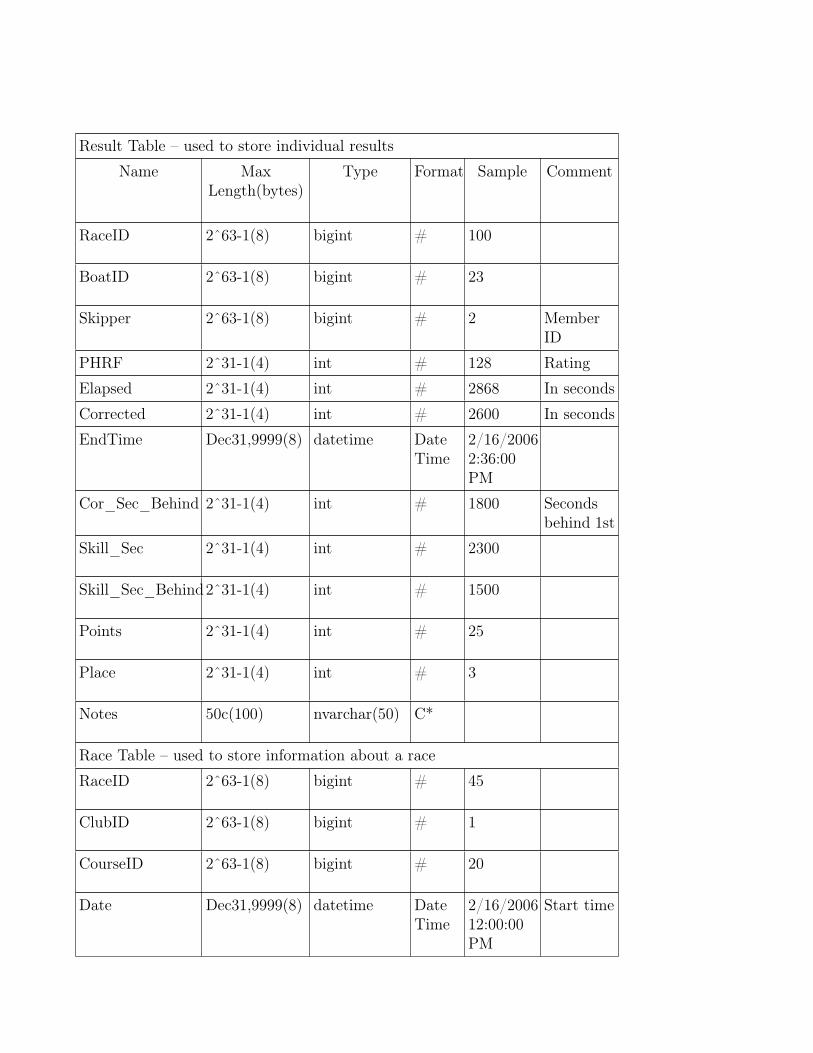
Result Table – used to store individual results
Name MaxLength(bytes)
Type Format Sample Comment
RaceID 2ˆ63-1(8) bigint # 100
BoatID 2ˆ63-1(8) bigint # 23
Skipper 2ˆ63-1(8) bigint # 2 MemberID
PHRF 2ˆ31-1(4) int # 128 Rating
Elapsed 2ˆ31-1(4) int # 2868 In seconds
Corrected 2ˆ31-1(4) int # 2600 In seconds
EndTime Dec31,9999(8) datetime DateTime
2/16/20062:36:00PM
Cor_Sec_Behind 2ˆ31-1(4) int # 1800 Secondsbehind 1st
Skill_Sec 2ˆ31-1(4) int # 2300
Skill_Sec_Behind2ˆ31-1(4) int # 1500
Points 2ˆ31-1(4) int # 25
Place 2ˆ31-1(4) int # 3
Notes 50c(100) nvarchar(50) C*
Race Table – used to store information about a race
RaceID 2ˆ63-1(8) bigint # 45
ClubID 2ˆ63-1(8) bigint # 1
CourseID 2ˆ63-1(8) bigint # 20
Date Dec31,9999(8) datetime DateTime
2/16/200612:00:00PM
Start time

Length 1c(1) char(1) L,M,S L Short< 5nm,Medium> 5nm< 10nm,Long >10nm
AvgWindSpeed 32,767(2) smallint # 10 Not used
WindDirection 3c(3) char(3) CCC SSW Not used
Boat Table – Information about individual boats
BoatID 2ˆ63-1(8) bigint # 3
MemberID 2ˆ63-1(8) bigint # 2
ClubID 2ˆ63-1(8) bigint # 1
Name 50c(100) nvarchar(50) C* Speed De-mon
Not Used
HullIDNumber 50c(100) nvarchar(50) C* 134720 Not Used
BoatType 50c(100) nvarchar(50) C* C&C 30
Class 1c(2) nchar(1) C B Not Used,not con-sistentbetweenclubs
SailNumber 50c(100) nvarchar(50) C* 1122 Not Used
BoatDesigner 50c(100) nvarchar(50) C* abc
YearDesigned 32,767(2) smallint # 89
Rigging 50c(100) nvarchar(50) C* Standard
HullSpeed bit 0,1 True
MotorType 32,767(2) smallint # 0
MotorFuel 32,767(2) smallint # 1
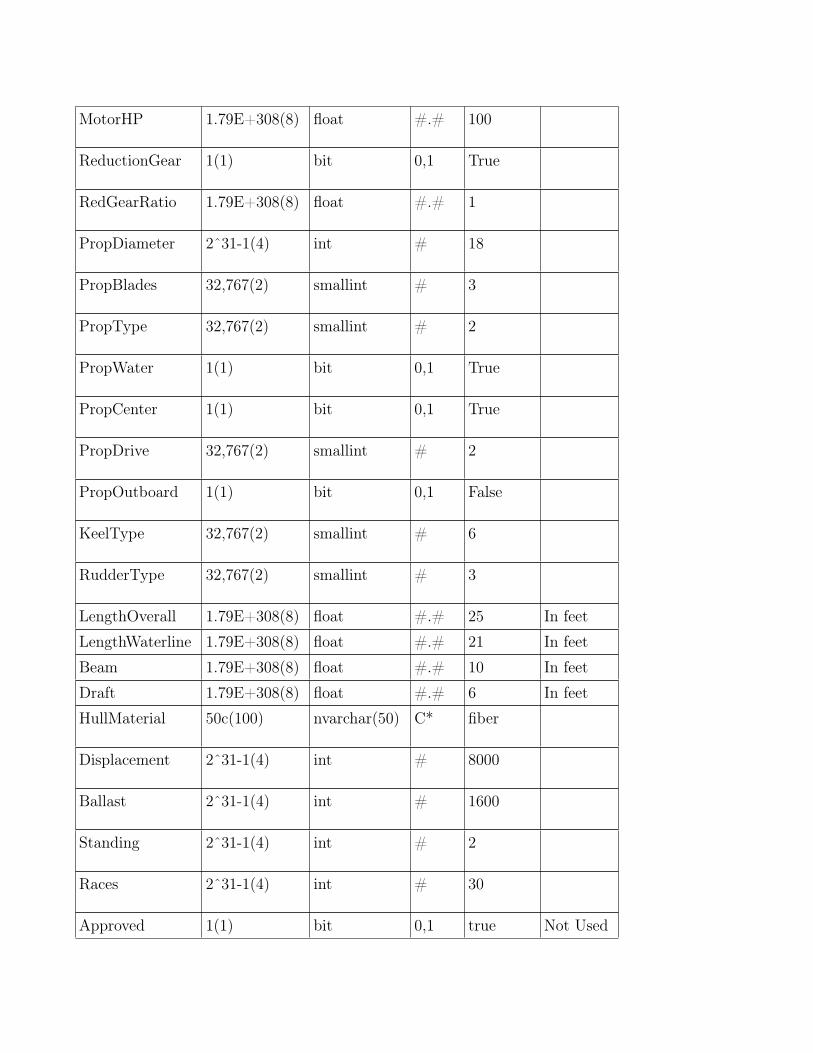
MotorHP 1.79E+308(8) float #.# 100
ReductionGear 1(1) bit 0,1 True
RedGearRatio 1.79E+308(8) float #.# 1
PropDiameter 2ˆ31-1(4) int # 18
PropBlades 32,767(2) smallint # 3
PropType 32,767(2) smallint # 2
PropWater 1(1) bit 0,1 True
PropCenter 1(1) bit 0,1 True
PropDrive 32,767(2) smallint # 2
PropOutboard 1(1) bit 0,1 False
KeelType 32,767(2) smallint # 6
RudderType 32,767(2) smallint # 3
LengthOverall 1.79E+308(8) float #.# 25 In feet
LengthWaterline 1.79E+308(8) float #.# 21 In feet
Beam 1.79E+308(8) float #.# 10 In feet
Draft 1.79E+308(8) float #.# 6 In feet
HullMaterial 50c(100) nvarchar(50) C* fiber
Displacement 2ˆ31-1(4) int # 8000
Ballast 2ˆ31-1(4) int # 1600
Standing 2ˆ31-1(4) int # 2
Races 2ˆ31-1(4) int # 30
Approved 1(1) bit 0,1 true Not Used

Added Dec31,9999(8) datetime DateTime
8/12/200610:41:54PM
Not Used
Alterations 2ˆ31-1c(16+2n)
ntext C* This babyis trickedout
Not Used
StandardBoats Table – This table contains the default information for each boattype and is used to fill in missing information in the Boat Table
ID 2ˆ31-1(4) int # 265
[BOAT TYPE] 255c(510) nvarchar(255) C* MORG27MK
RTG 1.79E+308(8) float #.# 195
T 255c(510) nvarchar(255) C* NULL
CODE 255c(510) nvarchar(255) C* 5555M5
CF 255c(510) nvarchar(255) C* S
DESIGNER 255c(510) nvarchar(255) C* Morgan
YR 1.79E+308(8) float #.# 71
RIG 255c(510) nvarchar(255) C* MHS
PRP 255c(510) nvarchar(255) C* IBE
KL 255c(510) nvarchar(255) C* FNM
RDR 255c(510) nvarchar(255) C* SSP
I 1.79E+308(8) float #.# 37
ISP 1.79E+308(8) float #.# 37
J 1.79E+308(8) float #.# 11.75
JC 1.79E+308(8) float #.# 11.75
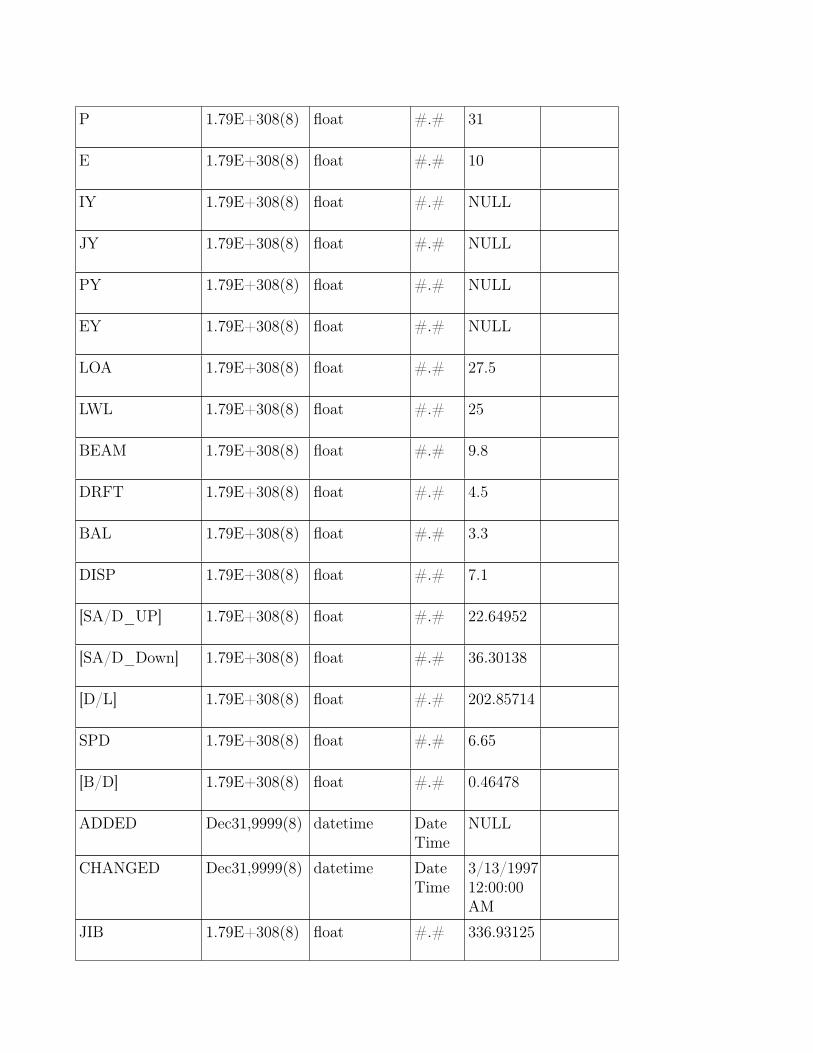
P 1.79E+308(8) float #.# 31
E 1.79E+308(8) float #.# 10
IY 1.79E+308(8) float #.# NULL
JY 1.79E+308(8) float #.# NULL
PY 1.79E+308(8) float #.# NULL
EY 1.79E+308(8) float #.# NULL
LOA 1.79E+308(8) float #.# 27.5
LWL 1.79E+308(8) float #.# 25
BEAM 1.79E+308(8) float #.# 9.8
DRFT 1.79E+308(8) float #.# 4.5
BAL 1.79E+308(8) float #.# 3.3
DISP 1.79E+308(8) float #.# 7.1
[SA/D_UP] 1.79E+308(8) float #.# 22.64952
[SA/D_Down] 1.79E+308(8) float #.# 36.30138
[D/L] 1.79E+308(8) float #.# 202.85714
SPD 1.79E+308(8) float #.# 6.65
[B/D] 1.79E+308(8) float #.# 0.46478
ADDED Dec31,9999(8) datetime DateTime
NULL
CHANGED Dec31,9999(8) datetime DateTime
3/13/199712:00:00AM
JIB 1.79E+308(8) float #.# 336.93125

SPIN 1.79E+308(8) float #.# 652.125
MAIN 1.79E+308(8) float #.# 186
REMARKS 100c(200) nvarchar(100) C* IB Ver-sion

Descriptive Data Summarization The following charts and graphs summarize the project dataset.
Boat Participation
0
10
20
30
40
50
60
70
80
90
1 2 3 4 5 6 7 8 9 10 11 12 13 14 15 16 17 18 19 20 21-50
51-100
>100
Number of Races
Nu
mb
er o
f B
oat
s
The chart above shows that a lot of boats have participated in few races. For instance, 77 boats have only participated in 1 race. The results from these boats may not be that useful, and in fact, looking at the data shows several of them have incredibly high finish times. As a result, it may be a good idea to filter out boats who have participated in fewer than a certain threshold of races. However, experimentation is needed to see if this has a positive effect and, if so, what the best threshold is.
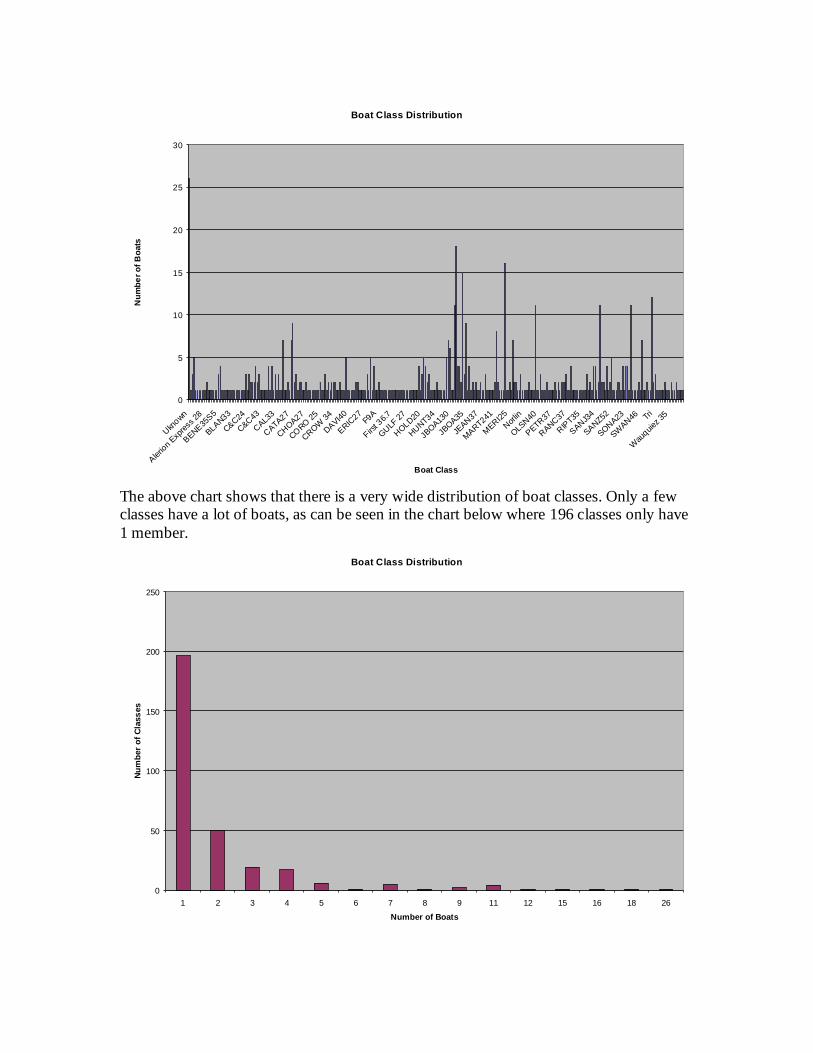
Boat Class Distribution
0
5
10
15
20
25
30
Uknown
Alerion E
xpres
s 28
BENE35S5
BLAN33
C&C24
C&C43
CAL33
CATA27
CHOA27
CORO 25
CROW 34
DAVI40
ERIC27
F9A
First 3
6.7
GULF 27
HOLD20
HUNT34
JBOA13
0
JBOA35
JEAN37
MART241
MERI25Norl
in
OLSN40
PETR37
RANC37
RIPT35
SANJ34
SANZ52
SONA23
SWAN46 Tri
Wau
quiez 3
5
Boat Class
Nu
mb
er
of
Bo
ats
The above chart shows that there is a very wide distribution of boat classes. Only a few classes have a lot of boats, as can be seen in the chart below where 196 classes only have 1 member.
Boat Class Distribution
0
50
100
150
200
250
1 2 3 4 5 6 7 8 9 11 12 15 16 18 26
Number of Boats
Nu
mb
er o
f C
lass
es

PHRF Handicap Distribution
0
100
200
300
400
500
600
700
-105 -42 -10 12 30 46 57 70 81 89 96
106
113
120
128
135
142
149
156
163
170
177
184 191 198 208
215
224
231
238
245
253
263
293
PHRF
Occ
ura
nc
es
Another interesting chart above shows that the handicap distribution is very wide. Note that this is charted against races not individual boats which is actually similar. Below is a chart showing the number of boats per race. In the extremes one race had 1 boat and one race had 52 boats. The highest was 81 races with 7 boats participating.
Number of Boats Per Race
0
10
20
30
40
50
60
70
80
90
1 2 3 4 5 6 7 8 9 10 11 12 13 14 15 16 17 18 19 20 21 22 23 24 25 26 27 28 29 30 31 32 33 35 40 42 43 44 50 52
Number of Boats
Nu
mb
er o
f R
aces
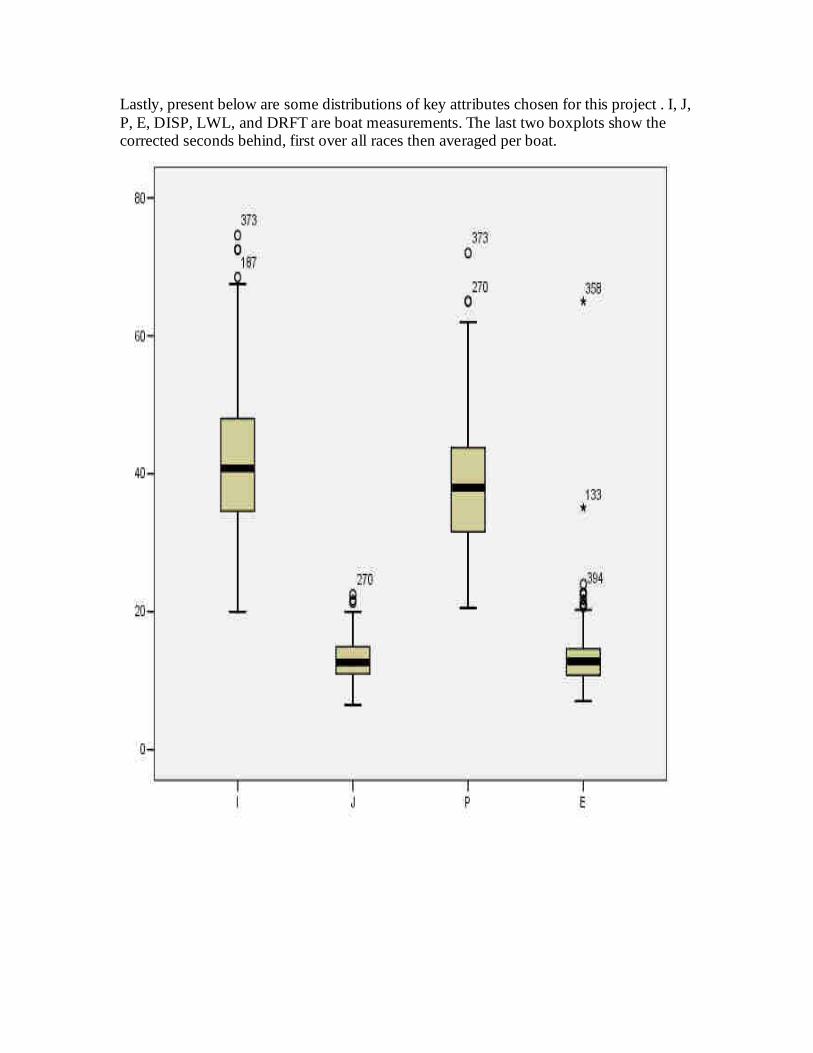
Lastly, present below are some distributions of key attributes chosen for this project . I, J, P, E, DISP, LWL, and DRFT are boat measurements. The last two boxplots show the corrected seconds behind, first over all races then averaged per boat.


B Charts and Graphs
43
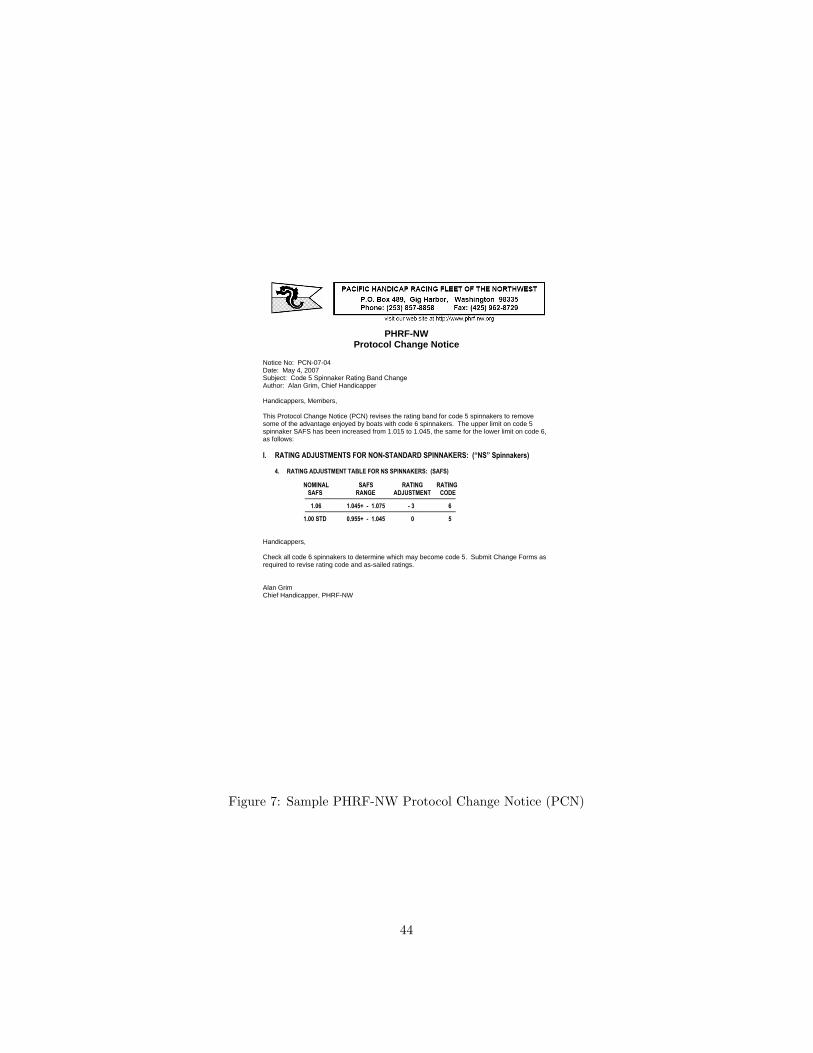
PHRF-NW Protocol Change Notice
Notice No: PCN-07-04 Date: May 4, 2007 Subject: Code 5 Spinnaker Rating Band Change Author: Alan Grim, Chief Handicapper Handicappers, Members, This Protocol Change Notice (PCN) revises the rating band for code 5 spinnakers to remove some of the advantage enjoyed by boats with code 6 spinnakers. The upper limit on code 5 spinnaker SAFS has been increased from 1.015 to 1.045, the same for the lower limit on code 6, as follows: I. RATING ADJUSTMENTS FOR NON-STANDARD SPINNAKERS: (“NS” Spinnakers) 4. RATING ADJUSTMENT TABLE FOR NS SPINNAKERS: (SAFS) NOMINAL SAFS RATING RATING
SAFS RANGE ADJUSTMENT CODE ────────────────────────────────
1.06 1.045+ - 1.075 - 3 6 ──────────────────────────────── 1.00 STD 0.955+ - 1.045 0 5 Handicappers, Check all code 6 spinnakers to determine which may become code 5. Submit Change Forms as required to revise rating code and as-sailed ratings. Alan Grim Chief Handicapper, PHRF-NW
Figure 7: Sample PHRF-NW Protocol Change Notice (PCN)
44

Figure 8: Sailboat Dimensions
45

C Use Cases
Figure 15 shows the individual stake holders and their associated use cases.
46

(a) Distance Based Cluster Analysis
(b) Density Based Cluster Analysis
Figure 9: Effect of performance before skill detection
47
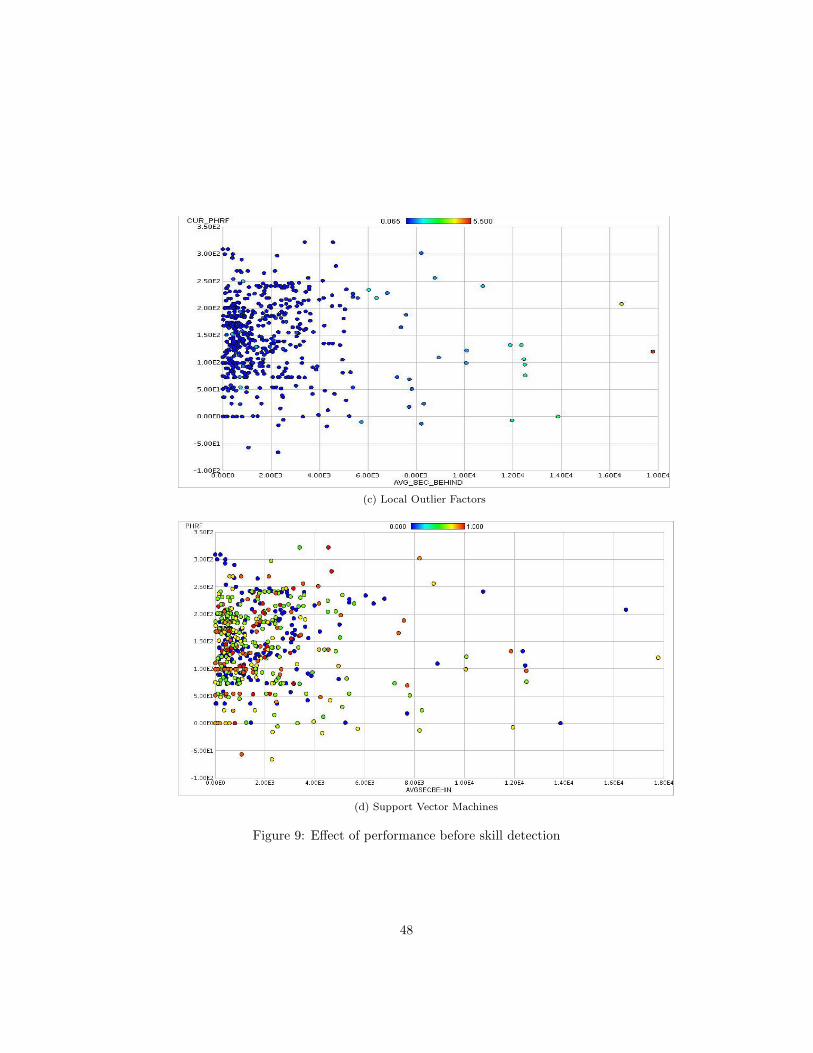
(c) Local Outlier Factors
(d) Support Vector Machines
Figure 9: Effect of performance before skill detection
48

(a) Distance Based Cluster Analysis
(b) Density Based Cluster Analysis
Figure 10: Two dimensional view of data before skill detection
49

(c) Local Outlier Factors
(d) Support Vector Machines
Figure 10: Two dimensional view of data before skill detection
50
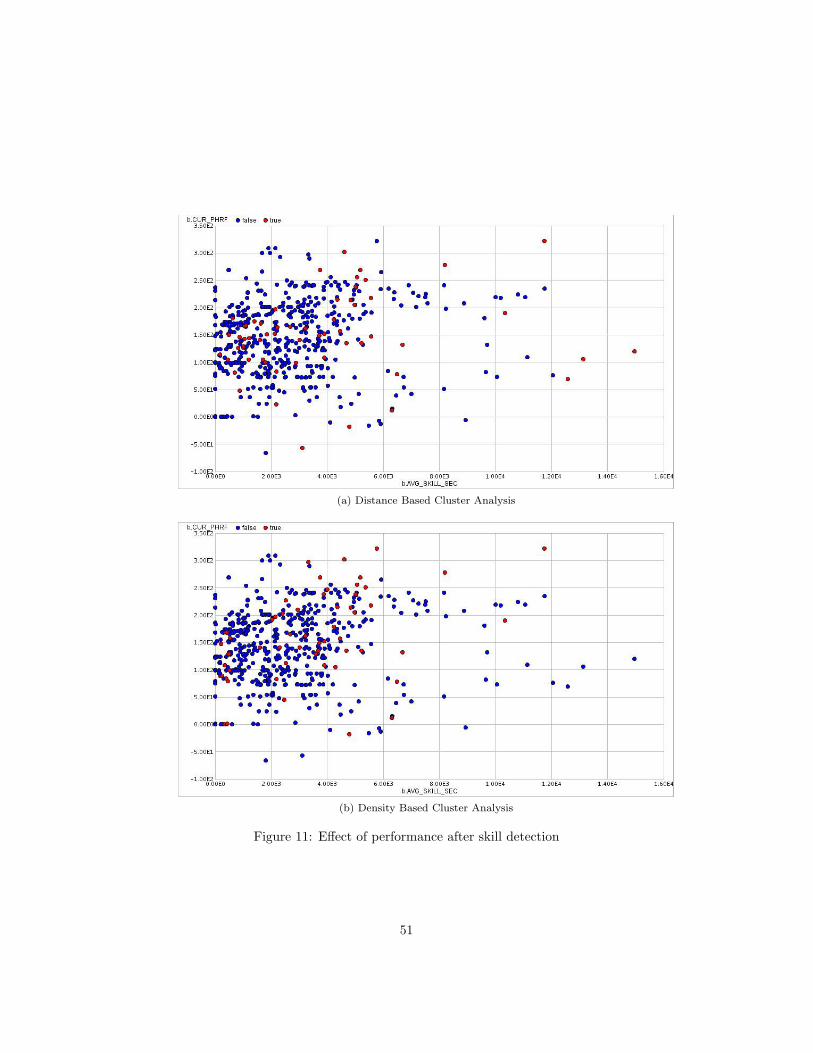
(a) Distance Based Cluster Analysis
(b) Density Based Cluster Analysis
Figure 11: Effect of performance after skill detection
51

(c) Local Outlier Factors
(d) Support Vector Machines
Figure 11: Effect of performance after skill detection
52
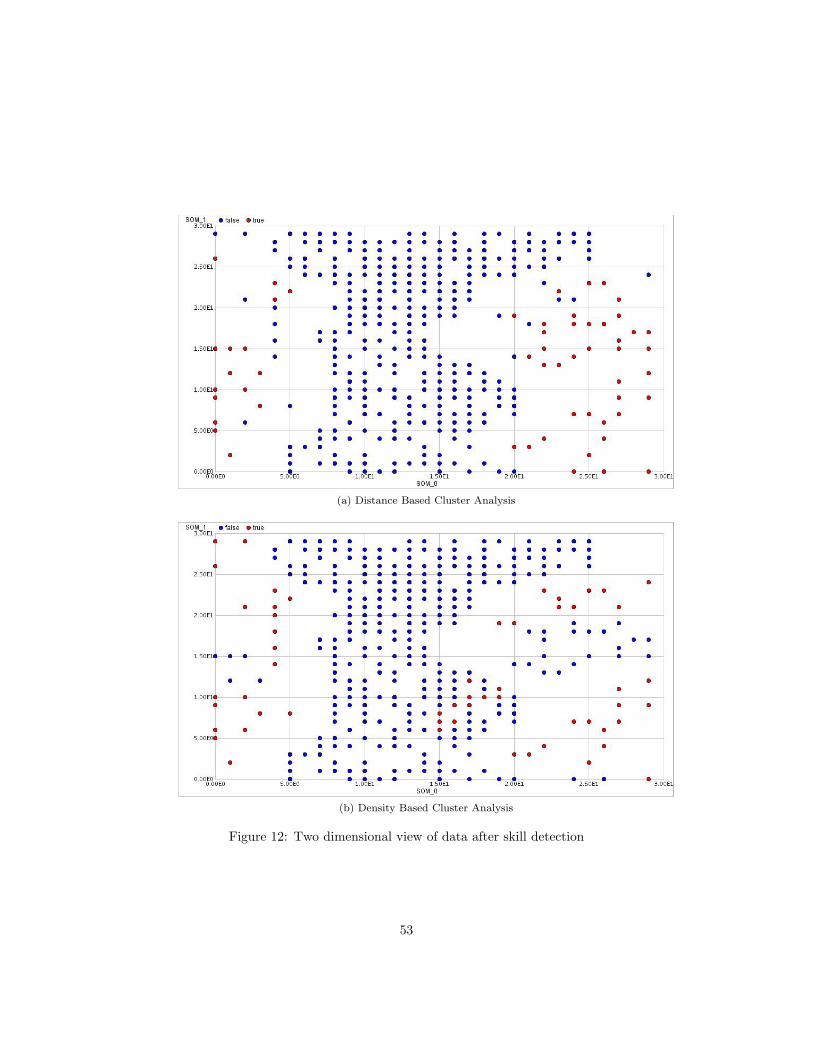
(a) Distance Based Cluster Analysis
(b) Density Based Cluster Analysis
Figure 12: Two dimensional view of data after skill detection
53

(c) Local Outlier Factors
(d) Support Vector Machines
Figure 12: Two dimensional view of data after skill detection
54

0 0.05 0.1 0.15 0.2 0.25 0.3 0.35 0.4 0.45 0.5 0.6 0.7 0.8 0.9 10
20
40
60
80
100
120
140
160
180
Ratio Distribution Uncorrected
Ratio
Coun
t
(a) Before Skill Detection
Figure 13: Custom Algorithm Ratio Distribution
55
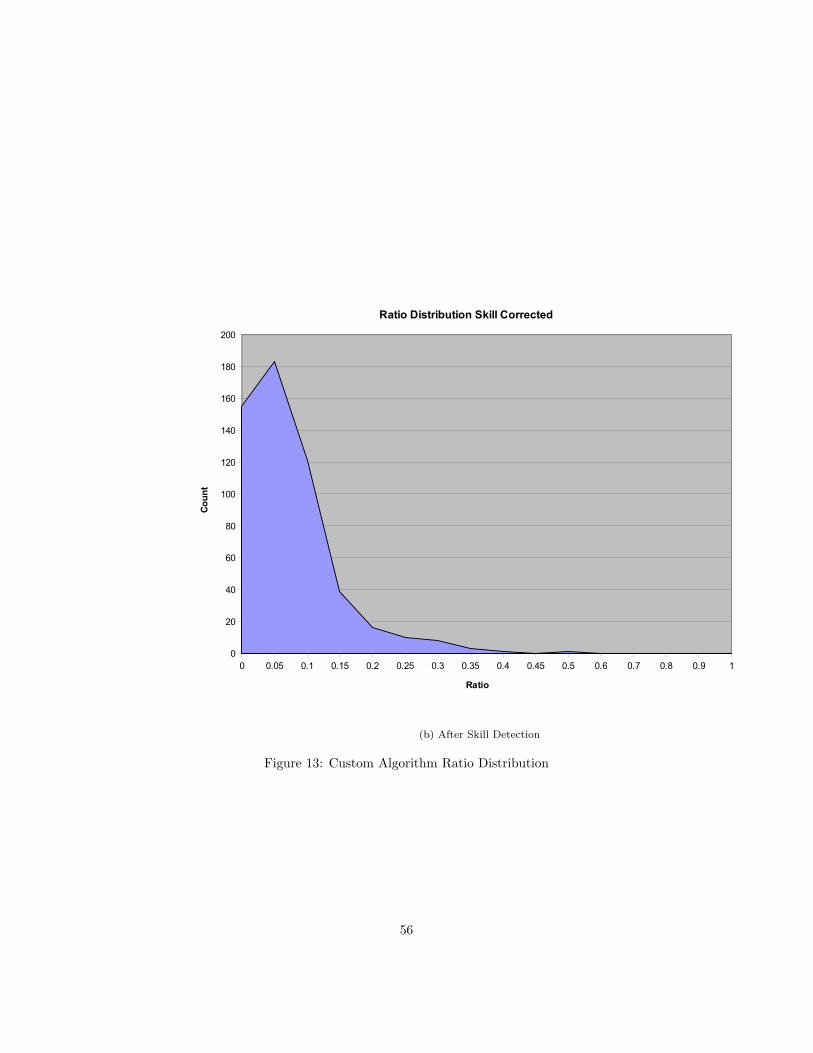
0 0.05 0.1 0.15 0.2 0.25 0.3 0.35 0.4 0.45 0.5 0.6 0.7 0.8 0.9 10
20
40
60
80
100
120
140
160
180
200
Ratio Distribution Skill Corrected
Ratio
Coun
t
(b) After Skill Detection
Figure 13: Custom Algorithm Ratio Distribution
56

0 2 4 6 8 10 12 14 16 18 200
50
100
150
200
250
Random Guessing Distribution (1000 Iterations)
Percentage Accuracy
Coun
t
Figure 14: Random Guessing Accuracy Distribution
57

Administrator
Add Boat
Edit Boat
Add ClubEdit Club
Add Race
Edit Race
Input Race Results
Modify Race Results
Add Member Edit Member
Add Course
Edit Course
Add Marker
Edit Marker
Race AdministratorHandiCapper
Member
Approve Boat
Edit Standard Boats
Add Standard Boat
Edit Member Boat
Create and Edit
Create Create
View Race Results
Join Club
Use Case Diagram
View Error Log
Analyze Boats
Assign User Rights
Figure 15: Project Usecase Diagram
58

The following are the use cases for each individual stake holder.MemberAdd Member - A user can create an account on the system. In addition anyadministrator can create a non-login account for the purposes of storing amembers information.
Edit Member - A user can edit their own information. Also, an administratorcan edit the information of any member they created.
Add Boat - A user can input all the data for their boat and it will be added andlinked to their member account. An administrator can add a boat and link it toany member account they created.
Edit Boat - A user can edit their boats information. An administrator can editthe information of any boat they added.
Join Club - A user can link their member account to one or more clubs in thesystem. An administrator can link a member they added to a club theadministrator belongs to.
View Race Results - A user can view the results of a race or the overall resultsof the races their boats have been in.
Race AdministratorAdd Race - Add a race to the system including which boats will be participating.
Edit Race - Change information about a race or which boats are participating.
Add Course - Make a new course consisting of markers linked together showingall the legs. i.e. A to B to C to A
Edit Course - Edit a courses markers.
Add Marker - Add a new marker to the database.
Edit Marker - Edit a markers information.
Input Race Results - Enter results for a race for which the race administratorbelongs to one of the sponsoring clubs. An administrator can input to any race.
Modify Race Results - Edit the results of a race for which the race administratorsassociated club was a sponsor. An administrator can edit any race.
HandicapperApprove Boat - When a user adds a boat initially its approved flag is set to falseso that its data is not used in analysis. Once the handicapper has gone over the
59

boats information and assigned it a handicap the boat is considered approved.
Edit Member Boat - A handicapper can edit the information of any boatassociated with any of the clubs the handicapper is an administrator. Anadministrator can edit any boat in the database.
Add Standard Boat - Add a new standard boat from which other boats baseratings are derived.
Edit Standard Boats - Edit a standard boats information.
AdministratorAdd Club - Add a new club to the database.
Edit Club - Edit a clubs information including who the administrator ofthe club is.
View Error Log - View system errors that have been logged to the database.
60
D Source Code
Source Code 4 SQL code to import test resultsuse sailwaterDELETE FROM temptBULK INSERT temptFROM ’c:\SRC\soab.csv’WITH(FIELDTERMINATOR = ’,’,ROWTERMINATOR = ’\n’)–coptt is used to hold a blank set of test results–must get proper TestID firstUpdate coptt set TestID=125INSERT INTO TestResult(TestID, BoatID, Passed, Value)SELECT TestID, BoatID, Passed, Value FROM CopttUpdate TestResult SET Value=(SELECT Value From temptWHERE tempt.BoatID=TestResult.BoatIDAND TestResult.TestID=125)WHERE Exists(SELECT Value From temptWHERE tempt.BoatID=TestResult.BoatIDAND TestResult.TestID=125)–Update TestResult set Value=1 Where TestID=125 ANDPassed=1exec scoreTest 125, 0.1exec calcPrecRecall 125, 101
D.1 Rapidminer process files
D.1.1 Main process file
<?xml version="1.0" encoding="windows-1252"?><process version="4.1">
<operator name="Root" class="Process" expanded="yes"><operator name="MemoryCleanUp" class="MemoryCleanUp" breakpoints="after"></operator><operator name="ExampleSource (3)" class="ExampleSource">
<parameter key="attributes" value="Z:\702\RacesAll.aml"/></operator>
61
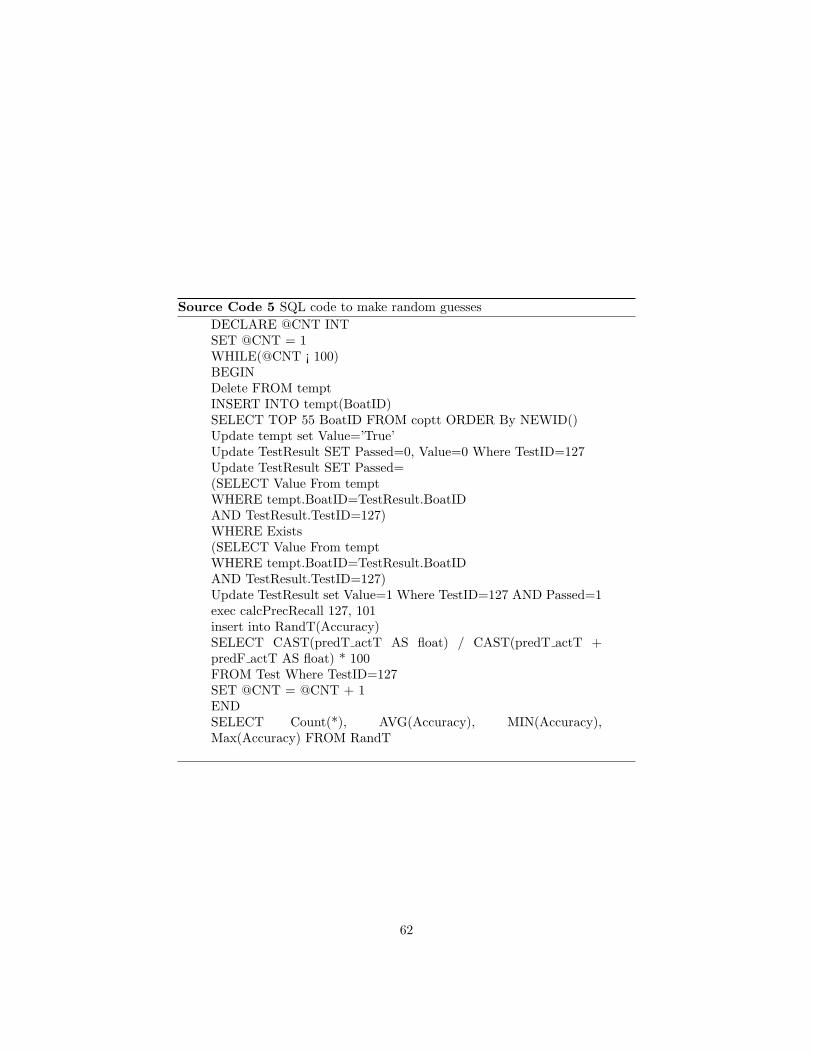
Source Code 5 SQL code to make random guessesDECLARE @CNT INTSET @CNT = 1WHILE(@CNT ¡ 100)BEGINDelete FROM temptINSERT INTO tempt(BoatID)SELECT TOP 55 BoatID FROM coptt ORDER By NEWID()Update tempt set Value=’True’Update TestResult SET Passed=0, Value=0 Where TestID=127Update TestResult SET Passed=(SELECT Value From temptWHERE tempt.BoatID=TestResult.BoatIDAND TestResult.TestID=127)WHERE Exists(SELECT Value From temptWHERE tempt.BoatID=TestResult.BoatIDAND TestResult.TestID=127)Update TestResult set Value=1 Where TestID=127 AND Passed=1exec calcPrecRecall 127, 101insert into RandT(Accuracy)SELECT CAST(predT actT AS float) / CAST(predT actT +predF actT AS float) * 100FROM Test Where TestID=127SET @CNT = @CNT + 1ENDSELECT Count(*), AVG(Accuracy), MIN(Accuracy),Max(Accuracy) FROM RandT
62

<operator name="ExampleSource (2)" class="ExampleSource" activated="no"><parameter key="attributes" value="Z:\702\TCSSS702Boats.aml"/>
</operator><operator name="ExampleSource" class="ExampleSource" activated="no">
<parameter key="attributes" value="Z:\702\BoatSkill.aml"/><parameter key="column_separators" value=",\s*|;\s*|\s+t"/>
</operator><operator name="ExampleFilter" class="ExampleFilter">
<parameter key="condition_class" value="no_missing_attributes"/></operator><operator name="FeatureNameFilter" class="FeatureNameFilter">
<parameter key="skip_features_with_name"value="b.AVG_SKILL_SEC||b.BoatType||r.SKILL_SEC_BEHIND"/>
</operator><operator name="FeatureNameFilter (2)" class="FeatureNameFilter">
<parameter key="skip_features_with_name" value="BoatType"/></operator><operator name="FrequencyDiscretization" class="FrequencyDiscretization"
breakpoints="after" activated="no"><parameter key="number_of_bins" value="100"/>
</operator><operator name="LOFOutlierDetection" class="LOFOutlierDetection"
breakpoints="after" activated="no"><parameter key="minimal_points_upper_bound" value="60"/>
</operator><operator name="SVDReduction" class="SVDReduction" breakpoints="after"
activated="no"><parameter key="keep_example_set" value="true"/>
</operator><operator name="DistanceBasedOutlierDetection"
class="DistanceBasedOutlierDetection"breakpoints="after">
<parameter key="number_of_outliers" value="60"/></operator><operator name="DensityBasedOutlierDetection (2)"
class="DensityBasedOutlierDetection" breakpoints="after"activated="no">
<parameter key="distance" value="0.17"/><parameter key="distance_function" value="cosine distance"/><parameter key="proportion" value="0.95"/>
</operator><operator name="DensityBasedOutlierDetection" class="DensityBasedOutlierDetection"
breakpoints="after" activated="no"><parameter key="distance" value="0.13225"/><parameter key="distance_function" value="cosine distance"/><parameter key="proportion" value="0.95"/>
63

</operator><operator name="SOMDimensionalityReduction" class="SOMDimensionalityReduction"></operator><operator name="PrincipalComponentsGenerator" class="PrincipalComponentsGenerator"
activated="no"></operator>
</operator>
</process>
D.1.2 SVM process file
<?xml version="1.0" encoding="windows-1252"?><process version="4.1">
<operator name="Root" class="Process" expanded="yes"><operator name="ExampleSetGenerator" class="ExampleSetGenerator" activated="no">
<parameter key="number_examples" value="200"/><parameter key="number_of_attributes" value="2"/><parameter key="target_function" value="gaussian mixture clusters"/>
</operator><operator name="ExampleSource (2)" class="ExampleSource">
<parameter key="attributes" value="Z:\702\RacesAll.aml"/></operator><operator name="ExampleSource" class="ExampleSource" activated="no">
<parameter key="attributes" value="Z:\702\BoatSkillSVMb.aml"/></operator><operator name="ExampleFilter" class="ExampleFilter">
<parameter key="condition_class" value="no_missing_attributes"/></operator><operator name="AttributeFilter" class="AttributeFilter">
<parameter key="condition_class" value="is_numerical"/></operator><operator name="FeatureNameFilter (2)" class="FeatureNameFilter">
<parameter key="filter_special_features" value="true"/><parameter key="skip_features_with_name"
value="b.BoatType||r.SKILL_SEC_BEHIND||b.AVG_SKILL_SEC"/></operator><operator name="FeatureNameFilter" class="FeatureNameFilter">
<parameter key="filter_special_features" value="true"/><parameter key="skip_features_with_name" value="label"/>
</operator><operator name="FeatureGeneration" class="FeatureGeneration">
<list key="functions"><parameter key="class" value="const[0]()"/>
</list>
64

<parameter key="keep_all" value="true"/></operator><operator name="AttributeSubsetPreprocessing"
class="AttributeSubsetPreprocessing" expanded="yes"><parameter key="attribute_name_regex" value="class"/><operator name="Numeric2Polynominal" class="Numeric2Polynominal"></operator>
</operator><operator name="ChangeAttributeRole" class="ChangeAttributeRole">
<parameter key="name" value="class"/><parameter key="target_role" value="label"/>
</operator><operator name="LibSVMLearner" class="LibSVMLearner">
<parameter key="C" value="100.0"/><list key="class_weights"></list><parameter key="gamma" value="1.0"/><parameter key="keep_example_set" value="true"/><parameter key="svm_type" value="one-class"/>
</operator><operator name="ModelApplier" class="ModelApplier" breakpoints="after">
<list key="application_parameters"></list>
</operator><operator name="SOMDimensionalityReduction"
class="SOMDimensionalityReduction"></operator>
</operator>
</process>
65

D.2 SQL Server Assembly
using System;using System.Collections;using System.Collections.Generic;using System.Text;using System.Data.Sql;using System.Data.SqlServer;using System.Data.SqlTypes;using Microsoft.SqlServer.Server;using System.Data;using System.Data.SqlClient;
namespace sailwater{
public class SQL Functions{
const decimal myversion = 1.5M;const int ratings range = 3;const string boattable = "Boat";const string resulttable = "Result";
[SqlFunction(DataAccess = DataAccessKind.Read, TableDefinition= "boatID bigint, testCount int, results nvarchar(1000)", Name = "CountTests",FillRowMethodName = "FillTestCount")]
public static IEnumerable InitTestCount(){
ArrayList output = new ArrayList();SqlConnection conn = null;try{
ArrayList boats = new ArrayList();conn = new SqlConnection("context connection=true");String res;res = "SELECT BoatID FROM Boat";conn.Open();SqlCommand commr = new SqlCommand(res, conn);SqlDataReader rr = commr.ExecuteReader();
//determine all the boats to be analyzedif (rr.HasRows){
while (rr.Read()){
long BoatID = rr.GetInt64(0);//null not allowed
66

for IDboats.Add(BoatID);
}}rr.Close();commr.Dispose();conn.Close();for (int i = 0; i < boats.Count; i++){
long bid = (long)boats[i];String sql1 = "SELECT tr.Passed FROM TestResult
AS tr, Test As t " +"WHERE t.TestID=tr.TestID AND t.actual<>1
AND tr.BoatID=@BoatID " +"ORDER BY tr.TestID";
SqlParameter pBoatID = new SqlParameter("@BoatID",bid);
conn.Open();SqlCommand comm = new SqlCommand(sql1, conn);comm.Parameters.Add(pBoatID);
SqlDataReader r = comm.ExecuteReader();bool result = r.HasRows;if (result){
String results = "";int count = 0;while (r.Read()){
if (!r.IsDBNull(0)){
bool passed = r.GetBoolean(0);if (passed){
count++;if (results.Length < 1000){
results = results + "1";}
}else{
if (results.Length < 1000){
results = results + "0";
67

}}
}
}ATestCount atc = new ATestCount(bid, count,
results);output.Add(atc);
}r.Close();comm.Dispose();conn.Close();
}}//ignore errors, just make sure everything is cleaned
upcatch (Exception e){
if (conn != null){
conn.Close();}throw new Exception("An error has occured", e);//output = "There was an error: \n" + e.Message + "\n"
+ e.StackTrace;}return output;
}public static void FillTestCount(Object obj, out SqlInt64 boatID,
out SqlInt32 testCount, out SqlChars results){
ATestCount atc = (ATestCount)obj;boatID = new SqlInt64(atc.boatID);testCount = new SqlInt32(atc.testCount);results = new SqlChars(atc.results);
}public class ATestCount{
private long boatID;private int count;private string results;
public ATestCount(long boatID, int testCount, string results){
boatID = boatID;count = testCount;
68

results = results;}public long boatID{
get{
return boatID;}set{
boatID = value;}
}public int testCount{
get{
return count;}set{
count = value;}
}public string results{
get{
return results;}set{
results = value;}
}
}
[SqlFunction(Name = "GetVersion")]public static SqlString getVersion(){
return new SqlString(myversion.ToString());}public static void calcSkillSecBehind(){
SqlConnection conn = null;
69
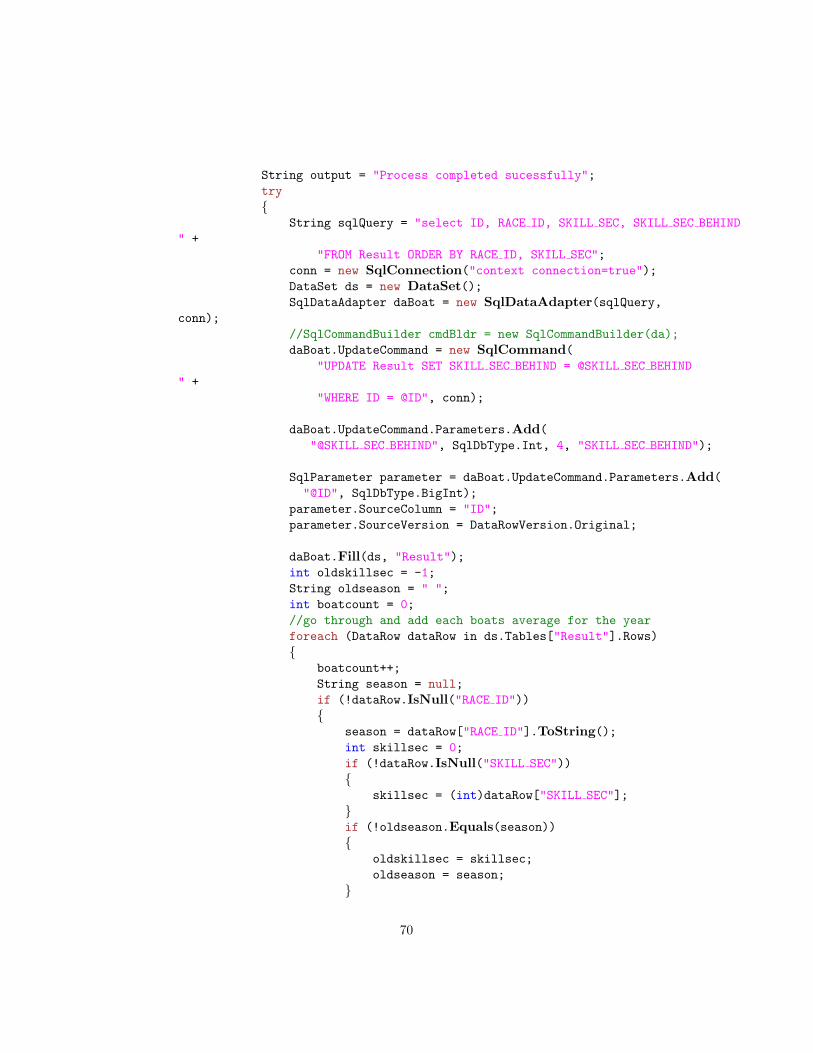
String output = "Process completed sucessfully";try{
String sqlQuery = "select ID, RACE ID, SKILL SEC, SKILL SEC BEHIND" +
"FROM Result ORDER BY RACE ID, SKILL SEC";conn = new SqlConnection("context connection=true");DataSet ds = new DataSet();SqlDataAdapter daBoat = new SqlDataAdapter(sqlQuery,
conn);//SqlCommandBuilder cmdBldr = new SqlCommandBuilder(da);daBoat.UpdateCommand = new SqlCommand(
"UPDATE Result SET SKILL SEC BEHIND = @SKILL SEC BEHIND" +
"WHERE ID = @ID", conn);
daBoat.UpdateCommand.Parameters.Add("@SKILL SEC BEHIND", SqlDbType.Int, 4, "SKILL SEC BEHIND");
SqlParameter parameter = daBoat.UpdateCommand.Parameters.Add("@ID", SqlDbType.BigInt);
parameter.SourceColumn = "ID";parameter.SourceVersion = DataRowVersion.Original;
daBoat.Fill(ds, "Result");int oldskillsec = -1;String oldseason = " ";int boatcount = 0;//go through and add each boats average for the yearforeach (DataRow dataRow in ds.Tables["Result"].Rows){
boatcount++;String season = null;if (!dataRow.IsNull("RACE ID")){
season = dataRow["RACE ID"].ToString();int skillsec = 0;if (!dataRow.IsNull("SKILL SEC")){
skillsec = (int)dataRow["SKILL SEC"];}if (!oldseason.Equals(season)){
oldskillsec = skillsec;oldseason = season;
}
70
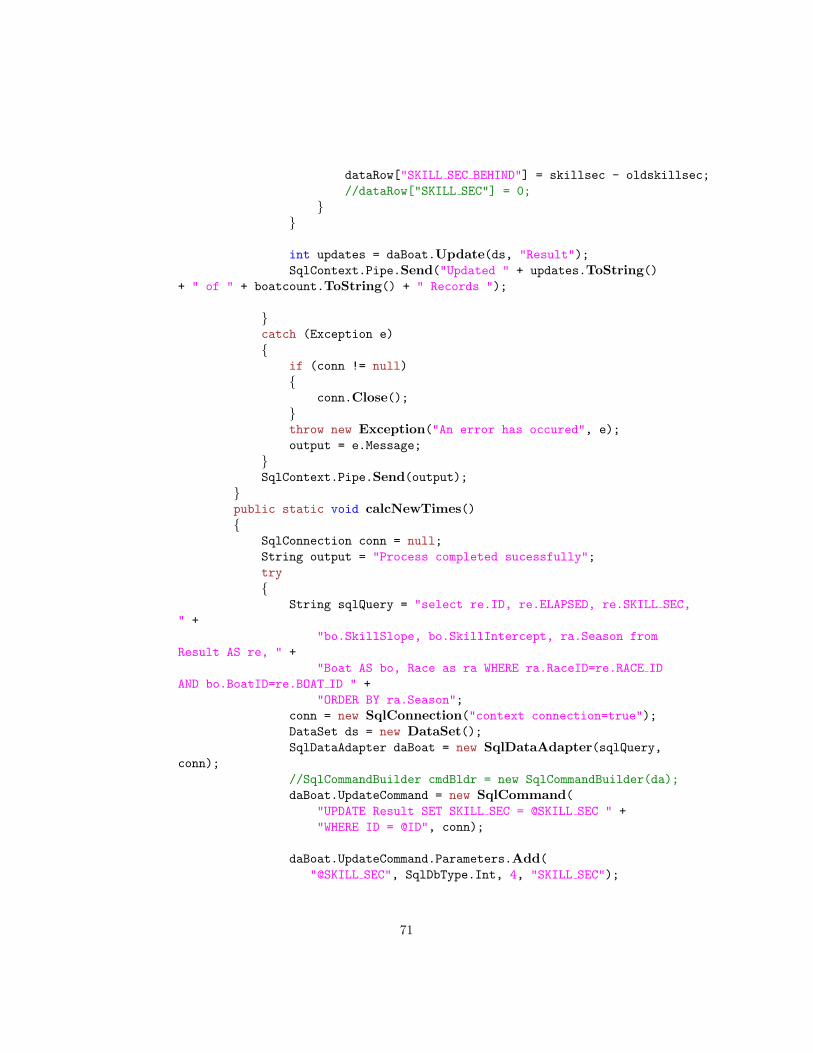
dataRow["SKILL SEC BEHIND"] = skillsec - oldskillsec;//dataRow["SKILL SEC"] = 0;
}}
int updates = daBoat.Update(ds, "Result");SqlContext.Pipe.Send("Updated " + updates.ToString()
+ " of " + boatcount.ToString() + " Records ");
}catch (Exception e){
if (conn != null){
conn.Close();}throw new Exception("An error has occured", e);output = e.Message;
}SqlContext.Pipe.Send(output);
}public static void calcNewTimes(){
SqlConnection conn = null;String output = "Process completed sucessfully";try{
String sqlQuery = "select re.ID, re.ELAPSED, re.SKILL SEC," +
"bo.SkillSlope, bo.SkillIntercept, ra.Season fromResult AS re, " +
"Boat AS bo, Race as ra WHERE ra.RaceID=re.RACE IDAND bo.BoatID=re.BOAT ID " +
"ORDER BY ra.Season";conn = new SqlConnection("context connection=true");DataSet ds = new DataSet();SqlDataAdapter daBoat = new SqlDataAdapter(sqlQuery,
conn);//SqlCommandBuilder cmdBldr = new SqlCommandBuilder(da);daBoat.UpdateCommand = new SqlCommand(
"UPDATE Result SET SKILL SEC = @SKILL SEC " +"WHERE ID = @ID", conn);
daBoat.UpdateCommand.Parameters.Add("@SKILL SEC", SqlDbType.Int, 4, "SKILL SEC");
71
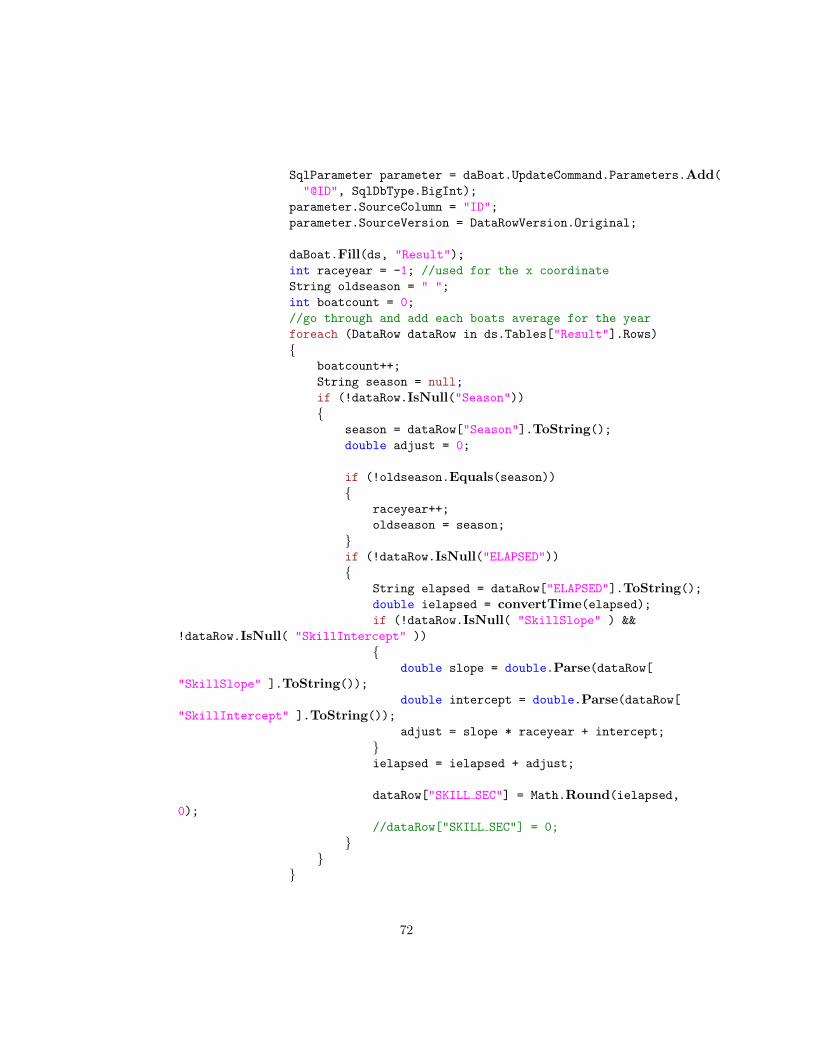
SqlParameter parameter = daBoat.UpdateCommand.Parameters.Add("@ID", SqlDbType.BigInt);
parameter.SourceColumn = "ID";parameter.SourceVersion = DataRowVersion.Original;
daBoat.Fill(ds, "Result");int raceyear = -1; //used for the x coordinateString oldseason = " ";int boatcount = 0;//go through and add each boats average for the yearforeach (DataRow dataRow in ds.Tables["Result"].Rows){
boatcount++;String season = null;if (!dataRow.IsNull("Season")){
season = dataRow["Season"].ToString();double adjust = 0;
if (!oldseason.Equals(season)){
raceyear++;oldseason = season;
}if (!dataRow.IsNull("ELAPSED")){
String elapsed = dataRow["ELAPSED"].ToString();double ielapsed = convertTime(elapsed);if (!dataRow.IsNull( "SkillSlope" ) &&
!dataRow.IsNull( "SkillIntercept" )){
double slope = double.Parse(dataRow["SkillSlope" ].ToString());
double intercept = double.Parse(dataRow["SkillIntercept" ].ToString());
adjust = slope * raceyear + intercept;}ielapsed = ielapsed + adjust;
dataRow["SKILL SEC"] = Math.Round(ielapsed,0);
//dataRow["SKILL SEC"] = 0;}
}}
72

int updates = daBoat.Update(ds, "Result");SqlContext.Pipe.Send("Updated " + updates.ToString()
+ " of " + boatcount.ToString() + " Records ");
}catch (Exception e){
if (conn != null){
conn.Close();}throw new Exception("An error has occured", e);output = e.Message;
}SqlContext.Pipe.Send(output);
}private static int convertTime(String strTime){
int output = 0;int[] iadjust = new int[] {1,60,3600,86400};String[] fields = strTime.Split(new Char[] { ’:’ });int cadjust = 0;
for (int i = fields.Length - 1; i >= 0; i--){
int ifield = 0;try{
ifield = int.Parse(fields[i]);}catch (FormatException fe){}catch (OverflowException oe){}if (cadjust < 4){
output = output + ifield * iadjust[cadjust];}cadjust++;
}return output;
}private static int countBoats(){
73
int output = 0;SqlConnection conn = null;try{
String strSQL = "SELECT Count(*) FROM Boat;";conn = new SqlConnection("context connection=true");conn.Open();SqlCommand ticomm = new SqlCommand(strSQL, conn);SqlDataReader rti = ticomm.ExecuteReader();if (rti.HasRows){
rti.Read();if (!rti.IsDBNull(0)){
output = rti.GetInt32(0);}
}rti.Close();ticomm.Dispose();
}catch (Exception e){
if (conn != null){
conn.Close();}//throw new Exception("An error has occured", e);output = -1;
}if (conn != null){
conn.Dispose();}return output;
}public static void calcPrecRecall(long TestID, long ActualID){
String sqlQuery = "SELECT a.Passed AS actual, p.PassedAS predicted FROM " +
"(SELECT BoatID, Passed FROM TestResult WHERE TestID= @ActualID) AS a, " +
"(SELECT BoatID, Passed FROM TestResult WHERE TestID= @TestID) AS p " +
"WHERE a.BoatID=p.BoatID";SqlConnection conn = null;
74

String output = "Process completed sucessfully";try{
conn = new SqlConnection("context connection=true");DataSet ds = new DataSet();SqlDataAdapter daTest = new SqlDataAdapter(sqlQuery,
conn);SqlParameter pActualID = new SqlParameter("@ActualID",
ActualID);daTest.SelectCommand.Parameters.Add(pActualID);SqlParameter pTestID = new SqlParameter("@TestID",
TestID);daTest.SelectCommand.Parameters.Add(pTestID);daTest.Fill(ds, "Result");int PredT ActT=0, PredT ActF=0, PredF ActT=0, PredF ActF=0;//go through and set count predicted vs actualforeach (DataRow dataRow in ds.Tables["Result"].Rows){
bool act = (bool)dataRow["actual"];bool pred = (bool)dataRow["predicted"];if (pred){
if (act){
PredT ActT++;}else{
PredT ActF++;}
}else{
if (act){
PredF ActT++;}else{
PredF ActF++;}
}}
conn.Open();String SQLUpdate = "Update Test Set predT actT=@TT,
75

predT actF=@TF, " +"predF actT=@FT, predF actF=@FF WHERE TestID=@TestID";
SqlCommand tcomm = new SqlCommand(SQLUpdate, conn);SqlParameter pTT = new SqlParameter("@TT", PredT ActT);SqlParameter pTF = new SqlParameter("@TF", PredT ActF);SqlParameter pFT = new SqlParameter("@FT", PredF ActT);SqlParameter pFF = new SqlParameter("@FF", PredF ActF);SqlParameter pTestID2 = new SqlParameter("@TestID",
TestID);tcomm.Parameters.Add(pTT);tcomm.Parameters.Add(pTF);tcomm.Parameters.Add(pFT);tcomm.Parameters.Add(pFF);tcomm.Parameters.Add(pTestID2);int tresult = tcomm.ExecuteNonQuery();if (tresult > 0){
SqlContext.Pipe.Send("Added values for test " +TestID.ToString() + " to database");
}tcomm.Dispose();conn.Close();
}catch (Exception e){
if (conn != null){
conn.Close();}//throw new Exception("An error has occured", e);output = e.Message + e.StackTrace;
}SqlContext.Pipe.Send(output);if (conn != null){
conn.Dispose();}
}public static void scoreTest(long testID, float percentage){
SqlConnection conn = null;String output = "Process completed sucessfully";int lastindex = (int)Math.Round(countBoats() * percentage);try{
String sqlQuery = "SELECT ResultID, TestID, BoatID,
76
Passed, Value, Notes " +"FROM TestResult WHERE TestID=@TestID " +"ORDER BY Value DESC";
conn = new SqlConnection("context connection=true");DataSet ds = new DataSet();SqlDataAdapter daBoat = new SqlDataAdapter(sqlQuery,
conn);SqlParameter pTestID = new SqlParameter("@TestID",
testID);daBoat.SelectCommand.Parameters.Add(pTestID);//SqlCommandBuilder cmdBldr = new SqlCommandBuilder(da);daBoat.UpdateCommand = new SqlCommand(
"UPDATE TestResult SET Passed = @Passed " +"WHERE ResultID = @ResultID", conn);
daBoat.UpdateCommand.Parameters.Add("@Passed", SqlDbType.Bit, 4, "Passed");
SqlParameter parameter = daBoat.UpdateCommand.Parameters.Add("@ResultID", SqlDbType.BigInt);
parameter.SourceColumn = "ResultID";parameter.SourceVersion = DataRowVersion.Original;
daBoat.Fill(ds, "Result");
int boatcount = 0;//go through and set the top percentage to trueforeach (DataRow dataRow in ds.Tables["Result"].Rows){
boatcount++;if (boatcount < lastindex){
dataRow["Passed"] = true;}else{
dataRow["Passed"] = false;}
}
int updates = daBoat.Update(ds, "Result");SqlContext.Pipe.Send("Scored " + updates.ToString()
+ " of " + boatcount.ToString() + " Records ");
}catch (Exception e)
77

{if (conn != null){
conn.Close();}//throw new Exception("An error has occured", e);output = e.Message + e.StackTrace;SqlContext.Pipe.Send(output);
}
if (conn != null){
conn.Dispose();}
}public static void findOutliers(){
String output = "Process completed sucessfully";//String column = "COR SEC BEHIND";String column = "SKILL SEC BEHIND";SqlConnection conn = null;try{
conn = new SqlConnection("context connection=true");DataSet ds = new DataSet();String res;res = "SELECT BoatID, Races FROM Boat";SqlDataAdapter daResult = new SqlDataAdapter(res,
conn);daResult.Fill(ds, "Boats");
Hashtable boats = new Hashtable(600);OutlierStat os = new OutlierStat();//determine all the boats to be analyzedforeach (DataRow dataRow in ds.Tables["Boats"].Rows){
long BoatID = (long)dataRow["BoatID"];int Races = (int)dataRow["Races"];OutlierBoat ob = new OutlierBoat(BoatID);ob.Races = Races;boats.Add(BoatID, ob);
}SqlContext.Pipe.Send("Loaded " + boats.Count.ToString()
+ " Boats");IDictionaryEnumerator Enumerator;Enumerator = boats.GetEnumerator();
78

//go through every boat set averages by comparing toboats raced against
long comparisons = 0;while (Enumerator.MoveNext()){
OutlierBoat b = (OutlierBoat)Enumerator.Value;String sql1 = "SELECT re.BOAT ID " +"FROM (Select RACE ID FROM Result WHERE BOAT ID=@BoatID)
AS ra, Result AS re " +"WHERE re.RACE ID=ra.RACE ID AND re.BOAT ID<>@BoatID
GROUP BY re.BOAT ID";SqlParameter pBoatID = new SqlParameter("@BoatID",
b.longID);conn.Open();SqlCommand comm = new SqlCommand(sql1, conn);comm.Parameters.Add(pBoatID);
SqlDataReader r = comm.ExecuteReader();bool result = r.HasRows;ArrayList rlist = new ArrayList();if (result){
while (r.Read()){
if (!r.IsDBNull(0)){
rlist.Add(r.GetInt64(0));}
}
}r.Close();comm.Dispose();conn.Close();//SqlContext.Pipe.Send("Performed " + comparisons.ToString()
+ " comparisons");comparisons = comparisons + rlist.Count;
//now we have all boats raced against get resultsfor each
for (int i = 0; i < rlist.Count; i++){
79

String sql2 = "SELECT b1." + column + ", b2."+ column + " " +
"FROM (SELECT " + column + ", RACE ID FROMResult WHERE BOAT ID=@boatA) AS b1, (SELECT " + column + ", RACE IDFROM Result WHERE BOAT ID=@boatB) AS b2 " +
"WHERE b1.RACE ID=b2.RACE ID;";SqlParameter pboatA = new SqlParameter("@boatA",
b.longID);SqlParameter pboatB = new SqlParameter("@boatB",
rlist[i]);conn.Open();SqlCommand recomm = new SqlCommand(sql2,
conn);recomm.Parameters.Add(pboatA);recomm.Parameters.Add(pboatB);SqlDataReader rer = recomm.ExecuteReader();bool reresult = rer.HasRows;int positive = 0;int negative = 0;int count = 0;if(!b.containsValue((long)rlist[i]) && boats.Contains(rlist[i])){
//ignore boat if not in listOutlierBoat b2 = (OutlierBoat)boats[rlist[i]];if (reresult){
while (rer.Read()){
if (!rer.IsDBNull(0) && !rer.IsDBNull(1)){
//we now have the finish timesfor each boat
int ireresult = rer.GetInt32(0)-rer.GetInt32(1);count++;if (ireresult >= 0){
positive++;}else{
negative++;}
}
}
80

//since it doesnt matter if the differenceis positive or negative
//divide the smaller by the bigger to normalizevalues between 0 and 1
float ratio = 0f;if (positive > negative){
ratio = negative / positive;}else{
ratio = positive / negative;}OutlierValue ov = new OutlierValue(ratio,
count);b.addValue((long)rlist[i], ov);b2.addValue(b.longID, ov);
}}rer.Close();recomm.Dispose();conn.Close();
}//now we have all the boats raced against calculate
average scoreos.addAverage(b.getAverage());
}SqlContext.Pipe.Send("Performed " + comparisons.ToString()
+ " comparisons");//now all the boats are done find the outlier score
thresholdOutlierValue ovt = os.getThreshold(0.5f);SqlContext.Pipe.Send("Ratio Threshold = " + ovt.ratio.ToString()
+ ", Count Threshold = " + ovt.count.ToString());//create a testString name = "Race Comparison: " + column;DateTime now = DateTime.Now;String desc = "Look for patterns by comparing boats
over time";String newtest = "INSERT INTO TEST(Name, Date, Description,
actual) values(@Name, @Date, @Description, @actual)";conn.Open();SqlCommand tcomm = new SqlCommand(newtest, conn);SqlParameter pName = new SqlParameter("@Name", name);SqlParameter pDate = new SqlParameter("@Date", now);
81

SqlParameter pDescription = new SqlParameter("@Description",desc);
SqlParameter pActual = new SqlParameter("@actual",false);
tcomm.Parameters.Add(pName);tcomm.Parameters.Add(pDate);tcomm.Parameters.Add(pDescription);tcomm.Parameters.Add(pActual);int tresult = tcomm.ExecuteNonQuery();if (tresult > 0){
SqlContext.Pipe.Send("Added test to database");}conn.Close();if (tresult > 0){
//get test IDString testID = "SELECT TestID FROM Test WHERE
Name=@Name AND Date=@Date;";conn.Open();SqlCommand ticomm = new SqlCommand(testID, conn);SqlParameter piName = new SqlParameter("@Name",
name);SqlParameter piDate = new SqlParameter("@Date",
now);ticomm.Parameters.Add(piName);ticomm.Parameters.Add(piDate);long ltestID = 0;SqlDataReader rti = ticomm.ExecuteReader();if (rti.HasRows){
rti.Read();if (!rti.IsDBNull(0)){
ltestID = rti.GetInt64(0);}
}rti.Close();ticomm.Dispose();SqlContext.Pipe.Send("Test ID is: " + ltestID.ToString());
IDictionaryEnumerator bEnumerator;bEnumerator = boats.GetEnumerator();int resadded = 0;//compute score for each boat and update in database
82

while (bEnumerator.MoveNext()){
OutlierBoat b = (OutlierBoat)bEnumerator.Value;string insert = "insert into TestResult(TestID,
BoatID, Passed, Value, Notes) " +"values (@TestID, @BoatID, @Passed, @Value,
@Notes)";
SqlCommand icomm = new SqlCommand(insert,conn);
SqlParameter pTestID = new SqlParameter("@TestID",ltestID);
SqlParameter pBoatID = new SqlParameter("@BoatID",b.longID);
SqlParameter pPassed = new SqlParameter("@Passed","");
SqlParameter pValue = new SqlParameter("@Value",b.getScore(ovt));
SqlParameter pNotes = new SqlParameter("@Notes","");
icomm.Parameters.Add(pTestID);icomm.Parameters.Add(pBoatID);icomm.Parameters.Add(pPassed);icomm.Parameters.Add(pValue);icomm.Parameters.Add(pNotes);
int iresult = icomm.ExecuteNonQuery();if (iresult > 0){
resadded++;}icomm.Dispose();
}SqlContext.Pipe.Send("Added " + resadded.ToString()
+ " results");conn.Close();if (resadded > 0){
scoreTest(ltestID, 0.1f);calcPrecRecall(ltestID, 101);
}}
}//ignore errors, just make sure everything is cleanedup
83
catch (Exception e){
if (conn != null){
conn.Close();}//throw new Exception("An error has occured", e);output = "There was an error: \n" + e.Message + "\n"
+ e.StackTrace;}SqlContext.Pipe.Send(output);
}public static void adjustForSkill(){
String output = "Process completed sucessfully";SqlConnection conn = null;try{
Hashtable Classes = new Hashtable(600); //used to getclass averages
Hashtable Ratings = new Hashtable(600);Hashtable Boats = new Hashtable(600);
conn = new SqlConnection("context connection=true");DataSet ds = new DataSet();SqlDataAdapter daBoat = new SqlDataAdapter("select
BoatID, AVG SEC BEHIND, STANDARD, Races, CUR PHRF, SkillSlope, SkillIntercept,SkillRSquared from Boat", conn);
//SqlCommandBuilder cmdBldr = new SqlCommandBuilder(da);daBoat.UpdateCommand = new SqlCommand(
"UPDATE Boat SET SkillSlope = @SkillSlope, SkillIntercept= @SkillIntercept, SkillRSquared = @SkillRSquared " +
"WHERE BoatID = @BoatID", conn);
daBoat.UpdateCommand.Parameters.Add("@SkillSlope", SqlDbType.Float, 8, "SkillSlope");
daBoat.UpdateCommand.Parameters.Add("@SkillIntercept", SqlDbType.Float, 8, "SkillIntercept");
daBoat.UpdateCommand.Parameters.Add("@SkillRSquared", SqlDbType.Float, 8, "SkillRSquared");
SqlParameter parameter = daBoat.UpdateCommand.Parameters.Add("@BoatID", SqlDbType.BigInt);
parameter.SourceColumn = "BoatID";parameter.SourceVersion = DataRowVersion.Original;
84
daBoat.Fill(ds, "Boat");String res;res = "SELECT re.BOAT ID, ra.Season, AVG(re.COR SEC BEHIND)as
AVG SEC BEHIND" +" FROM Result as re, Race as ra WHERE ra.RaceID=re.RACE ID"
+" GROUP BY re.BOAT ID, ra.Season ORDER BY ra.Season";
SqlDataAdapter daResult = new SqlDataAdapter(res,conn);
daResult.Fill(ds, "Result");//go through each one, more efficient than searching
since we have to look at all of them anyway//find class and rating averages(depends on Boat table
being up to date) and initialize boatsint boatcount = 0;foreach (DataRow dataRow in ds.Tables["Boat"].Rows){
boatcount++;String BoatID = dataRow["BoatID"].ToString();String standard = null;if (!dataRow.IsNull("STANDARD")){
standard = dataRow["STANDARD"].ToString();}String cur phrf = null;if (!dataRow.IsNull("CUR PHRF")){
cur phrf = dataRow["CUR PHRF"].ToString();}
int avgsecbehind = 0;if (!dataRow.IsNull("AVG SEC BEHIND")){
avgsecbehind = int.Parse(dataRow["AVG SEC BEHIND"].ToString());//should catch parsing exceptions
}int numraces = 0;if (!dataRow.IsNull("Races")){
numraces = int.Parse(dataRow["Races"].ToString());}//each boat should be unique so add each oneif (standard != null && cur phrf != null){
boat data bd = new boat data(int.Parse(BoatID),
85
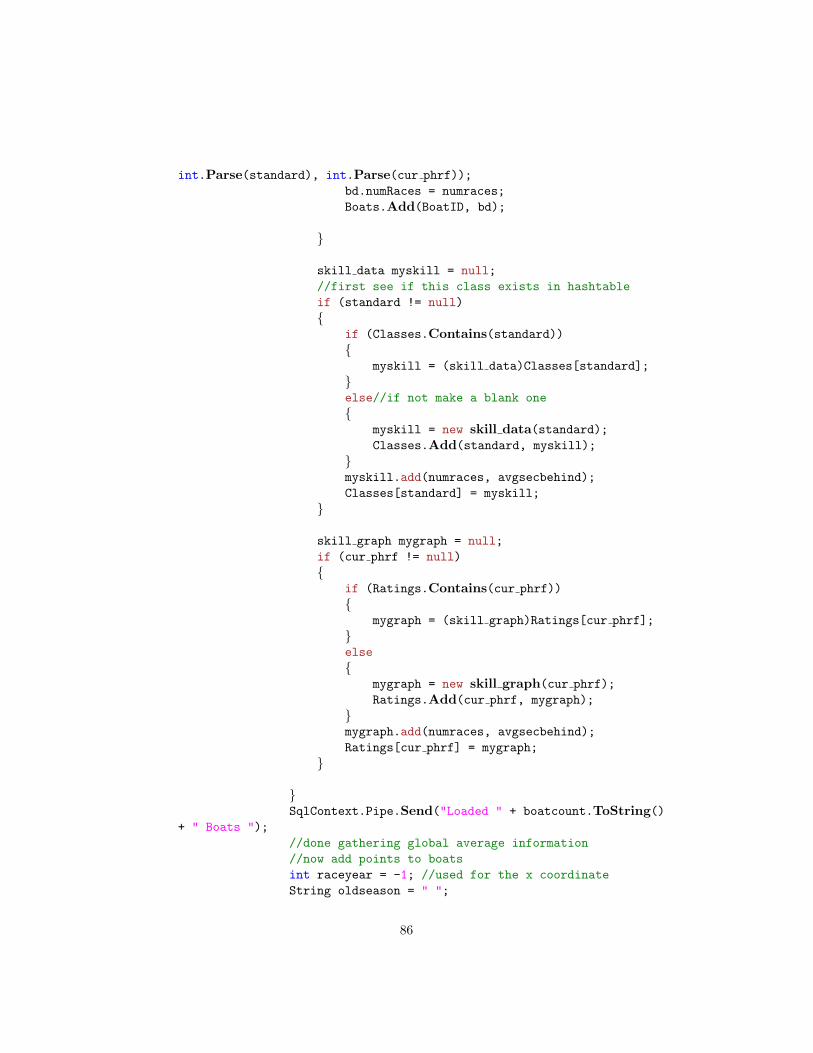
int.Parse(standard), int.Parse(cur phrf));bd.numRaces = numraces;Boats.Add(BoatID, bd);
}
skill data myskill = null;//first see if this class exists in hashtableif (standard != null){
if (Classes.Contains(standard)){
myskill = (skill data)Classes[standard];}else//if not make a blank one{
myskill = new skill data(standard);Classes.Add(standard, myskill);
}myskill.add(numraces, avgsecbehind);Classes[standard] = myskill;
}
skill graph mygraph = null;if (cur phrf != null){
if (Ratings.Contains(cur phrf)){
mygraph = (skill graph)Ratings[cur phrf];}else{
mygraph = new skill graph(cur phrf);Ratings.Add(cur phrf, mygraph);
}mygraph.add(numraces, avgsecbehind);Ratings[cur phrf] = mygraph;
}
}SqlContext.Pipe.Send("Loaded " + boatcount.ToString()
+ " Boats ");//done gathering global average information//now add points to boatsint raceyear = -1; //used for the x coordinateString oldseason = " ";
86

boatcount = 0;//go through and add each boats average for the yearforeach (DataRow dataRow in ds.Tables["Result"].Rows){
boatcount++;String BID = dataRow["BOAT ID"].ToString();String season = null;if (!dataRow.IsNull("Season")){
season = dataRow["Season"].ToString();
int avgsec = 0;if (!dataRow.IsNull("AVG SEC BEHIND")){
avgsec = int.Parse(dataRow["AVG SEC BEHIND"].ToString());}if (!oldseason.Equals(season)){
raceyear++;oldseason = season;
}if (Boats.Contains(BID)){
boat data bd = (boat data)Boats[BID];bd.add(raceyear, avgsec);Boats[BID] = bd;
}}
}SqlContext.Pipe.Send("Processed " + boatcount.ToString()
+ " Points ");IDictionaryEnumerator Enumerator;Enumerator = Boats.GetEnumerator();boatcount = 0;while (Enumerator.MoveNext()) //go through every
boat set averages and calculate points{
boatcount++;boat data b = (boat data)Enumerator.Value;//this assumes no boat had a null class or rating
may need to actually check somewhereif(b.myClass != 0){
if(Classes.Contains(b.myClass.ToString())){b.classAverage = ((skill data)Classes[ b.myClass.ToString()
]).getAverage();b.classCount = ((skill data)Classes[ b.myClass.ToString()
87
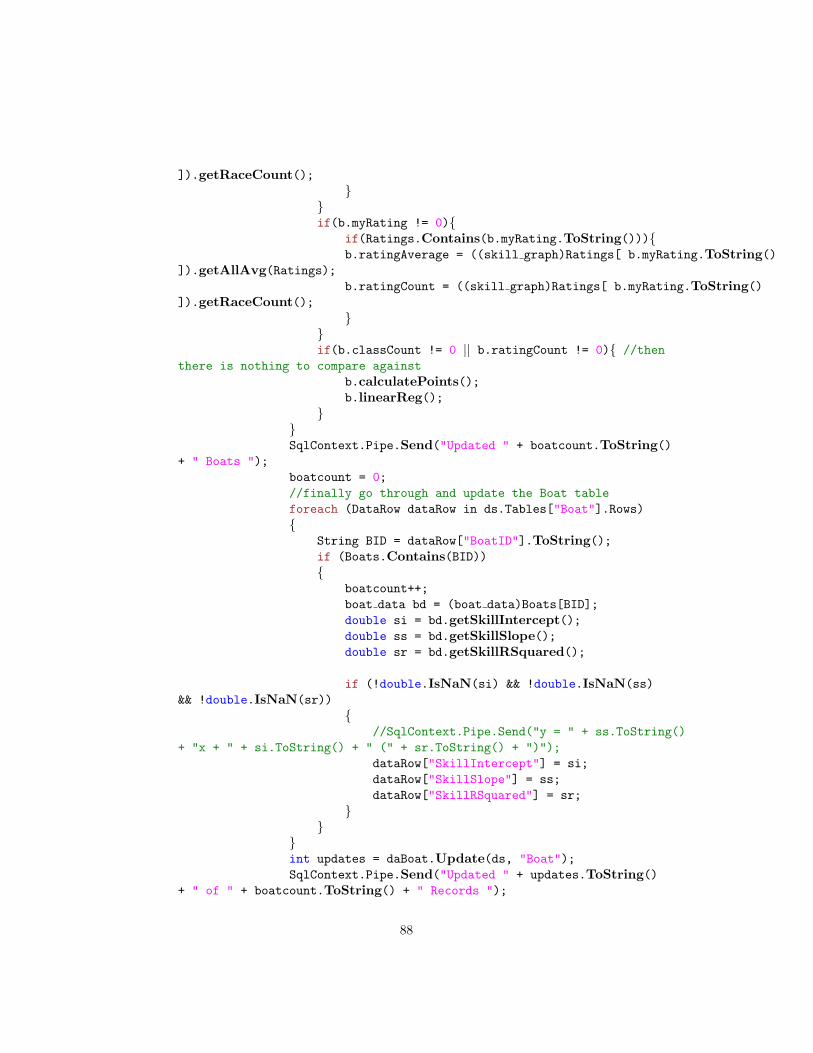
]).getRaceCount();}
}if(b.myRating != 0){
if(Ratings.Contains(b.myRating.ToString())){b.ratingAverage = ((skill graph)Ratings[ b.myRating.ToString()
]).getAllAvg(Ratings);b.ratingCount = ((skill graph)Ratings[ b.myRating.ToString()
]).getRaceCount();}
}if(b.classCount != 0 || b.ratingCount != 0){ //then
there is nothing to compare againstb.calculatePoints();b.linearReg();
}}SqlContext.Pipe.Send("Updated " + boatcount.ToString()
+ " Boats ");boatcount = 0;//finally go through and update the Boat tableforeach (DataRow dataRow in ds.Tables["Boat"].Rows){
String BID = dataRow["BoatID"].ToString();if (Boats.Contains(BID)){
boatcount++;boat data bd = (boat data)Boats[BID];double si = bd.getSkillIntercept();double ss = bd.getSkillSlope();double sr = bd.getSkillRSquared();
if (!double.IsNaN(si) && !double.IsNaN(ss)&& !double.IsNaN(sr))
{//SqlContext.Pipe.Send("y = " + ss.ToString()
+ "x + " + si.ToString() + " (" + sr.ToString() + ")");dataRow["SkillIntercept"] = si;dataRow["SkillSlope"] = ss;dataRow["SkillRSquared"] = sr;
}}
}int updates = daBoat.Update(ds, "Boat");SqlContext.Pipe.Send("Updated " + updates.ToString()
+ " of " + boatcount.ToString() + " Records ");
88

}//ignore errors, just make sure everything is cleanedup
catch(Exception e){
if (conn != null){
conn.Close();}throw new Exception("An error has occured",e);output = e.Message;
}SqlContext.Pipe.Send(output);
}public class skill graph{
private int min;private int max;private float average;private float all average;private int count;private int race count;private int myvalue;private String myRating;private Boolean average notran;public skill graph(String rating){
myRating = rating;try{
myvalue = int.Parse(myRating);}catch (Exception e){
myvalue = 0;}min = int.MaxValue;max = int.MinValue;average = 0;all average = 0;count = 0;average notran = true;
}public float calulateAllAvg(Hashtable Ratings){
89

float newavg = 0.0f;all average = average;int total = count;for (int i = (ratings range * -1); i < ratings range;
i++){
int rat = myvalue + i;if (Ratings.Contains(rat.ToString()) && i != 0){
skill graph temp = (skill graph)Ratings[rat.ToString()];float tempavg = temp.getAverage() * temp.getRaceCount();total = total + temp.getRaceCount();newavg = newavg + tempavg;
}}if (newavg > 0){
all average = ((average * count) + newavg) / total;average notran = false;
}
return all average;}public float getAllAvg(Hashtable Ratings){
if (average notran) { return calulateAllAvg(Ratings);}
return all average;}public void add(int races, int input){
float total = average * race count;total = total + input * races;race count = race count + races;count++;average = total / race count;if (input > max) { max = input; }if (input < min) { min = input; }
}public int getRaceCount(){
return race count;}public int getMin()
90
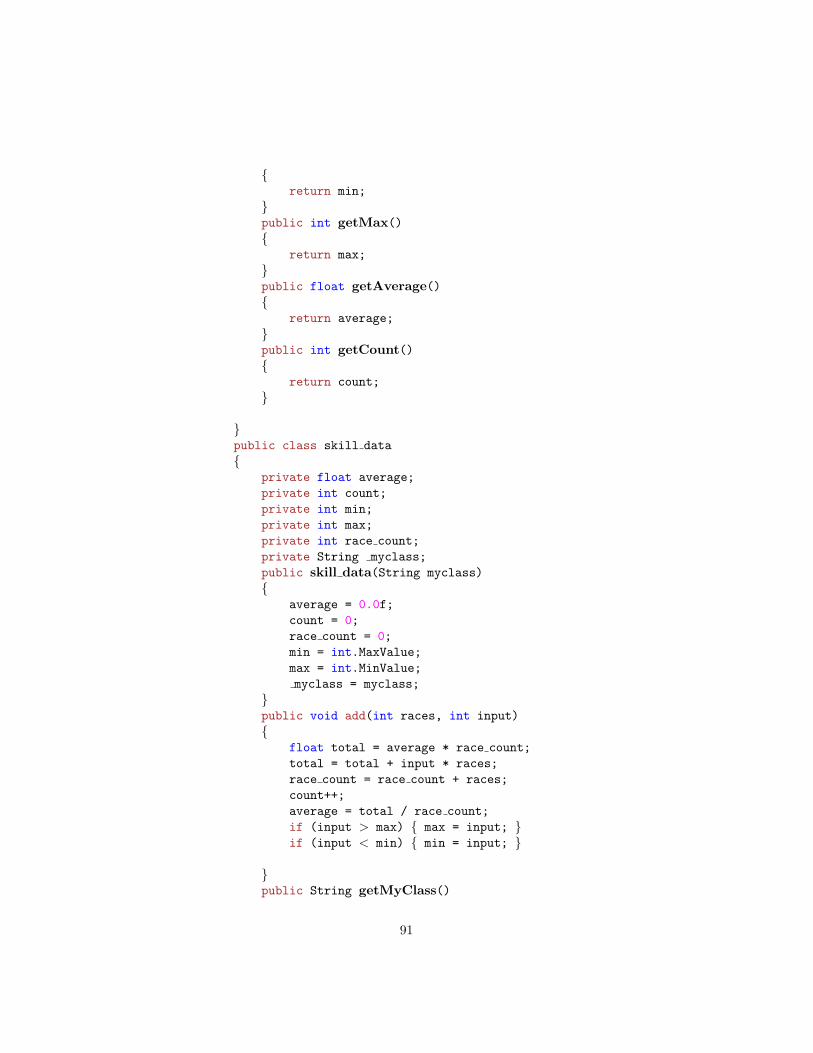
{return min;
}public int getMax(){
return max;}public float getAverage(){
return average;}public int getCount(){
return count;}
}public class skill data{
private float average;private int count;private int min;private int max;private int race count;private String myclass;public skill data(String myclass){
average = 0.0f;count = 0;race count = 0;min = int.MaxValue;max = int.MinValue;myclass = myclass;
}public void add(int races, int input){
float total = average * race count;total = total + input * races;race count = race count + races;count++;average = total / race count;if (input > max) { max = input; }if (input < min) { min = input; }
}public String getMyClass()
91

{return myclass;
}public int getRaceCount(){
return race count;}public int getMin(){
return min;}public int getMax(){
return max;}public float getAverage(){
return average;}
}public class boat data{
private double skillIntercep;private double skillSlope;private double skillRSquared;private float classAverage;private float ratingAverage;private int classCount;private int ratingCount;private int myID;private int myClass;private int myRating;private int numRaces;private ArrayList points;private ArrayList avgpoints;
public boat data(int id, int classid, int rating){
myID = id;myClass = classid;myRating = rating;points = new ArrayList();avgpoints = new ArrayList();skillIntercep = 0;skillSlope = 0;
92

skillRSquared = 0;classAverage = 0;ratingAverage = 0;classCount = 0;ratingCount = 0;numRaces = 0;
}public double getSkillIntercept(){
return skillIntercep;}public double getSkillSlope(){
return skillSlope;}public double getSkillRSquared(){
return skillRSquared;}public int numRaces{
get{
return numRaces;}set{
numRaces = value;}
}public int myClass{
get{
return myClass;}set{
myClass = value;}
}public int myRating{
get{
93

return myRating;}set{
myRating = value;
}}public void calculatePoints(){
points.Clear();for (int i = 0; i < avgpoints.Count; i++){
ReportPoint tp = (ReportPoint)avgpoints[i];double skill = 0;//code to calculate skilldouble avg = tp.Y Coord;double year = tp.X Coord;//we will either use the class average (prefered)
or the ratings as the major factor to adjustint classraces = classCount - numRaces; //dont
count our own racesint ratingraces = ratingCount - numRaces;if (classraces * 10 > ratingraces){
skill = ( classAverage - avg) * .9 + ( ratingAverage- avg) * .1;
}else{
skill = ( classAverage - avg) * .1 + ( ratingAverage- avg) * .9;
}ReportPoint np = new ReportPoint(year, skill);points.Add(np);
}
}public void add(int year, int average){
ReportPoint np = new ReportPoint(year, average);avgpoints.Add(np);
}public int getID(){
94
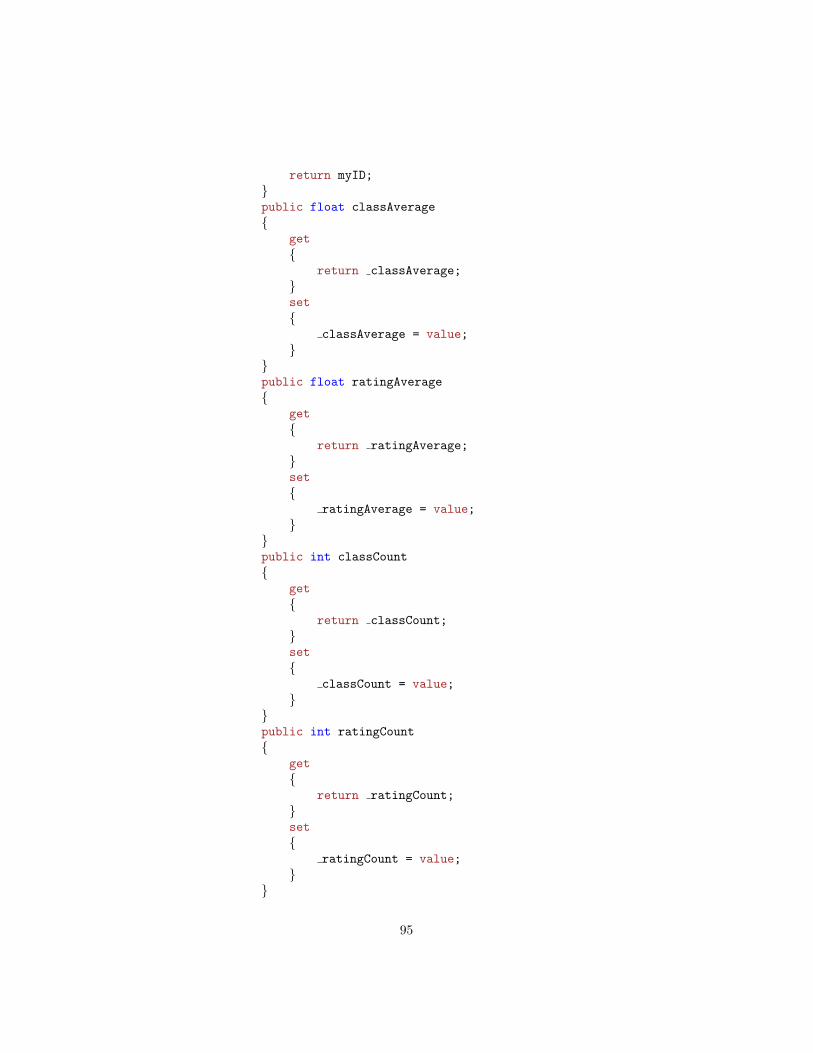
return myID;}public float classAverage{
get{
return classAverage;}set{
classAverage = value;}
}public float ratingAverage{
get{
return ratingAverage;}set{
ratingAverage = value;}
}public int classCount{
get{
return classCount;}set{
classCount = value;}
}public int ratingCount{
get{
return ratingCount;}set{
ratingCount = value;}
}
95

//linear regression obtained from//http://codebetter.com/blogs/grant.killian/archive/2004/05/21/14161.aspxpublic void linearReg(){
double sumOfX = 0;double sumOfY = 0;double sumOfXSq = 0;double sumOfYSq = 0;double ssX = 0;double ssY = 0;double sumCodeviates = 0;double sCo = 0;if (points.Count > 1){
for (int ctr = 0; ctr < points.Count; ctr++){
ReportPoint objPoint = (ReportPoint)points[ctr];
double x = objPoint.X Coord;double y = objPoint.Y Coord;sumCodeviates += (x * y);sumOfX += x;sumOfY += y;sumOfXSq = sumOfXSq + (x * x);sumOfYSq = sumOfYSq + (y * y);
}sumOfXSq = Math.Round(sumOfXSq, 2);sumOfYSq = Math.Round(sumOfYSq, 2);ssX = sumOfXSq - ((sumOfX * sumOfX) / points.Count);ssY = sumOfYSq - ((sumOfY * sumOfY) / points.Count);double RNumerator = (points.Count * sumCodeviates)
- (sumOfX * sumOfY);double RDenom = (points.Count * sumOfXSq - (Math.Pow(sumOfX,
2)))* (points.Count * sumOfYSq - (Math.Pow(sumOfY,
2)));sCo = sumCodeviates - ((sumOfX * sumOfY) / points.Count);double dblSlope = sCo / ssX;double meanX = sumOfX / points.Count;double meanY = sumOfY / points.Count;double dblYintercept = meanY - (dblSlope * meanX);double dblR = RNumerator / Math.Sqrt(RDenom);
skillRSquared = Math.Pow(dblR, 2);skillIntercep = dblYintercept;skillSlope = dblSlope;
96
}else{//if there is just one point use y coordinate as the
interceptif (points.Count > 0){
ReportPoint objPoint = (ReportPoint)points[0];skillIntercep = objPoint.Y Coord;skillSlope = 0;skillRSquared = 1.0;
}}
}
}public class ReportPoint{
private double dblX;private double dblY;
public ReportPoint(double X Coordinate, double Y Coordinate){
dblX = X Coordinate;dblY = Y Coordinate;
}public double X Coord{
get { return dblX; }set { dblX = value; }
}public double Y Coord{
get { return dblY; }set { dblY = value; }
}public String toString(){
return "(" + dblX.ToString() + "," + dblY.ToString()+ ")";
}
}public class OutlierBoat{
private long lID;
97

private Hashtable values;private float ov ratio avg, ov count avg;private int ov ratio, ov count;private int comparisons;private int races;public OutlierBoat(long ID){
lID = ID;values = new Hashtable(600);ov count avg = 0;ov ratio avg = 0;
}public int Races{
get{
return races;}set{
races = value;}
}public OutlierValue getAverage(){
int count = (int)Math.Round((double)ov count avg);OutlierValue ov avg = new OutlierValue(ov ratio avg,
count);return ov avg;
}public double getScore(OutlierValue threshold){
double output = 0;IDictionaryEnumerator Enumerator;Enumerator = values.GetEnumerator();int count = 0;//compute score for each boatwhile (Enumerator.MoveNext()){
OutlierValue val = (OutlierValue)Enumerator.Value;if (val.compareTo(threshold) < 0){
output++;}if (val.count >= threshold.count){
98

count++;}
}int dividend = 1;if (comparisons > 0){
dividend = comparisons;}//return (output / dividend) * ( races / dividend);return output;
}public void addValue(long boatID, OutlierValue ov){
//ignore values with only 1 pointif (ov.count > 1){
float ftemp = ov ratio avg * ov ratio;ftemp = ftemp + ov.ratio;ov ratio++;ov ratio avg = ftemp / ov ratio;
float ctemp = ov count avg * ov count;ctemp = ctemp + ov.count;ov count++;ov count avg = ctemp / ov count;
comparisons++;}values.Add(boatID, ov);
}public bool containsValue(long boatID){
return values.Contains(boatID);}public long longID{
get{
return lID;}
}}public class OutlierValue{
private float ratio;private int count;
99

public OutlierValue(float ratio, int count){
ratio = ratio;count = count;
}public float ratio{
get{
return ratio;}
}public int count{
get{
return count;}
}//possibly return a more accurate number ie. myvalue -
otherpublic int compareTo(OutlierValue other){
int output = 0;if ( ratio <= other.ratio && count >= other.count){
output = -1;}else{
output = 1;}
return output;}
}public class OutlierStat{
private ArrayList boats;public OutlierStat(){
boats = new ArrayList();}public void addAverage(OutlierValue ov){
boats.Add(ov);
100

}public OutlierValue getThreshold(float percent){
long count = 0;ArrayList aratio = new ArrayList();for (int i = 0; i < boats.Count; i++){
count = count + ((OutlierValue)boats[i]).count;//cant be a pattern if there is only 1 valueif (((OutlierValue)boats[i]).count > 1){
aratio.Add(((OutlierValue)boats[i]).ratio);//SqlContext.Pipe.Send(((OutlierValue)boats[
i ]).ratio.ToString());}
}int icount = (int)Math.Round((double)count / boats.Count);aratio.Sort();int index = (int)Math.Round((double)aratio.Count*percent);SqlContext.Pipe.Send("index: " + index.ToString());float fratio = (float)aratio[index];OutlierValue ov = new OutlierValue(fratio, icount);
return ov;}
}
}}
101

D.3 MS Access VB Scripts
CalculateAvgSecBehindOption Compare Database
Public Sub Main()Dim rst As DAO.RecordsetDim db As DAO.DatabaseSet db = CurrentDbDim strCriteria As String
Dim rstData As DAO.RecordsetDim rstdb As DAO.DatabaseSet rstdb = CurrentDbDim strSQL As StringstrSQL = "SELECT AVG(COR SEC BEHIND) AS AVGSEC FROM Results WHERE
BOAT ID="
’Copy ToSet rstData = rstdb.OpenRecordset("SELECT * FROM Boats")rstData.MoveFirst
With rstDataDo While Not .EOF
’Copy FromSet rst = db.OpenRecordset(strSQL & !ID & ";")rst.MoveFirst.Edit’Attributes to copy!AVG SEC BEHIND = rst!AVGSEC.Update.MoveNext
LoopEnd With
MsgBox "Finished Updateing Records"
rstData.Closerst.CloseSet rstData = NothingSet rst = Nothing
End Sub
CalculatePlaceOption Compare Database
102
Public Sub Main()
Dim strTime, strTemp As String
Dim intCount, intPlace As LongDim intNewRace, intCurRace As Long
Dim rstData As DAO.RecordsetDim rstdb As DAO.DatabaseSet rstdb = CurrentDb
’table to searchSet rstData = rstdb.OpenRecordset("SELECT * FROM Results ORDER
BY RACE ID, COR SEC")rstData.MoveFirstintCurRace = rstData!RACE IDintPlace = 0With rstData
Do While Not .EOFintNewRace = !RACE IDIf intNewRace = intCurRace Then
intPlace = intPlace + 1Else
intPlace = 1intCurRace = intNewRace
End If.Edit!COR PLACE = intPlaceintCount = intCount + 1.Update
.MoveNextLoop
End With
MsgBox "Finished Updateing " & intCount & " Records"
rstData.CloseSet rstData = Nothing
End Sub
CalculateSecBehindOption Compare Database
Public Sub Main()
103

Dim strTime, strTemp As String
Dim intCount, intTime As LongDim intNewRace, intNewTime, intCurRace, intCurTime As Long
Dim rstData As DAO.RecordsetDim rstdb As DAO.DatabaseSet rstdb = CurrentDb
’table to searchSet rstData = rstdb.OpenRecordset("SELECT * FROM Results ORDER
BY RACE ID, COR SEC")rstData.MoveFirstintCurRace = rstData!RACE IDintCurTime = rstData!COR SECWith rstData
Do While Not .EOFintNewRace = !RACE IDintNewTime = !COR SECIf intNewRace = intCurRace Then
intTime = intNewTime - intCurTimeElse
intTime = 0intCurRace = intNewRaceintCurTime = intNewTime
End If.Edit!COR SEC BEHIND = intTimeintCount = intCount + 1.Update
.MoveNextLoop
End With
MsgBox "Finished Updateing " & intCount & " Records"
rstData.CloseSet rstData = Nothing
End Sub
ConvertTimeToDistanceOption Compare Database
104

Public Sub Main()
Dim strFinish, strCorFinish, strCorrected, strElapsed As String
Dim intCount As IntegerDim intCorrected, intElapsed, intPHRF, intTemp As LongDim intFinish, intCorFinish, intDiff As LongDim dblDistance As Double
Dim rstData As DAO.RecordsetDim rstdb As DAO.DatabaseSet rstdb = CurrentDb
’table to searchSet rstData = rstdb.OpenRecordset("SELECT * FROM Results WHERE
RACE ID < 300;")rstData.MoveFirst
With rstDataDo While Not .EOF
strCorrected = !CORRECTEDintCorrected = StringToSec(strCorrected)strFinish = !FINISHintFinish = StringToSec(strFinish)strCorFinish = !COR FINISHintCorFinish = StringToSec(strCorFinish)intDiff = intFinish - intCorFinishintElapsed = intCorrected + intDiffstrElapsed = SecToString(intElapsed)intPHRF = !phrfIf intPHRF <> 0 Then
intTemp = intDiff / intPHRF * 100 ’keep two decimalplaces
dblDistance = intTemp / 100.Edit!DISTANCE = dblDistance!ELAPSED = strElapsedintCount = intCount + 1
.UpdateEnd If.MoveNext
LoopEnd With
MsgBox "Finished Updateing " & intCount & " Records"
105

rstData.CloseSet rstData = Nothing
End Sub
Public Function StringToSec(ByVal strTime As String) As LongDim intTime As LongDim intA, intB As Integer
intTime = 0intA = InStr(strTime, ":")
If intA > 0 ThenintB = InStr(intA + 1, strTime, ":")If intB > 0 Then
strTemp = Mid(strTime, 1, intA - 1)intTemp = Val(strTemp)intTime = intTemp * 3600 ’hoursstrTemp = Mid(strTime, intA + 1, intB - (intA + 1))intTemp = Val(strTemp)intTime = intTime + intTemp * 60 ’minutesstrTemp = Mid(strTime, intB + 1)intTemp = Val(strTemp)intTime = intTime + intTemp
End IfEnd IfStringToSec = intTime
End Function
Public Function SecToString(ByVal intTime As Long) As StringDim strTemp As StringDim intHour, intMin As LongintHour = Fix(intTime / 3600)strTemp = intHour & ":"intTime = intTime - intHour * 3600intMin = Fix(intTime / 60)If intMin < 10 Then
strTemp = strTemp & "0"End IfstrTemp = strTemp & intMin & ":"intTime = intTime - intMin * 60If intTime < 10 Then
strTemp = strTemp & "0"End IfstrTemp = strTemp & intTime
106

SecToString = strTemp
End Function
ConvertTimeToSecsOption Compare Database
Public Sub Main()
Dim strTime, strTemp As String
Dim intCount As LongDim intTime As LongDim intA, intB, intTemp As Long
Dim rstData As DAO.RecordsetDim rstdb As DAO.DatabaseSet rstdb = CurrentDb
’table to searchSet rstData = rstdb.OpenRecordset("SELECT * FROM Results")rstData.MoveFirst
With rstDataDo While Not .EOF
strTime = !CORRECTEDintTime = 0intA = InStr(strTime, ":")
If intA > 0 ThenintB = InStr(intA + 1, strTime, ":")If intB > 0 Then
strTemp = Mid(strTime, 1, intA - 1)intTemp = Val(strTemp)intTime = intTemp * 3600 ’hoursstrTemp = Mid(strTime, intA + 1, intB - (intA +
1))intTemp = Val(strTemp)intTime = intTime + intTemp * 60 ’minutesstrTemp = Mid(strTime, intB + 1)intTemp = Val(strTemp)intTime = intTime + intTemp.Edit!COR SEC = intTimeintCount = intCount + 1.Update
107

End IfEnd If.MoveNext
LoopEnd With
MsgBox "Finished Updateing " & intCount & " Records"
rstData.CloseSet rstData = Nothing
End Sub
CopyBoatDataOption Compare Database
Public Sub Main()Dim rst As DAO.RecordsetDim db As DAO.DatabaseSet db = CurrentDbDim strCriteria As String
Dim rstData As DAO.RecordsetDim rstdb As DAO.DatabaseSet rstdb = CurrentDbDim strSQL As String
’From Matching AttributestrCriteria = "[Boat Name] =’"
’Copy FromSet rst = db.OpenRecordset("SELECT * From SYCResults")rst.MoveFirst
’Copy ToSet rstData = rstdb.OpenRecordset("SELECT * FROM Boats WHERE CLUB=’syc’")
With rstDataDo While Not .EOF
’To Matching attributerst.FindFirst (strCriteria & !Name & "’")If rst.NoMatch Then
MsgBox "No entry found"Else
.Edit’Attributes to copy
108

!Type = rst!Boat Type!SAIL NUM = rst!SailNo.Update
End Ifrst.MoveFirst.MoveNext
LoopEnd With
MsgBox "Finished Updateing Records"
rstData.Closerst.CloseSet rstData = NothingSet rst = Nothing
End Sub
CopyBoatIDOption Compare Database
Public Sub Main()Dim rst As DAO.RecordsetDim db As DAO.DatabaseSet db = CurrentDbDim strCriteria As String
Dim rstData As DAO.RecordsetDim rstdb As DAO.DatabaseSet rstdb = CurrentDbDim strSQL As String
’From Matching AttributestrCriteria = "[NAME] =’"
’Copy FromSet rst = db.OpenRecordset("SELECT * From Boats WHERE CLUB=’syc’")rst.MoveFirst
’Copy ToSet rstData = rstdb.OpenRecordset("SELECT * FROM SYCResults")
With rstDataDo While Not .EOF
’To Matching attributerst.FindFirst (strCriteria & !Boat Name & "’")If rst.NoMatch Then
109

MsgBox "No entry found"Else
.Edit’Attributes to copy!BoatID = rst!ID.Update
End Ifrst.MoveFirst.MoveNext
LoopEnd With
MsgBox "Finished Updateing Records"
rstData.Closerst.CloseSet rstData = NothingSet rst = Nothing
End Sub
CopyRaceIDOption Compare Database
Public Sub Main()Dim rst As DAO.RecordsetDim db As DAO.DatabaseSet db = CurrentDbDim strCriteria As String
Dim rstData As DAO.RecordsetDim rstdb As DAO.DatabaseSet rstdb = CurrentDbDim strSQL As String
Dim intCount As IntegerintCount = 0’From Matching AttributestrCriteria = "[ORIGINAL] ="
’Copy FromSet rst = db.OpenRecordset("SELECT * From Races")rst.MoveFirst
’Copy ToSet rstData = rstdb.OpenRecordset("SELECT * FROM Results WHERE
RENAME FLAG=’w’")
110
With rstDataDo While Not .EOF
’To Matching attributerst.FindFirst (strCriteria & !RACE ID & "")If rst.NoMatch Then
MsgBox "No entry found"Else
.Edit’Attributes to copy!RACE ID = rst!IDintCount = intCount + 1.Update
End Ifrst.MoveFirst.MoveNext
LoopEnd With
MsgBox "Finished Updateing " & intCount & " Records"
rstData.Closerst.CloseSet rstData = NothingSet rst = Nothing
End Sub
DecimalScaleDISPOption Compare Database
Public Sub Main()
Dim strFinish, strCorFinish, strCorrected, strElapsed As String
Dim intCount As IntegerDim dblDisp As Double
Dim rstData As DAO.RecordsetDim rstdb As DAO.DatabaseSet rstdb = CurrentDb
’table to searchSet rstData = rstdb.OpenRecordset("SELECT DISP FROM BoatTypes
WHERE ID > 423 AND DISP IS NOT NULL;")rstData.MoveFirst
111

With rstDataDo While Not .EOF
If !DISP <> 0 ThendblDisp = !DISPdblDisp = dblDisp / 1000.Edit!DISP = dblDispintCount = intCount + 1.Update
End If.MoveNext
LoopEnd With
MsgBox "Finished Updateing " & intCount & " Records"
rstData.CloseSet rstData = Nothing
End Sub
FindDuplicatesOption Compare Database
Public Sub Main()
Dim strCurRace As StringDim strNewRace As StringDim strNewBoat As StringDim strNewBoata As StringDim strCurBoat As String
Dim intCount As IntegerDim intTotal As Integer
Dim d As New Dictionaryd.CompareMode = BinaryCompare
Dim rstData As DAO.RecordsetDim rstdb As DAO.DatabaseSet rstdb = CurrentDbDim strSQL As String
’On Error GoTo NoPart’table to search
112
Set rstData = rstdb.OpenRecordset("SELECT * FROM SYCResults ORDERBY Race, Start, Finish, Place")
rstData.MoveFirststrCurRace = rstData!RaceintCount = 0strNewBoata = rstData!Boat Named.Add strNewBoata, "1"rstData.MoveNextintTotal = 1
With rstDataDo While Not .EOF
strNewRace = !RacestrNewBoat = !Boat NameIf strNewRace = strCurRace Then
’if not found just add itIf Not d.Exists(strNewBoat) Then
d.Add strNewBoat, "1"Else ’otherwise we have duplicate names so change race
namestrCurBoat = d.Item(strNewBoat)Dim num As Integernum = Val(strCurBoat)num = num + 1d.Item(strNewBoat) = "" & num’d.Remove (strNewBoat)’d.Add strNewBoat, "" & num
.Edit!Race = !Race & " " & numintCount = intCount + 1.Update
End IfElse ’start a new cycle
strCurRace = strNewRaced.RemoveAlld.Add Key:=strNewBoat, Item:="1"
End If.MoveNextintTotal = intTotal + 1
LoopEnd With
MsgBox "Finished Updateing " & intCount & " Records"
113
rstData.CloseSet rstData = NothingExit Sub
NoPart:rstData.CloseSet rstData = Nothing
MsgBox ("The Part Code: "& strNewBoat & strCurBoat& " could not be found")
End Sub
FindMostCurrentPHRFOption Compare Database
Public Sub Main()Dim rst As DAO.RecordsetDim db As DAO.DatabaseSet db = CurrentDbDim strCriteria As String
Dim rstData As DAO.RecordsetDim rstdb As DAO.DatabaseSet rstdb = CurrentDbDim strSQL As String
’From Matching AttributestrCriteria = "[BOAT ID] ="
’Copy FromSet rst = db.OpenRecordset("SELECT * FROM Results, Boats, Races
WHERE Results.BOAT ID=Boats.ID AND Results.RACE ID=Races.ID ORDER BYRaces.YEAR DESC;")
rst.MoveFirst
’Copy ToSet rstData = rstdb.OpenRecordset("SELECT * FROM Boats")rstData.MoveFirst
With rstDataDo While Not .EOF
’To Matching attributerst.FindFirst (strCriteria & !ID)If rst.NoMatch Then
MsgBox "No entry found"
114
Else.Edit’Attributes to copy!CUR PHRF = rst!phrf.Update
End Ifrst.MoveFirst.MoveNext
LoopEnd With
MsgBox "Finished Updateing Records"
rstData.Closerst.CloseSet rstData = NothingSet rst = Nothing
End Sub
FindNumberofRacesOption Compare Database
Public Sub Main()Dim rst As DAO.RecordsetDim db As DAO.DatabaseSet db = CurrentDbDim strCriteria As String
Dim rstData As DAO.RecordsetDim rstdb As DAO.DatabaseSet rstdb = CurrentDbDim strSQL As StringstrSQL = "SELECT COUNT(*) AS NUM FROM Results WHERE BOAT ID="
’Copy ToSet rstData = rstdb.OpenRecordset("SELECT * FROM Boats")rstData.MoveFirst
With rstDataDo While Not .EOF
’Copy FromSet rst = db.OpenRecordset(strSQL & !ID & ";")rst.MoveFirst.Edit’Attributes to copy!NUM OF RACES = rst!num
115

.Update
.MoveNextLoop
End With
MsgBox "Finished Updateing Records"
rstData.Closerst.CloseSet rstData = NothingSet rst = Nothing
End Sub
MakeNewRacesOption Compare Database
Public Sub Main()Dim rst As DAO.RecordsetDim db As DAO.DatabaseSet db = CurrentDbDim strCriteria As String
Dim rstData As DAO.RecordsetDim rstdb As DAO.DatabaseSet rstdb = CurrentDbDim strSQL As StringstrSQL = "INSERT INTO Races (CLUB, YEAR, NAME, ORIGINAL) VALUES
(’"
’Copy ToSet rstData = rstdb.OpenRecordset("SELECT DISTINCT Results.RACE ID,
Races.NAME, Races.CLUB, Races.YEAR FROM Results, Races WHERE Results.RACE ID=Races.IDAND RENAME FLAG=’w’;")
rstData.MoveFirst
With rstDataDo While Not .EOF
’Copy Fromdb.Execute (strSQL & !CLUB & "’,’" & !Year & "’,’" & !Name
& "’," & !RACE ID & ");")
.MoveNextLoop
End With
MsgBox "Finished Updateing Records"
116

rstData.CloseSet rstData = Nothing
End Sub
117

D.4 Java Data Parser and Preprocessor
/** Parse.java** Created on August 21, 2007, 12:21 AM** To change this template, choose Tools | Template Manager* and open the template in the editor.*/
package sailparser;
import com.sun.org.apache.bcel.internal.generic.ARRAYLENGTH;import java.awt.Frame;import java.io.BufferedReader;import java.io.BufferedWriter;import java.io.DataInputStream;import java.io.File;import java.io.FileInputStream;import java.io.FileWriter;import java.io.IOException;import java.io.InputStreamReader;import java.util.Arrays;import java.util.regex.*;import javax.swing.JFileChooser;
/**** @author Owner*/
public class Parse {/*private String[] tokens = {"\\b[\\s]{2,}\\b","[0-9] [0-9]","FUN
USY","LIA STW","NTO CAT", "JOY CAT", "II OLS"};private int[] offsets = {0,1,3,3,3,3,3};private int[] endoffset = {0,-1,-3,-3,-3,-3,-3};private String[] match = {"SPEND 2 0", "^[\\s]{4,}\\b","’","<B>","</B>"};private String[] replace = {"SPEND 2-0", " 0 ", "", "", ""};private int columns = 8;*//*private String[] tokens = {"</DIV>"};private int[] offsets = {6};private int[] endoffset = {6};private String[] match = {"</DIV>$"};private String[] replace = {""};private int columns = 8;*/private String[] tokens = {"</[Tt][Dd]>"};
118
private int[] offsets = {0};private int[] endoffset = {5};private String[] match = {"</[Tt][Dd]>$","</[Tt][Rr]>"};private String[] replace = {"",""};private int columns = 12;private String clusterdir;
/** Creates a new instance of Main */public Parse() {
clusterdir = "";}
public void run(){Frame parent = new Frame();final JFileChooser fc = new JFileChooser();File[] files = null;FileInputStream fstream; DataInputStream in = null; BufferedReader
br;FileWriter fw; BufferedWriter bw = null;//select directoryfc.setFileSelectionMode(JFileChooser.DIRECTORIES ONLY);int returnVal = fc.showOpenDialog(parent);if (returnVal == JFileChooser.APPROVE OPTION) {
File file = fc.getSelectedFile();files = file.listFiles();
} else {files = new File[0];
}try{
fw = new FileWriter ("output.txt");bw = new BufferedWriter(fw);
}catch(IOException ioe){System.out.println(ioe.getStackTrace());
}for(int i = 0; i < files.length; i++){
if(files[i].isFile()){try{
fstream = new FileInputStream(files[i]);in = new DataInputStream(fstream);br = new BufferedReader(new InputStreamReader(in));
String strLine;//Read the file line by line
119

while ((strLine = br.readLine()) != null) {//do any defined replacesfor(int k = 0; k < match.length; k ++){
strLine = strLine.replaceAll(match[k],replace[k]);}
String outLine = "";int count = 1;
int lastend = 0;int[] starts = new int[columns + 1];for(int k = 0; k < columns; k++){
starts[k]=-1;}starts[0] = 0;starts[columns] = strLine.length();//go through all of the tokensfor(int j = 0; j < tokens.length; j++){Pattern pattern =Pattern.compile(tokens[j]);
Matcher matcher =pattern.matcher(strLine);
while (matcher.find()) {//System.out.print("Match: "+matcher.start()+"-"+matcher.end()+
"\"" +matcher.group()+"\"");if(count < columns){starts[count] = matcher.start()+offsets[j];}count++;
}
//System.out.println("");}Arrays.sort(starts);for(int k = 0; k < columns; k++){int pstart = starts[k];int pend = starts[k+1];if(pstart < pend && pstart >= 0 ){
String extracted = strLine.substring(pstart,pend);extracted = extracted.trim();outLine += extracted;if(k < columns) outLine += ", ";
120
}else{//System.out.print("Error: " + pstart + "-" + pend
+ " ");}}outLine += "" + files[i].getAbsolutePath();//System.out.println(outLine);//write the output if it has the correct amount of columnsif(count == columns){
bw.write(outLine);bw.newLine();
}
}in.close();}catch(IOException ioe){
System.out.println(ioe.getStackTrace());}
}
}try{bw.close();}catch(IOException ioe){
System.out.println(ioe.getStackTrace());}
parent.dispose();System.out.println("Run Complete");
}/*** @param args the command line arguments*/public static void main(String[] args) {
Parse p = new Parse();p.run();
}
}/** Preprocess.java** Created on August 30, 2007, 12:10 PM** To change this template, choose Tools | Template Manager* and open the template in the editor.
121

*/
package sailparser;
import java.awt.*;import java.io.*;import java.util.regex.*;import javax.swing.*;
/**** @author Owner*/
public class Preprocess {//rvyc div style/* private String[] match = { "\n","<DIV style=\"[^\"]+\">","<span
class=\"[^\"]+\">","</span>"," "};private String[] replace = {"", "", "", "", ""};private String tokenpattern = ";top:[0-9]+PX;";private boolean isunique = true;*/private String[] match = { "[\n\f\r]","<[Tt][Dd][^>]*>","<font[^>]*>","<tr[^>]*>"," ","</font>"};private String[] replace = {"", "", "", "", "",""};private String tokenpattern = "</[Tt][Rr]>";private boolean isunique = false;/** Creates a new instance of Preprocess */public Preprocess() {}public void run(){
Frame parent = new Frame();final JFileChooser fc = new JFileChooser();File[] files = null;FileInputStream fstream; DataInputStream in = null; BufferedReader
br;FileWriter fw; BufferedWriter bw = null;//select directoryfc.setFileSelectionMode(JFileChooser.DIRECTORIES ONLY);int returnVal = fc.showOpenDialog(parent);if (returnVal == JFileChooser.APPROVE OPTION) {
File file = fc.getSelectedFile();files = file.listFiles();
} else {files = new File[0];
}for(int i = 0; i < files.length; i++){
if(files[i].isFile()){try{
122

fw = new FileWriter ("new " + files[i].getName());bw = new BufferedWriter(fw);fstream = new FileInputStream(files[i]);in = new DataInputStream(fstream);br = new BufferedReader(new InputStreamReader(in));
String oldToken = "";String strLine;//Read the file line by linewhile ((strLine = br.readLine()) != null) {
//get the line token firstPattern pattern =Pattern.compile(tokenpattern);
Matcher matcher =pattern.matcher(strLine);String newToken = "";if(matcher.find()) newToken = matcher.group();//System.out.println("\"" + newToken + "\" - \"" +
oldToken + "\"");//do any defined replacesfor(int k = 0; k < match.length; k ++){
strLine = strLine.replaceAll(match[k],replace[k]);}if(isunique){if(!oldToken.equals(newToken) && !oldToken.equals("")){
strLine = "\n" + strLine;}}else if(!newToken.equals("")){
strLine = "\n" + strLine;}else if(oldToken.equals("") && newToken.equals("")){
//strLine = "\n" + strLine;}oldToken = newToken;bw.write(strLine);
}in.close();bw.close();
}catch(IOException ioe){System.out.println(ioe.getStackTrace());
}}
}parent.dispose();System.out.println("Run Complete");
}
123

/*** @param args the command line arguments*/public static void main(String[] args) {
Preprocess p = new Preprocess();p.run();
}}
124

Source Code 6 Batch file to get data from databaseREM get aggregate datasetbcp ”SELECT b.BoatID, b.CUR PHRF, b.BoatType, b.Races,b.AVG SEC BEHIND, b.AVG SKILL SEC, t.I, t.J, t.P, t.E,t.LWL, t.DRFT, t.DISP FROM sailwater.dbo.Boat AS b, sail-water.dbo.BoatTypes AS t WHERE b.STANDARD=t.ID Andt.I Is Not Null And t.DRFT Is Not Null And t.DISP Is NotNull;” queryout c:\boat.txt -c -S JACSAT\SQLEXPRESS -Usa-Ppassword -t”,”REM get full datasetbcp ”SELECT r.RACE ID, r.BOAT ID, r.PHRF,r.COR SEC BEHIND, r.SKILL SEC BEHIND, b.BoatType,b.Races, b.AVG SEC BEHIND, b.AVG SKILL SEC, t.I, t.J, t.P,t.E, t.LWL, t.DRFT, t.DISP FROM sailwater.dbo.Result AS r,sailwater.dbo.Boat AS b, sailwater.dbo.BoatTypes AS t WHEREr.BOAT ID=b.BoatID AND b.STANDARD=t.ID AND t.I Is NotNull AND t.DRFT Is Not Null AND t.DISP Is Not Null;” queryoutc:\boatall.txt -c -S JACSAT\SQLEXPRESS -Usa -Ppassword -t”,”pause
125