machine learning embedded adaptive systemsdevika/conflict/papers/ijcai.pdfstrategy for the system at...
TRANSCRIPT

1
Adaptive embedded systemsTwo applications to society
Devika SubramanianDepartment of Computer Science
Rice Universityhttp://www.cs.rice.edu/~devika
Embedded Systems
System
EnvironmentEnvironment
actions
observations
Observation driven, task-specific decision making
Machine Learning
LearningalgorithmTraining data
Prior knowledgePredictive model
Embedded Adaptive Systems
System fora task
EnvironmentEnvironment
actions
observations
Calculate decisions on the basis of learned models of systems
Learningalgorithm
Prior knowledgeModel
Why embed learning?We cannot calculate and implement an action-choice/decision-making strategy for the system at design time.
System dynamics are unknown/partially known.System dynamics change with time.A one-size-fits-all solution is not appropriate – customization is needed.
Research questions in adaptive embedded system design
Representation: What aspects of the task, environment and system dynamics do we need to observe and model for decision making? Learning: How can we build and maintain embedded models in changing environments?Decision making/acting: How can we use these models effectively to make decisions with scarce resources in changing environments?

2
ApproachDesign and validate algorithms for large-scale real world, socially relevant problems.Publish in the application community journals; get community to routinely use the methods.Abstract task-level analysis and present methods to the AI community.
Roadmap of talkTwo case-studies
Unknown system, changing dynamicsTracking human learning on a complex visual-motor task. Predicting the evolution of international conflict.
Submarine School 101The NRL Navigation Task
50% of class weeded out by this game!
•Pilot a submarine to a goal through a minefield in a limited time period
•Distance to mines revealed via seven discrete sonars
•Time remaining, as-the-crow-flies distance to goal, and bearing to goal is given
•Actions communicated via a joystick interface
The NRL Navigation Task
Mine configurationchanges with everygame.
Game has a strategicand a visual-motorcomponent!
Learning curves
01020
3040506070
8090
100
1 50 99 148
197
246
295
344
393
442
491
540
589
638
687
736
Episode
Succ
ess
%
S3
S4
S5S1
S2
Successful learnerslook similar: plateausbetween improvements
Unsuccessfullearners areDOA!
Navy takes 5 days to tell if a person succeeds/fails.
Task QuestionsIs the game hard? What is the source of complexity?Why does human performance plateau out at 80%? Is that a feature of the human learning system or the game? Can machine learners achieve higher levels of competence?Can we understand why humans learn/fail to learn the task? Can we detect inability to learn early enough to intervene?How can we actively shape human learning on this task?

3
Mathematical characteristics of the NRL task
A partially observable Markov decision process which can be made fully observable by augmentation of state with previous action.State space of size 1014, at each step a choice of 153 actions (17 turns and 9 speeds).Feedback at the end of up to 200 steps.Challenging for both humans and machines.
Reinforcement learning
Learner
Task
action
Feedback/reward
state
s1,a1,r1,s2,a2,r2,……….
Reinforcement Learning, Barto and Sutton, MIT Press, 1998.
Reinforcement learning/NRL task
Representational hurdlesState and action spaces have to be manageably small.Good intermediate feedback in the form of a non-deceptive progress function needed.
Algorithmic hurdlesAppropriate credit assignment policy needed to handle the two types of failures (timeouts and explosions are different).Q-learning is too slow to converge (because there are up to 200 steps in a single training episode).
State space design
Binary distinction on sonar: is it > 50?Six equivalence classes on bearing: 12, {1,2}, {3,4}, {5,6,7},{8,9}, {10,11}State space size = 27 * 6 = 768.Discretization of actions
speed: 0, 20 and 40.turn: -32, -16, -8, 0, 8, 16, 32.
Automated discovery of abstract state spaces for reinforcement learning,Griffin and Subramanian, 2001.
The dense reward function
r(s,a,s’) = 0 if s’ is a state where player hits mine.= 1 if s’ is a goal state= 0.5 if s’ is a timeout state
= 0.75 if s is an all-blocked state and s’ is a not-all-blocked state= 0.5 + Diff in sum of sonars/1000 if s’ is an all-blocked state= 0.5 + Diff in range/1000 + abs(bearing - 6)/40 otherwise
Credit assignment policy
Penalize the last action alone in a sequence which ends in an explosion.Penalize all actions in sequence which ends in a timeout.
4
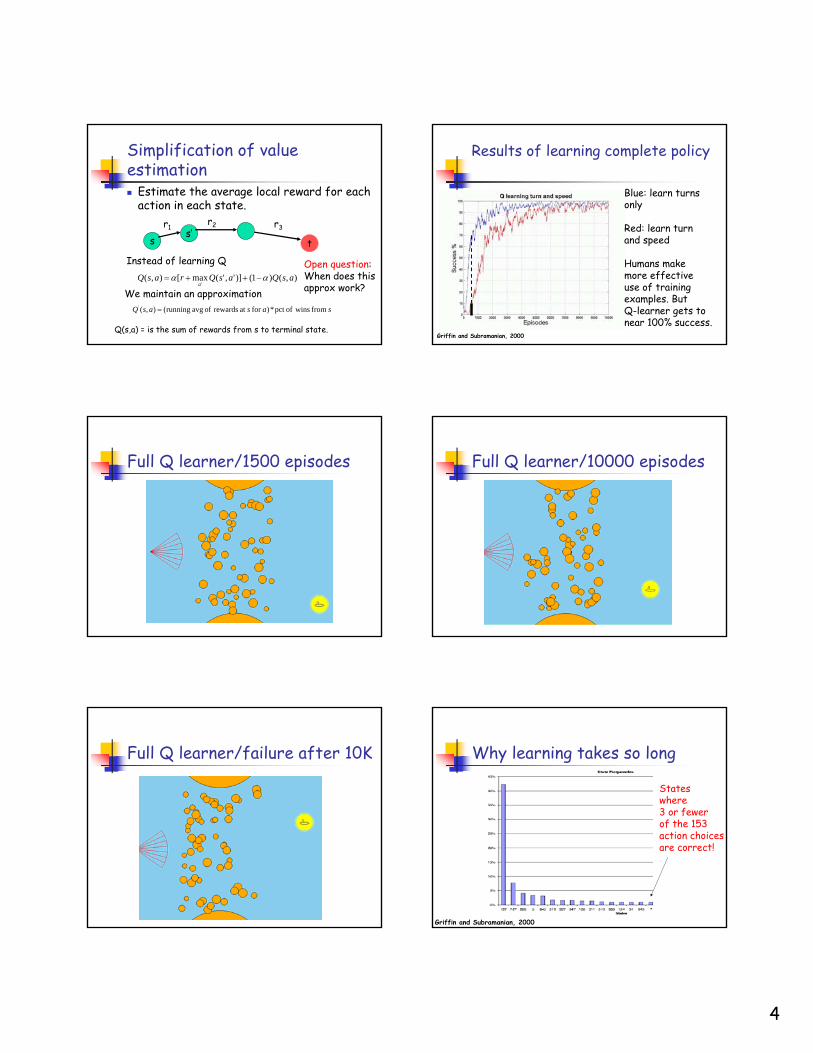
Simplification of value estimation
Estimate the average local reward for each action in each state.
ss’
t
Q(s,a) = is the sum of rewards from s to terminal state.
r1r2 r3
),()1()]','(max[),('
asQasQrasQa
αα −++=
Instead of learning Q
We maintain an approximationsasasQ from winsofpct *)for at rewards of avg running(),(' =
Open question:When does thisapprox work?
Results of learning complete policy
Blue: learn turnsonly
Red: learn turnand speed
Humans makemore effectiveuse of trainingexamples. ButQ-learner gets tonear 100% success.
Griffin and Subramanian, 2000
Full Q learner/1500 episodes Full Q learner/10000 episodes
Full Q learner/failure after 10K Why learning takes so long
Stateswhere3 or fewerof the 153action choicesare correct!
Griffin and Subramanian, 2000

5
Lessons from machine learningTask level
Task is hard because states in which action choice is critical occur less than 5% of the time.Staged learning makes task significantly easierA locally non-deceptive reward function speeds up learning.
Reinforcement learningLong sequence of moves makes credit assignment
hard; a new cheap approximation to global value function makes learning possible for such problems.Algorithm for automatic discretization of large, irregular state spaces.
Griffin and Subramanian, 2000, 2001
Task QuestionsIs the game hard? Is it hard for machines? What is the source of complexity?Why does human performance plateau out at 80%? Is that a feature of the human learning system or the game? Can machine learners achieve higher levels of competence?Can we understand why humans learn/fail to learn the task? Can we detect inability to learn early enough to intervene?How can we actively shape human learning on this task?
Tracking human learning
(sensor panel,joystick action)
Learningalgorithm
Prior knowledgeModel
Strategy mappingsensor panelsto joystickaction
(time coursedata)
Interventionsto aidlearning
Extract strategy and study its evolution over time
ChallengesHigh-dimensionality of visual data (11 dimensions spanning a space of size 1014)Large volumes of dataNoise in dataNon-stationarity: policies change over time
Embedded learner designRepresentation
Use raw visual-motor data stream to induce policies/strategies.
LearningDirect models: lookup table mapping sensors at time t and action at t-1 to distribution of actions at time t. (1st order Markov model)
Decision-makingCompute “derivative” of the policies over time, and use it (1) to classify learner and select interventions, (2) to build behaviorally equivalent models of subjects
Strategy: mapping from sensors to action distributions
w
Window ofw games
6
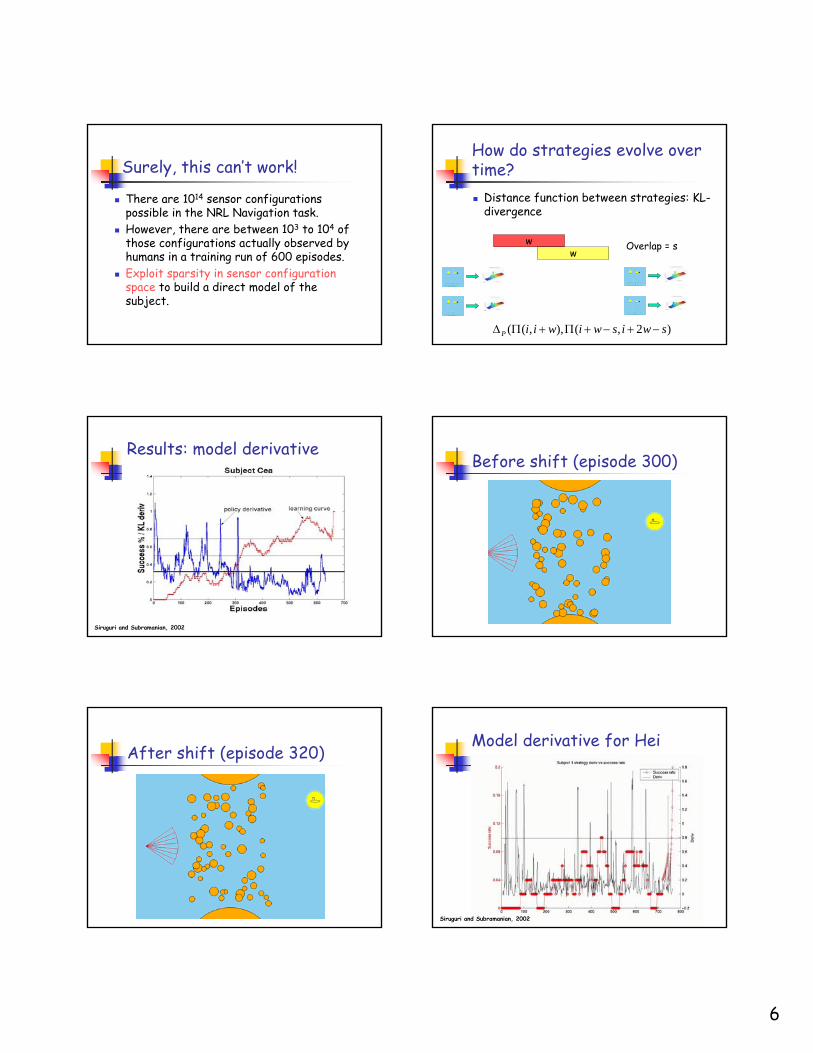
Surely, this can’t work!
There are 1014 sensor configurations possible in the NRL Navigation task.However, there are between 103 to 104 of those configurations actually observed by humans in a training run of 600 episodes.Exploit sparsity in sensor configuration space to build a direct model of the subject.
How do strategies evolve over time?
Distance function between strategies: KL-divergence
)2,(),,(( swiswiwiiP −+−+Π+ΠΔ
ww
Overlap = s
Results: model derivative
Siruguri and Subramanian, 2002
Before shift (episode 300)
After shift (episode 320)Model derivative for Hei
Siruguri and Subramanian, 2002

7
How humans learn
Subjects have relatively static periods of action policy choice punctuated by radical shifts.Successful learners have conceptual shifts during the first part of training; unsuccessful ones keep trying till the end of the protocol!
Behaviorally equivalent modelsModel
NRL task
Generating behaviorally equivalent models
To compute action a associated with current sensor configuration s in a given segment,
take 100 neighbors of s in lookup table.perform locally weighted regression (LWR) on these 100 (s,a) pairs.
Subject Cea: Day 5: 1
Subject Model
Subject Cea: Day 5: 2
Subject Model
Subject Cea: day 5: 3
Subject Model

8
Subject Cea: Day 5: 4
Subject Model
Subject Cea: Day 5: 5
Subject Model
Subject Cea: Day 5: 6
Subject Model
Subject Cea: Day 5: 7
Subject Model
Subject Cea: Day 5: 8
Subject Model
Subject Cea: Day 5: 9
Subject Model

9
Comparison with global methods
Siruguri and Subramanian, 2002
SummaryWe can model subjects on the NRL task in real-time, achieving excellent fits to their learning curves, using the available visual-motor data stream.One of the first in cognitive science to directly use objective visual-motor performance data to derive evolution of strategy on a complex task.
Where’s the science? Lessons Learn simple models from objective, low-level data!Non-stationarity is commonplace, need to design algorithms robust with respect to it.Fast new algorithms for detecting change-points and building predictive stochastic models for massive, noisy, non-stationary, vector time series data.
Neural correlates
Are there neural correlates to strategy shifts observed in the visual-motor data?
Task QuestionsCan we adapt training protocols in the NRL task by identifying whether subjects are struggling with strategy formulation or visual-motor control or both?Can we use analysis of EEG data gathered during learning as well as visual-motor performance data to correlate ‘brain events’ with ‘visual-motor performance events’? Can this correlation separate subjects with different learning difficulties?

10
The (new) NRL Navigation Task Gathering performance data
256 channel EEG recording
Fusing EEG and visualmotor data
EEGData
Artifact Removal
Coherence computation
Visualization Mechanism
PerformanceData
The coherence functionCoherence provides the means to measure synchronous activity between two brain areasA function that calculates the normalized cross-power spectrum, a measure of similarity of signal in the frequency domain
)]()([|)(|
)(2
fSfSfS
fCyyxx
xyxy =
Frequency bandsCoherence map of connections in each band
Δ (0-5 Hz)θ (5-9 Hz)α (9-14 Hz)β (14-30 Hz)γ (40-52 Hz)
Topological coherence map
Front
Back

11
Target
Target - control Target - control
Target
Control Control
Subject moh progression chart
Results (subject moh) Results
Subject bil progression chart
Results (subject bil)
Baluch, Zouridakis, Stevenson and Subramanian, 2005, 2006
Subject G
Subject is inskill refinementphase
Subject is a near-expert performer
Baluch, Zouridakis, Stevenson and Subramanian, 2005, 2006

12
Subject VSubjectneverlearned agood strategy
It wasn’tfor lack of trying..
Baluch, Zouridakis, Stevenson and Subramanian, 2005, 2006
There are distinct EEG coherence map signatures associated with different learning difficulties
Lack of strategy Shifting between too many strategies
Subjects in our study who showed a move from a low level of performance to a high level of performance show front to back synchrony in the gamma range or long range gamma synchrony (LRGS). We are conducting experiments on more subjects to confirm these findings. (14 subjects so far, and more are being collected right now.)
Results
What else is this good for?Using EEG readouts to analyze the effectiveness of video games for relieving pre-operative stress in children (A. Patel, UMDNJ).Using EEG to read emotional state of players in immersive video games (M. Zyda, USC).Analyzing human performance on any visualmotor task with significant strategic component.
Details, please……
PublicationsHuman Learning and the Neural Correlates of Strategy Formulation, F. Baluch, D. Subramanian and G. Zouridakis, 23rd Annual Conference on Biomedical Engineering Research, 2006.Understanding Human Learning on Complex Tasks by Functional Brain Imaging, D. Subramanian, R. Bandyopadhyay and G. Zouridakis, 20th Annual Conference on Biomedical Engineering Research, 2003.Tracking the evolution of learning on a visualmotor task Devika Subramanian and Sameer Siruguri, Technical report TR02-401, Department of Computer Science, Rice University, August 2002. Tracking the evolution of learning on a visualmotor task Sameer Siruguri, Master's thesis under the supervision of Devika Subramanian, May 2001. State Space Discretization and Reinforcement Learning, S. Griffin and D. Subramanian, Technical report, Department of Computer Science, Rice University, June 2000.Inducing hybrid models of learning from visualmotor data , Proceedings of the 22nd Annual Conference of the Cognitive Science Society, Philadelphia, PA, 2000. Modeling individual differences on the NRL Navigation task, Proceedings of the 20th Annual Conference of the Cognitive Science Society, Madison, WI, 1998 (with D. Gordon). A cognitive model of learning to navigate, Proceedings of the 19th Annual Conference of the Cognitive Science Society, Stanford, CA, 1997 (with D. Gordon). Cognitive modeling of action selection learning, Proceedings of the 18th Annual Conference of the Cognitive Science Society, San Diego, 1996 (with D. Gordon)
Roadmap of talkFour case-studies
Unknown system, changing dynamicsTracking human learning on a complex visual-motor task. Predicting the evolution of international conflict.

13
Adaptive Systems
System
The worldThe world
Early warningof conflict
Wire newsLearningalgorithm
Prior knowledgeModel
Models ofconflict evolution
Task QuestionIs it possible to monitor news media from regions all over the world over extended periods of time, extracting low-level eventsfrom them, and piece them together to automatically track and predict conflict in all the regions of the world?
The Ares project
OnlineInformationSources
OnlineInformationSources
RiceEventData
Extractor
Singularitydetection
Hubs &Authorities
Models
AP, AFP,BBC, Reuters,…
Over 1 millionarticles on theMiddle East from1979 to 2005 (filtered automatically)
http://ares.cs.rice.edu
Analysis of wire stories
Date Actor Target W eis Code Wies event Goldstein scale790415 ARB ISR 223 (MIL ENGAGEMENT) -10790415 EGY AFD 194 (HALT NEGOTIATION) -3.8790415 PALPL ISR 223 (MIL ENGAGEMENT) -10790415 UNK ISR 223 (MIL ENGAGEMENT) -10790415 ISR EGY 31 (MEET) 1790415 EGY ISR 31 (MEET) 1790415 ISRMIL PAL 223 (MIL ENGAGEMENT) -10790415 PALPL JOR 223 (MIL ENGAGEMENT) -10790415 EGY AFD 193 (CUT AID) -5.6790415 IRQ EGY 31 (MEET) 1790415 EGY IRQ 31 (MEET) 1790415 ARB CHR 223 (MIL ENGAGEMENT) -10790415 JOR AUS 32 (VISIT) 1.9790415 UGA CHR 32 (VISIT) 1.9790415 ISRGOV ISRSET 54 (ASSURE) 2.8
Singularity detectionon aggregated eventsdata
Hubs and authoritiesanalysis of eventsdata
Relevance filter
Embedded learner designRepresentation
Identify relevant stories, extract event data from them, build time series models and graph-theoretic models.
LearningIdentifying regime shifts in events data, tracking evolution of militarized interstate disputes (MIDs) by hubs/authorities analysis of events data
Decision-makingIssuing early warnings of outbreak of MIDs
Identifying relevant storiesOnly about 20% of stories contain events that are to be extracted.
The rest are interpretations, (e.g., op-eds), or are events not about conflict (e.g., sports)
We have trained Naïve Bayes (precision 86% and recall 81%), SVM classifiers (precision 92% and recall 89%) & Okapi classifiers (precision 93% and recall 87%) using a labeled set of 180,000 stories from Reuters. Surprisingly difficult problem!
Lack of large labeled data sets; Poor transfer to other sources (AP/BBC)The category of “event containing stories” is not well-separated from others, and changes with time
Lee, Tran, Singer, Subramanian, 2006

14
Okapi classifierReuters data set: relevant categories are GVIO, GDIP, G13; irrelevant categories: 1POL, 2ECO, 3SPO, ECAT, G12, G131, GDEF, GPOL
Irr
RelNew article
Decision rule: sum of top N Okapi scores in Rel set >sum of top N Okapi scores in Irr setthen classify as rel; else irr
Okapi measure takestwo articles and givesthe similarity between them.
Event extraction
Parse sentence
Klein and Manning parser
Pronoun de-referencing
Sentence fragmentation
Correlative conjunctions
Extract embedded sentences (SBAR)
Conditional random fieldsWe extract who (actor) did what (event) to whom (target)
Not exactly the same as NER

15
Results
200 Reuters sentences; hand-labeled with actor, target,and event codes (22 and 02).
TABARIis stateof the artcoderin politicalscience
Stepinksi, Stoll, Subramanian 2006
Events data
177,336 events from April 1979 to October 2003 in Levantdata set (KEDS).
Date Actor Target Weis Code Wies event Goldstein scale790415 ARB ISR 223 (MIL ENGAGEMENT) -10790415 EGY AFD 194 (HALT NEGOTIATION) -3.8790415 PALPL ISR 223 (MIL ENGAGEMENT) -10790415 UNK ISR 223 (MIL ENGAGEMENT) -10790415 ISR EGY 31 (MEET) 1790415 EGY ISR 31 (MEET) 1790415 ISRMIL PAL 223 (MIL ENGAGEMENT) -10790415 PALPL JOR 223 (MIL ENGAGEMENT) -10790415 EGY AFD 193 (CUT AID) -5.6790415 IRQ EGY 31 (MEET) 1790415 EGY IRQ 31 (MEET) 1790415 ARB CHR 223 (MIL ENGAGEMENT) -10790415 JOR AUS 32 (VISIT) 1.9790415 UGA CHR 32 (VISIT) 1.9790415 ISRGOV ISRSET 54 (ASSURE) 2.8
What can be predicted?Singularity detection
Stoll and Subramanian, 2004, 2006
Singularities = MID start/endbiweek Date
rangeevent
17-35 11/79 to 8/80
Start of Iran/Iraq war
105-111 4/83 to 7/83
Beirut suicide attack, end of Iran/Iraq war
244 1/91 to 2/91 Desert Storm
413-425 1/95 to 7/95 Rabin assassination/start of Intifada
483-518 10/97 to 2/99
US/Iraq confrontation via Richard Butler/arms inspectors
522-539 4/99 to 11/99
Second intifada Israel/Palestine
Interaction graphsModel interactions between countries in a directed graph.
Date Actor Target Weis Code Wies event Goldstein scale790415 ARB ISR 223 (MIL ENGAGEMENT) -10790415 EGY AFD 194 (HALT NEGOTIATION) -3.8790415 PALPL ISR 223 (MIL ENGAGEMENT) -10790415 UNK ISR 223 (MIL ENGAGEMENT) -10790415 ISR EGY 31 (MEET) 1
ARB ISR
EGY UNK
AFD PALPL
16
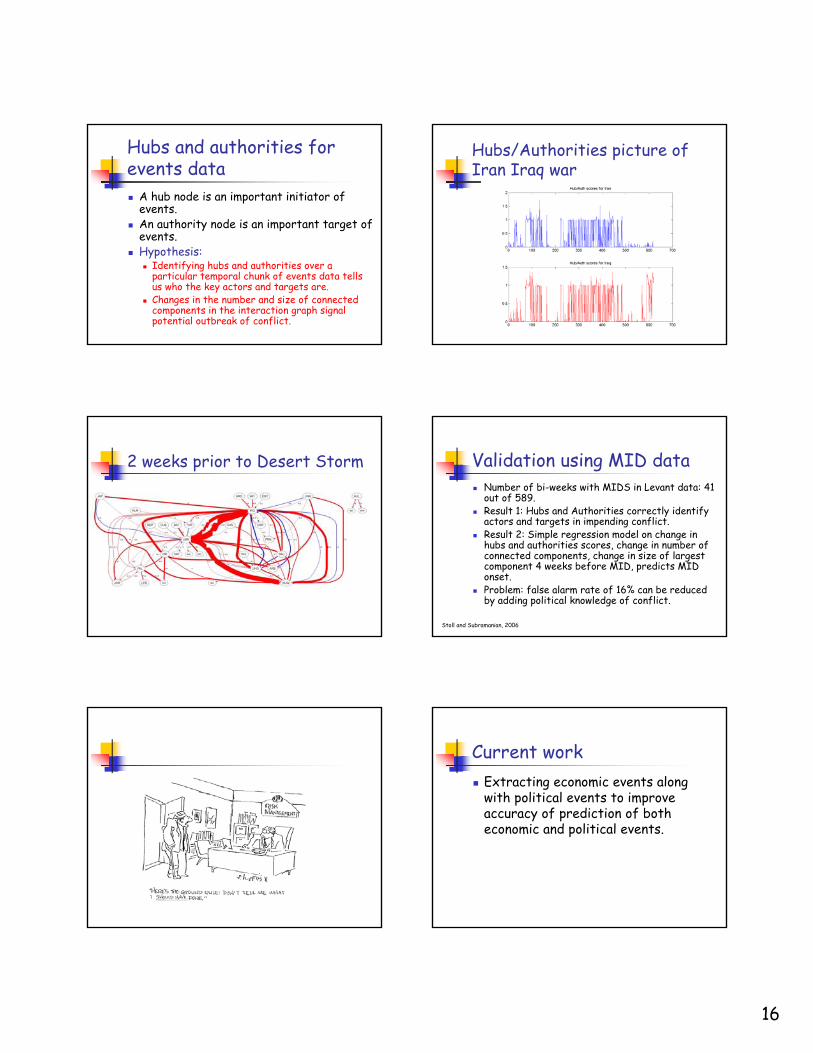
Hubs and authorities for events data
A hub node is an important initiator of events.An authority node is an important target of events.Hypothesis:
Identifying hubs and authorities over a particular temporal chunk of events data tells us who the key actors and targets are.Changes in the number and size of connected components in the interaction graph signal potential outbreak of conflict.
Hubs/Authorities picture of Iran Iraq war
2 weeks prior to Desert Storm Validation using MID dataNumber of bi-weeks with MIDS in Levant data: 41 out of 589.Result 1: Hubs and Authorities correctly identify actors and targets in impending conflict.Result 2: Simple regression model on change in hubs and authorities scores, change in number of connected components, change in size of largest component 4 weeks before MID, predicts MID onset.Problem: false alarm rate of 16% can be reduced by adding political knowledge of conflict.
Stoll and Subramanian, 2006
Current workExtracting economic events along with political events to improve accuracy of prediction of both economic and political events.

17
PublicationsAn OKAPI-based approach for article filtering, Lee, Than, Stoll, Subramanian, 2006 Rice University Technical Report.Hubs, authorities and networks: predicting conflict using events data, R. Stoll and D. Subramanian, International Studies Association, 2006 (invited paper). Events, patterns and analysis, D. Subramanian and R. Stoll, in Programming for Peace: Computer-aided methods for international conflict resolution and prevention, 2006, Springer Verlag, R. Trappl (ed). Four Way Street? Saudi Arabia's Behavior among the superpowers, 1966-1999, R. Stoll and D. Subramanian, James A Baker III Institute for Public Policy Series, 2004. Events, patterns and analysis: forecasting conflict in the 21st century, R. Stoll and D. Subramanian, Proceedings of the National Conference on Digital Government Research, 2004.Forecasting international conflict in the 21st century, D. Subramanian and R. Stoll, in Proc. of the Symposium on Computer-aided methods for international conflict resolution, 2002.
The research team
Embedded Adaptive Systems
System fora task
EnvironmentEnvironment
actions
observations
Calculate decisions on the basis of learned models of systems
Learningalgorithm
Prior knowledgeModel
The fine structure of adaptive embedded systems
SystemBasedecisionson objectivedata.
Extract Segment
Non-stationarity is pervasive. Robust algorithms for detection.
Model Adapting complexmodels isexpensive; lightweight local modelsare right choice.
actions
observations
Prior knowledge
The vision“System identification” for large, non-stationary (distributed) systems.Off-the-shelf components for putting together feedback controllers with performance guarantees for such systems.
Collaborators
Tracking human learningDiana Gordon, ONR/University of Wyoming and Sandra Marshall, San Diego State University, George Zouridakis, University of Houston
Tracking conflictRichard Stoll, Rice University

18
StudentsHuman learning
Richard Thrapp, National InstrumentsPeggy Fidelman, PhD in CS/UT AustinIgor Karpov, PhD in CS/UT AustinPaul RamirezGwen Thomas, Green HillsTony BerningGunes Ercal (CRA mentee)Deborah Watt (CRA mentee)
Scott Griffin, RationalScott Ruthfield, MicrosoftChris Gouge, MicrosoftStephanie Weirich (Asst. Prof. at UPenn)Sameer Siruguri, MS Lisa Chang, MS, IBMNuvan Rathnayake, Rice juniorIan Stevenson, PhD neuroscience, NorthwesternFarhan Baluch, University of Houston, MS 2006
StudentsConflict
Michael Friedman, Rice sophomoreAdam Larson, Rice seniorAdam Stepinski, Rice sophomoreClement Pang, Rice juniorBenedict Lee, MS 2007Derek Singer, Rice junior
SponsorsConflict analysis: NSF ITR 0219673Human learning: ONR N00014-96-1-0538