machine learning with matlab - mathworks · 3 machine learning characteristics and examples...
TRANSCRIPT

1© 2013 The MathWorks, Inc.
Machine Learning with MATLAB
Abhishek GuptaApplication Engineer

2
What You Will Learn
Overview of machine learning
Algorithms available with MATLAB
MATLAB as an interactive environmentfor evaluating and choosing the best algorithm
3
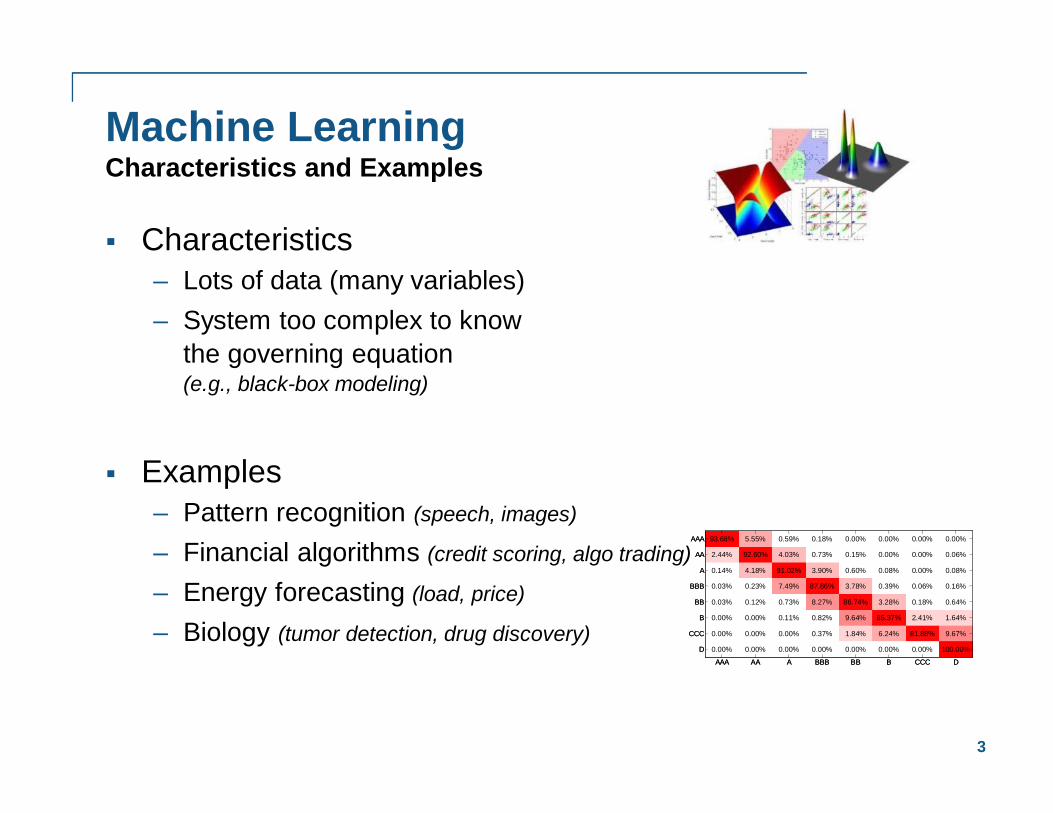
Machine LearningCharacteristics and Examples
Characteristics– Lots of data (many variables)– System too complex to know
the governing equation(e.g., black-box modeling)
Examples– Pattern recognition (speech, images)
– Financial algorithms (credit scoring, algo trading)
– Energy forecasting (load, price)
– Biology (tumor detection, drug discovery)
93.68%
2.44%
0.14%
0.03%
0.03%
0.00%
0.00%
0.00%
5.55%
92.60%
4.18%
0.23%
0.12%
0.00%
0.00%
0.00%
0.59%
4.03%
91.02%
7.49%
0.73%
0.11%
0.00%
0.00%
0.18%
0.73%
3.90%
87.86%
8.27%
0.82%
0.37%
0.00%
0.00%
0.15%
0.60%
3.78%
86.74%
9.64%
1.84%
0.00%
0.00%
0.00%
0.08%
0.39%
3.28%
85.37%
6.24%
0.00%
0.00%
0.00%
0.00%
0.06%
0.18%
2.41%
81.88%
0.00%
0.00%
0.06%
0.08%
0.16%
0.64%
1.64%
9.67%
100.00%
AAA AA A BBB BB B CCC D
AAA
AA
A
BBB
BB
B
CCC
D

4
Challenges – Machine Learning
Significant technical expertise required
No “one size fits all” solution
Locked into Black Box solutions
Time required to conduct the analysis
5
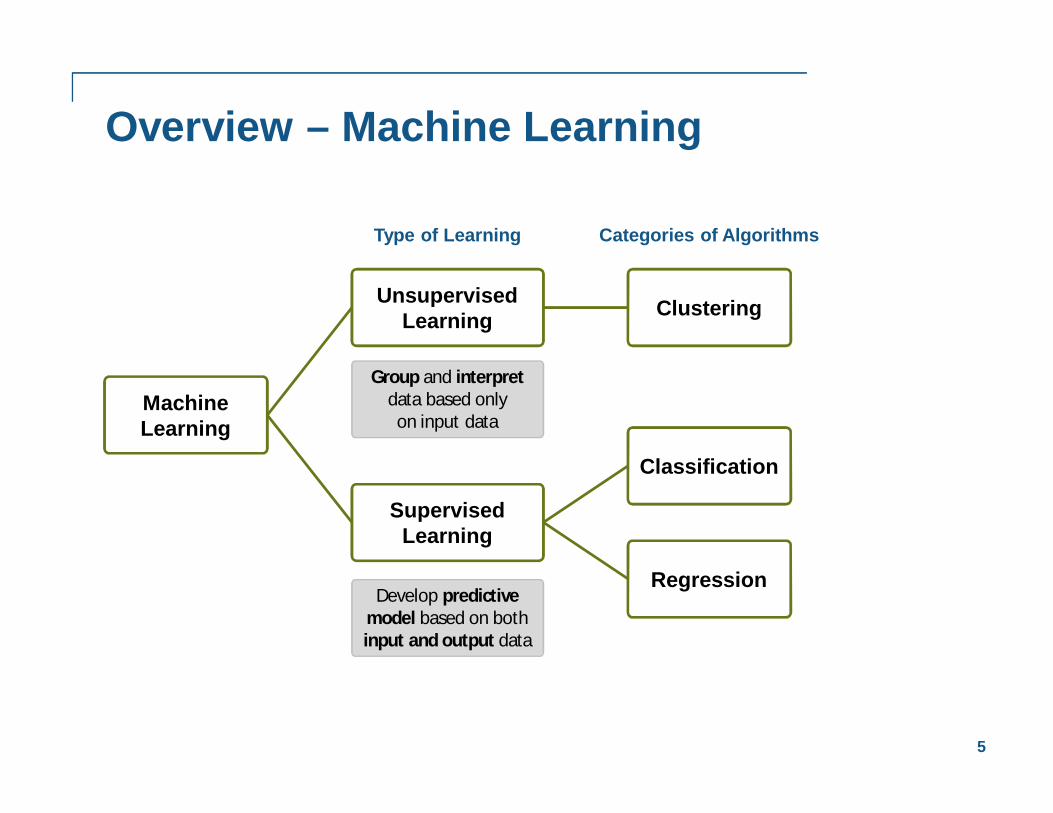
Overview – Machine Learning
MachineLearning
SupervisedLearning
Classification
Regression
UnsupervisedLearning Clustering
Group and interpretdata based only
on input data
Develop predictivemodel based on bothinput and output data
Type of Learning Categories of Algorithms

6
Unsupervised Learning
Clustering
k-Means,Fuzzy C-Means
Hierarchical
Neural Networks
GaussianMixture
Hidden Markov Model
7
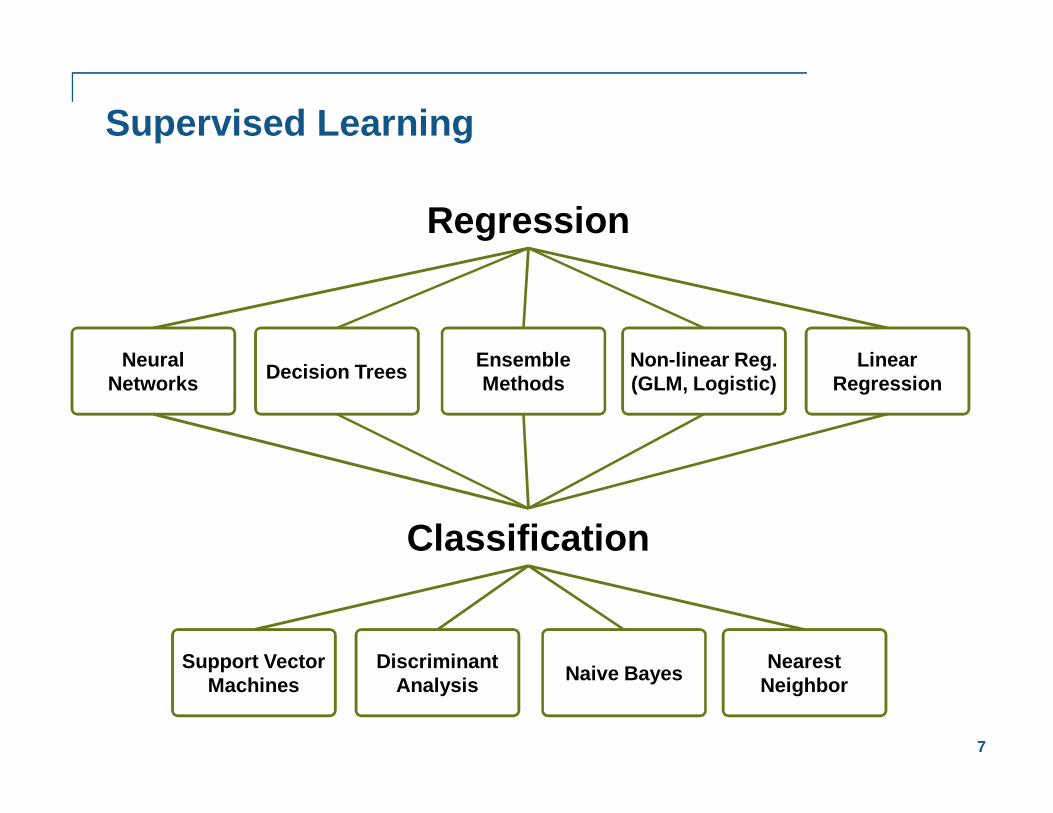
Supervised Learning
Regression
Non-linear Reg.(GLM, Logistic)
LinearRegressionDecision Trees Ensemble
MethodsNeural
Networks
Classification
NearestNeighbor
Discriminant Analysis Naive BayesSupport Vector
Machines

8
Supervised Learning - Workflow
Known data
Known responses
Model
Train the Model
Model
New Data
Predicted Responses
Use for Prediction
Measure Accuracy
Select Model
Import Data
Explore Data
Data
Prepare Data
Speed up Computations

9
Demo – Bank Marketing Campaign
Goal:– Predict if customer would subscribe to
bank term deposit based on different attributes
Approach:– Train a classifier using different models– Measure accuracy and compare models– Reduce model complexity– Use classifier for prediction
Data set downloaded from UCI Machine Learning repository http://archive.ics.uci.edu/ml/datasets/Bank+Marketing
0
10
20
30
40
50
60
70
80
90
100
Per
cent
age
Bank Marketing CampaignMisclassification Rate
Neur
al N
et
Logi
stic
Regr
essio
n Di
scr im
inan
t Ana
lysis
k-
near
est N
eigh
bors
Naive
Bay
es
Supp
ort V
M
Decis
ion
Tree
s
Tree
Bagg
er
Redu
ced
TB
NoMisclassifiedYesMisclassified

10
ClusteringOverview
What is clustering?– Segment data into groups,
based on data similarity
Why use clustering?– Identify outliers– Resulting groups may be
the matter of interest
How is clustering done?– Can be achieved by various algorithms– It is an iterative process (involving trial and error)
-0.1 0 0.1 0.2 0.3 0.4 0.5 0.60
0.1
0.2
0.3
0.4
0.5
0.6
0.7
0.8
0.9
1
-0.1 0 0.1 0.2 0.3 0.4 0.5 0.60
0.1
0.2
0.3
0.4
0.5
0.6
0.7
0.8
0.9
1
11
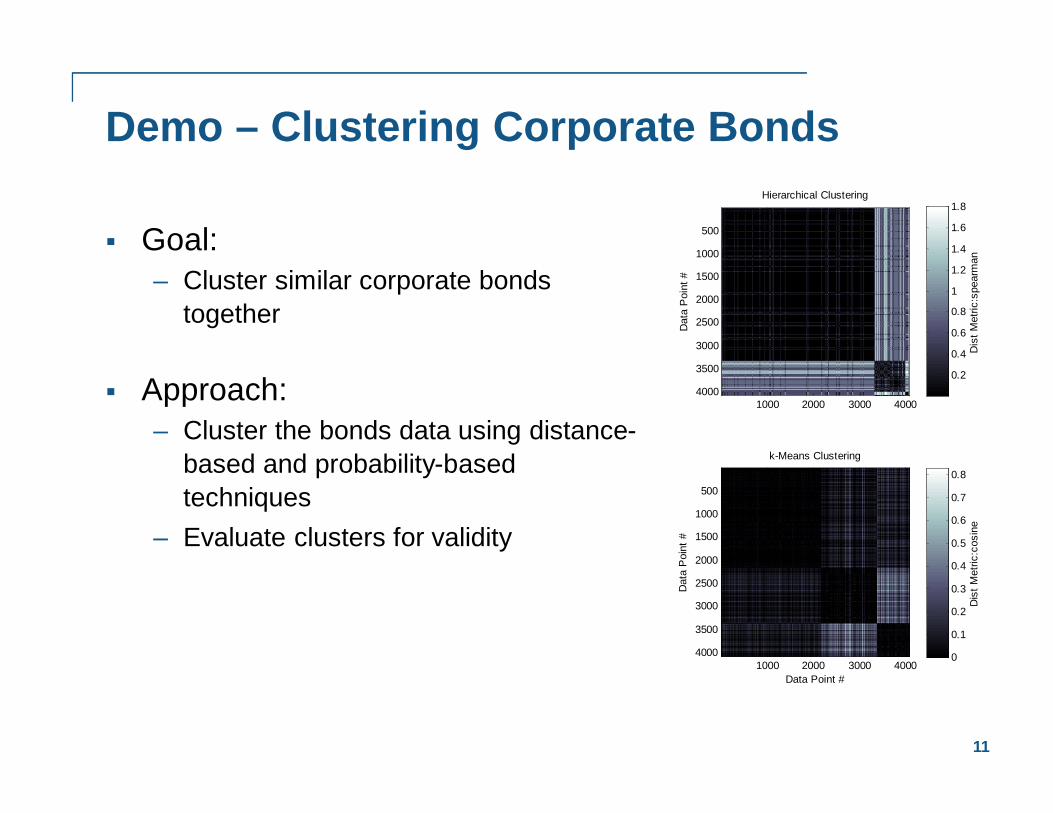
Demo – Clustering Corporate Bonds
Goal:– Cluster similar corporate bonds
together
Approach:– Cluster the bonds data using distance-
based and probability-based techniques
– Evaluate clusters for validity
Dat
a P
oint
#
Hierarchical Clustering
1000 2000 3000 4000
500
1000
1500
2000
2500
3000
3500
4000
Dis
t Met
ric:s
pear
man
0.2
0.4
0.6
0.8
1
1.2
1.4
1.6
1.8
Data Point #D
ata
Poi
nt #
k-Means Clustering
1000 2000 3000 4000
500
1000
1500
2000
2500
3000
3500
4000
Dis
t Met
ric:c
osin
e
0
0.1
0.2
0.3
0.4
0.5
0.6
0.7
0.8

12
Machine Learning with MATLAB
Interactive environment– Visual tools for exploratory data analysis– Easy to evaluate and choose best algorithm– Apps available to help you get started
(e.g,. neural network tool, curve fitting tool)
Multiple algorithms to choose from– Clustering– Classification– Regression
13
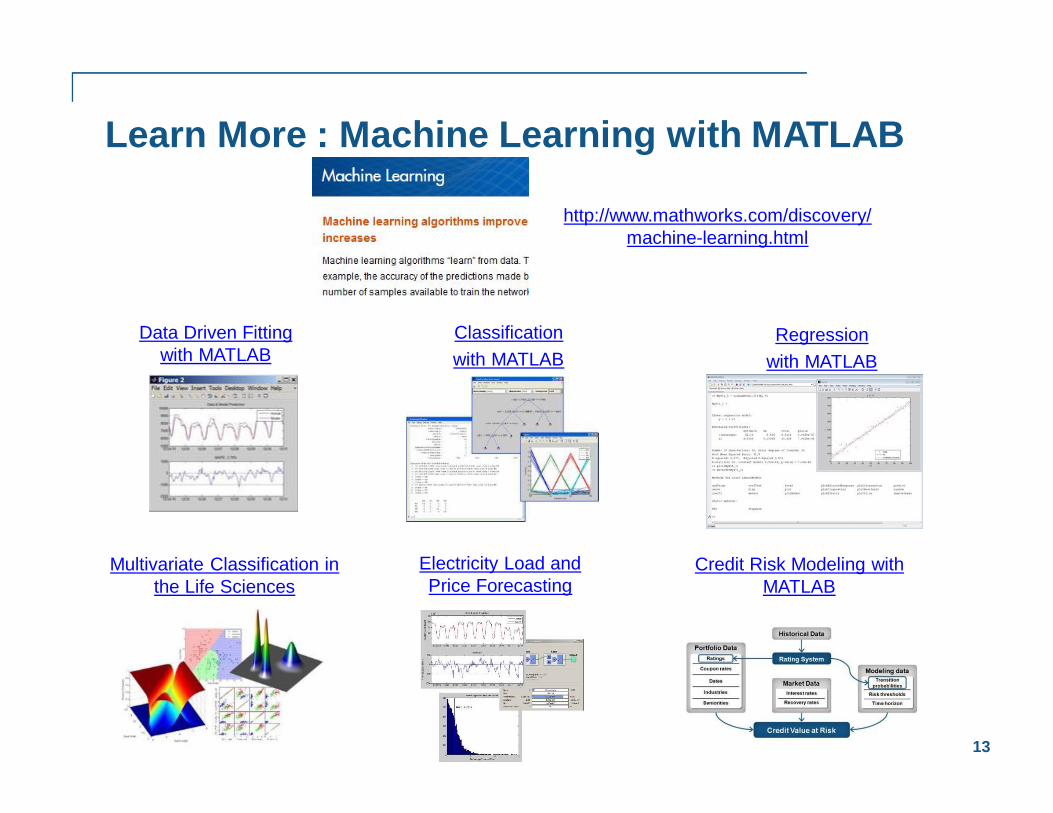
Learn More : Machine Learning with MATLAB
Classificationwith MATLAB
Credit Risk Modeling with MATLAB
Multivariate Classification in the Life Sciences
Electricity Load and Price Forecasting
http://www.mathworks.com/discovery/machine-learning.html
Data Driven Fitting with MATLAB
Regressionwith MATLAB

14
Questions?