machinery sector - gfgroup.com.hk · 2018-03-05 · mar 2, 2018 2 sector report peak of replacement...
TRANSCRIPT

Machinery Sector
Mar 2, 2018 Equity Research | Industrials
This is a summary of a report originally written in Chinese. Please contact us for more information of the original report. The Chinese version shall prevail in the event of any discrepancy between the two versions.
Container leasing figures point to continued demand improvement
Dominic Chan, CFA, FRM SFC CE No. APP609 [email protected] +852 3719 1218 GF Securities (Hong Kong) Brokerage Limited 29-30/F, Li Po Chun Chambers 189 Des Voeux Road Central Hong Kong Contribution from the GF A-share research team: Luo Libo * [email protected] +86 21 6075 0636 * Please note that Luo Libo is not a registered licensee with the Securities and Futures Commission of Hong Kong and is not allowed to conduct regulated activities in Hong Kong.
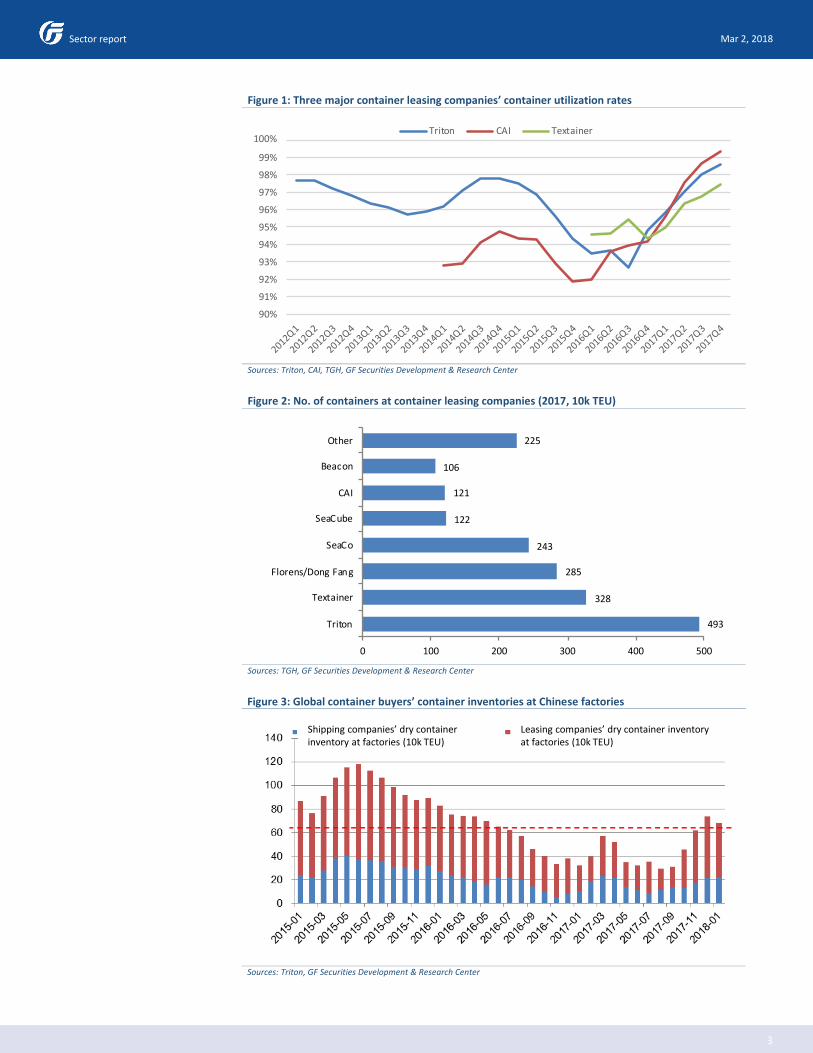
Container utilization rates rising to record high levels, expected to remain strong in 1Q18 Based on the latest 4Q17 reports from major container leasing companies, the
utilization rates of containers continued to set record high levels during the quarter. In 4Q17, the container utilization rates of the global top three container leasing players Triton (TRTN US), Textainer Group (TGH US) and CAI (CAI US) came in at 98.5%, 97.4%, and 99.3%, which were 0.5pp, 0.7pp and 0.7pp higher than the previous quarter. In 4Q16, the three companies’ utilization rates were at ~95%. Thanks to strong downstream demand, these figures have continued to rise and have reached the highest levels in recent years. According to CAI’s 4Q17 report, demand from downstream clients remains strong; we expect container utilization rates to remain high in 1Q18. It typically takes several months for containers to be brought into use by shipping or leasing companies after they are delivered by manufacturers. As the volume of new container orders were relatively low in previous months, the inventory of shipping and leasing companies’ containers at container factories are currently at a low level. According to Triton’s quarterly report, container inventory fell to a historical low level of ~0.3m TEU during the shipping peak season in Aug-Sept in 2017. As new container orders are picking up, the inventory of containers has rebounded. In Jan 2018, the inventory of shipping and leasing companies’ containers at container factories totaled 680,000 TEU, which was comparable to the median level since Jan 2015. While total container inventory has rebounded, some large container leasing companies’ inventory remains relatively low. Triton’s container utilization rate rose to 98.5% in 4Q17, the highest level since 2012; in Jan 2018, its dry container inventory in Asia fell to just 15,000 TEU, compared with a peak level of 230,000 TEU in March 2016. Triton is the largest container leasing operator in the world. Record high container utilization rates and low container inventories indicate a tight supply of containers and strong demand downstream. Prices of new containers remain stable, used container profit greatly improved
Based on CAI’s 4Q17 report, the price of 20ft standard dry containers was stable at ~US$2,150. Since the start of 2017, due to rising production cost, Rmb depreciation and the support from downstream demand, global container prices have remained stable above US$2,000/TEU, comparable to the level in 2013 but still representing considerable room for growth compared with 2011. Amid stable new container prices and rising utilization rates, the price of used containers has also improved significantly. Based on CAI’s 4Q17 report, the company recorded an average used container sales price of US$1,037/CEU during the quarter, 1.47x higher than the same period of the previous year. Moreover, the profit margin of used containers also increased from US$-153/CEU in 4Q16 to US$196/CEU in 4Q17. Container demand recovery likely to continue Container demand comes from
container ownership growth and replacement demand. Container ownership growth is driven by global container shipping volume while the replacement of obsolete containers mainly has to do with the utilization rate of existing containers and companies’ operating profits. According to Drewry’s 2017 container industry report, global total container ownership amounted to ~39.5m TEU, increasing by 0.85m TEU, or 2.2%, from 2016. Assuming container ownership growth of 3% during 2017-2020, a 15-year replacement cycle, and that 90% of obsolete containers are actually replaced each year, we estimate that annual container demand is likely to increase gradually from 2.93m TEU in 2017 to 4.08m TEU in 2020.
(Continued on next page…)

Mar 2, 2018
2
Sector report
Peak of replacement approaching A normal life cycle of a container is 12 years, though this has
been extended in practice due to the relative weakness in the shipping industry in recent years.
Assuming a 15-year replacement cycle, containers delivered after 2003 will now need to be
replaced. It is worth noting that global container output grew the fastest during 2002-2007, with the
annual output of 2.94m TEU during 2003-2007 equivalent to 1.75x that in 2002. As a result, 2017-
2020 should see a growing number of containers being replaced, with the actual number of
replacement to be affected mainly by the utilization rate of existing containers and companies’
operating profits.
Container leasing companies scrapped a large number of idle containers during 2015-2016 amid
industry weakness. In 2015 and 2016, Triton, Textainer and CAI scrapped 0.52m and 0.6m TEU of
dry containers respectively, while adding just 0.54m and 0.65m TEU of new dry containers,
representing net dry container addition of just 0.02m and 0.05m TEU. As container demand has
been quite strong since the start of 2017 and as there has been a short supply of containers,
container leasing companies purchased a large of new containers while the pace of scrapping old
containers became much slower. In 2017, the three companies scrapped 0.36m TEU of dry
containers, down 40% from 2016. In particular, Triton’s 0.114m TEU scrapped was equal to just
44.2% of the figure in 2016 (annual scrapping 0.203m TEU during 2010-2016). Moreover, old
container scrapping was also lower than the average level in 2017, indicating that container
replacement was delayed in the first year of the industry recovery amid a supply shortage. As
shipping business conditions continue to improve, container leasing companies’ utilization rates
have remained high and shipping companies’ profitability is recovering, making them more willing
to invest in new container purchases. Moreover, previously pent-up replacement demand will also
add to the momentum of container demand growth.
Container ownership growth: Steady global economic growth likely to drive moderate
shipping business growth Based on historical data, container ownership growth is highly
correlated with global container shipping volume growth. The IMF released its latest World
Economic Outlook on Jan 22, expecting the global economy to have grown 3.7% in 2017, 0.1pp
higher than its estimate in Oct and 0.5pp higher than the 2016 figure. In addition, the IMF has raised
both its 2018 and 2019 global economic growth estimates by 0.2pp from its Oct estimates to 3.9%.
Stable global economic growth should have a positive impact on shipping business growth,
providing better support for container ownership growth.
Risks Fluctuations in machinery demand caused by economic changes, rising raw materials prices
weighing on profitability, earnings volatility due to exchange rate changes, and slower-than-
expected capacity reduction.
Mar 2, 2018
3
Sector report
Figure 1: Three major container leasing companies’ container utilization rates
Sources: Triton, CAI, TGH, GF Securities Development & Research Center
Figure 2: No. of containers at container leasing companies (2017, 10k TEU)
Sources: TGH, GF Securities Development & Research Center
Figure 3: Global container buyers’ container inventories at Chinese factories
Sources: Triton, GF Securities Development & Research Center
90%
91%
92%
93%
94%
95%
96%
97%
98%
99%
100%
2012Q1
2012Q2
2012Q3
2012Q4
2013Q1
2013Q2
2013Q3
2013Q4
2014Q1
2014Q2
2014Q3
2014Q4
2015Q1
2015Q2
2015Q3
2015Q4
2016Q1
2016Q2
2016Q3
2016Q4
2017Q1
2017Q2
2017Q3
2017Q4
Triton CAI Textainer
493
328
285
243
122
121
106
225
0 100 200 300 400 500
Triton
Textainer
Florens/Dong Fang
SeaCo
SeaCube
CAI
Beacon
Other
Shipping companies’ dry containerinventory at factories (10k TEU)
Leasing companies’ dry container inventory at factories (10k TEU).

Mar 2, 2018
4
Sector report
Figure 4: Triton’s dry container reservation orders in Asia (10k TEU)
Sources: Triton, GF Securities Development & Research Center
Figure 5: Steel price (Rmb/tonne) & average price of 20ft dry containers (US$/CEU)
Sources: CAI, GF Securities Development & Research Center
Figure 6: CAI used container price (LHS) and per unit profit (RHS)
Sources: CAI, GF Securities Development & Research Center
Not reserved Reserved
Steel price (Rmb/tonne) Average price of 20ft dry containers (CEU)
Sales price (US$/CEU) Average profit (US$/CEU)

Mar 2, 2018
5
Sector report
Figure 7: Global containers historical output, existing ownership and estimated future demand (10k TEU)
Sources: Drewry, GF Securities Development & Research Center
Figure 8: Global shipping and container leasing companies’ container ownership (m TEU)
Sources: Drewry, GF Securities Development & Research Center
Figure 9: Breakdown of Textainer’s containers by year of production
Sources: Textainer, GF Securities Development & Research Center
Historicaloutput
Newly addedownership
Replacementdemand
Total ownership (RHS)
Leasing companies Shipping companies Ownership growth
Standard containers (10k CEU)Refrigeratedcontainers Special containers
Pri
or
to1
99
8

Mar 2, 2018
6
Sector report
Figure 10: Dry container additions and scrapping at Triton
Sources: Triton, GF Securities Development & Research Center
Figure 11: CAI used container sales
Sources: CAI, GF Securities Development & Research Center
Figure 12: Global container ownership growth and global container shipping volume growth
Sources: Drewry, GF Securities Development & Research Center
New dry containers added (10k TEU)
Dry containers scrapped(10k TEU)
Net increased in drycontainers (10k TEU)
CAI’s used container sales (CEU) As % of CAI’s total containers
Global containerownership growth
Global container shippingvolume growth

Mar 2, 2018
7
Sector report
Figure 13: Container shipping volume growth and global GDP growth
Sources: IMF, Drewry, GF Securities Development & Research Center
Figure 14: US$/Rmb exchange rate
Sources: PBOC, GF Securities Development & Research Center
Container shipping growth/GDP growth
Container shipping volume growth
Global GDP growth
5.40
5.60
5.80
6.00
6.20
6.40
6.60
6.80
7.00
7.20
20
12
-01
20
12
-04
20
12
-07
20
12
-10
20
13
-01
20
13
-04
20
13
-07
20
13
-10
20
14
-01
20
14
-04
20
14
-07
20
14
-10
20
15
-01
20
15
-04
20
15
-07
20
15
-10
20
16
-01
20
16
-04
20
16
-07
20
16
-10
20
17
-01
20
17
-04
20
17
-07
20
17
-10
20
18
-01
Mar 2, 2018
8
Sector report
Rating definitions Benchmark: Hong Kong Hang Seng Index Time horizon: 12 months
Company ratings
Buy Stock expected to outperform benchmark by more than 15%
Accumulate Stock expected to outperform benchmark by more than 5% but not more than 15%
Hold Expected stock relative performance ranges between -5% and 5%
Underperform Stock expected to underperform benchmark by more than 5%
Sector ratings
Positive Sector expected to outperform benchmark by more than 10%
Neutral Expected sector relative performance ranges between -10% and 10%
Cautious Sector expected to underperform benchmark by more than 10%
Analyst Certification The research analyst(s) primarily responsible for the content of this research report, in whole or in part, certifies that with respect to the company or relevant securities that the analyst(s) covered in this report: (1) all of the views expressed accurately reflect his or her personal views on the company or relevant securities mentioned herein; and (2) no part of his or her remuneration was, is, or will be, directly or indirectly, in connection with his or her specific recommendations or views expressed in this research report.
Disclosure of Interests (1) The proprietary trading division of GF Securities (Hong Kong) Brokerage Limited (“GF Securities (Hong Kong)”) and/or its affiliated or associated companies do not hold any shares of the securities mentioned in this research report. (2) GF Securities (Hong Kong) and/or its affiliated or associated companies do not have any investment banking relationship with the companies mentioned in this research report in the past 12 months. (3) Neither the analyst(s) preparing this report nor his/her associate(s) serves as an officer of the company mentioned in this report and has any financial interests or hold any shares of the securities mentioned in this report.
Disclaimer This report is prepared by GF Securities (Hong Kong). It is published solely for information purpose and does not constitute an offer to buy or sell any securities or a solicitation of an offer to buy, or recommendation for investment in, any securities. The research report is intended solely for use of the clients of GF Securities (Hong Kong). The securities mentioned in the research report may not be allowed to be sold in certain jurisdictions. No action has been taken to permit the distribution of the research reports to any person in any jurisdiction that the circulation or distribution of such research report is unlawful. No representation or warranty, either express or implied, is made by GF Securities (Hong Kong) as to their accuracy and completeness of the information contained in the research report. GF Securities (Hong Kong) accepts no liability for all loss arising from the use of the materials presented in the research report, unless is excluded by applicable laws or regulations. Please be aware of the fact that investments involve risks and the price of securities may be fluctuated and therefore return may be varied, past results do not guarantee future performance. Any recommendation contained in the research report does not have regard to the specific investment objectives, financial situation and the particular needs of any individuals. The report is not to be taken in substitution for the exercise of judgment by respective recipients of the report, where necessary, recipients should obtain professional advice before making investment decisions. GF Securities (Hong Kong) may have issued, and may in the future issue, other communications that are inconsistent with, and reach different conclusions from, the information presented in the research report. The points of view, opinions and analytical methods adopted in the research report are solely expressed by the analysts but not that of GF Securities (Hong Kong) or its affiliates. The information, opinions and forecasts presented in the research report are the current opinions of the analysts as of the date appearing on this material only which may subject to change at any time without notice. The salesperson, dealer or other professionals of GF Securities (Hong Kong) may deliver opposite points of view to their clients and the proprietary trading division with respect to market commentary or dealing strategy either in writing or verbally. The proprietary trading division of GF Securities (Hong Kong) may have different investment decision which may be contrary to the opinions expressed in the research report. GF Securities (Hong Kong) or its affiliates or respective directors, officers, analysts and employees may have rights and interests in securities mentioned in the research report. Recipients should be aware of relevant disclosure of interest (if any) when reading the report. Copyright © GF Securities (Hong Kong) Brokerage Limited. Without the prior written consent obtained from GF Securities (Hong Kong) Brokerage Limited, any part of the materials contained herein should not (i) in any forms be copied or reproduced or (ii) be re-disseminated. © GF Securities (Hong Kong) Brokerage Limited. All rights reserved. 29-30/F, Li Po Chun Chambers, 189 Des Voeux Road Central, Hong Kong Tel: +852 3719 1111 Fax: +852 2907 6176 Website: http://www.gfgroup.com.hk