machining industry: survey & focus groups
TRANSCRIPT

Cleveland State University Cleveland State University
EngagedScholarship@CSU EngagedScholarship@CSU
Urban Publications Maxine Goodman Levin College of Urban Affairs
10-2014
Machining Industry: Survey & Focus Groups Machining Industry: Survey & Focus Groups
Merissa Piazza Cleveland State University, [email protected]
Edward W. Hill Cleveland State University, [email protected]
Molly Schnoke Cleveland State University, [email protected]
Follow this and additional works at: https://engagedscholarship.csuohio.edu/urban_facpub
Part of the Urban Studies and Planning Commons
How does access to this work benefit you? Let us know! How does access to this work benefit you? Let us know!
Repository Citation Repository Citation Piazza, Merissa; Hill, Edward W.; and Schnoke, Molly, "Machining Industry: Survey & Focus Groups" (2014). Urban Publications. 0 1 2 3 1315. https://engagedscholarship.csuohio.edu/urban_facpub/1315
This Report is brought to you for free and open access by the Maxine Goodman Levin College of Urban Affairs at EngagedScholarship@CSU. It has been accepted for inclusion in Urban Publications by an authorized administrator of EngagedScholarship@CSU. For more information, please contact [email protected].

MACHINING
INDUSTRY: SURVEY
& FOCUS GROUPS
Prepared for: TechSolve
Prepared by: Merissa C. Piazza
Edward (Ned) Hill, Ph.D. Molly Schnoke
October 2014
July 2014
2121 Euclid Avenue Cleveland, Ohio 44115 http://urban.csuohio.edu
CENTER FOR ECONOMIC
DEVELOPMENT

TABLE OF CONTENTS
Executive Summary ........................................................................................................................................ i
Chapter I: Survey of Machining Businesses ............................................................................................... i Chapter II: Machining Business Focus Groups ......................................................................................... iv
Chapter I: Survey of Machining Businesses .................................................................................................. 1
Introduction .............................................................................................................................................. 1 Methodology ............................................................................................................................................ 1 Survey Analysis ......................................................................................................................................... 2
Chapter II: Machining Focus Groups ........................................................................................................... 22
Introduction ............................................................................................................................................ 22 Methodology .......................................................................................................................................... 22 Focus Group Results ............................................................................................................................... 23 Training and Upgrading Skills ................................................................................................................. 29
Appendix A .................................................................................................................................................. 32
A.1. Machine Tool Survey Questionnaire ............................................................................................... 32 A.2. Occupations Machine Tool Companies Have looked to Fill in the Last Three Years by Length of time to Fill Vacancy ................................................................................................................................. 41 A.3. Workforce Development Resource by Usage and Usefulness ........................................................ 41 A.4. Greatest Challenges for Machining Business Units ......................................................................... 42 A.5. Greatest Challenges for the Machining Industry ............................................................................ 43 A.6. Greatest Opportunities for Machining Business Units .................................................................... 44
Appendix B .................................................................................................................................................. 46
B.1. Focus Group Protocol ...................................................................................................................... 46

TABLE OF TABLES
Table 1. Products Machining Business Unit Manufactures as a Percentage of Sales ................................... 6 Table 2. Respondents' Top 3 Innovation Challenges .................................................................................... 8 Table 3. Change in Customer Expectation and Profit Margin Alteration ................................................... 12 Table 4. Length of Time to Fill Vacancies by Occupation ............................................................................ 16 Table 5. Workforce Development Resource by Usage and Usefulness ..................................................... 17 Table 6. Top Machining Businesses Obtain Information on Innovation ..................................................... 20
TABLE OF FIGURES
Figure 1. Respondents by Geographic Location ........................................................................................... 2 Figure 2. Respondent Count by Job Title ...................................................................................................... 3 Figure 3. Respondent Counts by Employment (Full-Time Equivalent) and Sales ......................................... 4 Figure 4. Respondent Counts by Business Unit Function ............................................................................. 4 Figure 5. Industries Served by Respondents ................................................................................................. 5 Figure 6. Respondents Engaged in Various Types of Machining .................................................................. 6 Figure 7. Innovation Resources Utilized by Respondents ............................................................................. 8 Figure 8. Innovation Investment(s) by Respondents in the Next Three Years ............................................. 9 Figure 9. Challenges in Respondents' Business Due to New Materials ...................................................... 10 Figure 10. Workforce Issues: Challenges in Hiring Employees ................................................................... 14 Figure 11. Total Length of Time to Fill Vacancies by All Occupations ......................................................... 15 Figure 12. External Training Providers Used by Respondents to Upgrade Employee Skills ....................... 17 Figure 13. Greatest Challenges in the Machining Industry over the Next Three Years for the Business Unit and Industry ................................................................................................................................................ 18 Figure 14. Greatest Opportunities in the Machining Industry over the Next Three Years for the Business Unit and Industry ........................................................................................................................................ 19 Figure 15. Respondents Method of Receiving Information on Machining ................................................. 21

Machining Industry: Survey & Focus Groups
Maxine Goodman Levin College of Urban Affairs, Cleveland State University i
EXECUTIVE SUMMARY The Center for Economic Development (the Center) at the Maxine Goodman Levin College of Urban Affairs at Cleveland State University was retained by TechSolve to produce an online survey and conduct focus groups of Ohio businesses in the machining industry. The survey and focus groups are part of a broader effort managed by TechSolve for the Ohio Manufacturing Institute and Ohio Development Services Agency (ODSA) to develop a roadmap for the machining industry in Ohio.1 This executive summary covers the two main chapters of this report: the Survey of Machining Businesses and Machining Business Focus Groups. The survey examines the responses to the Survey of Machining Businesses and their perceptions regarding the current and future challenges of the industry. The focus group protocol delved deeper into questions unresolved by the survey and extended to descriptions of challenges in developing the workforce for this industry.
CHAPTER I: SURVEY OF MACHINING BUSINESSES
Respondent Demographics
The Survey of Machining Businesses was targeted towards owners or managers who operate machining businesses. Overall, there were 34 respondents that completed the survey. The largest grouping of respondents (39%) reported occupations in upper management (i.e. President, CEO, President & CEO, and CFO). Plant managers and general managers were the second largest occupation (18%). Based upon these outcomes, the survey achieved the targeted demographic of surveying owners or employees who operate machining business. Respondents were from 18 different counties throughout the state of Ohio. The largest number of respondents was situated in Hamilton County (where the city of Cincinnati is located). In addition, a majority of respondents were from small businesses (less than 50 employees). The top three industries that machining businesses serve are Automotive (21%), Aerospace (15%), and Energy (14%). These industries traditionally require specific parts and assemblies to be manufactured by machining businesses. It then follows that the most appropriate terms to describe their function was Manufacture Discrete Parts (25 respondents), followed by Manufacture Assemblies (21 respondents). To understand the structure of the machine tool industry, it is important not only to comprehend which industries are supplied, but also how these products are diversified in the machining business units’ product portfolio. A majority of respondents diversify their machining products so that their specific products are not more than 50% of their overall sales. By diversifying their products, owners and operators can maintain flexibility in a market dominated by fluctuating metal prices and increasing customer demands. As suppliers, the machining industry must be nimble enough to receive orders and fill them within a timely manner to meet customers’ demands. In order to operate in this way, machining businesses can be engaged in a variety of types of machining. In general, almost one third of respondents reported that they engage in machining, no matter the type (3-, 4- or 5- axis). The remainder of responses was fairly
1 This report was prepared with financial support from the State of Ohio. All contents of this report reflect the views of the Grantee and do not reflect the views of ODSA or that of the State of Ohio.

Machining Industry: Survey & Focus Groups
Maxine Goodman Levin College of Urban Affairs, Cleveland State University ii
equally split amongst lathes (16%), milling machines (15%), turning centers (13%), and grinding machines (13%).
Innovation
Although discovery can be haphazard, innovation can be managed in the same way as other operational functions. It is important to understand how machine tool firms acquire resources that result in innovation, whether internally or externally. Almost all of the respondent feedback indicated that innovation resources utilized by machining businesses (85%) are those external to the firm (External non-profit manufacturing or technology centers/organizations; Federal agencies and/or labs; Hired consultants; Professional societies/associations; Trade organizations; Universities and community colleges; Vendors and suppliers). Only 20 responses employed internal work-groups for innovation. Regarding innovation investment over the next three years, the largest grouping of responses indicated that innovation investments would take place as capital investment (facility improvements, equipment financing, and IT infrastructure); this grouping accounted for over half of the responses (57%). Other innovation financing that machining business were likely to undertake was that of business expansion, either through business acquisition (19%) or working capital for business expansion (14%).
New Materials
New materials consist of a variety of mediums such as ceramics,2 alloys (high-temperature, nickel-based, iron and cobalt-based) and stainless steels.3 Many of these materials are difficult to machine. Through innovation in the automotive and aerospace industries the demand for machining of these materials has increased, while the turnaround time and cost margins have decreased. When asked, “How has the use of new materials (i.e. composites, new alloys, etc.) in your industry caused challenges for your business unit?” Responses were equally dispersed amongst the seven answer categories (challenge in acquiring new materials; current machine tools are not compatible with new materials; business unit does not know methods, processes, or how to machine new materials; workforce is not knowledgeable on how to machine new materials; variation in the quality or specifications of materials; price volatility of new materials causes challenges). This provides an indication that there is no one issue in regards to new materials; rather a host of problems for businesses to contend with and address.
Customer Expectations
Known as a suppliers to many of the large industries in Ohio (automotive, aerospace, etc.), the machining industry faces the pressures of supplying within strict margins and just-in-time delivery schedules. With ever-increasing customer expectations to machine better and faster, we asked respondents in what areas they experienced a change in customer expectation. In addition, we asked how these changing expectations altered industry profit margins (for better or worse). Overall, the most selected response to how customer expectations have changed their business unit’s profit margin was in regards to delivery time. Although customers expect faster delivery times, two
2 Srejith, P.S. & Ngoi, B.K.A (2001) Material removal mechanisms in precision machining of new materials. International Journal of Machine Tools and Manufacture, 41 (12), 1831-1843. 3 National Technical Conference Indianapolis. Difficult to Machine Materials. https://www.pmpa.org/docs/default-source/technical-conference/difficult-to-machine-materials-intro.pdf?sfvrsn=0

Machining Industry: Survey & Focus Groups
Maxine Goodman Levin College of Urban Affairs, Cleveland State University iii
respondents indicated that this can create a profit bonus because machine shops can charge extra for shorter delivery times. However, when customers expect a shorter turnaround, machine shops have to monitor carefully their inventory in order to make sure they have enough stock on hand for other orders. The second-most selected response was prices; respondents indicate that customers’ demand a lower price can narrow their profit margin. Quality and design were third and fourth choices by respondents. Respondents indicated that customers’ expectation of quality is extremely high, but one respondent indicated that customers are moving towards less expensive, lower quality products. Respondents indicated that customer expectation in regards to design changed their business profit margin, especially when customers added complexity and customization to their orders.
Workforce
In the last ten years, there has been a growing demand for workers with skills that are critical to advanced manufacturing and machining industries. Despite growing demand, it has been difficult to attract talented employees with advanced degrees in the science and mathematics areas to fill management and engineering positions in advanced manufacturing. This workforce environment creates a very difficult setting for employers who are looking to hire and expand their businesses. Almost one third of survey respondents stated that one of their challenges is that individuals do not have the appropriate skills for the designated job (32%). The second-most selected categories were finding employees with enough experience for the job (19%), along with finding workers with the appropriate soft skills (i.e. communication, enthusiasm, etc.) for the workplace (19%). These results are further evidence that the supply of people with “middle-skills” Respondents were asked, “In the last 3 years, has your business unit looked to fill any new position?” If they selected yes, which 97% did, then they were prompted to answer another question. “What occupations have you looked to fill in the last 3 years? Have you had issues finding qualified applicants?” There were eight job categories in which 50% or more respondents agreed that there was a qualified pool of applicants:
Engineers, 71%
Office Management, 92%
Plant Management, 57%
IT Specialist, 78%
Machine Operators, 50%
Model Makers, 50%
QA/CMM Technicians, 50%
Other, 71%
There were five job categories in which less than 50% of the respondents found the applicant pool to be qualified. Examining the grouping of jobs in which machine tool respondents indicated that there was not a qualified pool of candidates reveals all occupations in middle-skill job categories.
Electromechanical Maintenance Technicians, 33%
CNC Programmers, 20%
Tool Makers, 39%
Machinists, 25%
Welders, 27%

Machining Industry: Survey & Focus Groups
Maxine Goodman Levin College of Urban Affairs, Cleveland State University iv
Respondents actively recruit potential employees using a variety of resources. Overall, 90% of respondents have used web postings and have found this resource useful. Two-thirds of respondents indicated that they use headhunters or recruiters and find this resource very useful. A large grouping of respondents indicated that they have used community college or university/college placement centers in the past and also have found these resources useful. Fifty-eight percent (58% or 19 respondents) of respondents stated that they used external training providers to upgrade current employees’ skills. The most common training provider used was external non-profit manufacturing or technology centers/organizations and community colleges.
Overall Challenges & Opportunities
When asked to identify business unit and industry challenges for the next three years, respondents overwhelmingly replied skilled labor, healthcare costs, and talent retention. However, when asked to name opportunities for the next three years, the respondents’ answers were more varied ranging from reshoring4 to improved technology.
Machining Communication
Gathering information about innovation is essential for machining businesses. Overall, the most popular way that machining businesses obtain information about innovation is through trade publications (28%), followed by conferences and events (24%), and trade shows (21%). A number of respondents’ revealed that they attend the International Manufacturing Technology Show (IMTs) and FABTECH. Another way of learning about innovation is from trade associations. Most respondents belong to the American Society of Mechanical Engineers and the Society of Manufacturing Engineers. Trade publications provide a third way of learning and the most selected sources were Modern Machine Shop (21 respondents) and Production Machining (14 respondents).
CHAPTER II: MACHINING BUSINESS FOCUS GROUPS
Demographics
The purpose of the machining focus groups was to provide depth and clarity to unanswered questions of the Survey of Machining Businesses. Focus groups were conducted in three cities in Ohio and were sponsored by each region’s Manufacturing Extension Partnership affiliate—Cleveland (MAGNET), Columbus (PolymerOhio), and Cincinnati (TechSolve)—in July 2014. Machining businesses owners or managers participated. There were a total of 18 participants in the three focus groups, representing 17 different machining firms. The responses from these three focus were very consistent.
Changing Customer Expectations
Focus group participants were united in their opinion that the expectations of customers have altered dramatically. Three main points about customer expectations emerged from both the focus groups and the survey. Demand for 100%-on-time delivery, demand for low-cost products, and the ability to do all of this with the highest product quality. In other words, the responses from focus group participants reinforced the findings in the Survey of Machining Businesses.
4 Reshoring is the return of jobs to the United States after they had been previously offshored.

Machining Industry: Survey & Focus Groups
Maxine Goodman Levin College of Urban Affairs, Cleveland State University v
100% On-Time Delivery
Customers demand that machining companies have near-perfect on-time delivery. The firms that can meet his standard can differentiate themselves from their competitors. The ability of businesses to achieve on-time delivery depends on a number of factors including raw material delivery (the availability and wait time from suppliers), subcontractors, fluctuation in order volume and changes, and insufficient workforce capacity. Though focus group participants identified shorter and near-perfect delivery times as a significant challenge to their business, meeting this expectation is complicated by the inability of customers to forecast their future orders. According to focus group participants, this lack of forecasting is not a new problem for the industry. On-time delivery today, however, requires improving the capability of machining customers to predict accurately their needs and enhancing communication with machining businesses. The demand for on-time delivery has an additional impact on inventory management and the cash-carrying costs of machining businesses. Customer expectations for on-time delivery can become burdensome to the machining company because companies have to carry more raw materials and more finished goods on hand, both of which create inventory costs. Driving up inventories has forced some businesses to develop new ways to hold and maintain their inventory. One participant indicated that they have developed a consignment arrangement with one of their suppliers where stock is kept on the shelves at the plant and the firm does not pay for the product until it is used. Comments from focus group participants about on-time delivery: • Forecasting [from customers]has never been very good – they are never sure [what they will need] • They [the customer] want the flexibility to say I want this [product], then a few days later change
and say, no I want this. • What the customer wants changes every week. It is a constant challenge. • Their forecasts are inaccurate – they have an inability to forecast for change, but they want a very
narrow promised delivery time.
Customer Cost Constraints
Another challenge to machining businesses is customer demands for cost reductions. Though focus group members spent a considerable amount of time explaining challenges related to shorter delivery times and less time discussing cost, participants stated that there is a constant push to lower cost.
Quality Demands
The ability to produce a high quality product is not a new requirement of the machining industry. However, the degree to which customers will accept errors or mistakes has narrowed, further squeezing the profit margin of firms. Focus group participants, in all cities, agreed that customer expectations related to product quality are very exact – “The quality bar is very high.”
Challenges across on-time-delivery, quality, and price
Focus group participants cited lack of communication with customers as an increasing challenge. Machining businesses feel that they have the know-how and ability to make the products customers want. At times, this requires the ability to communicate with customers and the engineers who design the products to work out design errors. A number of participants state that many customers had

Machining Industry: Survey & Focus Groups
Maxine Goodman Levin College of Urban Affairs, Cleveland State University vi
become so bureaucratic that they lost the ability that they once had to talk to the customer about essential information about their orders. This included instances where the machining operation had identified design errors in the drawings the customer had sent over, yet there was nobody on the customer’s side to talk about the problem. Historically, this was not the case and participants felt it was a relatively new experience.
Addressing Industry Challenges
Having to increase quality, decrease cost, and speed-up delivery time are significant pressures in the machining industry, and each machining business is taking steps to address them. To meet competitive requirements and reduce costs, many machining businesses are turning to lean manufacturing techniques to drastically cut cycle time and increase their competitive edge. Focus group participants identified a number of proactive changes they are making, such as equipment monitoring and preventative maintenance.
Machine Monitoring & Preventative Maintenance
Measuring machine and workforce performance is becoming increasingly important as a way to decrease downtime and increase efficiency. Focus groups participants in all three cities stated that economic forces have forced them to look at aspects of their operations not previously examined and look for process innovation and improvements. Focus group participants also specified a number of operations and maintenance considerations they are making in order to make their operations more efficient. These include conducting quick-change repairs instead of total machine disassembly and deploying redundant equipment to reduce downtime so that while one machine is being worked on, another is operating. Machining firms understand that actions need to be taken and technologies employed to identify operational efficiency gaps and weaknesses. Most know that they need to leverage key data metrics including overall equipment effectiveness (OEE) and total effective equipment performance (TEEP).5 In addition, many are aware of, and interested in, machine monitoring technologies, such as MTConnect.6,7
However, it is interesting to note, only one participant is actively utilizing monitoring equipment in their operation. This company was able to monitor each shift and machine to know which machines had low production. It was up to management operation to determine if this was related to low worker productivity or poor machine functionality. Either way, this particular machining business was able to address productivity issues in a timely manner. With increased interest in machine monitoring technologies, a number of participants across the three focus groups stressed that this is not an effort to reduce the number of employees, but to get them involved in the overall management of the business and invested in their work. Companies want their staff to understand what is current in their industry. In addition, it is the hope that employees will become invested in the business and feel a personal connection to its future.
5 Waurzyniak, P. (2013). Shop-Floor Monitoring Critical to Improving Factory Processes. Manufacturing Engineering. http://www.sme.org/MEMagazine/Article.aspx?id=74143#sthash.OJya6Jsy.dpuf 6MTConnect is royalty free standard protocol suitable for use with any type or manufacturing device. It can be used on the shop floor for production dashboard or monitoring, equipment effectiveness, production reporting and tracking, energy conservation, and quality control. 7 The Association for Manufacturing Technology. (2013) Getting Started with MTConnect: Monitoring Your Shop Floor – What’s in it for You? http://www.mtconnect.org/media/39437/gettingstartedwithmtconnectshopfloormonitoringwhatsinitforyourevapril4th-2013.pdf

Machining Industry: Survey & Focus Groups
Maxine Goodman Levin College of Urban Affairs, Cleveland State University vii
Innovation Investments
Focus group participants were asked about the types of innovation initiatives and investments they might make over the next three years. Some firms do not have concrete plans for capital investments stating we “Don’t have plans, but aspirations.” All respondents indicated that they regularly make capital investments and will continue to do so in the future. Others indicated that they need to replace equipment whose life cycle is coming to an end or is already obsolete. On a positive note, some participants indicated they are looking for new or additional space since they expect to expand their business operations. Overall, many firms indicated that automation was a top investment priority.
New Materials
Machining processes that produce parts for the latest designs need to be able to work with advanced materials. Advanced materials for this industry are defined as ceramics, hard-to- machine metals such as hardened-steel and alloys, as well as composites and polymers. There are added production challenges that come with these new materials. The new materials can be difficult to machine, but they can create highly intricate parts which are good for the customer. To address this, focus group participants said they are relying on their network of tool suppliers to find new tools that can work these new materials. Some say that the onus is on the machining firms to learn how to work with new materials, with one participant mentioning that they worked with their raw material supplier before ordering to meet the parts specifications. By shifting the new material specification onto the raw material supplier, the machining company shifted the quality burden to the supplier and away from themselves.
Workforce Development
Workforce questions were asked in the Survey of Machining Businesses because our previous research suggested that workforce issues were an impediment to business function and innovation in Ohio. This was validated in the survey. To delineate further issues of workforce from the survey, the focus group protocol included a section on workforce. The focus group facilitators prepared a variety of questions regarding workforce challenges for machining businesses as prompts. Nonetheless, the participants naturally discussed workforce issues as a business impediment without prompting by the focus group facilitators. This occurred in all three cities. In many instances, workforce issues were discussed within the first fifteen minutes of the focus group starting. Overall, focus group participants were primarily concerned about the availability of skilled labor. These worries also extended into the future. Moreover, participants were not only anxious about the current and future skilled labor markets for their industry but for the entire manufacturing sector. When asked about traditional “white-collar” jobs such as management, engineering, and information technology, participants did not have the same concerns as they had for skilled labor or “blue-collar” jobs. It is interesting to note that the topic of conversation in relation to workforce was exactly the same as discussed by the focus groups that the Center facilitated in in 2009 to identify high demand occupations in the manufacturing sector for the Ohio Skills Bank.8
Talent Recruitment Focus group participants described talent recruitment as a pivotal crisis for manufacturing today, and called for a change in how people envision the manufacturing workplace environment. Participants
8 Austrian, Z., Hexter, K. & Schnoke, M. (2009). Identifying High Demand Occupations and Understanding the Needs of Northeast Ohio Manufacturers. Cleveland: Cleveland State University.

Machining Industry: Survey & Focus Groups
Maxine Goodman Levin College of Urban Affairs, Cleveland State University viii
unanimously agreed that the heart of the recruitment problem is how manufacturing is perceived in this country and in the state of Ohio. Three targets were identified by focus group participants to improve the supply of potential workers for manufacturing companies: (1) the general public, (2) the education system, and (3) parents, specifically mothers. First, focus group participants maintained that the general public today does not understand what manufacturing does. In order to counter this, the public must understand that today’s manufacturing can be a rewarding career for young people. Second, participants believe that the current education system focuses too much on the notion that the only option post-graduation is to go to a 4-year university. Educators and guidance counselors need to acknowledge that not every child is “college material” and be ready to advise students about different types of educational and career options. Third, participants indicated that the most important hurdle to attracting the future workforce is parental bias. There is opportunity for advancement in a manufacturing career. Moreover, focus group participants noted that if a younger person enters a manufacturing career they can work and attend college at night, which is most likely going to be paid for by the company. Some of the comments and suggestions offered by participants: • We need to convince mothers it is a good career for their children. We’ll pay for training, college,
etc. This is good business. We wonder if young individuals realize the potential for earning in this trade.
• We need to talk to the parents, not the kids. • Nobody wants to have their kids do this job.
Training and Upgrading Skills
The lack of basic skills is limiting the pool of candidates for jobs in machining businesses. When asked what their biggest challenge in hiring new employees was, they indicated that getting employees to show up on time and pass a drug test posed significant barriers. One participant noted that, “At the entry-level it is attendance, ability to function within the culture and being dependable.”
Since skilled trade employees are difficult to find, many companies need to grow their own workforce by starting a new employee at an entry-level or lower-skilled position, such as in the utility department. They then have the ability to test and observe individuals with the goal of eventually moving them to the plant floor. This tactic was discussed by participant’s at all three focus groups. One participant said that in his estimation, only 1 out of 15 who start out will become a skilled machinist. Furthermore, focus group participants indicated that it takes a very long time and a significant investment to move someone from an entry-level position to a skilled job in the company, citing that it takes anywhere from 5 to 10 years to move through this process. Never the less, the need to ‘up-skill’ workers is essential. Several focus group participants indicated that their businesses had internal training programs or strategies to address the skills gaps in their current workforce. Fifty-eight percent (58%) of survey respondents indicated that they use external training providers to upgrade the skills of their employees. Many of the focus group participants from mid-sized and smaller companies indicated that they used external training programs and providers, while the larger companies generally had internal training in place.

Machining Industry: Survey & Focus Groups
Maxine Goodman Levin College of Urban Affairs, Cleveland State University ix
Addressing the Workforce Challenge Regionally
Participants from the three cities all acknowledged they had workforce issues, but how they went about addressing them differed by city. The Cleveland focus group displayed a greater degree of collaboration and cooperation in addressing the workforce issues than did the other cities. Participants said they felt a commitment to the manufacturing industry to find solutions. These solutions would ultimately benefit each of them. On the other hand, the Cincinnati focus group participants demonstrated a greater degree of competitiveness and heightened concerns about the poaching of employees by other companies, resulting in a reluctance to make significant investments in training. In Columbus, the environment was described as somewhat fragmented, although it seemed to meet the needs of employers. These responses surprised focus group facilitators, especially since the Cincinnati workforce system has worked to integrate itself into a regional entity to alleviate the skills gap: Partners for a Competitive Workforce (PCW).9 When asked about the workforce development system, respondent did not know of any effort to reduce the skills gap aside from their individual efforts working with community colleges or vocational technical trainers. However, the responses from all of the groups indicate knowledge of particular efforts within the system. It could be the case that individuals in the Cleveland focus group were more involved in workforce development than those in Cincinnati or Columbus.
9 FSG. (2013). Collective Impact Case Study: Partners for a Competitive Workforce. http://www.fsg.org/tabid/191/ArticleId/974/Default.aspx?srpush=true

Machining Industry: Survey & Focus Groups
Maxine Goodman Levin College of Urban Affairs, Cleveland State University 1
CHAPTER I: SURVEY OF MACHINING BUSINESSES
INTRODUCTION The Center for Economic Development (the Center) at the Maxine Goodman Levin College of Urban Affairs at Cleveland State University deployed an online survey of Ohio businesses in the machining industry. Chapter I examines the responses to the Survey of Machining Businesses and their perceptions regarding the current and future challenges of the industry. The machining industry is large, both domestically and worldwide. Dollar‐volume production of machine tools worldwide in 2012 was $93.2 billion with U.S. consumption at $8.7 billion.10 Gaining insight into the challenges of these suppliers to Ohio’s manufacturing industries can shed light on how public policy can be shaped to assist and grow this industry.
METHODOLOGY The Survey of Machine Tool Businesses’ questionnaire was designed by the Center to identify current and future challenges of the machining industry. Questions regarding macro-economic trends, changes in end-user requirements, changes in technology, changes in production process, and changes in customers’ expectations were incorporated to delineate the challenges of the industry. The Survey of Machining Businesses questionnaire was created and developed by the Center with advisement from Dr. Edward (Ned) Hill, Dean of the Maxine Goodman Levin College of Urban Affairs at Cleveland State University and subject matter expert in advanced manufacturing. For a copy of the questionnaire, see Appendix A. 1. The survey was an Internet-based survey, deployed through the survey software Qualtrics. The survey was tested with 25 machine tool companies on May 20, 2014. After the testing phase, the full survey was conducted over a four-week period starting May 27, 2014 using a list of contacts and email addresses from TechSolve. Contacts were emailed on consecutive Tuesdays. In order to facilitate greater response rates, the Center contacted potential respondents via phone to encourage participation. Moreover, the research team contacted regional and statewide manufacturing associations to encourage their members to participate.11 In addition, an incentive of entry into a drawing to win one of two $25 gift-cards was offered to respondents. This survey did not use any sampling method to select participants and did not have a survey frame to estimate a population. Since this survey was not meant to be statistically significant, the Center is not able to quantify traditional statistical survey statistics (response estimation, over- or under-representation, non-response estimation, etc.). It is important to acknowledge that there may be bias in responses to the survey. Survey participant selection bias may have occurred due to the fact that individuals and businesses solicited by the Center to participate in the survey were from a non-random pool of contacts collected by TechSolve. Moreover, the authors acknowledge the selection bias inherent in using an Internet-based collection mechanism. If a potential respondent did not have an email address or a computer, they were not able to participate in the survey and were, therefore, not represented in the sample of respondents; this is reflected in non-response bias.
10 Gardner Research. (2013). The World Machine Tool Output & Consumption Survey. https://www.gardnerweb.com/cdn/cms/uploadedFiles/2013wmtocs_SURVEY.pdf 11 We thank TechSolve, MAGNET, PolymerOhio, The Precision Machine Products Association (PMPA), and Ohio Manufactures’ Association (OMA) for distributing the survey to appropriate contacts

Machining Industry: Survey & Focus Groups
Maxine Goodman Levin College of Urban Affairs, Cleveland State University 2
SURVEY ANALYSIS
Respondent Demographics
There were 34 respondents that completed the survey. These respondents were from a variety of locations throughout the state of Ohio. Figure 1 is a thematic map of the state displaying the respondent count shaded by county.12 The largest number of respondents was from Hamilton County (where the city of Cincinnati is located).
Figure 1. Respondents by Geographic Location
The Survey of Machining Businesses was targeted towards owners or managers who operate machining businesses. Figure 2 illustrates the respondent count by job title. The largest grouping of respondents (39%) reported occupations in upper management (i.e. President, CEO, President & CEO, and CFO). Plant managers and general managers were the second-largest occupation (18%) that responded to the survey. Based upon the outcomes in Figure 2, the survey was responded to by the target group, owners or employees who manage machining business.
12 Respondent count shading was used in order to ensure the confidentiality of respondents

Machining Industry: Survey & Focus Groups
Maxine Goodman Levin College of Urban Affairs, Cleveland State University 3
Figure 2. Respondent Count by Job Title
Respondents were asked, ”Approximately, how many full-time employees does your company employ?” and, in a subsequent question, were asked to indicate approximate company sales. Figure 3 displays the number of respondents to these two questions. The results show that a majority of respondents were from small businesses (4 respondents had 1 to 25 employees; 13 respondents had 26 to 50 employees), and the vast majority of respondents had sales of less than $50 million a year.

Machining Industry: Survey & Focus Groups
Maxine Goodman Levin College of Urban Affairs, Cleveland State University 4
Figure 3. Respondent Counts by Employment (Full-Time Equivalent) and Sales
There are a wide variety of business functions within the machining industry. Figure 4 displays respondent counts of business unit functions. The most often selected category was Manufacture Discrete Parts (25 respondents), followed by Manufacture Assemblies (21 respondents). Respondents engaged in a variety of business functions within the machining industry, many selected more than one function.
Figure 4. Respondent Counts by Business Unit Function
1
1
4
5
7
10
10
10
16
21
25
0 5 10 15 20 25 30
Automation systems design & integration
Does not manufacture or use machine tools
Combine your machine tools with other company’s products
Combine other company’s machine tools with your products
Act as a seller
Manufacture machine tools
Design machine tools
Provide secondary process of machined parts .
Manufacture a final product comprised of multiple machinedparts
Manufacture assemblies
Manufacture discrete parts
Response Count
Bu
sin
ess
Un
it F
un
ctio
n
N=110

Machining Industry: Survey & Focus Groups
Maxine Goodman Levin College of Urban Affairs, Cleveland State University 5
Figure 5 illustrates the industries served by respondents. These are industries that traditionally require specific parts and assemblies to be manufactured by machining businesses (Figure 4). The most frequently mentioned responses were Automotive (21%), Aerospace (15%), Energy (14%), and Consumer Products (14%).
Figure 5. Industries Served by Respondents
To understand the structure of the machine tool industry it is important to comprehend which industries are supplied (Figure 5), and how these products are need to diversify the business of the responding company. Table 1 shows the product types that are produced by machining businesses divided into two groups according to whether these products’ sales account for more than 50% of sales, or less than 50%. It should be noted, Table 1 represents a portion of the respondent categories, since many of the machining products indicated by respondents could not be aggregated and displayed in order to maintain respondent confidentiality. A majority of respondents diversify their machining products so that no one product constitutes more than 50% of their overall sales. By diversifying their products, owners and operators can maintain agility in a market dominated by fluctuating metal pricing and increasing customer demands.
Biomedical, 6%
Instruments, controls, electronics, 10%
Energy, 14%
Agriculture and/or food processing,
13%
Consumer Products, 14%
Aerospace, 15%
Automotive, 21%
Other, 7%
Respondents Could Select More Than One Response; N=126

Machining Industry: Survey & Focus Groups
Maxine Goodman Levin College of Urban Affairs, Cleveland State University 6
Table 1. Products Machining Business Unit Manufactures as a Percentage of Sales
Number of Products Greater than 50% of Sales
Less than 50% of Sales
Automotive Component
3 4
Aerospace/Aircraft Component
1 2
Automation Systems 1 3
Consumer Products 0 4
Construction Products 0 3
Electrical Products 1 1
Parts & Components 3 2
Other 11 37 Total 20 56
Machining businesses can be engaged in a variety of types of activities. Figure 6 shows the various types of machining in which the respondents are engaged. In general, almost one third of respondents reported that they engage in machining, no matter the type (3-, 4- or 5- axis). The remainder of responses was fairly equally split amongst lathes (16%), milling machines (15%), turning centers (13%), and grinding machines (13%).
Figure 6. Respondents Engaged in Various Types of Machining
Note: EDM= Electrical Discharge Machining CNC= Computer Numerical Control Respondents Could Select More than One Response; N=168
Machining (28%)
- 3 axis - 13%- 4 axis - 9%- 5 axis 6%
Lathes16%
Milling machines15%
Turning centers
13%
Grinding machines
13%
Non-Conventional Process 11%:
- EDM- Laser Cutting
- Water-jet Cutting
Other 4%:- 3-D copiers- CNC tool and cutter grinders- Cold forming- Furnaces- Screw machines- Sheet metal processing- Use in assembly

Machining Industry: Survey & Focus Groups
Maxine Goodman Levin College of Urban Affairs, Cleveland State University 7
Innovation
As the world pulled itself out of the worst recession seen in eighty years, manufacturing leaders understood that the playing field had, once again, changed. The U.S. regained its competitive footing and businesses began to reshore13 products and reinvest in their operations. Manufacturers that survived the Great Recession also had to reestablish production processes to get a better handle on product quality and supply chain oversight. In the post-Great Recession period there has been considerable discussion centering on innovation. Conversations of how manufacturing can innovate and facilitates can retain their competitive advantage has penetrated manufacturing research. Innovation in this industry takes several forms: (1) ability to work new types of materials, (2) process innovations that improve quality and lower production costs, and (3) entry into new product markets. In the state of Ohio, innovation and new technology can be found throughout the economy and the machining industry. With new technology that taps underground shale for natural gas, the Utica and Marcellus shale deposits have brought new growth to sectors of the machining industry. A few survey respondents indicated that they have purchased or are looking to purchase capital equipment powered by natural gas. Other companies have found that since they became suppliers to the energy industry the cost structure of the industry is lower, so they can now increase investment. It is important to understand how machine tool firms are acquiring innovation resources. Figure 7 exhibits respondent counts by the types of innovation resources that machining firms use. Almost all of the respondents (85%) indicated that the innovation resources they utilize are external to the firm (External non-profit manufacturing or technology centers/organizations; Federal agencies and/or labs; Hired consultants; Professional societies/associations; Trade organizations; Universities and community colleges; Vendors and suppliers). Only 20 responses employed internal work-groups to innovate. Since the responses to the survey are dominated by small and medium sized manufactures, their reliance on external sources of innovation may well differ from larger firms.
13 Reshoring is the return of jobs to the United States after they had been previously offshored.

Machining Industry: Survey & Focus Groups
Maxine Goodman Levin College of Urban Affairs, Cleveland State University 8
Figure 7. Innovation Resources Utilized by Respondents
Note: Respondents Could Select More than One Response; N=134 There are many factors that prevent businesses from innovating. Table 2 shows the responses for the question, “Please order your top 3 innovation challenges that your businesses unit struggles with.” Overall, the most frequently selected challenge was upgrading skills of workforce (31%), closely followed by changes in customer expectations (30%).
Table 2. Respondents' Top 3 Innovation Challenges
Machining Innovation Challenges
Ranked
#1
Ranked
#2
Ranked
#3
Frequency
of Top 3 Ranking
Percent of Respondents who Ranked Challenge in
Top 3 Upgrading skills of workforce 12 9 6 27 31%
Changes in customer expectations (delivery time, quality, and/or prices)
14 9 3 26 30%
Regulatory environment (environmental, import/export compliance)
3 4 8 15 17%
Integrated computer manufacturing: design, model, simulation and production
1 2 4 7 8%
Working with new materials (composites and hard to machine materials)
0 2 3 5 6%
Information networking, monitoring, and connecting machine tools and other manufacturing assets
0 3 1 4 5%
Other 0 0 2 2 3%
Total 30 29 27 86 100%
7
12
16
17
17
20
22
23
0 5 10 15 20 25
Federal agencies and/or labs
Universities and community colleges
Professional societies/associations
Hired consultants
Trade organizations
Internal work-groups
Vendors and suppliers
External non-profit manufacturing or technologycenters/organizations
Response Count
Inn
ova
tio
n R
eso
urc
e

Machining Industry: Survey & Focus Groups
Maxine Goodman Levin College of Urban Affairs, Cleveland State University 9
Financing innovation investments, especially over the last few years due to the recession, has been particularly challenging. However, most respondents (74%) indicated that financing issues over the last three years did not apply to them. We can only speculate why financing was not a barrier to these firms; either they did not have trouble obtaining financing or they had not looked to make innovation investments at that time due to business conditions. We asked a forward looking question, “What type(s) of innovation investment(s) are you looking to make in the next three years?” (Figure 8). The largest grouping of responses indicated that innovation investments would take place in capital investment (facility improvements, equipment financing, and IT infrastructure); this grouping accounted for a little over half of the responses (57%). Other innovation investment that machining business were looking to undertake was that of business expansion, either through business acquisition (15 responses) or working capital for business expansion (11 responses).
Figure 8. Innovation Investment(s) by Respondents in the Next Three Years

Machining Industry: Survey & Focus Groups
Maxine Goodman Levin College of Urban Affairs, Cleveland State University 10
New Materials
New materials used in making machined products are required to operate at high temperature, or have high strength combined with lightweight, or be made of relatively low cost composites.14 New materials consist of ceramics,15 alloys (high-temperature, nickel based, iron and cobalt based) and stainless steels.16 The demand for machining of these materials has increased due to the demand from the automotive and aerospace industries while the turnaround time and cost margins have decreased. To understand the current state of machining in Ohio today, it is essential to know how machining businesses are responding to the demand for new materials. Figure 9 presents the responses to the question: “How has the use of new materials (i.e. composites, new alloys, etc.) in your industry caused challenges for your business unit?” Responses were equally dispersed across the seven answers. This indicates that manufacturers need to address a host of problems: process engineering, knowledge on how to work the materials, exploring new sources of supply, and price volatility.
Figure 9. Challenges in Respondents' Business Due to New Materials
14 Konig, W., Cronjager, L., Tonshoff, H. K., Vigneau, M., & Zdeblick, W. J. (1990). Machining New Materials. CIRP Annals - Manufacturing Technology. 39 (2), 673-681. 15 Srejith, P.S. & Ngoi, B.K.A (2001) Material removal mechanisms in precision machining of new materials. International Journal of Machine Tools and Manufacture, 41 (12), 1831-1843. 16 National Technical Conference Indianapolis. Difficult to Machine Materials. https://www.pmpa.org/docs/default-source/technical-conference/difficult-to-machine-materials-intro.pdf?sfvrsn=0
Challenge in acquiring new materials, 17%
Current machine tools are not compatible …
Business unit does not know
methods, processes, or
how to machine new materials,
17%
Workforce is not knowledgeable
on how to machine new
materials, 17%
Do not use / Not a
factor , 11%
Variation in the quality or
specifications of materials, 12%
Price volatility of new materials
causes challenges, 17%
N=42

Machining Industry: Survey & Focus Groups
Maxine Goodman Levin College of Urban Affairs, Cleveland State University 11
Customer Expectations
Ohio’s machine product industry supplies some of the most demanding original equipment manufacturers in the economy. They are the foundation of the supply chains of the automotive, aerospace, white goods, transportation equipment and chemical industries. They also need to respond to low profit margins and rigid just-in-time delivery schedules. Ever-increasing customer expectations to machine better, faster and cheaper caused us to question respondents about changes in customer expectations. In addition, we asked how these changing expectations affected their profit margin (for better or worse). Table 3 displays the responses from the first question, as well as a summary of how customer expectations affected profit margins of the machine tool companies and companies that use machine tools. Overall, the most frequently selected response was a change in customer expectation in regards to delivery time. Customers expect faster delivery times; the incentive for responding to this delivery challenge not just improved customer satisfaction but higher profits. Some OEMs pay performance bonuses for meeting delivery targets. However, when customers expect a quicker turnaround, machine shops have to monitor carefully their inventory to ensure that they have enough stock on hand for other orders. The second most selected response was prices; respondents indicate that customers demand lower prices that will narrow their profit margin unless they increase units of production. In other words, machine shops operators look for increased volume to offset low prices for each part delivered. Additionally, pressure for “cast-downs” continues. A cast-down is a contracted price reduction intended to allow the customer some of the benefit from learning-by-doing productivity gains and the write-down of tooling expenses. Quality and design were the third and fourth choices by respondents. Respondents indicated that customers’ expectation of quality is extremely high, but some customers are also using cheaper materials. Changes in customers’ expectation in design, on the other hand, occur when customers add complexity to the part, customized standard products, or ask for unique products.

Machining Industry: Survey & Focus Groups
Maxine Goodman Levin College of Urban Affairs, Cleveland State University 12
Table 3. Change in Customer Expectation and Profit Margin Alteration
Respondent Count
Profit Margin Alteration
Delivery Time
23
Inventory Planning: have to do a better job and improved margins; have larger inventories due to just-in-time delivery; need to hold more stock to cover unknown demands
Late charges if not on time
Working more overtime to meet customer demand
Customers have an expectation of faster delivery time
Shorter delivery times can create an inventory control problem of having enough stock to meet other orders
Profit margin increased, customers are willing to pay for shorter delivery times
Prices 21 Prices are much lower
Narrow profit margins
Quality 18
Customer's expectation of quality is extremely high
Customers have eliminated their own quality control departments forcing machining companies to do inspections
Closer tolerances increase cost
Customer's expectation is high for quality, but allowing for downtime; this makes increasing productivity and efficiency for the shop necessities.
Design 17
Customers require more engineering and design help since they have cut back on internal engineering functions
Increased due to added complexity (i.e. design, engineering)
Growth due to increase in customization
Require more design validation
Products 8
New opportunities with new products
Decreased profit margin due to wide range of products
As technology increases so does the complexity of the product, which both help and hinder profit margin attainment
Traceability 7 Longer machine qualifications
Process 6
Profits increased due to greater complexity
Profits slightly decreased due to more stringent acceptance criteria
Expectations are on less human intervention in production and higher automation content

Machining Industry: Survey & Focus Groups
Maxine Goodman Levin College of Urban Affairs, Cleveland State University 13
Workforce
There has been increased demand for workers in occupations that supply the advanced manufacturing and machining industries. There is little doubt that the sharp decline in manufacturing employment from 2000 to the start of the Great Recession and the trauma of recessions has deterred people from starting a career in manufacturing. Nevertheless, with the improvement in the competitive position of U.S. manufacturing compared to both the Asian and European markets, demand in the middle-skilled manufacturing occupations has increased. However, the supply is short due to the unattended pipeline of talent for the previous 15 years. This problem is compounded by the fact that it has been difficult to attract talented employees with advanced degrees in the science and mathematics to fill managerial and engineering positions in advanced manufacturing industries. This workforce environment creates a very difficult setting for employers who are looking to hire and expand their businesses. Middle-skilled jobs are defined traditionally as those that require less than a bachelor’s degree but more than a high school diploma. These jobs are the backbone of the machining industry – machinists, lathe operators, and engineering technicians, industrial maintenance engineers and those skilled in mechatronics, a combination of knowledge about electro-mechanical industrial machine systems. An audit by the Government Accountability Office of a representative sample of 200 Workforce Investment Boards (WIBs) found that WIBs had a hard time filling middle-skill occupations, which they also identified as high-growth occupations, because individuals lack skills to participate in re-training.17 Figure 10 presents the workforce challenges by machining businesses in our survey cohort. Almost one third stated that individuals do not have the appropriate skills for the designated job (32%). The second most frequently mentioned challenge was that employers have a difficult time finding employees with enough experience for the job (19%) and finding employees with the appropriate soft skills (i.e. communication, enthusiasm, etc.) for the workplace (19%).
17 Government Accountability Office. (2013). Workforce Investment Act: Local Areas Face Challenges Helping Employers Fill Some Types of Skilled Jobs. Washington, D.C.: U.S. Government.

Machining Industry: Survey & Focus Groups
Maxine Goodman Levin College of Urban Affairs, Cleveland State University 14
Figure 10. Workforce Issues: Challenges in Hiring Employees
It is not easy for employers to find individuals for science, technology, engineering, and mathematic (STEM) occupations. According to a Brookings report, the median duration of a STEM job opening is more than twice that of a non-STEM vacancy.18 We wanted to verify this finding within the machining industry. Respondents were asked, “In the last 3 years, has your business unit looked to fill any new positions?” If respondents selected yes, which 97% did, they were prompted with another question. “What occupations have you looked to fill in the last 3 years? Have you had issues finding qualified applicants?” Figure 11 displays the total length of time required to fill vacancies by all occupations from respondents. The most commonly selected answers were less than 3 months and 3 to 6 months.
18 Rothwell, J. (2014). Still Searching: Job Vacancies and STEM Skills. The Brookings Institution.
Appropriate skills and training for designated
job32%
Enough experience
19%
Soft skills (i.e. communication,
enthusiasm)19%
Punctuality14%
The ability to pass a drug test
12%
The ability to work in teams
2%
Other 2%: - Willingness to travel for service work- Salary expectations
N=81

Machining Industry: Survey & Focus Groups
Maxine Goodman Levin College of Urban Affairs, Cleveland State University 15
Figure 11. Total Length of Time to Fill Vacancies by All Occupations
Table 4, breaks out responses to the follow-up question by occupation. The table contains information on the most frequent response of the number of months it took to fill the vacancy, a Sparkline (mini bar graph) of the length of time to fill the vacancy,19 and the percentage of respondents that indicated that there was a qualified pool of applicants for the occupation. On the whole, the most common response for the length of vacancy by occupation was 3 to 6 months. There were eight occupational categories where 50% or more of the respondents agreed that there was a qualified pool of applicants (Engineers, 71%; Office Management, 92%; Plant Management, 57%; IT Specialist, 78%; Machine Operators, 50%; Model Makers, 50%; QA/CMM Technicians, 50%; and Other, 71%). There were five occupational categories where less than half of the respondents found the pool to be qualified (Electromechanical Maintenance Technicians, 33%; CNC Programmers, 20%; Tool Makers, 39%; Machinists, 25%; and Welders, 27%). The occupations where more than half of the respondents indicated that there was not a sufficiently large pool of potential workers were all middle-skilled: electromechanical maintenance technicians, CNC programmers, tool makers, machinist and welders.
19 Each Sparkline in Table 4 is a replication of Figure 11 but by each occupation.
30
4850
27
13
7
0
10
20
30
40
50
60
N/A Less than 3 3 to 6 6 to 9 9 to 12 More than 12
Nu
mb
er o
f R
esp
on
den
ts
Length of time to fill position (months)

Machining Industry: Survey & Focus Groups
Maxine Goodman Levin College of Urban Affairs, Cleveland State University 16
Table 4. Length of Time to Fill Vacancies by Occupation
Occupation Number of Months to Fill Vacancy
by Most Frequent Response (% of Total Occupation)
Length of time to fill position
There was a qualified pool of applicants
Engineers 3 to 6 months (48%) 71%
Office Management Less than 3 months (50%) 92%
Plant Management 3 to 6 months (43%) 57%
IT Specialists Less than 3 months (36%) 78%
Electro mechanical Maintenance Technicians
N/A (31%)
33%
CNC Programmers 6 to 9 months (29%) 20%
Machine Operators Less than 3 months (67%) 50%
Model Makers N/A (60%) 50%
Tool Makers Less than 3 months & 6 to 9 months (24%) 39%
QA/CMM Technicians 3 to 6 months (40%) 50%
Machinists 3 to 6 months (41%) 25%
Welders 3 to 6 months (38%) 27%
Other (sum) Less than 3 months (43%) 71%
Total 3 to 6 months (29%) 49%
Note: The bar graph displays each column in order of length of time. The first column indicates “N/A”, the second column indicates “Less than 3 months”, third “3 to 6 months”, fourth “6 to 9 months”, fifth “9 to 12 months”, and the last column indicates “Greater than 12 months”.
Table 5 presents data collected on the respondents’ use of workforce recruitment resources, and how they rate their usefulness. Overall, 90% of respondents have used web postings and have found this resource useful. Two-thirds of respondents indicated that they use headhunters/recruiters and find this resource very useful. A large group indicated that they have used community college or university/college placement centers in the past and have found this resource useful. It is interesting to note that respondents have not used many of the workforce development resources from the state of Ohio (Ohio Means Jobs Website, Ohio Means Jobs Service Centers, or Ohio Means Jobs Internship Website). For detailed responses, see Appendix A.2.

Machining Industry: Survey & Focus Groups
Maxine Goodman Levin College of Urban Affairs, Cleveland State University 17
Table 5. Workforce Development Resource by Usage and Usefulness
Resources Used Resource Highest response count
Headhunters/Recruiters 66% Very Useful (39%)
Other 80% Very Useful (83%)
Website Postings 90% Useful (50%)
University/College Placement Centers 52% Useful (60%)
Job Fairs 65% Useful (33%)
Community College Placement Centers 73% Useful (54%)
Ohio Means Jobs Website 30% N/A (31%)
Ohio Means Jobs Service Centers 21% N/A (45%)
Ohio Means Internships Website 4% N/A (86%)
Total 51% Useful (38%)
Fifty eight percent (58% or 19 respondents) of respondents stated that they used external training providers to upgrade the skills of their current employees. Figure 12 displays the type of providers used by these 19 respondents. The most common training provider was External non-profit manufacturing or technology centers/organizations and Community colleges. For detailed responses, see Appendix A.3.
Figure 12. External Training Providers Used by Respondents to Upgrade Employee Skills
2
4
4
6
6
7
7
11
12
0 5 10 15
Other
Trade associations
Universities
On-line training providers
Vocational high schools
Consultants
Technical centers
Community colleges
External non-profit manufacturing or technologycenters/organizations
Respondent Count
Exte
rnal
Tra
iner
N=59

Machining Industry: Survey & Focus Groups
Maxine Goodman Levin College of Urban Affairs, Cleveland State University 18
Overall Challenges & Opportunities
Figure 13 displays a wordle20 of the most common phrases used by our survey respondents to describe the challenges in the machining industry over the next three years. The size of the word in the figure indicates how often it was mentioned by respondents. Labor dominated the responses as indicated by the number of mentions and the various words used to describe the workforce crunch: skilled labor, talent retention, qualified labor, workforce, and employees are all represented in large point fonts. For detailed responses, see Appendix A.4. and A. 5.
Figure 13. Greatest Challenges in the Machining Industry over the Next Three Years for the Business Unit and Industry
Source: www.wordle.net
20 A wordle is an info graphic that displays the most common words in larger font.

Machining Industry: Survey & Focus Groups
Maxine Goodman Levin College of Urban Affairs, Cleveland State University 19
Figure 14 presents a wordle of the greatest opportunities to the machining industry over the next three years. Unlike respondents’ answers about the challenges to the business unit and industry which rallied around a few responses, the responses for the greatest opportunities for the business unit and industry are more varied. Here the words are: new products, new markets, reshoring, improved technology, automotive production increase, improving economy and energy. For detailed responses, see Appendix A.6. and A.7.
Figure 14. Greatest Opportunities in the Machining Industry over the Next Three Years for the
Business Unit and Industry
Source: www.wordle.net

Machining Industry: Survey & Focus Groups
Maxine Goodman Levin College of Urban Affairs, Cleveland State University 20
Machining Communication
Gathering information about innovation from industry experts is an important consideration for the machining businesses. As mentioned earlier, most of the resources that machine tool businesses use to gain information about innovation are external to the firm (Figure 7). Table 6 presents the responses to the question: “Please rank the top 3 ways you rely on the most for receiving information on machining innovation.” The most popular way to obtain information about machining information was trade publications (28%), followed by conferences and events (24%), and trade shows (21%).
Table 6. Top Machining Businesses Obtain Information on Innovation
Information Source Ranked
#1 Ranked
#2 Ranked
#3
Frequency of Top 3 Ranking
Percent of Respondents who Ranked
Source in Top 3
Trade Publications 12 6 5 23 28%
Conferences/Events 8 3 9 20 24%
Trade Shows 4 7 6 17 21%
Internet Searches 5 7 4 16 20%
Trade E-Newsletter 0 3 2 5 6%
Other 0 1 0 1 1%
LinkedIn/Facebook 0 0 0 0 0%
Total 29 27 26 82 100%
The infographic of Figure 15 displays three methods surveyed for information on machining to get specific information about the information source: Trade Shows Attended, Societies/Associations, and Periodicals and Newspapers. A number of respondents’ answered that they attend the International Manufacturing Technology Show (IMTs) and FABTECH. Overall, most respondents belong to the American Society of Mechanical Engineers (SME) and the Society of Manufacturing Engineers (SME), but after these two dominating groups, belonging to societies was widely dispersed among a variety of organizations. This reflects the number of industries served and the hyper-technical specialization of these small businesses. As indicated earlier in Table 6, the majority of respondents gain information on innovation from trade publications. Based upon the responses in Figure 15, one can see that the machining industry consumes a significant amount of information through periodicals and newspapers. The most frequently selected responses in this category were Modern Machine Shop (21 respondents) and Production Machining (14 respondents).

Machining Industry: Survey & Focus Groups
Maxine Goodman Levin College of Urban Affairs, Cleveland State University 21
Figure 15. Respondents Method of Receiving Information on Machining

Machining Industry: Survey & Focus Groups
Maxine Goodman Levin College of Urban Affairs, Cleveland State University 22
CHAPTER II: MACHINING FOCUS GROUPS
INTRODUCTION The Center for Economic Development (the Center) at the Maxine Goodman Levin College of Urban Affairs at Cleveland State University was retained by TechSolve to produce an online survey and conduct focus groups of Ohio businesses in the machining industry. The survey and focus groups are part of a broader effort managed by TechSolve for the Ohio Manufacturing Institute to develop a roadmap for the machining industry in Ohio. This report explores the responses of focus group participants and provides insight into their perceptions about current and future challenges in the industry. Focus groups were conducted in three cities in Ohio and were sponsored by each region’s Manufacturing Extension Partnership affiliate—Cleveland (MAGNET), Columbus (PolymerOhio), and Cincinnati (TechSolve)—in July 2014. Overall, the responses of participants were very consistent. Moreover, this consistency extended to descriptions of challenges in developing the workforce for this industry.
METHODOLOGY The Center developed the focus group protocol based on the results of the Survey of Machining Businesses in consultation with TechSolve staff. The focus group findings provide qualitative data to enhance and confirm responses collected by the Survey of Machining Businesses. Three major themes emerged from the survey that the Center and TechSolve determined required additional investigation: (1) the changing nature of customer expectations, (2) investments that businesses intend to make in the near future (less than three years, and (3) business challenges presented by the current workforce climate.21 TechSolve partnered with the Manufacturing Extension Partnership and Edison Technology Centers to host the focus groups. Each local partner recruited participants. In Cleveland, TechSolve reached out to its counterpart MAGNET to assist in identifying appropriate companies in the Cleveland metropolitan area. In Columbus, PolymerOhio was asked to identify companies in the Columbus metropolitan area. Due to the fact that TechSolve is located in Cincinnati, it already had strong connections and contacts with machining industry and recruited participants from its own network. Participants were owners or managers who operate machining businesses. The Center did not ask focus group participants questions related to their age, income, years of service with related firms or detailed background information about the companies they represent. Some focus group participants did volunteer, however, that they had been working for their companies for a number of years. Furthermore, the focus groups were not intended to be representative of all firms in the machine tool industry across Ohio, nor were companies identified based on their location within their respective cities (such as locations inside the urban core, suburban or outer-ring communities). However, an attempt was made to have a diverse selection of machining businesses from multiple industries (i.e. aerospace, machine shops, etc.). Eighteen (18) people from 17 companies participated in the three focus groups. Cleveland had 5 participants, Columbus had 4 participants; and Cincinnati had 9 participants.
21 The focus group protocol is in Appendix B.

Machining Industry: Survey & Focus Groups
Maxine Goodman Levin College of Urban Affairs, Cleveland State University 23
FOCUS GROUP RESULTS
Changing Customer Expectations
The machined products industry has transformed itself over the years in response to changes in customer expectations. The Survey of Machining Businesses, conducted by the Center, showed that customers expect faster delivery times, lower prices, and higher quality. Using these survey responses the Center chose to ask focus group participants an open-ended question to test the survey results and to provide added insights on the conclusion reached. We asked: “What has changed in regards to customer expectations in your industry?” Focus group participants across all three cities were unanimous in their opinion that expectations of customers have changed dramatically. Three main points about customer expectations emerged from both the focus groups and the survey. Demand for 100%-on-time delivery, demand for low-cost products, and the ability to do all of this with the highest product quality.
100% On-Time Delivery Meeting delivery requirements is essential for machine products businesses in order to differentiate themselves from their competition. Customers demand that machining companies deliver near-perfect on-time delivery. The ability of businesses to achieve on-time delivery depends on a number of factors including raw material delivery (the availability and wait time from suppliers), subcontractors, fluctuations in order volumes, and insufficient workforce capacity. Where lead times for tooling orders in the past were 12 weeks, lead times in the current environment based upon just-in-time manufacturing discipline have decreased significantly. Focus group participants indicated that expectations for delivery are down to 8 and sometimes 6 weeks to get a machine tool or machined parts to a client. One participant indicated that, depending on the product requested, they may have as little as 3 days to 1 week to meet the needs of a customer. The variety of orders further challenges machine tool manufactures in meeting the needs of customers. Participants indicated that, in the past, businesses produced small numbered specialized pieces of work, but today they have to be good at producing a wide variety of products with a wide variety of materials. The old push-production style typically cannot adjust for sudden shifts in what customers want or require. Though shorter and near-perfect delivery times were identified by focus group participants as a significant challenge to their business, this expectation is complicated by the inability of customers to forecast their ordering needs, which focus group participants stated is not new. On-time delivery today, however, requires improving the ability of machined product customers to predict accurately what customers will need and enhancing communication with them so that machining firms have the ability to eliminate, or at least predict, delays in production. Comments from focus group participants about on-time delivery: • Forecasting [from customers]has never been very good – they are never sure [about what they will
need] • They [the customer] want the flexibility to say I want this [product], then a few days later change
and say, no I want this. • What the customer wants changes every week. It is a constant challenge

Machining Industry: Survey & Focus Groups
Maxine Goodman Levin College of Urban Affairs, Cleveland State University 24
• Their forecasts are inaccurate – they have an inability to forecast for change, but they want a very narrow promised delivery time.
The demand for on-time delivery has additional impact on machining businesses inventory management and cash-carrying costs. Customer expectations for on-time delivery can become burdensome to the machining company because companies have to carry additional raw materials and finished goods in their inventories, both of which incur costs and have to be financed. One focus group participant elaborated on this problem by saying that he experienced this inventory squeeze and that it was, “not just-in-time inventory, more like just-in-case inventory.” Machining firms are also limited in what they can do to meet the demand of customers with some already operating on 24/7 schedules. Increased demand for raw materials, work-in process inventories, and finished inventories has led some businesses to develop new ways to hold and maintain that inventory. One participant indicated that they have developed a consignment arrangement with one of their suppliers where stock is kept at the plant and the firm does not pay for the product until it is used.
Customer Cost Constraints
Customer demands for cost reductions further challenges machining businesses. Though focus group participants spent a considerable amount of time explaining challenges related to shorter delivery times and less time discussing cost issues, participants stated that there is a constant push to lower cost. To serve as an example for how much cost savings matter today, one participant gave the example of Boeing deciding to switch its landing gear supplier after working with the same supplier for more than 20 years, based solely on cost. To industry watchers, the change by Boeing seemed sudden and unexpected, but it comes under a broader attempt by Boeing, to reduce costs and be more efficient under its Program for Success. The Goodrich Corporation “had refused to agree to Boeing’s price, and so lost the 777 landing gear contract.”22
Quality Demands
The ability to produce a high quality product is not a new requirement in the machined parts industry. However, the degree to which customers will accept errors or mistakes has narrowed, further squeezing the profit margins of machining firms. Focus group participants, in all cities, agreed that customer expectations related to product quality are very exact – “The quality bar is very high.” Customers will not accept ‘rejects’ in their orders. A participant shared an example in which they had produced three bad parts in a run of over 1 million. Though a machining firm made the order to the company’s design specifications, even going so far as to warn them there might be a problem with the design, the responsibility for the bad parts still fell on the machining company. Machining businesses are exercising other choices to ensure quality. Focus group participants indicated that they work with selected suppliers to help them improve their processes to reduce variation in the needed materials, thereby helping to reduce quality volatility.
Challenges across on-time-delivery, quality, and price
Focus group participants cited lack of communication with customers as an increasing challenge. Machining businesses feel that they have the know-how and ability to make the products customers
22 Trimble, S. (2014, July 3). Analysis: Boeing Answers Critics of Partnership for Success Campaign. Flight Global. www.flightglobal.com

Machining Industry: Survey & Focus Groups
Maxine Goodman Levin College of Urban Affairs, Cleveland State University 25
want. At times, this requires the ability to communicate directly with customers and the engineers who design the products to work out design errors. Participants pointed to a failure in the customer-company relationship for the inability to communicate effectively. A number of participants stated that many customers have become so bureaucratic that they lost the ability they once had to communicate essential information about orders directly to their customers. For the manufacturers that make others’ products (job shops), lack of communication is a problem. Particular instances discussed included times where the machining operation identified design errors in a customer’s specification, but there was no one to communicate this defect. Historically, this was not the case and participants felt it was a relatively new experience. Several focus group participants imparted that even when they were able to reach someone and inform them of design errors, the customers would not change their specifications and required them to make the product as designed with the error. However, for firms that make their own products, this is a simple interaction and fixes can occur promptly because design and production all occur internally. Focus group participants indicated they feel “squeezed from all sides” and that there is very little margin remaining for them. They either conform or lose business. The pressures that machining businesses face of on-time-delivery, low cost margins, and high-quality standards have been pushed down the supply chain to raw material suppliers and other suppliers of the machining firms. This downward push forces all those supplying the machined products industry to adjust their inventory process and cost margins as well.
Addressing Industry Challenges
Having to increase quality, decrease cost, and speed-up delivery times are significant forces in the machining industry, and each business is taking steps to address these issues. To meet competitive requirements and reduce costs, many machining businesses are turning to lean manufacturing techniques to cut cycle time and increase their competitive edge. Focus group participants identified a number of proactive changes they are making, such as equipment monitoring and preventative maintenance.
Machine Monitoring & Preventative Maintenance
Focus groups participants in all three sites said that industry forces have required them to look at aspects of their operations and to look for process innovation and improvement wherever they can find it. One participant described the challenges of being a U.S.-based manufacturer, “It has always been that if you are going to be a U.S.-based manufacturer you need to push things to the next level. You have to drive continuous improvement. Have to review things every single year.” Equipment operations and maintenance is of ever-increasing importance in achieving on-time delivery, reducing costs and improving quality. One area emphasized by the participants is machine reliability. Focus group participants specified a number of operations and maintenance considerations they are making aimed at providing more efficient operations. These include conducting quick-change repairs instead of total machine disassembly. Others are looking at purchasing redundant equipment to reduce downtime so that while one machine is being worked on, another is operational. The need to minimize downtime is important with one participant describing operating “like a pit crew for racing” where you have to be ready to perform on-the-fly for maintenance and equipment repairs.

Machining Industry: Survey & Focus Groups
Maxine Goodman Levin College of Urban Affairs, Cleveland State University 26
However, operating redundant equipment and machine repairs can only achieve so much. Understanding how to get the maximum productivity out of machines and technologies requires real-time data. One participant referred to the Toyota production model where the company knows exactly when they will need to perform the next tooling change, have the ability to track the exchange of dies, and conduct internal monitoring on machines. These monitoring systems are built into the machines and one participant indicated that, “Everybody has that capability to track [what Toyota is already doing], whether or not they use it is another question.” Participants in the three cities said that they are aware and interested in machine monitoring technologies, such as MT Connect.23,24 However, it is interesting to note that among all of the participants only one was actively utilizing monitoring equipment in their operation. This company was able to monitor each shift and machine to know via a report generated the next morning which machine had low production. Sometimes this was related to low worker productivity or poor machine functionality. Either way, this particular machining business was able to address issues in a timely manner. On one occasion, the company was able to discover that the production level was low due to the need to change the coolant in the machine during the shift. The required maintenance took the machine out of service for 4 hours. Additionally, the company, upon discovering the reason why the drop was happening, took steps to address it. They would not have known this without the machine monitoring in place, and by doing a minor repair to the coolant system, it prevented what could have been a major repair that would have taken the machine out of service for days in the future. With increased interest in machine monitoring technologies, a number of participants across the focus groups stressed that this is not an effort to reduce employees, but to get them involved in the overall management of the business and invested in their work. Companies want and need staff to think and act on how to improve the business. In this way, employees will become invested and feel a personal connection to the company’s future. Participants hope to convey to employees that this is not about monitoring them, but to monitor the shop equipment and help keep the business competitive.
Innovation Investments
Focus group participants were asked about the types of innovation initiatives and investments they are considering making over the next three years. Some firms do not have concrete plans for capital investments stating that we “Don’t have plans, but aspirations.” All respondents indicated that they regularly make capital investments and will continue to do so in the near future. Others indicated that they need to replace equipment whose life cycle is coming to an end or is already obsolete. On a positive note, some participants indicated they are looking for new or additional space since they expect to expand their business operations. Overall, many firms indicated that automation was a top investment priority. Those participants who stated this said they will investigate a wide variety of types of automation. Depending upon the type of machining business, some were working towards a “lights-out” production model, while others were
23MT Connect is royalty free standard protocol suitable for use with any type or manufacturing device. It can be used on the shop floor for production dashboard or monitoring, equipment effectiveness, production reporting and tracking, energy conservation, quality control, etc. 24 The Association for Manufacturing Technology. (2013) Getting Started with MTConnect: Monitoring Your Shop Floor – What’s in it for You? http://www.mtconnect.org/media/39437/gettingstartedwithmtconnectshopfloormonitoringwhatsinitforyourevapril4th-2013.pdf

Machining Industry: Survey & Focus Groups
Maxine Goodman Levin College of Urban Affairs, Cleveland State University 27
keeping a full workforce because they fabricate specific machine parts that needed constant employee attention. One focus group participant stated, “Technology has to be an enhancement, not replacement of employees.” However, other participants pointed out that as machines become more technically advanced, the people who run them will have to have enhanced skills as well, thereby ultimately raising overall employee productivity and value.
New Materials
Machining processes frequently require advanced materials. Advanced materials are defined as ceramics, hard-to-machine metals such as hardened-steel and alloys, as well as composites and polymers. There are added production challenges that come with the use of new materials. As yet, machining companies have not been able to obtain materials to specifications from suppliers. This results in the machining company adjusting the raw material and increasing delivery time. One company did note that they worked with their raw material supplier before ordering to meet the parts specifications so that it reduced the time of adjustment to working with the new materials. In addition, by doing this, the machining company shifted the quality burden to the raw material supplier. While new materials can create highly intricate parts, the material can be challenging to work with and difficult to machine. Others say that, the onus to learn how to machine and work with raw materials is equally on the machining firm. To address this, focus group participants said they are relying on their network of tool suppliers to find new tools. New materials may have a positive effect on machining companies’ ability to meet the increasingly shorter delivery times demanded by today’s customers. Focus group participants currently working with new materials described process innovation changes that can occur:
“….has cut 3-4 weeks out of our schedule with use of new materials. It doesn’t need to get heat treated for example. Which means it doesn’t need to go on a truck, get put in the queue, doesn’t need to be treated and then returned.”
Some companies are altering operations to use new materials, and some are pointing out additional challenges they foresee. In a 2012 piece for the Washington Post, Dr. Vivek Wadhwa of the Center for Entrepreneurship and Research Commercialization at Duke University discussed how these new materials can create new markets for manufacturers and designers:
“The key, however, is the ability to apply these materials in high volume and with low costs. This is a challenge that requires innovations in material processing technologies and more highly skilled employees to manage the complex, new manufacturing processes. Prospective employees will need extensive training in order to work in this new environment.”25
Workforce Development
Survey respondents identified workforce as a top challenge to machining businesses. Focus group participants were asked a variety of questions related to workforce challenges in an effort to understand in greater depth the problems businesses face in this arena. Questions centered on the challenges in hiring employees, aptitude and skills of the current and future workforce, and usefulness of workforce
25 Wadhwa, V. (2012, March, 6). The Future of America’s Manufacturing Sector. Washington Post. http://www.washingtonpost.com/national/on-innovations/the-future-of-americas-manufacturing-sector/2012/03/06/gIQAtWxsuR_story.html

Machining Industry: Survey & Focus Groups
Maxine Goodman Levin College of Urban Affairs, Cleveland State University 28
development resources in the state of Ohio. Moreover, focus group participants touched on challenges they are unable to resolve internally, how much they planned to invest in workforce related activities in the near future and whether their workforce challenges were an issue of access to resources or a supply-based issue. Overall, participants’ comments covered issues of workforce quality, recruitment, retention and training. In 2010, according to the Bureau of Labor Statistics Business Employment Dynamics data series, the manufacturing sector in the state of Ohio began to see gross jobs gains overtake gross jobs losses for the first time in over three years.26,27 With this dramatic three year change, the nature of some of these manufacturing jobs changed.28 The skill set required for these positions is higher and are frequently computer and software based, making the employee more valuable to the company. Both large and smaller firms are in a constant battle to both increase the skills of their existing employees and recruit new people, with new skills, into their firms.
Talent Recruitment
Focus group participants in all cities reported having significant difficulties in recruiting new employees to their businesses. One said “The guys are not out there to get.” Some focus group participants described recruitment as a pivotal crisis for manufacturing today, and called for a change in how people envision the manufacturing workplace. Participants unanimously agreed that the heart of the recruitment problem is how manufacturing is perceived in this country and in the state of Ohio. They asserted that targeted efforts need to take place to alter the long-held image of the American factory job as dirty, requiring hard physical labor, with limited opportunities for advancement. A wholesale change in this perception will offer manufacturing the ability to attract the next generation of workers. Focus group participants said that the image of the industry has to change with three groups: (1) the general public, (2) the education system, and (3) parents, specifically mothers, to positively affect the supply of labor. Focus group participants maintained that the public does not understand what manufacturing does. And most do not understand that today’s manufacturing can result in a rewarding career for young people. One responded said that, “They just aren’t out there. And the ones that are out there are there for a reason.” Second, participants believe that the current education system focuses on a 4-year university as the only post-secondary school option. A participant stated, “But we have made everybody go to college. They assume all of this debt. It gets back to the parents. The mindset is that you aren’t successful unless you go to the Division I, 4-year college.” Educators and guidance counselors need to acknowledge that not every child is “college material” and be ready to advise students about different types of educational and career options. High schools might need to revive vocational programs aimed at manufacturing and
26 There was a slight dip in the second quarter of 2012 when gross job losses were slightly above gross job gains in manufacturing for the state of Ohio. 27 Bureau of Labor Statistics. (2014). Private Sector Gross Job Gains and Gross Job Losses, Seasonally Adjusted. http://www.bls.gov/web/cewbd/oh_chart1.gif 28 Torpey, E. (2014). Got Skills? Think Manufacturing” Occupational Outlook Quarterly 58, 2, 28-42.
Machining Industry: Survey & Focus Groups
Maxine Goodman Levin College of Urban Affairs, Cleveland State University 29
other trades and develop closer links and relationships between high schools, companies, vocational education and community colleges (2-year programs). Focus group participants indicated that the most important hurdle to attracting the future workforce was parental bias. Parents, and most especially mothers, need to believe that a life working in the manufacturing sector holds opportunity for their child and is a viable career path. There opportunity for advancement in a manufacturing career. Moreover, focus group participants noted that if a younger person enters a manufacturing career they can work during the day and attend college at night. In addition, the employer will most likely pay for the college. In the end, the child will earn their bachelor’s degree without accruing a large amount of student debt, while gaining valuable skills. Some of the comments and suggestions offered by participants: • We need to convince mothers it is a good career for their children. We’ll pay for training, college,
etc. This is good business. We wonder if young individuals realize the potential for earning in this trade.
• We need to talk to the parents, not the kids. • Nobody wants to have their kids do this job. Previous research conducted by the Center for the Ohio Skills Bank identified similar findings.29 Employers involved in that research indicated the need to show manufacturing plants to students and others so that they could come in and see that shops are “air conditioned and clean – change the image of the hot, dirty shop.” Specifically, an employer described how he tried to get new employees by going straight to the source–mothers. He said that he brings roses to local high schools to give to mothers of the students there. He felt that this shows them that his company is friendly and a good place for their sons and daughters to work, as well as being a good way to introduce his company to new people. He does this because he feels that parents–and in particular, mothers–have a great deal of sway in what their children do. All focus group participants held this belief. In the absence of industry-wide public relations and marketing efforts, firms are taking it upon themselves to confront the public’s misperception of machining jobs. To change the perception, one participant described how they have ceased referring to their facility as a factory or plant, instead opting to call it a technology distribution center. At career fairs and tours, many companies have brought guidance counselors in to impress them with their facilities and show them that manufacturing is not a dirty business anymore.
Training and Upgrading Skills
A lack of basic skills is limiting the pool of candidates companies are able to hire. When asked what their biggest challenge in hiring new employees was, they indicated that getting employees to show up on time and pass a drug test poses significant barriers. One participant noted that, “At the entry-level it is attendance, ability to function within the culture and being dependable.” On the other side of this problem, companies combat the perception that there are limited opportunities available in manufacturing trades. Many of the companies participating in the focus groups offer tuition reimbursement and say they believe it is a good way to get a college degree. Although not all participating focus group companies have the ability to offer tuition reimbursement,
29 Austrian, Z., Hexter, K. & Schnoke, M. (2009). Identifying High Demand Occupations and Understanding the Needs of Northeast Ohio Manufacturers. Cleveland: Cleveland State University.

Machining Industry: Survey & Focus Groups
Maxine Goodman Levin College of Urban Affairs, Cleveland State University 30
machining firms remain supportive of their employees in seeking certifications or degrees. That message has not been widely communicated to the public at large. Since skilled trade employees are difficult to find, many companies need to grow their own workforce by starting a new employee at an entry-level or lower-skilled positions, such as in the utility department. They then have the ability to test and observe individuals with the goal of eventually moving them to the plant floor. This tactic was discussed by participants at all three focus groups. Companies have also turned to using employee referral incentives to recruit new people, although that has had limited success. One company indicated that they were unable to go through ‘the normal channels’ to fill open positions forcing them to create an online training curriculum to build their own workforce pipeline. Others offer internships as a way to identify and grow workers, with one participant saying that internships were akin to a two-year interview and allowed the company really to see if this was an individual in which they should make an investment. An unconventional strategy employed by one participant is to drive intentionally down skill requirements for entry-level workers while increasing the skill requirements for machine operators. This tactic results in a bi-furcating the workforce, allowing for larger pool of unskilled workers in entry-level positions, and retaining a smaller quantity of highly skilled technicians. This company was forced to do this because they were not able to find enough skilled labor to fill their vacancies. Once companies are able to identify entry-level workers, they still face the challenge of retaining them and upgrading the skills of this existing workforce. One participant said that in his estimation, only 1 out of 15 people who start out will become a skilled machinist. Furthermore, focus group participants indicated that it takes a very long time and a significant investment to move someone from an entry-level position into a skilled job in the company, citing that it takes anywhere from 5 to 10 years to move through this process. Nevertheless, the need to ‘up-skill’ workers is essential. Several focus group participants indicated that their businesses had internal training programs or strategies to address the skills gaps in their current workforce. Fifty-eight percent (58%) of survey respondents indicated that they use external training providers. Many of the focus group participants from mid-sized and smaller company indicated that they use external training programs and providers, while the larger companies generally had internal training in place. Many of the training resources identified were well known to the community and often included community colleges, vocational, technical programs and career centers. Focus group participants indicated that they are actively partnering with existing training providers to ensure their employees have the skills required. Some firms are unable to employ such tactics. Training challenges exist for them because a single employee must have the ability to perform a number of different functions. “One person has to be ‘all facets’ welding, machining, pipefitting and sheet metal. They have to be able to do it all.” For some shops this means that individual employees need to have a number of skills that used to be provided by several employees, each dedicated to a single skill. “In manufacturing, talent is king. Locating employees, attracting them to your company, training them in hopes they will stay and then finding

Machining Industry: Survey & Focus Groups
Maxine Goodman Levin College of Urban Affairs, Cleveland State University 31
others that can meet ever changing needs is the goal.”30 Though the issues related to workforce were universal across focus groups, the manner in which these issues were being addressed was unique to their local environments.
Addressing the Workforce Challenge Regionally
Participants in the Cleveland focus group displayed a greater degree of collaboration and cooperation in addressing the workforce issues than in the other cities. Participants said they felt a commitment to the manufacturing industry to find solutions – that would ultimately benefit each of them. Cleveland focus group participants also identified a broader range of institutions and organizations having a role in training, with a greater emphasis on universities and the higher education system as a whole. Cincinnati focus group participants demonstrated a greater degree of competitiveness and heightened concerns about poaching employees by other companies, resulting in a reluctance to make significant investments in training. Unlike the Cleveland participants, Cincinnati did not express the need for a collective system of training. One participant stated, “We have an apprenticeship program. The fear is to train people and then have them bought away from you after the program.” Participants in Cincinnati did acknowledge that there was no centralized place to go to solve their workforce issues. In Columbus, participants described training programs and centers that were doing a pretty good job of understanding their needs and working to meet them, although the system they described was more fragmented. They indicated that there are some long-standing technical training organizations on which companies rely. Columbus participants were the only ones to mention that they felt there was an important role for the state to play by incentivizing training.
30 Selko, A. (2014, August 11). Expansion Management: Puerto Rico -- Supplying Today's Talent and Growing Tomorrow's. Industry Week

Machining Industry: Survey & Focus Groups
Maxine Goodman Levin College of Urban Affairs, Cleveland State University 32
APPENDIX A
A.1. Machine Tool Survey Questionnaire
Dear Sir/Madame: The Center for Economic Development (The Center) at Cleveland State University’s Maxine Goodman Levin College of Urban Affairs is conducting research on the challenges to the machining industry in the state of Ohio. On behalf of TechSolve, we are asking you to participate in this confidential survey. The survey will take approximately 15 minutes of your time. All responses are strictly confidential and the data will be aggregated across the entire spectrum of respondents, so that no information can be attributed to any one individual or company. Informed Consent: Your participation in the study is voluntary. You may withdraw from the research and discontinue the survey at any time. All participants shall remain anonymous in the reported research findings; no individual responses will be made public without his/her written permission. If you have any questions regarding your rights as a research subject, you may contact the Center for Economic Development at Cleveland State University, 216-875-9967. I am aware of my rights as a research subject and agree to take the survey: Yes
No
If No Is Selected, Then Skip to End of Survey
Q2 Click to write the question text
Contact Job Title: City of Business Unit:
Q3 Is there a headquarters function at this location? Yes
No
Q4 Does manufacturing take place at this location? Yes
No
Q5 Approximately, how many full-time employees does your company employ? 1 to 25
26 to 50
51 to 100
101 to 250
251 to 500
Over 500

Machining Industry: Survey & Focus Groups
Maxine Goodman Levin College of Urban Affairs, Cleveland State University 33
Q6 Which of the following matches your company’s sales? Less than $10 million
$10 million to $50 million
$51 million to $100 million
$101 million to $500 million
Over $500 million
Q7 Does your business unit: (Check all that apply) Manufacture machine tools
Design machine tools
Use machine tools to manufacture discrete parts
Use machine tools to manufacture assemblies
Use machine tools to manufacture a final product comprised of multiple machined parts
Provide secondary process of machined parts (i.e., heat treating, anodizing, coating, etc.)
Combine other company’s machine tools with your products
Combine your machine tools with other company’s products
Act as a seller
Does not manufacture or use machine tools
Other ____________________
Q8 What industries does your business unit serve? (check all that apply) Aerospace
Automotive
Biomedical
Consumer Products
Energy
Instruments, controls, electronics
Agriculture and/or food processing
Other: (8) ____________________
Q9 What products does your business unit manufacture (as a percentage of sales)? Percentage of Sales ______ Product 1: ______ Product 2: ______ Product 3: ______ Product 4: ______ Product 5: Q10 What do you see as the three greatest challenges for your industry in the next 3 years?
Challenge 1: Challenge 2: Challenge 3:

Machining Industry: Survey & Focus Groups
Maxine Goodman Levin College of Urban Affairs, Cleveland State University 34
Q11 What do you see as the three greatest opportunities for your industry in the next 3 years? Opportunity 1: Opportunity 2: Opportunity 3:
Q12 What type(s) of machining does your business unit engage in? (check all that apply) Machining Centers (milling, drilling, boring) – 3 axis
Machining Centers (milling, drilling, boring) – 4 axis
Machining Centers (milling, drilling, boring) – 5 axis
Non-Conventional Processes – EDM
Non-Conventional Processes – ECM
Non-Conventional Processes – Water-jet
Non-Conventional Processes – Laser
Lathes
Grinding machines
Milling machines (
Turning centers
Other: ____________________
Q13 What do you see as the three greatest challenges for your business unit in the next 3 years?
Challenge 1: Challenge 2: Challenge 3:
Q14 What do you see as the three greatest opportunities for your business unit in the next 3 years?
Opportunity 1: Opportunity 2: Opportunity 3:
Q15 Please order your top 3 innovation challenges that your businesses unit struggles with (drag items from left column to box on right):
Top 3 Innovation Challenges
Changes in customer expectations (delivery time, quality, and/or prices)
Integrated computer manufacturing: design, model, simulation and production
Information networking, monitoring, and connecting machine tools and other manufacturing assets
Regulatory environment (environmental, import/export compliance)
Upgrading skills of workforce
Working with new materials (composites and hard to machine materials)
Other (1):
Other (2):

Machining Industry: Survey & Focus Groups
Maxine Goodman Levin College of Urban Affairs, Cleveland State University 35
Q16 When looking to innovate, what resource(s) do you rely on/use? (check all that apply) External non-profit manufacturing or technology centers/organizations
Federal agencies and/or labs
Hired consultants
Internal work-groups
Professional societies/associations
Trade organizations
Universities and community colleges
Vendors and suppliers
Other (1): ____________________
Other (2) ____________________
Q17 In the last three years, has your business unit had problems obtaining financing in any of these areas? (check all that apply) N/A
Acquiring new businesses
Equipment financing
Facility acquisition or improvements
IT infrastructure
Working capital for business expansion
Work-in-process inventory
Other (1): ____________________
Other (2): ____________________
Q18 What type(s) of innovation investment(s) are you looking to make in the next three years? (check all that apply) N/A
Acquiring new businesses
Equipment financing
Facility acquisition or improvements
IT infrastructure
Working capital for business expansion
Work-in-process inventory
Other (1): ____________________
Other (2): ____________________

Machining Industry: Survey & Focus Groups
Maxine Goodman Levin College of Urban Affairs, Cleveland State University 36
Q19 Have your customer expectations changed in any of the following areas in the last three years? (check all that apply) Design
Process
Delivery Time
Prices
Products
Quality
Traceability
Other ____________________
Answer If Have your customer expectations in any of the following areas in the last three years? (check
all that apply) Design Is Selected
Q20 How have changing customer expectations in Design altered your profit margin? Answer If Have your customer expectations in any of the following areas in the last three years? (check
all that apply) Process Is Selected
Q21 How have changing customer expectations in Process altered your profit margin? Answer If Have your customer expectations in any of the following areas in the last three years? (check
all that apply) Delivery Time Is Selected
Q22 How have changing customer expectations in Delivery Time altered your profit margin? Answer If Have your customer expectations in any of the following areas in the last three years? (check
all that apply) Prices Is Selected
Q23 How have changing customer expectations in Prices altered your profit margin? Answer If Have your customer expectations in any of the following areas in the last three years? (check
all that apply) Products Is Selected
Q24 How have changing customer expectations in Products altered your profit margin? Answer If Have your customer expectations in any of the following areas in the last three years? (check
all that apply) Quality Is Selected
Q25 How have changing customer expectations in Quality altered your profit margin? Answer If Have your customer expectations in any of the following areas in the last three years? (check
all that apply) Traceability Is Selected
Q26 How have changing customer expectations in Traceability altered your profit margin? Answer If Have your customer expectations in any of the following areas in the last three years? (check
all that apply) Other Is Not Empty
Q27 How have changing customer expectations in Other altered your profit margin?
Machining Industry: Survey & Focus Groups
Maxine Goodman Levin College of Urban Affairs, Cleveland State University 37
Q28 How has the use of new materials (i.e. composites, new alloys, etc.) in your industry caused challenges for your business unit? (check all that apply) Challenge in acquiring new materials
Current machine tools are not compatible with new materials
Business unit does not know methods, processes, or how to machine new materials
Workforce is not knowledgeable on how to machine new materials
Variation in the quality or specifications of materials
Price volatility of new materials causes challenges
Other: ____________________
Q29 Is the availability of domestic natural gas changing the way you do business? Yes
No
If No Is Selected, Then Skip To In the last 3 years, has your b...
Q30 How has the availability of domestic natural gas changed your business unit? (check all that apply) Looking to purchase capital equipment that will be powered by natural gas
Already purchased capital equipment powered by natural gas
Looking to convert some/all of our capital equipment to be powered by natural gas
Other (1): ____________________
Other (2): ____________________
Q31 In the last 3 years, has your business unit looked to fill any new positions? Yes
No
If No Is Selected, Then Skip To In recruiting new employees, have you...

Machining Industry: Survey & Focus Groups
Maxine Goodman Levin College of Urban Affairs, Cleveland State University 38
Q32 What occupations have you looked to fill in the last 3 years? Have you had issues finding qualified applicants?
How long did it take you to fill the position?
Qualified Pool of
Applicants Available?
N/A Less than 3 Months
3 to 6 Months
6 to 9 Months
9 Months to 12
Months
Greater than 12 Months
Yes No
Engineers
Office Management
Plant Management
IT Specialists
Electro mechanical Maintenance Technicians
CNC Programmers
Machine Operators
Model Makers
Tool Makers
QA/CMM Technicians
Machinists
Welders
Other (1):
Other (2):
Q33 In recruiting new employees, have you used any of the following resources and if so, what how would you rate their usefulness? (check all that apply)
Have you used the
resource? Resource Usefulness
Yes No N/A Very
Useful Useful Neutral Useless
Very Useless
Ohio Means Jobs Website
Ohio Means Jobs Service Centers (i.e. Workforce Investment Boards)
Ohio Means Internships Web Site
Community College Placement Centers
University/College Placement Centers
Job Fairs
Web-site Postings
Headhunters/Recruiters
Other

Machining Industry: Survey & Focus Groups
Maxine Goodman Levin College of Urban Affairs, Cleveland State University 39
Q34 What is the most significant challenge your business unit faces in hiring employees? (select all that apply)Applicants do not have: The ability to pass a drug test
The ability to work in teams
Appropriate skills and training for designated job
Enough experience
Punctuality
Soft skills (i.e. communication, enthusiasm)
Other: ____________________
Q35 Do you utilize external training providers to upgrade current employee skills? Yes
No
If No Is Selected, Then Skip To Please rank the top 3 ways you rely on...
Q36 What training providers do you use most frequently? (check all that apply) Community colleges
Consultants
External non-profit manufacturing or technology centers/organizations (3)
On-line training providers
Technical centers
Trade associations
Unions
Universities
Vocational high schools
Other: ____________________
Q37 Please rank the top 3 ways you rely on the most for receiving information on machining innovation (drag items from left column to box on right):
Top 3 Ways
______ Conferences/Events
______ Internet searches
______ LinkedIn/Facebook
______ Trade Publications
______ Trade Shows
______ Trade E-Newsletter
______ Other:

Machining Industry: Survey & Focus Groups
Maxine Goodman Levin College of Urban Affairs, Cleveland State University 40
Q38 What trade shows do you attend? (check all that apply) AmCon
AME Innovation Summit
AME Regional Conferences
Automate
Eastern States Exposition (EASTEC)
FABTECH
IEE Annual Conference & Expo
International Manufacturing Technology Show (IMTs)
Production Machining Trade Show
ProMat
Other: ____________________
Q39 What Societies/Associations do belong to? (check all that apply) American Society of Mechanical Engineers (ASME)
American Society of Metals
American Welding Society
Association for Manufacturing Technology (AMT)
Chemical Coaters Association of America
Forging Industry Association
National Tooling and Machining Association
Precision Machined Products Association
Precision Metal Forming Association
Society of Manufacturing Engineers (SME)
Other: ____________________
Q40 What Periodicals/Newsletters do you read about innovation? (check all that apply) American Machinist
American Metal Market (AMM)
Cutting Tool Engineering
Modern Metals
Modern Machine Shop
Production Machining
Products Finishing
Stamping Journal
The Fabricator
The Tube & Pipe Journal
Tooling & Production
Welding and Cutting Magazine
Welding Journal
Other: ____________________

Machining Industry: Survey & Focus Groups
Maxine Goodman Levin College of Urban Affairs, Cleveland State University 41
A.2. Occupations Machine Tool Companies Have looked to Fill in the Last Three Years by Length of time to Fill Vacancy
Occupation Length of time it took to fill the position Yes, there was a qualified pool of
applicants N/A Less
than 3 months
3 to 6 months
6 to 9 months
9 to 12 months
More than 12 months
Sum
Engineers 1 6 10 1 3 0 21 71%
Office Management 1 5 2 1 0 1 10 92%
Plant Management 3 1 6 2 1 1 14 57%
IT Specialists 3 4 1 2 0 1 11 78%
Electro mechanical Maintenance Technicians
4 2 2 3 2 0 13 33%
CNC Programmers 3 1 3 4 3 0 14 20%
Machine Operators 1 12 3 2 0 0 18 50%
Model Makers 3 1 0 0 0 1 5 50%
Tool Makers 3 4 3 4 1 2 17 39%
QA/CMM Technicians
1 3 4 0 1 1 10 50%
Machinists 1 4 9 6 2 0 22 25%
Welders 4 2 5 2 0 0 13 27%
Other 2 3 2 0 0 0 7 71%
Total 30 48 50 27 13 7 175 49%
A.3. Workforce Development Resource by Usage and Usefulness
Resources Yes, I have used
this resource
Resource Usefulness Highest response
rate N/A Very Useful
Useful Neutral Useless Very Useless
Sum
Ohio Means Jobs Website 30% 4 1 3 3 1 1 13 31%
Ohio Means Jobs Service Centers
21% 5 1 3 2 0 0 11 45%
Ohio Means Internships Website
4% 6 0 1 0 0 0 7 86%
Community College Placement Centers
73% 2 2 13 5 2 0 24 54%
University/College Placement Centers
52% 2 1 9 2 1 0 15 60%
Job Fairs 65% 3 2 7 6 3 0 21 33%
Website Postings 90% 0 4 12 7 1 0 24 50%
Headhunters/Recruiters 66% 1 7 4 4 1 1 18 39%
Other 80% 0 5 1 0 0 0 6 83%
Total 51% 23 23 53 29 9 2 139 38%

Machining Industry: Survey & Focus Groups
Maxine Goodman Levin College of Urban Affairs, Cleveland State University 42
A.4. Greatest Challenges for Machining Business Units
Business Unit Opportunities Response Count
Business Unit Opportunities Response Count
Additive machining 1 Machinists 1
Banking 1 Management obstinacy 1
Competition 2
Market acceptance of non-certified companies 1
Competition from low-labor regions 1 Material costs 2
Costs 1 Multi-axis machining 1
Discrimination 1 New products 1
Economic pessimism 1 Obamacare 1
Economy 1 OEM prices 1
Employees 2 On-time NPD 1
Energy costs 2 Product consolidation 1
EPA restrictions 1 Qualified labor 3
Facility capacity 3 Retirements 2
Financing 1 Skilled labor 8
Government regulation 2 Succession planning 1
Growth 2 Talent recruitment 1
Health insurance 1 Talent retention 4
Healthcare costs 2 Taxes 1
High-tech components 1 Training 1
Hiring 2 Turnover 1
Innovation 1 Workforce 2
Total 64

Machining Industry: Survey & Focus Groups
Maxine Goodman Levin College of Urban Affairs, Cleveland State University 43
A.5. Greatest Challenges for the Machining Industry
Business Unit Opportunities Response Count
Business Unit Opportunities Response Count
6-axis work 1 Healthcare costs 6
Access to capital 1 Hiring qualified personnel 2
Additive machining 1 Hiring skilled labor 1
Age of manufacturing equipment 1 Innovation 1
Capital 4 International competition 5
Cash flow 1 Market penetration 1
Computerization 1 Negative perception of manufacturing 1
Cost reduction 1 Obamacare 1
Developing new products 1 Outsourcing 1
Economic uncertainty 1 Price pressure from OEMs 1
economy 3 product differentiation 1
employees 1 Qualified workers 2
Energy costs 2 Quality 1
Facility 1 retirements 1
Financing growth 1 Skilled labor 17
Geo-political issues 1 Skilled labor retention 1
Global competition 1 Space 1
Government 3 Succession planning 1
Government mandates 2 Talent retention 3
Government regulation 4 Taxes 2
Growth 3 Training 1
Health insurance 1 Workforce 1
Total 88

Machining Industry: Survey & Focus Groups
Maxine Goodman Levin College of Urban Affairs, Cleveland State University 44
A.6. Greatest Opportunities for Machining Business Units
Business Unit Opportunities Response Count
Business Unit Opportunities Response Count
Additive machining 1 Market growth 1
Advanced materials 1 Material management equipment 1
Affordable healthcare 1 Multi-axis 1
Agriculture 1 New applications 1
Automation energy 1 New business 1
Automotive production increase 3 New capital equipment 1
Efficiency 1 New customers 2
Expansion 1 New machinery 1
Exporting 1 New markets 4
Facility consolidation 1 New products 4
Foreign investors 1 NPD introductions 1
Global diversification 1 Ohio-business friendly environment 1
Growth of existing business 1 Process innovation 1
Improved aerospace market 1 Product diversification 1
Improving economy 1 Quality improvement 1
Increased sales 1 Reputation 1
Involvement with high-schoolers 1 Reshoring 3
Lack of competition 1 Technology 1
Live tool sales 1 Training 1
Manufacturing growth 1 Work holding sales 1
Market demand 1 - -
Total 52
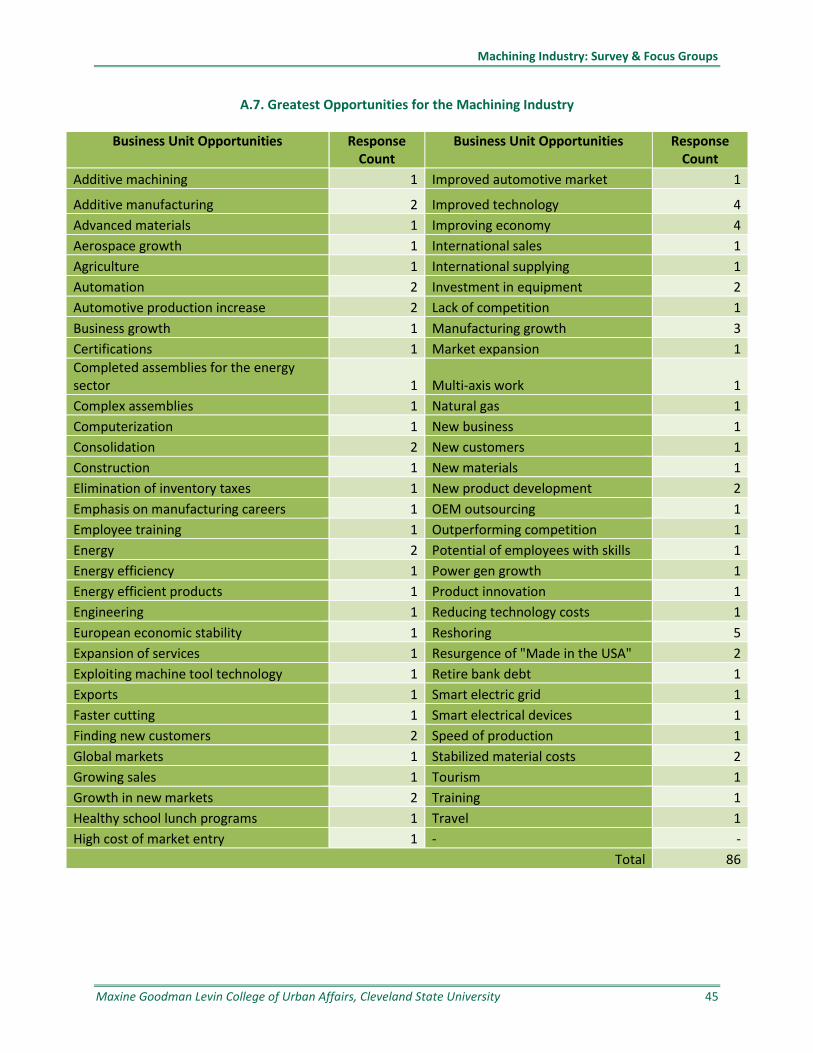
Machining Industry: Survey & Focus Groups
Maxine Goodman Levin College of Urban Affairs, Cleveland State University 45
A.7. Greatest Opportunities for the Machining Industry
Business Unit Opportunities Response Count
Business Unit Opportunities Response Count
Additive machining 1 Improved automotive market 1
Additive manufacturing 2 Improved technology 4
Advanced materials 1 Improving economy 4
Aerospace growth 1 International sales 1
Agriculture 1 International supplying 1
Automation 2 Investment in equipment 2
Automotive production increase 2 Lack of competition 1
Business growth 1 Manufacturing growth 3
Certifications 1 Market expansion 1
Completed assemblies for the energy sector 1 Multi-axis work 1
Complex assemblies 1 Natural gas 1
Computerization 1 New business 1
Consolidation 2 New customers 1
Construction 1 New materials 1
Elimination of inventory taxes 1 New product development 2
Emphasis on manufacturing careers 1 OEM outsourcing 1
Employee training 1 Outperforming competition 1
Energy 2 Potential of employees with skills 1
Energy efficiency 1 Power gen growth 1
Energy efficient products 1 Product innovation 1
Engineering 1 Reducing technology costs 1
European economic stability 1 Reshoring 5
Expansion of services 1 Resurgence of "Made in the USA" 2
Exploiting machine tool technology 1 Retire bank debt 1
Exports 1 Smart electric grid 1
Faster cutting 1 Smart electrical devices 1
Finding new customers 2 Speed of production 1
Global markets 1 Stabilized material costs 2
Growing sales 1 Tourism 1
Growth in new markets 2 Training 1
Healthy school lunch programs 1 Travel 1
High cost of market entry 1 - -
Total 86
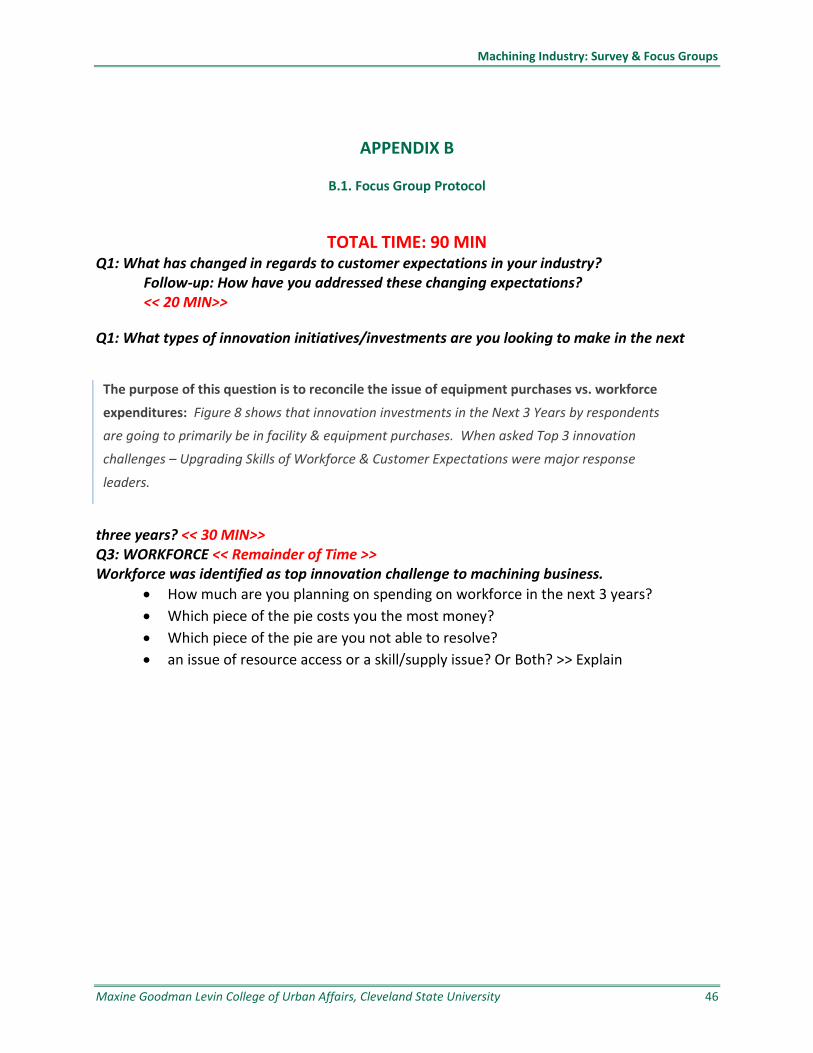
Machining Industry: Survey & Focus Groups
Maxine Goodman Levin College of Urban Affairs, Cleveland State University 46
APPENDIX B
B.1. Focus Group Protocol
TOTAL TIME: 90 MIN Q1: What has changed in regards to customer expectations in your industry? Follow-up: How have you addressed these changing expectations?
<< 20 MIN>>
Q1: What types of innovation initiatives/investments are you looking to make in the next
three years? << 30 MIN>> Q3: WORKFORCE << Remainder of Time >> Workforce was identified as top innovation challenge to machining business.
How much are you planning on spending on workforce in the next 3 years?
Which piece of the pie costs you the most money?
Which piece of the pie are you not able to resolve?
an issue of resource access or a skill/supply issue? Or Both? >> Explain
The purpose of this question is to reconcile the issue of equipment purchases vs. workforce
expenditures: Figure 8 shows that innovation investments in the Next 3 Years by respondents
are going to primarily be in facility & equipment purchases. When asked Top 3 innovation
challenges – Upgrading Skills of Workforce & Customer Expectations were major response
leaders.