machining surface roughness monitoring using...
TRANSCRIPT

MACHINING SURFACE ROUGHNESS MONITORING USING ACOUSTIC
EMISSION METHOD
MOHD SYAZLAN BIN MOHD HATTA
Report submitted in partial fulfilment of the requirements
for the award of the degree of
Bachelor of Mechanical Engineering
Faculty of Mechanical Engineering
UNIVERSITI MALAYSIA PAHANG
DECEMBER 2010
ii
SUPERVISOR’S DECLARATION
I hereby declare that I have checked this project and in my opinion, this project is
adequate in terms of scope and quality for the award of the degree of Bachelor of
Mechanical Engineering.
Signature:
Name of Supervisor: Mr. CHE KU EDDY NIZWAN BIN CHE KU HUSSIN
Position: LECTURER
Date: 6 DECEMBER 2010
iii
STUDENT’S DECLARATION
I hereby declare that the work in this project is my own except for quotations and
summaries which have been duly acknowledged. The project has not been accepted for
any degree and is not concurrently submitted for award of other degree.
Signature:
Name: MOHD SYAZLAN BIN MOHD HATTA
ID Number: MA07090
Date: 6 DECEMBER 2010

v
ACKNOWLEDGEMENTS
I am grateful and would like to express my sincere gratitude to my supervisor
Mr.Che Ku Eddy Nizwan Che Ku Hussin for germinal ideas, invaluable guidance,
continuous encouragement and constant support in making this research possible. He
has always impressed me with his outstanding professional conduct, his strong
conviction for science, and his belief that a Degree program is only a start of a life-long
learning experience. I am truly grateful for his progressive vision about my training in
science, his tolerance of my naive mistakes, and his commitment to my future career. I
also would like to express very special thanks for their suggestions and co-operation
throughout the study. I also sincerely thanks for the time spent proofreading and
correcting my many mistakes.
My sincere thanks go to all my lab mates and members of the staff of the
Mechanical Engineering Department, UMP, who helped me in many ways and made
my stay at UMP pleasant and unforgettable. Many special thanks go to member engine
research group for their excellent co-operation, inspirations and supports during this
study.
I acknowledge my sincere indebtedness and gratitude to my parents for their
love, dream and sacrifice throughout my life. I cannot find the appropriate words that
could properly describe my appreciation for their devotion, support and faith in my
ability to attain my goals. Special thanks should be given to my committee members. I
would like to acknowledge their comments and suggestions, which was crucial for the
successful completion of this study.
vi
ABSTRACT
This thesis is to investigate the machining surface roughness monitoring using
acoustic emission method. The objective of this project is to collect the data acquisition
of the experiment by operating milling process, to study the correlation of AE parameter
with work piece surface quality by comparing the AE signals with average roughness,
Ra of the work piece’s surface measured by using Perthometer, and to develop
algorithm for online machining condition monitoring. In order to done this experiment,
there are several steps to be taken. Firstly is the experimental setup. Milling machine
will be used through this project. Work piece will be placed on the table and the cutting
tool will rotate continuously. AE sensor will be placed on the work piece, and
adhesively bonded onto the surface of the work piece with grease applied between the
specimen and the sensors. Before experiment is started, the AE system need to be tested
first to check whether AE system can receive AE signals properly. This can be done by
using pencil break test. When lead of pencil break, it will generate as equal signal as AE
signal emitted during experiment. Then, the experiment is run using carbide coated
cutting tool and Aluminium alloy for work piece. Machine parameter use will be varies
to get different pattern of AE signal, as different value of surface roughness also will be
collected. From all data collected (energy, counts, power spectrum density, Ra),
algorithm for surface roughness monitoring can be made and be used in industry. Based
on experiment data, the pattern of AE parameter with Fast Fourier Transform, FFT can
be concluded. For smooth surface, Ra value in range of 0.643 µm – 0.879 µm will have
the frequency below 1 Hz and amplitude is high only at that value. For the rough
surface, Ra value in range of 2.833 µm – 3.004 µm will have the frequency from 1 Hz
to 2 Hz and amplitude is high continuously at that value. In term of count, smooth
surface will generate counts in range of 20 000 to 30 000 and rough surface will counts
30 000 and above.
vii
ABSTRAK
Tesis ini ditulis untuk pemantauan kekasaran permukaan bahan dalam
permesinan menggunakan kaedah pancaran akustik. Objektif projek ini adalah untuk
mengumpul data dengan menjalankan operasi pengisaran, mengkaji kaitan antara
parameter AE dengan kekasaran bahan, Ra menggunakan Perthometer, dan membina
algoritma untuk pemantauan mesin secara terus. Untuk menjalankan kajian ini,
beberapa langkah perlulah dilakukan terlebih dahulu. Pertama adalah penyediaan mesin.
Mesin pengisaran akan digunakan sepanjang proses ini. Bahan kerja akan diletakkan di
atas meja kerja dan pekakas pemotong akan berputar secara berterusan. AE sensor akan
diletakkan di tepi bahan kerja dan dilekatkan dengan gris antara permukaan sensor dan
tepi bahan kerja. Sebelum kajian dimulakan, sistem pancaran akustik perlulah dicuba
terlebih dahulu untuk mengesan jika sistem boleh menerima isyarat dengan baik. Ini
boleh dilakukan dengan ujian patah mata pensil. Apabila mata pensil patah, ia akan
mengeluarkan sejumlah isyarat sama seperti isyarat pembebasan akustik semasa kajian
dilakukan. Kemudian, kajian dijalankan dengan menggunakan mata pemotong karbida
bersalut dan bahan kerja aluminium. Parameter pemesinan adalah berlainan bagi setiap
set kajian untuk mendapatkan corak pembebasan akustik yang berlainan dan nilai
permukaan bahan yang berlainan. Berdasarkan data dari kajian, corak parameter AE dan
Penjelmaan Fourier Pantas, FFT dapat disimpulkan. Untuk permukaan yang halus, nilai
Ra antara 0.643 µm – 0.879 µm akan menghasilkan frekuensi bawah 1 Hz dan amplitud
tinggi hanya pada nilai itu sahaja. Bagi permukaan kasar, nilai Ra antara 2.833 µm –
3.004 µm akan mempunyai frekuensi diantara 1 Hz dan 2 Hz dan amplitudnya adalah
tinggi secara berterusan. Dalam terma hitungan pula, permukaan halus akan
menghasilkan bacaan antara 20 000 hingga 30 000 dan permukaan kasar pula adalah
lebih daripada 30 000.

viii
TABLE OF CONTENTS
Page
SUPERVISOR’S DECLARATION ii
STUDENT’S DECLARATION iii
ACKNOWLEDGEMENTS v
ABSTRACT vi
ABSTRAK vii
TABLE OF CONTENTS vii
LIST OF TABLES xi
LIST OF FIGURES xii
LIST OF SYMBOLS
LIST OF ABBREVIATIONS
xiv
xv
CHAPTER 1 INTRODUCTION
1.1 Project Background 1
1.2 Problem statement 2
1.3 Objective of the Research 3
1.4 Hypothesis 4
1.5 Scope of work 4
CHAPTER 2 LITERATURE REVIEW
2.1 Introduction 5
2.2 Types of machining 6
2.2.1 Turning Process 7
2.2.2 Milling Process 9
2.2.3 Drilling Process 11
2.2.4 Grinding Process 12
2.3 Machining parameter 14
2.3.1 Cutting Tool 14
2.3.2 Tool wear and tool life 15
ix
2.3.3 Material for cutting tools 16
2.3.4 Cutting Speed 18
2.3.5 Spindle Speed 19
2.3.6 Feedrate 20
2.4 Surface finish 21
2.4.1 Components of surface topography 22
2.4.2 Measuring surface roughness 22
2.5 Chip formation 24
2.6 Tool wear 26
2.7 Acoustic emission 29
2.7.1 Introduction 29
2.7.2 Principles of acoustic emission testing 29
2.7.3 Acoustic emission source 30
2.7.4 Acoustic emission signal 31
2.7.5 AE signal correction 32
2.7.6 AE application in machining 33
2.7.7 Time series analysis 37
2.7.8 Fourier transform 37
2.7.9 Gabor transform 38
2.7.10 Wavelet transform 38
CHAPTER 3 METHODOLOGY
3.1 Introduction 40
3.2 Experimental setup 42
3.2.1 Monitoring System for Milling Process 43
3.2.2 Sensor calibration 44
3.3 Running experiment 45
3.3.1 Experiment parameters 45
3.3.2 Machine run and storing AE data 47
3.3.3 Measuring surface roughness 49
3.4 Data analysis 50
3.4.1 Transient data – power spectrum density 51
x
3.4.2 Energy 51
3.4.3 Count rate 51
3.4.4 Data validation 51
3.5 Expected result 51
CHAPTER 4 RESULT AND DISCUSSIONS
4.1 Introduction 52
4.2 Experimental result 52
4.3 Data interpretation 55
4.4 Conclusion 60
CHAPTER 5 CONCLUSION AND RECOMMENDATIONS
5.1 Conclusion 61
5.2 Recommendations 62
REFERENCES 63
APPENDICES
A MATLAB®
coding 65
B Gantt chart Final Year Project 1 66
C Gantt chart Final Year Project 2 67

xi
LIST OF TABLES
Table No. Title Page
2.1 Maximum acceptance flank wear 16
2.2 n value 18
2.3
Recommended Cutting Speed for Milling in Feet per
Minute.(fpm)
19
2.4 Data on the work piece material 34
3.1 Values of parameters used in setup the AE system 45
3.2 Composition of Aluminium alloy (AA6061-T6) 46
3.3 Mechanical properties for Aluminium alloy (AA6061-T6) 46
3.4 Factors and levels used in the machining experiment 47
3.5 Machining parameter in milling process 47
4.1 Roughness average, Ra
55
4.2 Frequency value and maximum amplitude
60
xii
LIST OF FIGURES
Figure No. Title Page
2.1 Lathe machine 7
2.2 Cutting process 8
2.3 Facing 8
2.4 Milling process 9
2.5 Typical Column-And-Knee Type Manual Mill 10
2.6 Separated part of milling machine 10
2.7 Drilling process 11
2.8 Drilling area 12
2.9 Grinding process 13
2.10 Schematic diagram of surface 21
2.11 Two keys surface parameter; Ra and D 22
2.12 Surface roughness produced by common production method 23
2.13
2.14
2.15
2.16
2.17
2.18
2.19
2.20
2.21
2.22
Chip Formation
Chip types
Cutting edge and adjacent surfaces
Common wear modes
Definition of flank, nose, and crater wear.
Relation between tool wear and tool life
Schematic of acoustic emission process
AE generation during metal cutting
Typical AE signal in turning
AE signal correction and pre-processing
24
25
26
27
28
28
30
31
31
33

xiii
2.23
2.24
3.1
3.2
3.3
3.4
3.5
3.6
3.7
3.8
4.1
4.2
4.3
4.4
4.5
4.6
4.7
4.8
A guide for choosing the coated carbide or cemented tools
Power spectra of the acquired AE signals when using different
tools at different wearing stages.
Progress of experiment
CNC milling machine in UMP
AE measurement process
Setup of pencil lead break test
Location of AE sensor
Portable AE machine
Surface roughness machine in metrology lab, UMP
A typical waveform of an AE event with major AE parameters.
AE parameter for Set A
AE parameter for Set F
AE parameter for Set H
AE parameter for Set I
Set A: a) AE count; b) FFT
Set F: a) AE count; b) FFT
Set H: a) AE count; b) FFT
Set I: a) AE count; b) FFT
34
35
41
42
43
44
48
48
49
50
53
53
54
54
56
57
58
59

xiv
LIST OF SYMBOLS
Ra Roughness average
vc Cutting speed
% Percent
dB Decibel
Dc Depth of cut
f Feed

xv
LIST OF ABBREVIATIONS
AE Acoustic Emission
FFT Fast Fourier Transform
CNC Computer Numeric Control
RPM Spindle speed
N Number of tooth
CPT Chip per tooth
PSD Power spectral density
2
and save more time and cost for the industries. For the offline method, data cannot be
taken unless the machine is stop first. The cutting tool have to be looked under the
microscope to analyze the microstructure of it before any assumption can be made
about the tool. By differentiate both of this method, we can know that online method is
more applicable for industries due to its benefits which is save time and cost. For this
experiment, Acoustic Emission signal analysis is used. The choice of this type of
monitoring is because the machining monitoring can be done while the machine is still
running. Besides, data get from the experiment is more accurate due to the location of
sensor. In this experiment, the sensor will take direct reading from the cutting tool and
therefore data is not influenced by other source. The main field of application for AE
sensors is tool breakage detection. At the instant of breakage, there is a sudden
jump in the signal. In order to detect this signal peak, a dynamic threshold crossed
by a tool breakage is calculated on-line from the signal. The resulting threshold
easily follows gradual changes in the signal, due for example to changing depths-
of-cut, but is violated by steep-flanked signal peaks. Violation of the threshold
therefore indicates a tool breakage.(Kbnig et al, 1994)
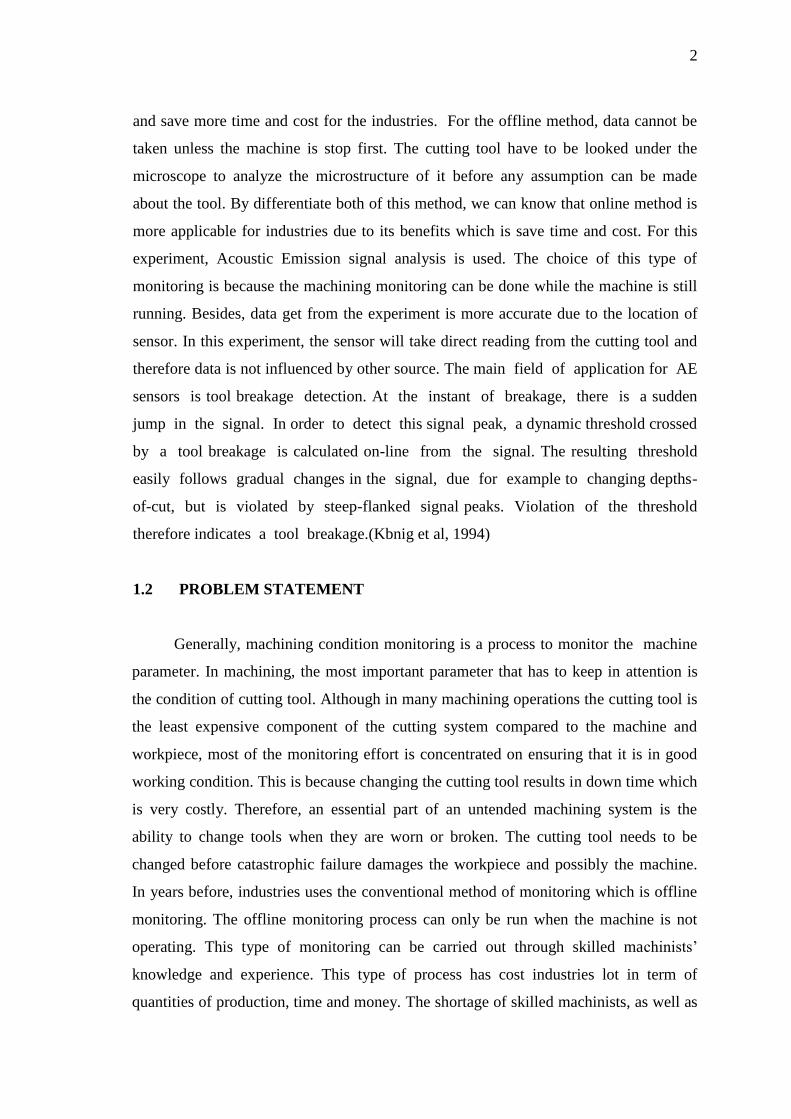
1.2 PROBLEM STATEMENT
Generally, machining condition monitoring is a process to monitor the machine
parameter. In machining, the most important parameter that has to keep in attention is
the condition of cutting tool. Although in many machining operations the cutting tool is
the least expensive component of the cutting system compared to the machine and
workpiece, most of the monitoring effort is concentrated on ensuring that it is in good
working condition. This is because changing the cutting tool results in down time which
is very costly. Therefore, an essential part of an untended machining system is the
ability to change tools when they are worn or broken. The cutting tool needs to be
changed before catastrophic failure damages the workpiece and possibly the machine.
In years before, industries uses the conventional method of monitoring which is offline
monitoring. The offline monitoring process can only be run when the machine is not
operating. This type of monitoring can be carried out through skilled machinists’
knowledge and experience. This type of process has cost industries lot in term of
quantities of production, time and money. The shortage of skilled machinists, as well as

3
cost saving concerns, has led to the popularity of unmanned machining systems in this
area. So, by using Acoustic Emission method, the cost rely by the industries can be
saved.
Acoustic Emission method is an online monitoring process is, widely used in the
industries now. By the term of online monitoring, monitoring machining condition can
be done while the machine is still operating. The use of conditional monitoring allows
maintenance to be scheduled, or other actions to be taken to avoid the consequences of
failure, before the failure occurs, stop unscheduled outages, optimize machine
performance, and reduce repair time and maintenance costs. By using AE method, the
accuracy of the data taken is reliable because the energy emitted by the source can be
exactly taken by the sensor without external disturbances. With this type of monitoring,
hopes that the machining condition can be easily monitored and can help the industries
to save cost wheres area involved.
1.3 OBJECTIVE OF THE RESEARCH
The purpose of this project is to;
1. Collect the data acquisition of the experiment.
In order to collect the data, milling process is used. The sensor will be
located at the workpiece and then transfer the data collected to data
acquisition machine. All data in term of energy, count, and rms will be
saved by the machine.
2. To study the correlation of AE parameter with work piece surface
quality.
The AE parameters, which have been saved by data acquisition machine
is used to correlate with workpiece’s surface quality. Surface roughness
will be measured using Perthometer and then compared with the AE
signal saved.
3. To develop algorithm for online machining condition monitoring.
From all data collected, which AE parameters and surface roughness,
algorithm for machining condition monitoring is developed. By this,
conclusion can be made as for the monitoring machining condition.

4
1.4 HYPOTHESIS
The work piece’s surface finish is related to the cutting tool condition. When the
cutting tool is working in bad condition, the surface finish is rough as vice versa. As
stated by ANSI, 1985, the value of roughness average, Ra for milling process is between
ranges of 25 µm to 0.20 µm if the machine’s application is less and in ranges 6.3 µm to
1.6 µm in average application. Based on this value, the surface roughness can be
determined and the condition of the work piece can be justified.
1.5 SCOPE OF WORK
The approach in the machining condition monitoring will be as follows:
i. Using an AE sensor in a frequency range of 150-300kHz while running a
milling machine
ii. Using AE parameter which is count, and frequency spectrum to correlate
with workpiece surface roughness.
iii. Apply the Matlab software to develop algorithm.
iv. Using carbide coated for cutting tool.
v. Using Alluminium alloy (AA6061-T6), as workpiece.
CHAPTER 2
LITERATURE REVIEW
2.1 INTRODUCTION
All machining processes remove material to form shapes. As metals are still the
most widely used materials in manufacturing, machining processes are usually used for
metals. However, machining can also be used to shape plastics and other materials
which are becoming more widespread. Basically all the different forms of machining
involve removing material from a component using a rotating cutter. The differences
between the various types arise from the relative motion between cutting tool and
workpiece and the type of cutting tool used.
Typically machining will be done using a machine tool. This tool holds the
workpiece and the rotating cutting tool and allows relative movement between the two.
Usually machine tools are dedicated to one type of machining operation, although some
more flexible tools allow more than one type of machining to be performed. The
machine tool can either be under manual or automatic (Computer Numeric Control -
CNC) control. Automatic control is more expensive because of the need to invest in the
necessary control mechanisms however it becomes more desirable as the number of
components produced increases and labour costs can be reduced.
The speed at which a machine tool can process individual components is a
function of the cutting speed of the tool and the downtime involved in changing the
workpiece and maintaining the tool (this will usually involve changing the cutting edges
of the tool). Some very flexible tools allow automatic changing of components and
cutting tools, however they greatly add to initial purchase price of the machine tool.

6
The cutting speed of the tool is usually dictated by the type of material being
machined, in general the harder the material, the slower the machining time. Machining
speed can be increased by increasing the rotational speed of the cutter; however this will
be at the expense of the tool life. Hence for machining processes there is an optimum
cutting speed that balances tooling costs with cutting speed.
In order to dissipate the heat generated between the work piece and the cutting
tool, cutting fluids are sprayed onto the tool. The cutting fluid also acts to remove cut
material away from the cutting region and lubricates the tool - work piece interface but
may require that the component is cleaned afterwards.
2.2 TYPES OF MACHINING
In terms of annual dollar spent, machining is the most important of the
manufacturing process. Machining can be defined as the process of removing material
from a workpiece in the form of chips. The term metal cutting is used when the material
is metallic. Most machining has very low set-up cost compared to forming, molding,
and casting processes. However, machining is much more expensive for high volumes.
Machining is necessary where tight tolerances on dimensions and finishes are required.
The types of machining can be divided into two classifications. They are
traditional/conventional machining and non conventional machining. Processes which
are done on conventional machine like lathe, shaper, and grinding is called conventional
machining and for non-conventional machining are done by the applications of those
methods which are well developed such as electrochemical machining(ECM), water jet
machining(WJM), abrasive jet machining(AJM), electric discharge machining(EDM),
AND ultrasonic machining(USM).
In this paper, only conventional machining will be reviewed since milling
process is used for the experiment. As stated before, conventional machining is
consisted of several processes including turning, grinding, drilling, and milling.
7
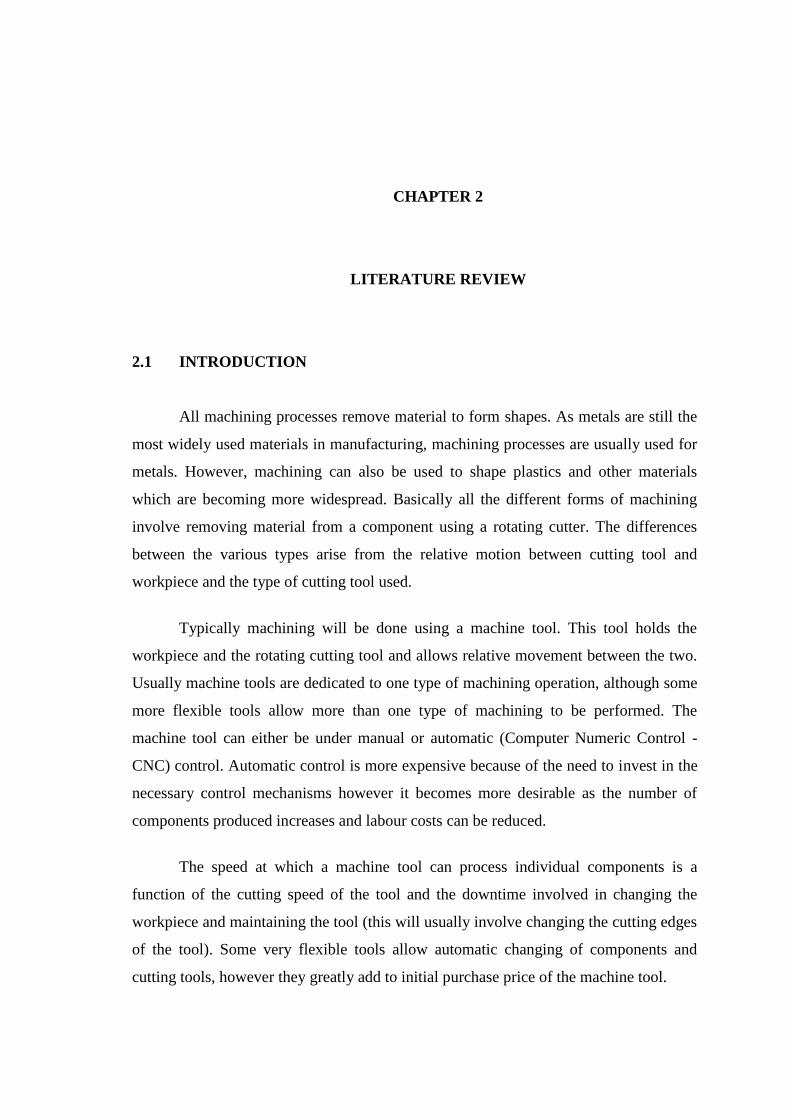
2.2.1 Turning Proces
Turning is another of the basic machining processes. Turning produces solids of
revolution which can be tightly toleranced because of the specialized nature of the
opertaion. Turning is performed on a machine called a lathe in which the tool is
stationary and the part is rotated. The figure below illustrates an engine lathe. Lathes
are designed solely for turning operations, so that precise control of the cutting results in
tight tolerances. The workpiece is mounted on the chuck which rotates relative to the
stationary tool.
The typical dimensional tolerances for turning process is, ± mm :
Fine : 0.025 – 0.13 mm
Rough : 0.13 mm
The Figure 2.1 is the illustration of lathe machine, machine used in turning process.
Figure 2.1: Lathe machine
Source: efunda.com (2005)

8
Turning process refers to cutting as shown in Figure 2.2:
Figure 2.2: Cutting process
Source: efunda.com (2005)
The term “facing” is used to described removal of material from the flat of a cylindrical
part as shown below. Facing is often used to improve the finish of surfaces that have
been parted. Facing can be shown as in Figure 2.3 .
Figure 2.3: Facing
Source: efunda.com (2005)

9
2.2.2 Milling Process
Milling is as fundamental as drilling among powered metal cutting processes.
Milling is versatile for a basic machining process, but because the milling set up has so
many degrees of freedom, milling is usually less accurate than turning or grinding
unless special rigid fixturing is implemented.
For manual machining milling is essential to fabricate any object that is not
axially symmetric. There is a wide range of different milling machines, ranging from
manual light-duty BridgeportsTM
to huge CNC machines for milling parts hundreds off
feet long. Figure 2.4 is illustrated the process at the cutting area.
Figure 2.4: Milling process
Source: efunda.com (2005)
Figure 2.5 is illustrated a typical column-and-knee type manual mill. Such manual mills
are common in job shops that specialize in parts that are low volume and quickly
fabricated. Such job shops are often termed “model shops” because of the prototyping
nature of the work.

10
Figure 2.5: Typical Column-And-Knee Type Manual Mill
Source: efunda.com (2005)
Figure 2.6 is the illustration of the milling machine in separataion. The table can be
moved to right and left, the saddle can be moved forward and backward and the knee is
used to change the height of the milling head.
Figure 2.6: Separated part of milling machine
Source: efunda.com (2005)
11
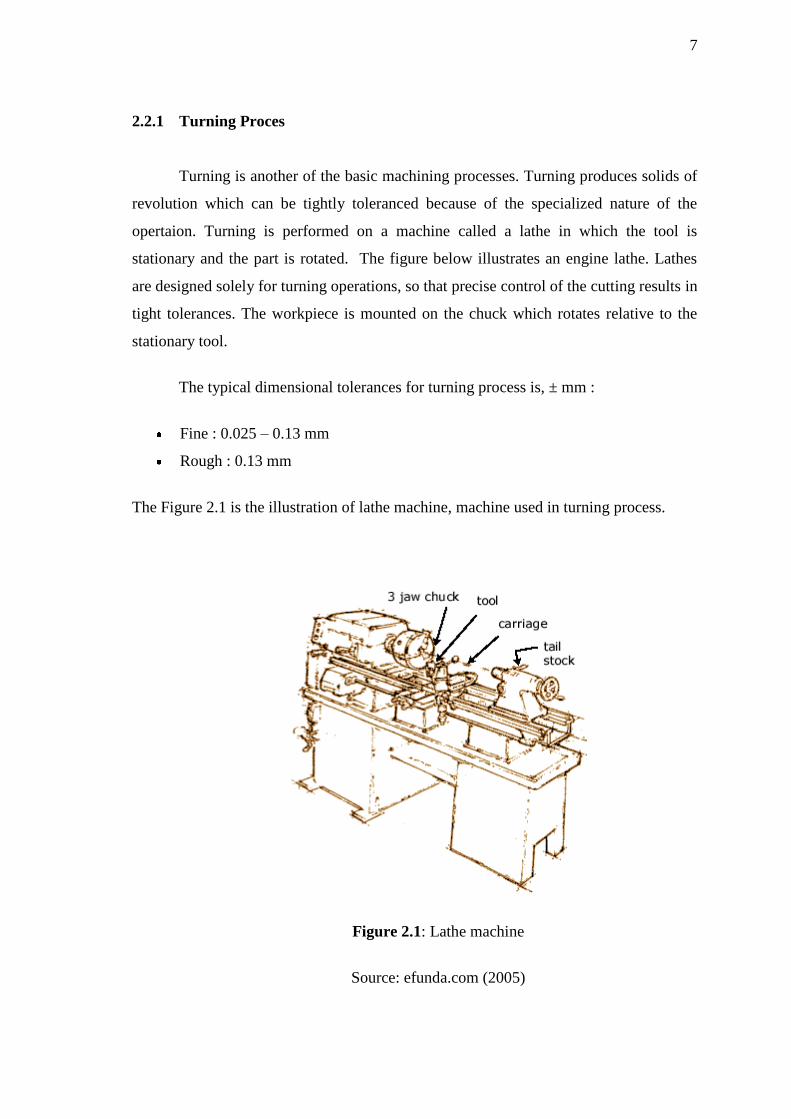
2.2.3 Drilling Process
This is a very common machining process used to produce holes in components.
To create a hole, a drill bit is rotated at high speeds. The screw thread shape of the drill
bit causes materials to be cut away as the drill bit is pushed into the workpiece.
There are several types of drill available. Hand held drills are useful for drilling
holes in any location, but requires accurate use. Pillar drills used in workshops are fixed
orientation drills. The work piece is clamped so that it can't move which makes it easier
to drill more accurate holes. The problem with pillar drills is that the work piece has to
be small enough to fit on to the table. Note that different materials have their own drill
bits
As shown in Figure 2.7, drilling process is a process to make a hole at the
workpiece. Drilling involves the creation of holes that are right circular cylinders. This
is accomplished most typically by using twist drill. The figure also illustrate the cross
section of hole being cut by a common twist drill.The chips must exit through the flutes
to the outside of the tool. In order to making the drilling process going smoothly,
coolant must be applied and delivered through the drill bit shaft.
Figure 2.7: Drilling process
Source: efunda.com(2005)