macro-demand and supply models
TRANSCRIPT
7/31/2019 Macro-Demand and Supply Models
http://slidepdf.com/reader/full/macro-demand-and-supply-models 1/28
MACRO-DEMAND AND
SUPPLY MODELSExplorations in Demand and Supply Analysisin the Macro-level

7/31/2019 Macro-Demand and Supply Models
http://slidepdf.com/reader/full/macro-demand-and-supply-models 2/28
Equilibrium at Full Employment
• Let us revisit the AS-AD Model• On the x-axis of the model is Real-output
• Real output is simply the goods and services produced in youreconomy
• Real-output then is synonymous to GDP (remember definition ofGDP?), so in the AS-AD model, the x-axis is represented by RealGDP.
• On the y-axis is Price-level
• Since the goods and services being considered is of all sorts, they
in a sense become “anonymous”
• We now satisfy ourselves, by fiction, that when we buy thesegoods, we buy them with “price-levels”
• Price-levels can be represented by CPI

7/31/2019 Macro-Demand and Supply Models
http://slidepdf.com/reader/full/macro-demand-and-supply-models 3/28
AS-AD Model

7/31/2019 Macro-Demand and Supply Models
http://slidepdf.com/reader/full/macro-demand-and-supply-models 4/28
Aggregate Demand
Why downward-sloping?
• When “everything” is expensive,buyers will tend NOT to buy
• When “everything” is cheap, of course, buyers want to buy!
Real-income effect – When pricesgo down, the purchasing power of
consumers “increases” luringthem to spend and vice-versa
Substitution effect – When pricesare high people substitute theactivity of saving for the activity of
present-day consumption and v.v.

7/31/2019 Macro-Demand and Supply Models
http://slidepdf.com/reader/full/macro-demand-and-supply-models 5/28
Aggregate-Supply
Why upward sloping?
• Higher prices motivate firms toproduce more and v.v.
• As production expands LDMR setsin making production costlier; thisincreasing relative cost istranslated as increases in prices ofgoods and services.

7/31/2019 Macro-Demand and Supply Models
http://slidepdf.com/reader/full/macro-demand-and-supply-models 6/28
Full-employment and P-GDP
Potential-GDP is that level of output(qty. of goods and services) aneconomy can meet when there isFull-employment.
It is useful to imagine always thatwhen talking about aggregatesupply, it is always tied to Full-employment.
7/31/2019 Macro-Demand and Supply Models
http://slidepdf.com/reader/full/macro-demand-and-supply-models 7/28
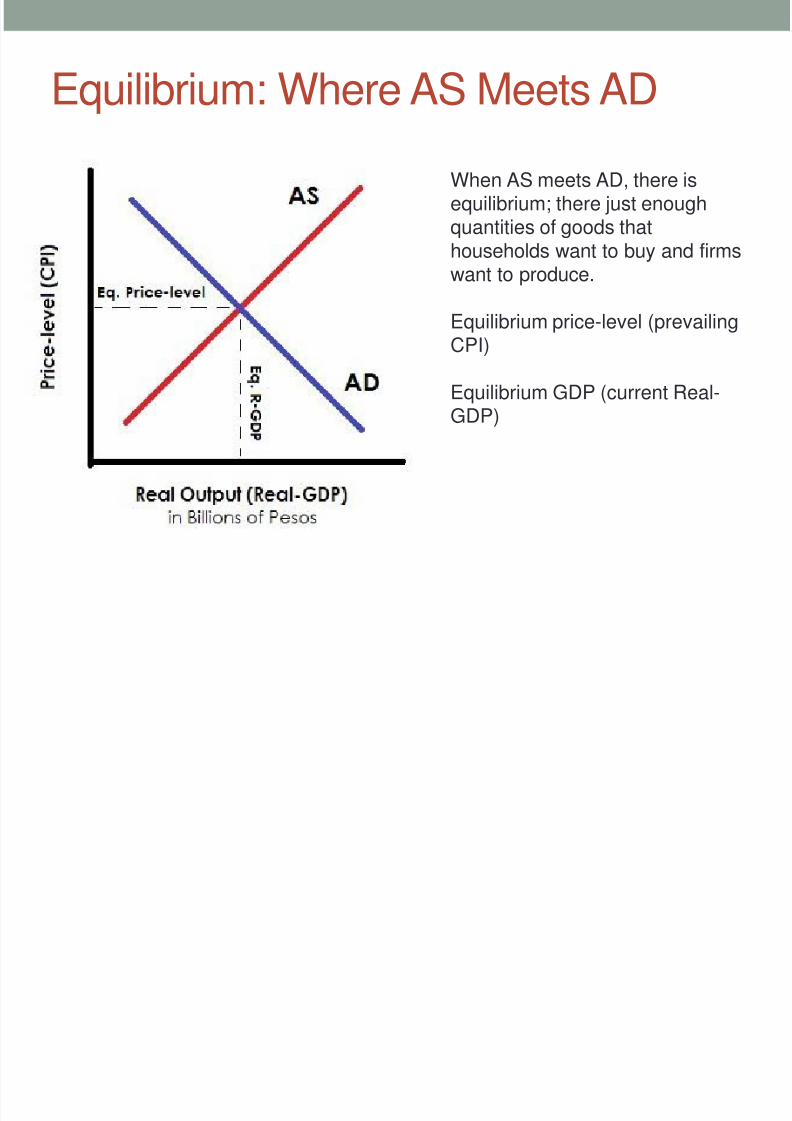
Equilibrium: Where AS Meets AD
When AS meets AD, there isequilibrium; there just enoughquantities of goods thathouseholds want to buy and firms
want to produce.
Equilibrium price-level (prevailingCPI)
Equilibrium GDP (current Real-
GDP)

7/31/2019 Macro-Demand and Supply Models
http://slidepdf.com/reader/full/macro-demand-and-supply-models 8/28
Equilibrium at Full-employment: A VerySpecial Case
When equilibrium falls at exactly full-employment (that is RGDP=PGDP),then a special case arises.
We call this case, “Equilibrium atFull-employment”.

7/31/2019 Macro-Demand and Supply Models
http://slidepdf.com/reader/full/macro-demand-and-supply-models 9/28
Other Equilibrium Cases

7/31/2019 Macro-Demand and Supply Models
http://slidepdf.com/reader/full/macro-demand-and-supply-models 10/28
Example 1

7/31/2019 Macro-Demand and Supply Models
http://slidepdf.com/reader/full/macro-demand-and-supply-models 11/28
Economics of War
• Wars bring about governmentexpenditure; gov’t buys weapons,uses oil, feeds army, buys uniforms
etc.
• Thus, a war shifts AD to the right
• This shift in turn increases real-output (GDP increases!)
• Ever wondered why every decadesince WWII the US has always beenat war with another nation?

7/31/2019 Macro-Demand and Supply Models
http://slidepdf.com/reader/full/macro-demand-and-supply-models 12/28
Christmas Economics
Philippine GDP (in Billions of US$) per Qtr (2008-2011)
Q1 – Jan-Mar
Q2 – Apr-Jun
Q3 – Jul-Sep
Q4 – Oct-Dec

7/31/2019 Macro-Demand and Supply Models
http://slidepdf.com/reader/full/macro-demand-and-supply-models 13/28
Christmas Economics
Why does GDP always increaseduring Q4?
• Christmas induces spending
• OFWs send “pamaskos” (US$)
• Christmas bonuses given tosalaried employees
• AD shifts to the right, R-GDP
increases; but price alsoincreases

7/31/2019 Macro-Demand and Supply Models
http://slidepdf.com/reader/full/macro-demand-and-supply-models 14/28
Seasonal Employment
Suppose that before the Christmas season,equilibrium is at full-employment. But, sinceit’s Christmas national output increases.
Raised R-GDP means more labourhours, which means more workers.More workers means employment!

7/31/2019 Macro-Demand and Supply Models
http://slidepdf.com/reader/full/macro-demand-and-supply-models 15/28
Seasonal Employment
• So in the weeks leading to and during the Christmasseason, more people get employed!

7/31/2019 Macro-Demand and Supply Models
http://slidepdf.com/reader/full/macro-demand-and-supply-models 16/28
Price of Oil Increases
• When price of Oil (a prime commodity) increases, weexperience a domino effect.
• Price of gasoline and diesel, both crude-oil derivatives, increase
• Price of “pamasahe” increases
• Price of logistics/carriage fee increases
• Price of goods delivered via transport (including other primecommodities like rice and flour will also increase)
• Overall price-levels in the economy increases

7/31/2019 Macro-Demand and Supply Models
http://slidepdf.com/reader/full/macro-demand-and-supply-models 17/28
Price of Oil Increase
• If nominal wage-rate doesn’t change during this time, thenbuying-power of real wages decrease
• People will tend not to buy
Before increases in price-levelAfter increases in price-level
7/31/2019 Macro-Demand and Supply Models
http://slidepdf.com/reader/full/macro-demand-and-supply-models 18/28
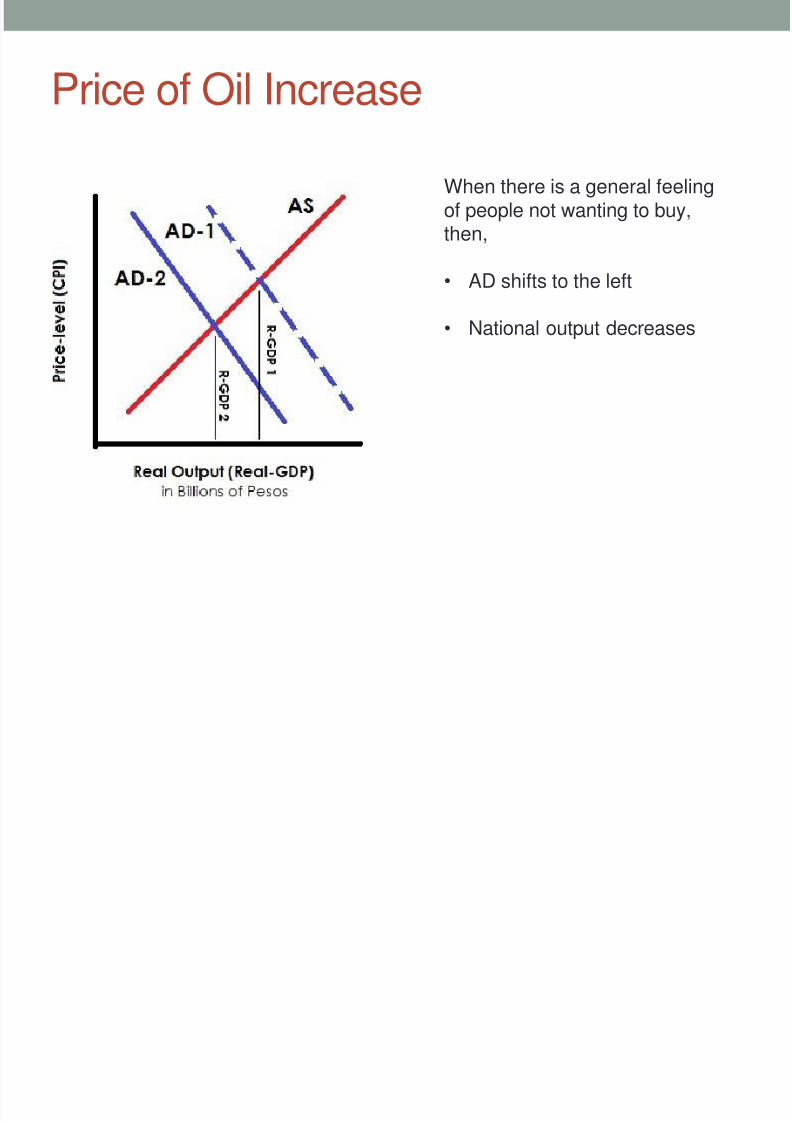
Price of Oil Increase
When there is a general feelingof people not wanting to buy,then,
• AD shifts to the left
• National output decreases

7/31/2019 Macro-Demand and Supply Models
http://slidepdf.com/reader/full/macro-demand-and-supply-models 19/28
Economic Contraction
The danger of a protracted oil-increase isthat AD will contract, R-GDP will fall
When R-GDP falls, less aggregate-hours are needed, which meansless workers and less jobs and

7/31/2019 Macro-Demand and Supply Models
http://slidepdf.com/reader/full/macro-demand-and-supply-models 20/28
Economic Contraction
• Every percentage in unemployment is no joking matter
• Philippine labour-force (2010) = 60 718 000
• 1% of labour force = 607 180
• So for every 1% increase in unemployment, you are
talking of 607 180 people loosing jobs!

7/31/2019 Macro-Demand and Supply Models
http://slidepdf.com/reader/full/macro-demand-and-supply-models 21/28
The Population “Boon or Bane?”
7/31/2019 Macro-Demand and Supply Models
http://slidepdf.com/reader/full/macro-demand-and-supply-models 22/28
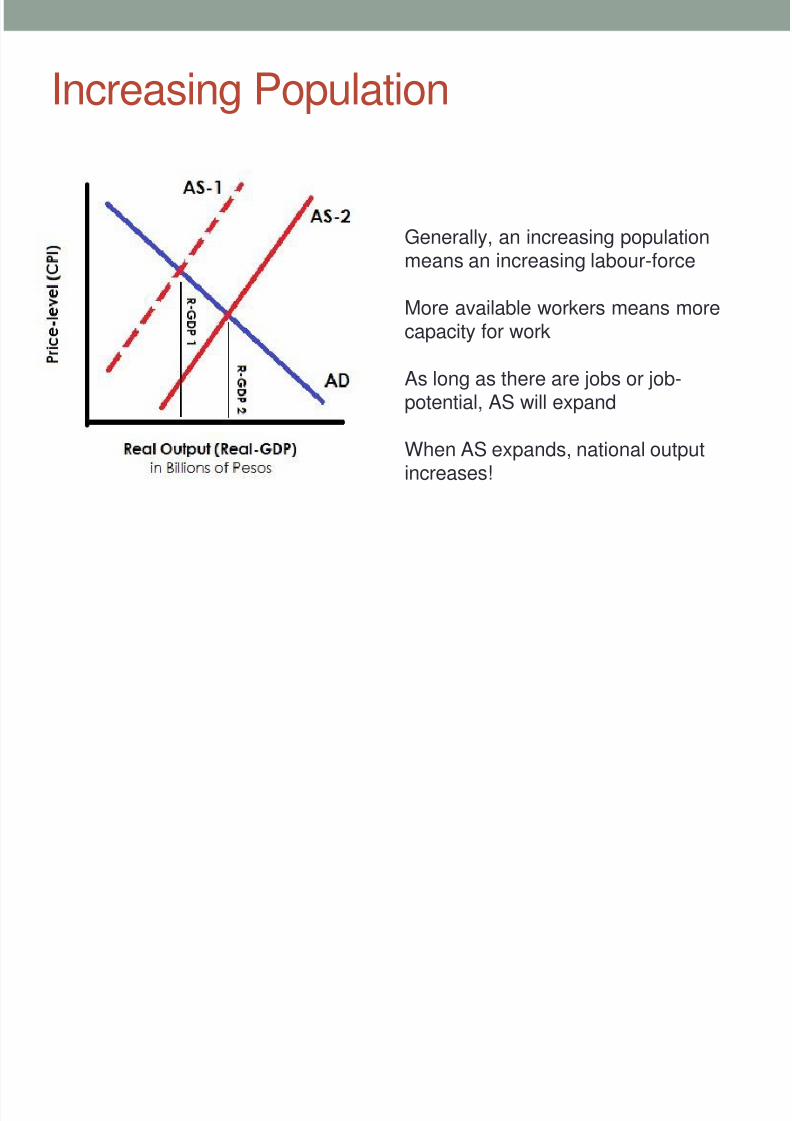
Increasing Population
Generally, an increasing populationmeans an increasing labour-force
More available workers means morecapacity for work
As long as there are jobs or job-potential, AS will expand
When AS expands, national outputincreases!

7/31/2019 Macro-Demand and Supply Models
http://slidepdf.com/reader/full/macro-demand-and-supply-models 23/28
Have you read this?

7/31/2019 Macro-Demand and Supply Models
http://slidepdf.com/reader/full/macro-demand-and-supply-models 24/28
Quantity Must Go With Quality
• But it must be remembered that the quantity of the labour-force is not the only factor to be considered
• AS will even shift further to the right if our people are
made even more productive
• People are more productive when they engage in skilledand specialised labour
• Unskilled labour – work/job people can engage in without or withminimal training
• Skilled labour – work/job people can engage in only with training
• Specialised labour – work/job that only professionals/specialistscan engage

7/31/2019 Macro-Demand and Supply Models
http://slidepdf.com/reader/full/macro-demand-and-supply-models 25/28
Natural Calamities
Typhoon Sendong
Earthquake in Japan 2011

7/31/2019 Macro-Demand and Supply Models
http://slidepdf.com/reader/full/macro-demand-and-supply-models 26/28
What will happen to AS?
• Now it’s your turn, what will happen to AS in the aftermathof calamities?
• How will national output be affected?

7/31/2019 Macro-Demand and Supply Models
http://slidepdf.com/reader/full/macro-demand-and-supply-models 27/28
Stagflation
• An undesirable combination in the health of the economy
• Stagnation – national output is not increasing, productionin the economy is not improving
• Inflation – general price-levels increase
• The combination of both, decreasing output andincreasing price causes economic recessions and laterdepressions

7/31/2019 Macro-Demand and Supply Models
http://slidepdf.com/reader/full/macro-demand-and-supply-models 28/28
Stagflation