macroeconomic and financial market developments - · pdf filemacroeconomic and financial...
TRANSCRIPT

1
Macroeconomic and financial
market developments
September 2015
Background material
to the abridged minutes of the
Monetary Council meeting
22 September 2015

2
Time of publication: 2 pm on 7 October 2015
The background material ‘Macroeconomic and financial market developments’ is based on
information available until 18 September 2015.
Article 3 (1) of the MNB Act (Act CXXXIX of 2013 on the Magyar Nemzeti Bank) defines achieving and maintaining price stability as the primary objective of the Magyar Nemzeti Bank. The MNB’s supreme decision-making body is the Monetary Council. The Council convenes as required by circumstances, but at least twice a month, according to a pre-announced schedule. At the second scheduled meeting each month, members consider issues relevant to decisions on interest rates. Abridged minutes of the Council’s rate-setting meetings are released regularly, before the next policy meeting takes place. As a summary of the analyses prepared by staff for the Monetary Council, the background material presents economic and financial market developments as well as new information which has become available since the previous meeting.
The abridged minutes and background materials to the minutes are available on the MNB’s
website at:
http://www.mnb.hu/en/monetary-policy/the-monetary-council/minutes

3
1. MACROECONOMIC DEVELOPMENTS
1.1. Global macroeconomic environment
GDP data in the second quarter of 2015 were slightly lower than expected. Based on the
incoming indicators, in recent months growth in developing countries may have decelerated
compared to earlier expectations. Growth remains fragile surrounded by both upside and
downside risks. The outlook for growth in the world’s emerging regions is moderate compared to
pre-crisis levels. Persisting geopolitical tensions may continue to restrain growth in developed
countries through weaker demand and economic sanctions. Uncertainties surrounding the
expected interest rate increase by the Fed may moderate investors’ interest in emerging
markets. Low oil prices may boost growth in oil importing economies, while having an
unfavourable effect on oil exporters’ growth prospects. Inflationary pressure from the world
market has remained weak in recent months as a result of moderate oil prices.
Growth in the world economy continued in the second quarter of this year. The highest growth
rates in the EU were registered in the countries of the CEE region. The adverse effect of the
Russia–Ukraine conflict may have continued to impede economic growth through weaker
demand and the economic sanctions extended until January 2016. In addition, based on the
incoming indicators, growth in developing countries may decelerate compared to previous
expectations.
The euro area economy registered a quarter-on-quarter growth rate of 0.4 per cent in the
second quarter of 2015. The monthly production data received show a moderate upturn in the
economic activity of the region. Although the forward-looking indicators of economic activity
imply moderately improving performance, the protracted management of the Greek situation
may affect the economic performance of the euro area negatively. In addition, the tense
geopolitical situation may also have a negative impact: increasing uncertainty and bilateral
economic sanctions may restrain economic activity. These factors may have contributed to the
fact that economic expansion continued at a more moderate rate than in the previous quarter.
Economic growth in Germany, Hungary’s most important export partner, accelerated in the
second quarter, but was still moderate. Domestic demand in Germany continued to grow, but
external market activity may have been curbed by the Russia–Ukraine conflict and the slowdown
in demand in Asia. Expectations concerning the German economy (Ifo) indicate less favourable

4
prospects than at the beginning of the year (Chart 1). Overall, the average increase in new orders
in the German industry was modest in the past months.
Chart 1: Indicators of activity in Hungary’s export markets
Sources: OECD, Ifo.
The performance of the region was outstanding in the second quarter of this year but, according
to monthly indicators of recent months, industrial output is still fragile in the region. The negative
effects of the Russia–Ukraine conflict may have had only a limited impact on growth in the CEE
region so far, but looking ahead, the expected significant contraction in the Ukrainian and
Russian economies may, both directly and indirectly, hinder economic growth in the region.
Inflationary pressure from the world market remains weak. The decline in commodity prices,
combined with slowly growing world economy, are reducing inflation. As a result, inflation rates
remained below target in the world’s major economies (euro area inflation stood at 0.1 per cent
in August). In recent weeks, oil prices continued to decrease further, which was attributable to
both demand and supply factors (Chart 2) (see more details on this in subsection 2.1).

5
Chart 2: World market price of Brent crude oil
Source: Bloomberg.
The world market prices of industrial commodities, unprocessed food and manufactured goods
continued to be extremely restrained (Chart 3).
Chart 3: Industrial producer prices and tradables inflation in the euro area and world market
prices of manufactured goods
Sources: Centraal Planbureau (www.cpb.nl), Eurostat, ECB.

6
1.2. Domestic real economy developments
1.2.1. Economic growth
The Hungarian economy continued to grow in the second quarter of 2015. According to
detailed data Hungary’s GDP was up 2.7 per cent year-on-year, with a 0.5 per cent growth
recorded relative to the previous quarter.
Economic growth decelerated slightly in the second quarter of this year (Chart 4). The highest
year-on-year growth was observed in manufacturing and construction. Manufacturing and
market services were the main contributors to GDP growth. At the same time, economic
expansion was lower than in the previous quarters, which may primarily be attributable to the
decline in the performance of agriculture, as due to the high base of last year’s favourable
harvest results the contribution of agriculture to growth was negative in the second quarter as
well.
Chart 4: Changes in monthly production indicators* and GDP
* Weighted average of monthly production indicators (industrial output,
construction output and retail sales). The weights are derived from
regression explaining GDP growth. Source: MNB calculations based on CSO
data.

7
Chart 5: Growth heat map*
* The growth heat map shows the three-month moving averages of the seasonally adjusted monthly growth rates of
the most important monthly indicators of activity, using the following colour code: red = grows above the five-year
average, at an accelerating rate; orange = grows above the average, at a slowing rate; yellow = grows below the
average, at an accelerating rate; light blue = grows below the average, at a slowing rate; blue = falls at a slowing rate;
dark blue = falls at an accelerating rate. Source: MNB calculations based on CSO data.
In July 2015, industrial output rose by 3.4 per cent year on year. Seasonally adjusted production,
excluding the working day effect was 0.7 per cent down compared to the previous month. In
July, the performance of manufacturing subsectors showed a favourable picture. Of the major
subsectors, vehicle manufacturing and food industry production increased, while output in the
electronics, optical and metal industry subsectors declined compared to the previous month. The
fall in output of the chemical industry was mainly attributable to the decrease in coke production
and crude oil processing, which had lasted for three months. Overall, based on the forward-
looking indicators, the gradual pick-up in the euro area may continue in the coming months, with
possible support from lower oil prices and the loose monetary policy of the ECB. Signs of a
deceleration in global economic activity and the Russia–Ukraine conflict may still pose downside
risks with regard to the economic prospects of the euro area.
Expressed in euro terms, in July the value of exports and imports increased by 5.4 per cent and
2.3 per cent, respectively, year on year. The trade surplus significantly exceeded its value
registered in July last year. Increase in export prices exceeded the dynamics of import prices,
resulting in a further improvement in the terms of trade in June. The improvement may primarily
be attributable to the falling oil prices.
In July 2015, the volume of construction output rose by 0.2 per cent year on year, while
seasonally and working day adjusted output fell by 3.0 per cent compared to the previous
month. The performance of the sector is expected to be subdued in the second half of 2015,
which may be attributable both to the steady decline of nearly one year in the book of contracts
Industrial production
Production in the construction
Retail sales
Turism
Exports
New industrial export orders
Stock of orders in construction
Dwelling construction permitsJa
n-1
0
Ap
r-1
0
Jul-
10
Oct
-10
Jan
-11
Ap
r-1
1
Jul-
11
Oct
-11
Jan
-12
Ap
r-1
2
Jul-
12
Oct
-12
Jan
-13
Ap
r-1
3
Jul-
13
Oct
-13
Jan
-14
Ap
r-1
4
Jul-
14
Oct
-14
Jan
-15
Ap
r-1
5
Jul-
15

8
and last year’s high base. Approaching the end of the 2007–2013 EU programming period,
infrastructural projects financed from EU funds may be accomplished gradually in the course of
the year.
The pick-up in consumption demand observed early in the year continued in the second
quarter as well. This may be explained by the improving labour market situation and by the
increase in real wages as a result of low inflation, as well as by the upswing in retail sales
volumes. In July, according to preliminary data, sales volumes increased by 7.3 per cent year on
year, while the increase in turnover was 0.9 per cent compared to the previous month. In July,
retail sales may have increased in a wide range of products. Food sales dynamics continued to
improve, and the turnover of non-food consumer durables grew markedly compared to the same
period of the previous year. In accordance with the material fall in fuel prices observed in the
recent period, the growth in fuel sales continued to have a material contribution to the growth in
retail sales volume. Domestic sales increased at a higher rate than the average observed in the
countries of the region and in the developed European countries.
The baseline scenario of the September forecast projects the continuation of a structurally
balanced economic growth. In addition to a further increase in consumption, net exports may
also significantly contribute to the expansion in the economy. The economy grew by 3.6 per
cent in 2014 as a whole, which may be followed by an expansion of over 3 per cent this year.
Economic growth may be supported by the recovery in domestic demand, the absorption of EU
funds, loose monetary conditions and improving labour market conditions. Falling oil prices may
boost growth in EU Member States, which may offset in Hungary’s external demand the negative
effects stemming from the deteriorating prospects of emerging markets.
1.2.2. Employment
According to Labour Force Survey data, the number of employees in the whole economy
continued to increase in July 2015. There was no major change in activity compared to the
previous month, but the number of unemployed continued to decline (Chart 6).
Employment in the private sector continued to increase in the second quarter. The number of
people working in the general government grew significantly, which may have been mostly
attributable to the considerable extension of public work programmes. Within the private sector

9
the growth in employment was primarily related to market services, whereas the number of
employees in the manufacturing sector did not change notably.
Chart 6: Number of persons employed and the seasonally adjusted unemployment rate
Source: HCSO.
In the second quarter, the number of newly announced non-subsidised jobs declined slightly
compared to the previous quarter, while the end-of-month number of vacant, non-subsidised
jobs continued to increase. The labour market has gradually become tighter since 2013.
However, there has been no major change in tightness in the recent quarters (Chart 7).
Chart 7: Indicators of labour market tightness
Sources: HCSO (Labour Force Survey), National Employment Service.

10
1.3. Inflation and wages
1.3.1. Wages
In July, following strengthening in the previous month, annual wage dynamics in the private
sector decelerated; therefore, the increase in wages can still be considered restrained. Within
the private sector, annual wage dynamics in both manufacturing and the market services sector
declined compared to the previous month. In July, gross average earnings in the national
economy and in the private sector increased by 3.1 per cent and 3.7 per cent, respectively,
compared to the same period of the previous year.
1.3.2. Inflation developments
In August 2015, inflation was 0.0 per cent, while core inflation was 1.2 per cent and core
inflation excluding indirect taxes stood at 1.0 per cent (Chart 8). The actual decline in inflation
was attributable to the fall in fuel prices, while the slight decrease in core inflation is mainly the
result of the slowdown in industrial goods inflation.
Chart 8: Decomposition of the consumer price index
Source: MNB calculations based on CSO data.
Underlying inflation indicators continue to point to a moderate inflation environment, which
may be attributable to the low level of imported inflation, declining oil prices and the
magnitude of unutilised capacities (Chart 9). In July 2015, agricultural producer prices fell by 5.6
per cent in annual terms. The domestic sales prices of the consumer goods sectors declined by

11
0.3 per cent year on year. In line with retail trade data, consumption demand continued to
expand during the second quarter, in parallel with the year-on-year rise in real income.
Chart 9: Measures of underlying inflation
Source: MNB calculations based on CSO data.
Inflation may remain low in the short term. The data received for August were slightly below
our expectations described in the June Inflation Report, which is attributable to the subdued
dynamics of the price index of fuels. Looking ahead, the inflation rate may turn out to be lower
than formerly expected, due to the continued fall in oil prices.
1.4. Fiscal developments
In August 2015, the central subsystem of the general government registered a deficit of HUF 21
billion, which exceeds the deficit recorded in August last year by HUF 14 billion. However, this
deficit is HUF 60 billion more favourable than the average deficit of the same periods of the
past three years (Chart 10). Favourable changes in the underlying trends continued in August as
well, but EU funding was again significantly below the usual levels of the previous years.

12
Chart 10: Intra-year cumulative balance of the state budget
Source: Hungarian State Treasury.
The revenues of the central subsystem in August 2015 were up by HUF 69 billion year on year.
Most of the revenue surplus is attributable to higher revenues from VAT and excise tax in August.
Expenditures of the central subsystem in August exceeded the 2014 base by nearly HUF 100
billion. The increase in expenditures is still mostly attributable to the growth in net expenditures
of the budgetary institutions related to EU funding.
1.5. External balance
According to the July data release, the seasonally unadjusted external financing capacity
declined to EUR 1.1 billion, with surpluses of nearly EUR 800 million and more than EUR 300
million in the current and capital accounts, respectively.
Financing data indicate a much lower financing capacity amounting to a mere EUR 280 million.
This financing capacity was the result of an increase in FDI inflows and a major decline in net
external debt. The structure of financing is different from that seen in previous months, when
FDI outflows were significant due to dividend disbursements and the acquisition of Budapest
Bank by the state. In July, net direct investments increased by EUR 220 million, with a higher
reinvestment of incomes. Net external debt declined by nearly EUR 600 million, with higher debt
repayment by the private sector and lower by the state.
13
2. FINANCIAL MARKETS
2.1. International financial markets
There was some improvement in investor sentiment in the period following the previous
interest rate decision. Although stock market volatility declined and the key stock exchange
price indexes were able to rise slightly in both Europe and the United States, risk appetite
continued to be less favourable compared to the period preceding the deterioration in
sentiment at the end of August. There was no major change in developed market bond yields,
while Central East European currencies slightly appreciated against the euro.
In parallel with a slight improvement in global risk appetite, risk indicators declined during the
month. From the 50 points at the end of August, the VIX stock market volatility index fell to 21,
while the EMBI Global Emerging Markets Bond Index fell from 475 to 420 basis points (Chart 11).
In the USA, although the picture of the economy as a whole shows improvement, labour market
data continue to paint a somewhat contradictory picture. On the one hand, it is favourable that
unemployment is at a low level of 5.1 per cent, and the number of those applying for
unemployment benefit for the first time also stabilised below the level of 300 thousand. On the
other hand, however, the activity rate had not been so low for several decades, and in August the
increase in the number of non-agricultural employees was a negative surprise for the markets.
Another problem is the extremely high number of part-time employees, and wage dynamics does
not show any material improvement either. With regard to inflation, the PCE indicator, which is
especially monitored by the Fed, continued to be very low (0.3 per cent in July), while the core
PCE indicator has started a declining trend in recent months, standing at 1.2 per cent at present.
Low oil prices pose a further downside risk to inflation, and according to decision-makers’
forecast the achievement of the target may be postponed until 2018. At its September rate-
setting meeting the Fed did not change the base rate. However, the majority of decision-makers
continue to project a rise in the rate before the end of the year.
Concerns about the economic growth of China also contributed to the remaining uncertainty
related to emerging markets. Although according to the data published during the month retail
sales were in line with expectations in China, industrial production increased to a lesser extent,
by 6.1 per cent in annual terms. Although the 5.5 per cent decline in exports is more favourable
data than expected, the 13.8 per cent fall in imports was a serious negative surprise for the

14
markets. The Chinese statistical office made a downward revision of the 2014 GDP figure as well.
Following a 25 per cent fall in August, the Shanghai stock exchange price index became stable
during the month, and the exchange rate of the yuan also stopped depreciating. Overall,
however, the state of the Chinese economy still remains in the focus of global investor attention.
Chart 11: Developed market equity indices, the VIX index (left axis) and the EMBI Global Index
(right axis)
Source: Bloomberg.
After the world market price of oil had seemed to become stable in the spring months, another
material fall started as of the end of June, which was supported by the end-of-August market
uncertainty as well. As a result, the per-barrel price of the Brent crude oil had declined to USD 42
by the end of August. In the past one month, however, the price of oil became stable at a
somewhat higher level, between USD 45–50, while the difference between Brent and WTI
became close to USD 0. On the demand side, concerns with regard to the deceleration of the
Chinese economy and concerns about the global economic activity, while on the supply side the
ongoing extraction by the OPEC countries in excess of the quota, the Iran nuclear deal and the
more efficient shale oil extraction by the United States contributed and are contributing to the
decrease in oil prices, further supported by the strong dollar exchange rate.

15
2.2. Developments in domestic money market indicators
In line with the international trend, there was no major shift in the domestic market during the
month.
During the period, international news generated only moderate fluctuations in the domestic
money market indicators, after markets had become stable following the end-of-August
deterioration in sentiment. Country-specific news did not have a material impact on domestic
market developments during the period either, while international markets mainly reflected the
waiting for the US rate-setting decision. In the coming period, country-specific shift may result
from the revision of Hungary’s credit rating by the three major rating agencies in the autumn.
The forint market was characterised by trading within a narrow band; minor fluctuations were
attributable to changes in international sentiment (Chart 12). The EUR/HUF exchange rate
appreciated from above 314 at the beginning of the period up to 310, without major fluctuations.
The Czech koruna was stable during the month, while the Romanian leu and the Polish zloty
appreciated by around 0.5 per cent.
Chart 12: EUR/HUF exchange rate and the implied volatility of exchange rate expectations
Source: Bloomberg.
There was a downward shift in the government securities yield curve during the past one
month; this shift was stronger in the short segment, and thus the yield curve became steeper
(Chart 13). Government securities market benchmark yields up to one year declined by 30–40

16
basis points, while an around 20 basis point decline took place in the 5–10-year segment. By this,
the entire up-to-one-year section of the yield curve declined below 0.5 per cent, which is a new
historical low. The 5-year yield level is around 2.5 per cent, while the 10-year one is around 3.5
per cent. The steepness of the Hungarian yield curve can be considered high in international
comparison. However, it is worth noting that this is primarily the result of a stronger decline in
short yields, while developments in the yields in the longer segment were practically in line with
the regional trend, with a slight country-specific decline.
Chart 13: Shifts in the spot government bond yield curve
Sources: MNB, Reuters.
During the period, strong demand was observed at the government securities auctions, while
average auction yields continued to decline. The debt manager faced 3–4-fold oversubscription
in the case of 3-month and 5-year securities, and 2–3-fold oversubscription for 12-month
securities. Oversubscription was even higher (5–7-fold) for 3-year securities. The Government
Debt Management Agency (ÁKK) reacted to the high demand by increasing the offered quantity
and the quantity issued within the framework of non-competitive auctions. Meanwhile, average
auction yields continued to decline in parallel with the secondary market trend; securities were
sold at an around 0.5 per cent yield level in the up-to-one-year segment.
Following a gradual decline in the previous months, non-residents’ government securities
holdings increased by HUF 40 billion in September, standing around HUF 4,250 billion at
present. This value represents a ratio of 32 per cent within total market holdings amounting to

17
some HUF 13,000 billion. The Hungarian 5-year CDS spread fell by 3 basis points during the
month, standing around 165 basis points at present.

18
3. TRENDS IN LENDING
In July, as a result of transactions, outstanding loans to non-financial corporations from the
credit institutions sector increased by a total HUF 8 billion (seasonally adjusted by HUF 18
billion) (Chart 14). In terms of denomination, forint loans increased by some HUF 29 billion, while
foreign currency loans fell by HUF 21 billion. The transaction-based annual growth rate of loans
outstanding increased from minus 3.4 per cent in June to minus 2.8 per cent. Loans granted
under Pillar I of the FGS contributed by around HUF 39 billion to corporate lending in July.
In July, in the case of newly granted corporate loans, the average interest rate on small-value
forint loans declined by 0.24 percentage point to 4.41 per cent, but the average interest rate on
higher-value forint loans increased by 0.28 percentage point to 2.77 per cent. As the result of
the contrasting changes, the interest rate differential between small- and high-value new
corporate loans declined again.
Chart 14: Net borrowing by non-financial corporations
Source: MNB.
The moderate decline in outstanding loans continued in the household segment, representing a
HUF 20.6 billion fall in terms of transactions in July (Chart 15). Outstanding forint and foreign
currency loans declined by HUF 11.4 billion and HUF 9.2 billion, respectively, in the period under
review. The volume of gross new loans lent by the entire sector of credit institutions to
households amounted to HUF 70 billion in total, corresponding to an increase of 30 per cent year
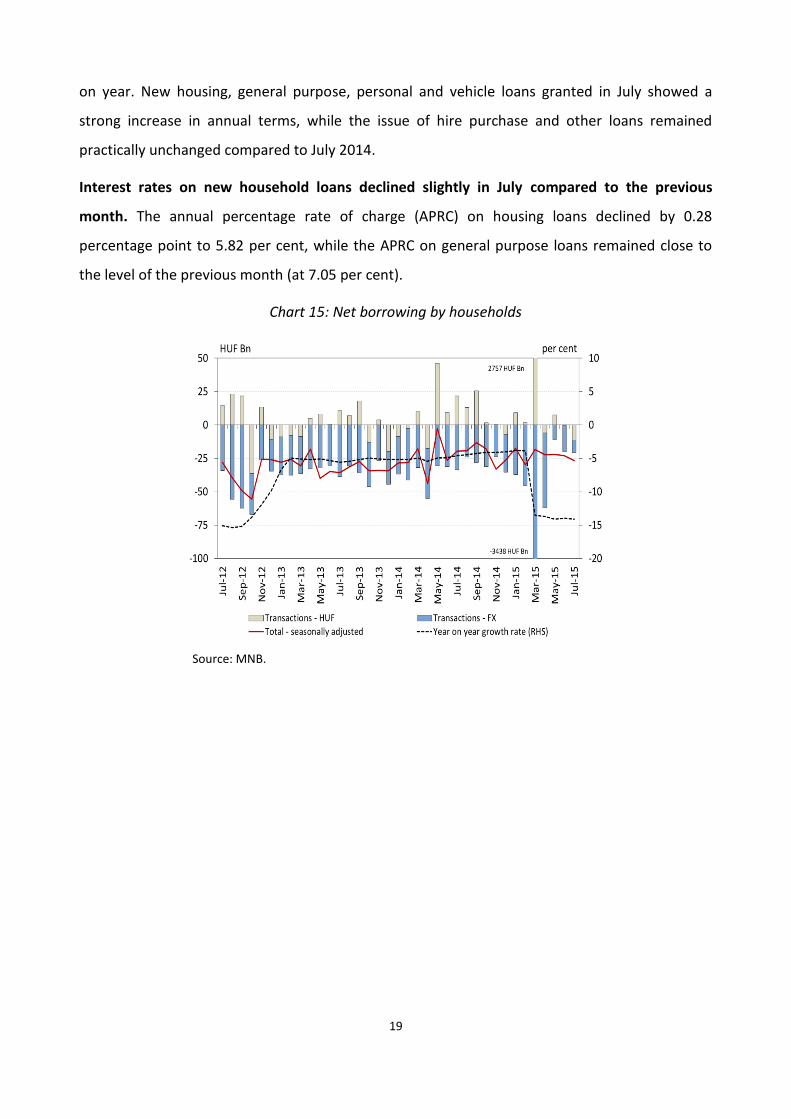
19
on year. New housing, general purpose, personal and vehicle loans granted in July showed a
strong increase in annual terms, while the issue of hire purchase and other loans remained
practically unchanged compared to July 2014.
Interest rates on new household loans declined slightly in July compared to the previous
month. The annual percentage rate of charge (APRC) on housing loans declined by 0.28
percentage point to 5.82 per cent, while the APRC on general purpose loans remained close to
the level of the previous month (at 7.05 per cent).
Chart 15: Net borrowing by households
Source: MNB.