macroeconomic effects of a shift from direct to indirect … · macroeconomic effects of a shift...
TRANSCRIPT
1
MACROECONOMIC EFFECTS OF A SHIFT FROM DIRECT TO INDIRECT TAXATION: A SIMULATION FOR 15 EU MEMBER STATES
Note presented by the European Commission services (DG TAXUD) at the 72nd meeting of the OECD Working Party No. 2 on Tax Policy Analysis and Tax Statistics, Paris, 14-16 November 2006.
Introduction
This paper presents a contribution to the discussion on the macroeconomic effects of a shift in taxation from direct to indirect taxes, at an unchanged overall revenue level. Such shift has been receiving increasing attention in policymaking circles, as highlighted not only by a number of proposals but also by the recent decision of the German government to increase VAT by three percentage points and attribute some of the revenue raised to offset cuts in direct taxation and social security contributions1.
The paper is organised as follows: section 1 gives an overview of the current situation and trends in the structure of taxation in the EU; section 2 contains a theoretical discussion of the merits of a shift from direct to indirect taxation, on the basis of a survey of some recent economic literature; section 3 contains a scenario analysis, based on the European Commission QUEST model, of what might be the macroeconomic effects from the simultaneous introduction of various tax shift measures in the EU 15; it also discusses whether, amongst OECD members, there is evidence of faster growth in countries having a greater reliance on indirect taxation. Section 4 concludes.
1 The paper is based on a reflection note presented in 2005 to the EU Taxation Policy Group to assess the
"Pentathlon for Europe" document presented by Belgian Prime Minister Guy Verhofstadt, which proposed a significant EU-wide shift from direct to indirect taxation. The note's genesis is reflected in its structure and in a number of modelling choices. Questions on the paper may be addressed to Marco Fantini, [email protected].
2
Section 1: SITUATION AND TRENDS IN THE STRUCTURE OF TAXATION IN THE EU
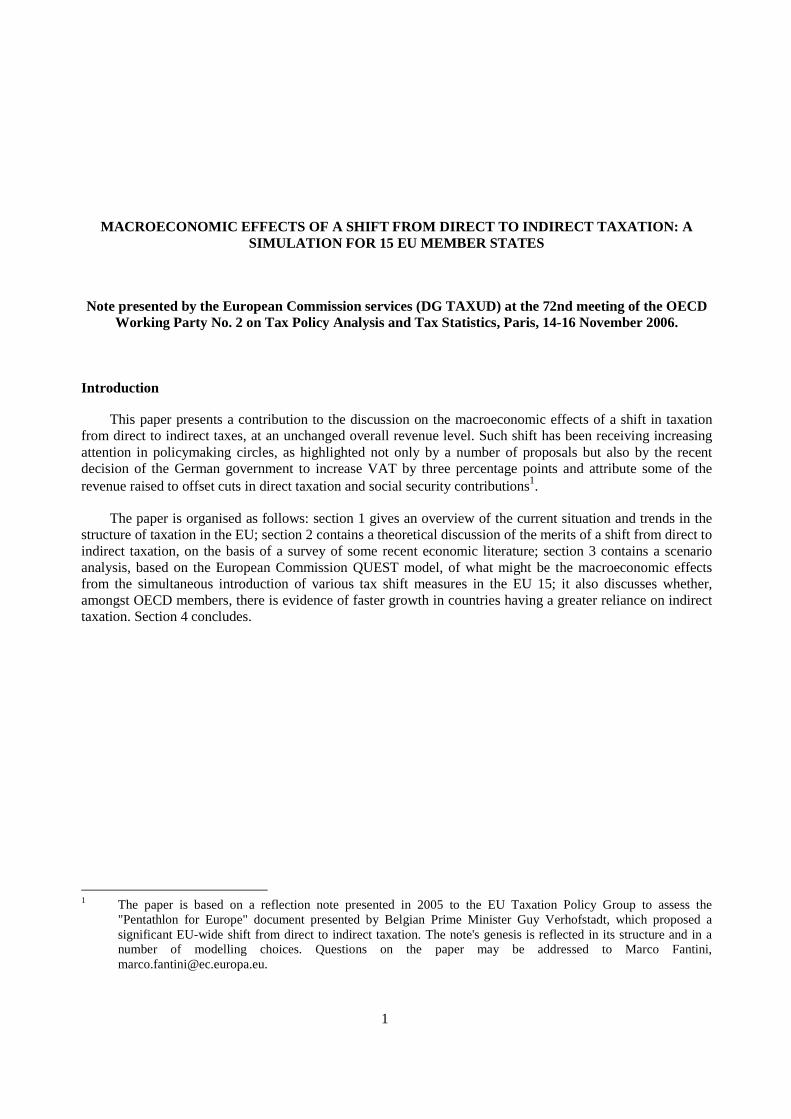
1. The level and structures of taxation differ widely across the Member States of the EU. The total share of taxes on GDP (including social security contributions) varies widely, between a minimum below 30% of GDP and a maximum close to 50%. The EU25 average has been declining slightly from the peaks reached around the turn of the century.
Chart 1: Tax to GDP ratios
0%
10%
20%
30%
40%
50%
60%
SE DK BE FIAT FR LU IT DE SI
NLHU PT PL EL ES CZ UK M
T CY EE SK IE LV LT NOEU25
EU15
NMS10 US*
JAP*
1995 2000
2003
3
Chart 2: Indirect, personal income and corporate taxes (EU25, % of GDP)
0
2
4
6
8
10
12
14
16
1995 1996 1997 1998 1999 2000 2001 2002 2003
%
Corporate taxes Indirect taxes Pers.inc.
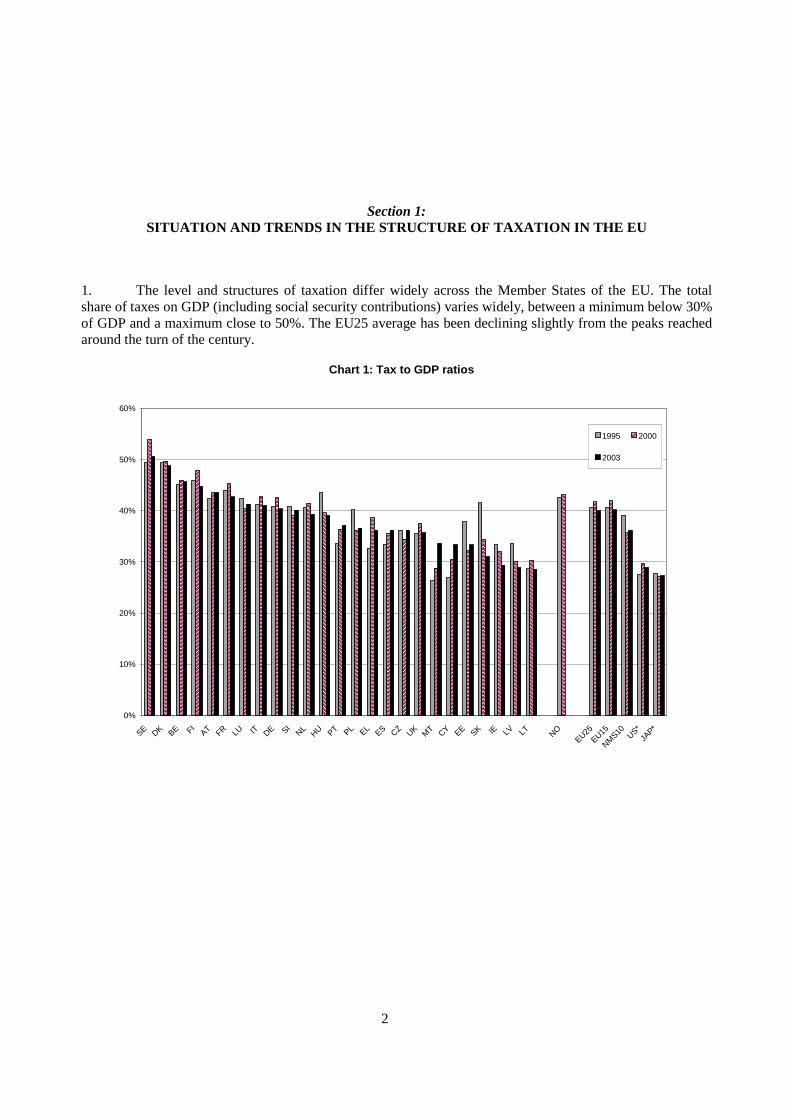
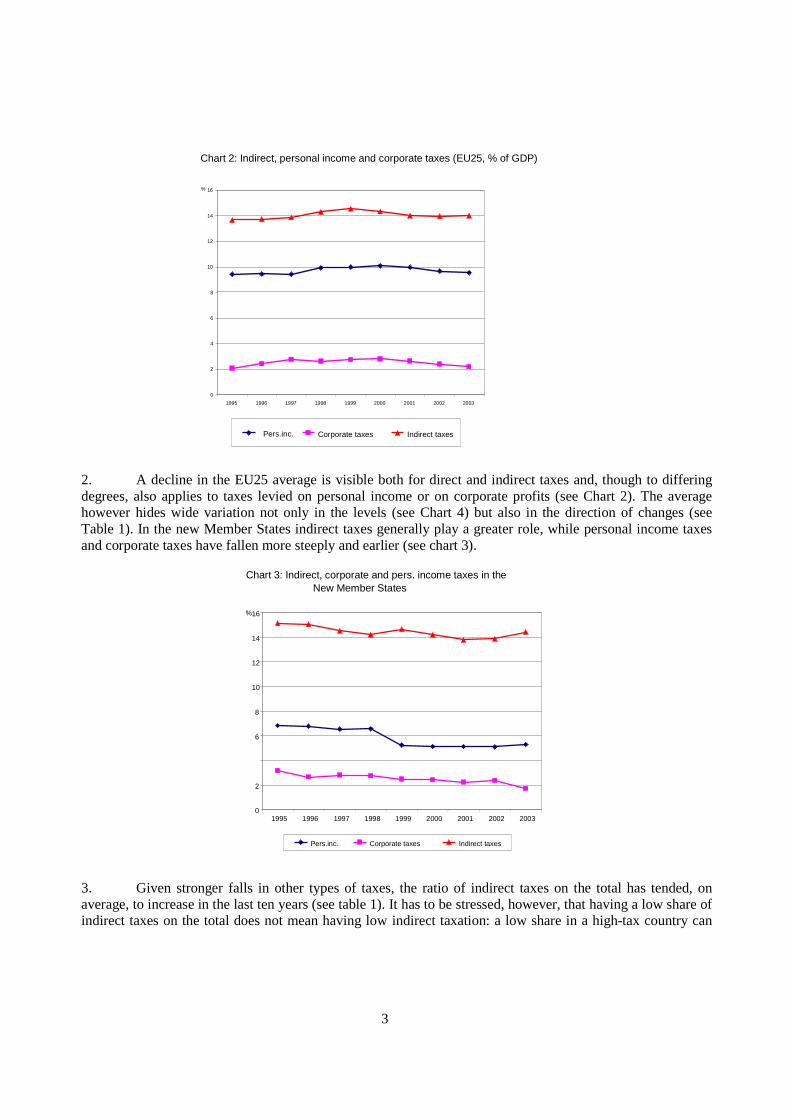
2. A decline in the EU25 average is visible both for direct and indirect taxes and, though to differing degrees, also applies to taxes levied on personal income or on corporate profits (see Chart 2). The average however hides wide variation not only in the levels (see Chart 4) but also in the direction of changes (see Table 1). In the new Member States indirect taxes generally play a greater role, while personal income taxes and corporate taxes have fallen more steeply and earlier (see chart 3).
Chart 3: Indirect, corporate and pers. income taxes in the New Member States
0
2
6
8
10
12
14
16
1995 1996 1997 1998 1999 2000 2001 2002 2003
%
Pers.inc. Corporate taxes Indirect taxes
3. Given stronger falls in other types of taxes, the ratio of indirect taxes on the total has tended, on average, to increase in the last ten years (see table 1). It has to be stressed, however, that having a low share of indirect taxes on the total does not mean having low indirect taxation: a low share in a high-tax country can

4
still represent relatively high levels of indirect taxation. Belgium, for instance, with a share of only around 30% of indirect taxes on the total, has a higher level of indirect taxation than Spain, where the share is 34%2.
Chart 4 Breakdown of taxes by type (% share of taxation, 2003)
0%
20%
40%
60%
80%
100%
BE CZ DK DE EE EL ES FR IE IT CY LV LT LU HU MT NL AT PL PT SISK FI
SE UKEU25
EU15
Euro12
NMS10
Indirect taxes Direct taxes Social contributions
Table 1: Indirect taxes as % of total taxation (including social contributions)
CY PT MT IE HU PL SI LT EL LV EE UK SK
1995 42,7 43,5 46 43,9 41 39,2 39,4 43 44,1 40,7 36,6 39,8 37,7
2003 49,6 43,3 42,6 42,5 42,4 41,9 41,8 41,5 39,7 39,7 39,3 38,3 37,1
FR DK IT AT SE ES NL LU FI CZ DE BE EU25
1995 36,8 34,8 30,9 35,9 32,8 32,6 29,3 31,9 31,1 33,9 30,1 29,5 33.7
2003 36,4 35,8 35,6 35,2 34,8 34,5 33,9 33,8 32,6 31,4 30,7 30,1 35.1
Source: Commission services. Data for 2003 provisional.
2 In Belgium, indirect taxes account for 13.8% of GDP compared with Spain's 12.5% (2003).

5
Section 2: THE MERITS OF A SHIFT IN DIRECT TO INDIRECT TAXATION
4. The current tax policy proposals reflect widespread dissatisfaction with the recent EU growth performance. Indeed, after a period when EU GDP per capita was catching up rapidly with the US's, already for well over a decade growth in Europe has fallen behind that of its main competitors. It is currently being debated whether reforms in tax and social security systems could help improve the EU's growth and employment performance.
5. The interest for tax shifts is surely linked with the fact that EU countries as a whole, in spite of oft-repeated commitments to the contrary, have generally had only limited success in reducing the total tax burden. Hence, the interest for recipes that do not involve cutting government spending, but purely changing the way in which the current level of revenue is raised. Besides the general discussion on how to boost growth in the EU, the Lisbon objective of raising the average labour participation rate has stimulated a debate on the possible ways of reducing the tax disincentives to employment.
Taxation of labour and production costs
6. The example of the Nordic member states shows that high levels of taxation can be compatible with high employment and competitiveness levels. Nevertheless, ceteris paribus, reducing taxes on labour could be a useful tool to stimulate employment. The reasoning is that by reducing taxation of this factor, returns to labour income would become more attractive and hence encourage the take-up of jobs, particularly at the lower end of the wage distribution (and depending on labour supply elasticities). Currently, labour market participation is low in several EU countries compared to the US or in Japan. Mobilising the "missing" labour resources would undoubtedly boost GDP significantly, and is indeed one of the Lisbon objectives.
7. Labour costs in the EU are generally burdened by high levels of taxes and social contributions, the so-called tax wedge. OECD figures for 2003 put the tax wedge at 54.5% in Belgium and Germany, compared to a minimum of 14.1% in Korea. Nevertheless, the situation is not uniform (in Ireland, the tax wedge is 24.5% and falls drastically for one-worker couples with children, to just 7.4%). Furthermore, a large part of the tax wedge is usually due to social contributions (the portion of labour costs due to personal income taxes is, for instance, only 5% in Greece whereas it exceeds 30% in Denmark). The negative impact on employment of employees' social contributions –in particular pension contributions, which usually constitute the largest chunk of payments – can be less than that of taxes, if the rate of return of pensions contributions is not too far from the rate of return on individual savings3.
8. Cutting personal income taxes would not directly reduce enterprises' production costs, unless enterprises were able to cut salaries by the same amount4. If there is an offsetting increase of taxation of goods, this however seems unlikely, owing to the long run behaviour of labour supply. Specifically, if VAT is increased by the same amount as personal income taxes are cut, the price of goods would increase so that for
3 The reason is that workers obtain a personalised benefit from pensions contributions in the form of a higher future
pension, whereas there is no benefit to the individual from paying higher taxes. 4 The situation in which movements in net wages offset completely changes in the tax burden is known in the
literature as "complete absence of real wage resistance". Real wage resistance depends notably on the demand and supply elasticities of labour. Opinions differ amongst economists as to the existence of real wage resistance in the real world. In a recent paper, Arpaia and Carone (2004) find that there is probably some wage resistance in the short term but not in the long-term, although the transition to the long term can be very long. See also Bovenberg (2003).
6
many salaried workers the real, as opposed to the nominal, wage rate might not increase. The supply of labour is usually thought to depend on the real wage rate; if the latter does not increase, the former should not increase either. In other words, if my take-home pay increases by 20%, but the price of all goods goes up by the same percentage, there is no compelling reason why I should modify my behaviour and work longer hours. This point is made, amongst others, by Layard, Nickell and Jackman (1997): they argue that because labour supply (and therefore wages) depends on the total tax burden of a worker household, if VAT is de facto largely paid by workers there is little scope for a positive labour market reaction from the shift. Hence the issue is not straightforward; it is necessary to evaluate carefully, in a general equilibrium model, how the rebalancing in taxation would affect labour supply, before we can judge the effects on output.
9. The specific features of the labour market institutions also play an important role in determining the effectiveness of the envisaged shift. Factors such as the centralised vis-à-vis decentralised nature of wage bargaining, union power, the precise characteristics of the unemployment benefits (e.g., even the question whether benefits are taxed or untaxed) and the existence, level and coverage of minimum wages are likely to exert an important influence on the existence of real wage resistance and hence the outcome, particularly in the short-term. This implies that any shift would be likely to have different effects across the EU5.
Would employment be boosted?
10. Section three illustrates in detail the results of a European Commission QUEST model simulation which addresses this issue. The results suggest that overall, there would be a positive impact on employment and output, even though for many salaried workers the gain from lower direct taxes would be offset by higher goods prices. The extent of the positive effects, however, varies considerably depending on the degree by which pension and benefits levels change after the reform.
11. According to the simulation, if the recipients of transfers and benefits are not compensated for the price increases that follow the increase in VAT, the GDP and employment gains are substantial: every cut by 1 percent point in the tax rate on labour, offset by a corresponding increase in consumption taxes (e.g. VAT) would yield an increase of 0.54% in employment in the long run and of 0.30% in GDP6. This result is not surprising; keeping the level of transfers and benefits constant in the presence of an increase in the general price level is equivalent to a cut in social security payments. This would compel people to seek employment even at lower real wages and, by reducing expenditure and taxes, would also reduce the real burden of taxation. This scenario does not, however, look realistic as in real life there would be a strong political pressure to adapt pensions and benefits to the higher cost of living. Compensating transfer recipients for the increase in the Consumer Price Index reduces considerably the employment and GDP benefit. Nevertheless, it is notable that the QUEST model still yields positive growth and employment gains. These results would therefore lend support to the tax shift proposals.
The tax shift and tax avoidance
12. The specific features of the QUEST model naturally have a bearing on these results. A more detailed description of these features will be given in Section 3. We would however like to attract the reader’s attention to a key assumption of the simulation: that VAT affects all types of household income (consumption is proportional to labour income plus transfers plus capital income), while labour taxes only affect labour income. Hence, assuming that at least some profit income is used for consumption, the increase in value added tax will cause the burden of taxation to be spread wider than merely on labour. The lower tax burden on labour then quite naturally stimulates employment and leads to GDP growth.
5 See Arpaia and Carone (2004). 6 These results refer to the EU15.

7
13. This point is important because it refers directly to one argument put forward by proponents of the shift to indirect taxation: indirect taxes are borne both by the working and by the non-working population. If there is 1) high avoidance of taxes on capital income and 2) a significant proportion of consumption is ultimately financed from profits, then there is a chance that the effective burden of the VAT increase is shifted away from labour, undoubtedly stimulating employment. This reasoning intuitively lends support to a shift. One should note, however, that high avoidance of capital taxes is likely at the top end of the income distribution, as only the rich have a strong incentive to set up complex tax avoidance strategies. On the other hand, the share of consumption declines with income. Hence, in the case of progressive taxation of capital income7, if profit earners earn a large share of national income and have a low propensity to consume and to evade taxes, a cut in direct taxes coupled with an increase in consumption taxes might conceivably shift the burden of taxation towards labour, thereby worsening employment and harming GDP (see table below).
Diagram 1: Change in effective tax burden on labour following a rebalancing towards indirect taxes
Low propensity to consume from profits (= high income concentration )
Tax burden on labour increases
?
High propensity to consume from profits (= low income concentration )
?
Tax burden on labour decreases
Low avoidance of business and capital taxes
High avoidance of business and capital taxes
14. A rebalancing of taxes towards indirect taxation might conceivably, given their somewhat less visible nature, reduce tax evasion. There is some support in the literature for this thesis8. The large estimated size of the black economy suggests that even a moderate reduction of tax evasion would lead to substantial increases in revenue9. However, in a Canadian study (Brou and Collins, 2001) based on a general equilibrium model, it was found –in contradiction to earlier results- that a shift from direct taxes to indirect taxes, at unchanged revenue, increases the size of the informal economy; this is in line with a previous study on Austria10.
15. The specific features of the labour market institutions also play an important role in determining the effectiveness of the envisaged shift. In this context, economists have found that factors such as the centralised vis-à-vis decentralised nature of wage bargaining, union power, the precise characteristics of the unemployment benefits (e.g., even the question whether benefits are taxed or untaxed) and the existence, level and coverage of minimum wages are likely to exert an important influence on real wage resistance and
7 Note that this would not apply in Dual Income Tax systems, which separate capital and labour income taxation
and usually apply a flat rate to the former. Most Nordic countries as well as Belgium have implemented flat-rate taxation of capital income. See Annex on the Nordic model.
8 See, for instance, Caragata and Giles (1998); Bartlett (2004). 9 In a study of 21 OECD countries, Schneider (1993) finds that Greece, Italy, Belgium and Sweden, who have the
largest shadow economies in 1996 also have high tax and social security burden, whereas countries like Switzerland and U.S., who have the lowest overall tax and social security burden also display the lowest shadow economies with 7.5 and 8.8%. There are however exceptions to this regularity, like the United Kingdom and Austria with a quite high overall tax and social security burden (54.9 and 70.4%) and a quite low shadow economy (13.1 and 8.3%).
10 See Schneider and Neck (1993).
8
therefore on the labour market outcomes, particularly in the short-term. This also implies that the shift would be likely to have different effects across the Member States.
16. Summing up, one of the greatest merits of the tax shift seems to be linked to the possibility of spreading the taxation burden across a wider number of taxpayers and hence reduce the tax burden falling directly on labour. In theory, taxing income is socially superior to taxing consumption because of the regressive nature of taxes like the VAT11. However, in practice profits and rents (which make up roughly one fourth to one third of GDP) are usually believed to be taxed at a much lower rate than labour income, because they are more difficult to tax effectively and easier to evade.
Would a greater reliance on indirect taxation shift the burden of taxation from EU to foreign products?
17. Another advantage sometimes put forward by proponents of tax shifts refers to the thesis that the burden of taxation would no longer fall solely on domestic producers but would also affect imports. This effect however depends on which indirect taxes are being increased.
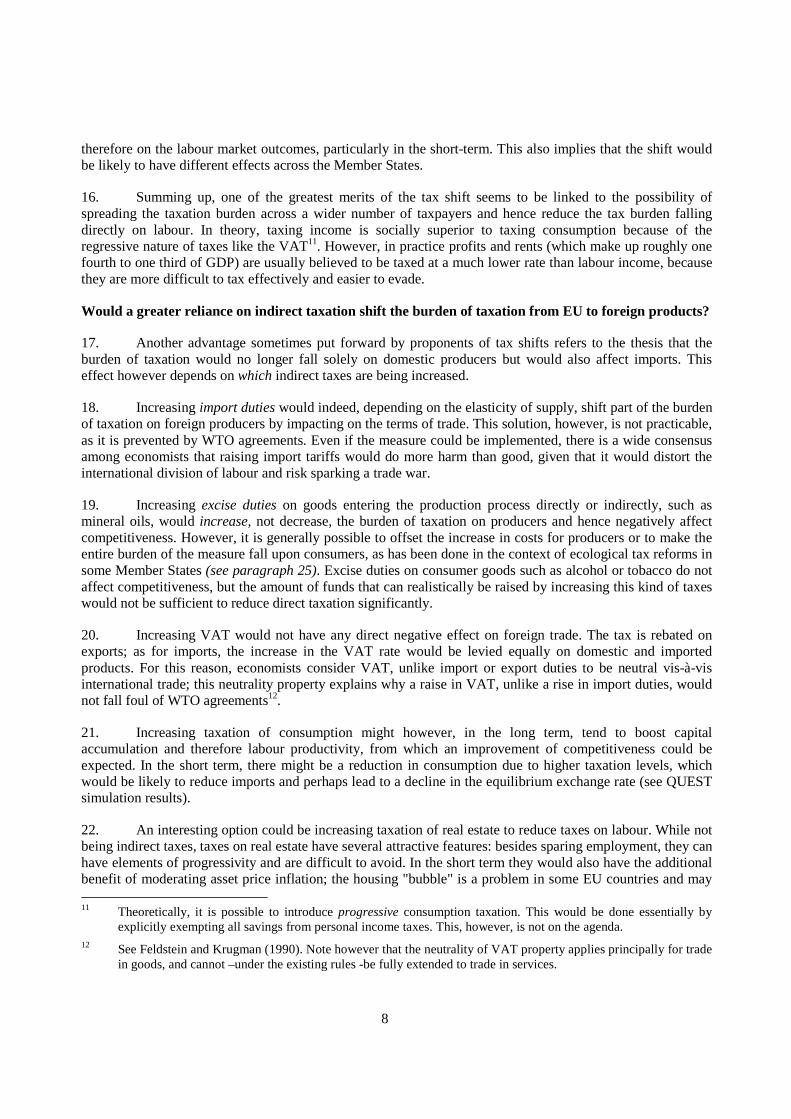
18. Increasing import duties would indeed, depending on the elasticity of supply, shift part of the burden of taxation on foreign producers by impacting on the terms of trade. This solution, however, is not practicable, as it is prevented by WTO agreements. Even if the measure could be implemented, there is a wide consensus among economists that raising import tariffs would do more harm than good, given that it would distort the international division of labour and risk sparking a trade war.
19. Increasing excise duties on goods entering the production process directly or indirectly, such as mineral oils, would increase, not decrease, the burden of taxation on producers and hence negatively affect competitiveness. However, it is generally possible to offset the increase in costs for producers or to make the entire burden of the measure fall upon consumers, as has been done in the context of ecological tax reforms in some Member States (see paragraph 25). Excise duties on consumer goods such as alcohol or tobacco do not affect competitiveness, but the amount of funds that can realistically be raised by increasing this kind of taxes would not be sufficient to reduce direct taxation significantly.
20. Increasing VAT would not have any direct negative effect on foreign trade. The tax is rebated on exports; as for imports, the increase in the VAT rate would be levied equally on domestic and imported products. For this reason, economists consider VAT, unlike import or export duties to be neutral vis-à-vis international trade; this neutrality property explains why a raise in VAT, unlike a rise in import duties, would not fall foul of WTO agreements12.
21. Increasing taxation of consumption might however, in the long term, tend to boost capital accumulation and therefore labour productivity, from which an improvement of competitiveness could be expected. In the short term, there might be a reduction in consumption due to higher taxation levels, which would be likely to reduce imports and perhaps lead to a decline in the equilibrium exchange rate (see QUEST simulation results).
22. An interesting option could be increasing taxation of real estate to reduce taxes on labour. While not being indirect taxes, taxes on real estate have several attractive features: besides sparing employment, they can have elements of progressivity and are difficult to avoid. In the short term they would also have the additional benefit of moderating asset price inflation; the housing "bubble" is a problem in some EU countries and may 11 Theoretically, it is possible to introduce progressive consumption taxation. This would be done essentially by
explicitly exempting all savings from personal income taxes. This, however, is not on the agenda. 12 See Feldstein and Krugman (1990). Note however that the neutrality of VAT property applies principally for trade
in goods, and cannot –under the existing rules -be fully extended to trade in services.

9
be putting upward pressure on euro interest rates. Currently, with the exception of five countries (UK, F, DK, L and FI), revenues from these taxes in the EU are no higher than 0.2% of GDP.
23. Environmental taxes too could be of interest when considering possibilities for shifting the balance. Although they could have a negative effect on competitiveness, ways can be found to offset cost increases for businesses; this is indeed what has been done in the EU energy tax directive(2003/96/EC) and in environmental tax reforms introduced in many Member States. It should be noted, however, that the EU allowance trading scheme for CO2 emissions, launched in early 2005, limits to some extent the possibilities to increase the energy taxation of the sectors covered by the scheme (energy production and energy intensive industries). Other possible tax bases in environmental area exist, e.g. the energy use on non-trading sectors (transport) but, on account of their size, offer little room for substantial reductions of the tax burden on labour.
24. Environmental tax reforms entail shifting the tax burden from labour towards environmentally harmful goods and activities. Thus the reforms aim at achieving a "double dividend"; simultaneously increasing employment by decreasing the indirect cost of labour, and improving the state of the environment by making the activities which are harmful for the environment more costly. The 'double dividend' has been subject to a large amount of theoretical and empirical research. The studies usually show that the 'double dividend' exists, although it is not always substantial. This was also the case in the two recent studies of DG TAXUD concerning the impacts of energy tax policies in the EU. The policy simulations of these studies show that increasing the EU energy taxes, while reducing the employers' social security contributions by the corresponding amount (revenue neutrality), leads to higher employment (compared with the reference scenario) and better environment at the same time. The latter effect is shown by the reduction of CO2 and other energy related emissions (NOx, SO2, VOC, PM). The size of both effects depends on the size of the tax increase. Higher energy taxes would, however, also affect the competitiveness of energy-intensive industrial sectors negatively, (also shown in the studies), which so far has been an obstacle to a wider use of environmental tax reforms in the Member States.
Choice of the allocation of cuts in direct taxes
25. The composition of the cuts can be expected to have differing impacts on competitiveness. For example, Bassilière et al. (2005), utilising a HERMES model simulation for Belgium find that a cut in employers' social security contributions and a cut of corporate taxes would have the highest impact on GDP, while cuts in direct taxes would yield a lesser result (see table 2). Lee and Gordon (2005) estimate the growth benefits from a 10 point cut in the corporate tax rate to be very strong, adding from 1 to 2 percent points to the GDP growth rates, while the link between growth and other tax variables, including the average rate on labour income, is found to be weak. In general, a cut of corporate tax levels may be expected to have a direct impact on international competitiveness13. The 2005 World Competitiveness Yearbook likewise finds that corporate tax rates, rather than the general taxation level, and the efficiency and quality of government expenditure have a direct impact on competitiveness.
13 See also Bartlett (2004).

10
Table 2: Effects on GDP and employment from a cut by 0.5% of GDP in different taxes; HERMES model simulations for Belgium, results for year +7; variant with free salary adjustment
Employers' social
contributions, (targeted on low salaries)
Employers' social
contributions (non-targeted)
Corporate income tax
Personal income tax
Employees' social
contributions
GDP, % change on baseline 0.18 0.18 0.32 0.20 0.12
Employment, % change on baseline
0.78 0.37 0.12 0.04 0.02
Source: Bassilière et. al., op. cit., p. 605
26. Overall, there are reasons to believe that the highest (at least in the short run) beneficial effect on employment would be obtained by a cut in employers' social security contributions (because it directly reduces labour costs), followed by a cut in income tax rates, while a cut in employees' social security contributions (pensions contributions particularly) would have the least effect. One additional advantage of a cut in employers' social security contributions is the fact that they would tend to limit more directly than other alternatives the increase in consumer prices due to a VAT hike, thanks to the disinflationary effects of a cut in production costs. The literature also indicates that a cut in corporate income tax rates should yield a sizeable effect on competitiveness.
Current orientations in the economic literature
27. The economic literature on taxation reform largely concentrates on the US experience and is therefore not directly applicable to the EU. The proponents of taxation reform in the U.S. typically find benefits from increasing indirect taxation, but these are also linked to the highly distortionary nature of the U.S. system. Interestingly, one policy suggestion often put forward by the US literature is the introduction of VAT!
28. One difficulty in evaluating the merits of a shift towards indirect taxes is that the economic research has not reached definite conclusions even on the wider issue of the effects of taxation overall on economic growth. Although theory suggests that higher taxes should depress growth, a 2004 paper by the IMF states flatly that "there is no clear empirical evidence to support the general presumption that a higher tax burden has a negative effect on growth". Tanzi and Zee, in a 1997 survey, concluded that the empirical literature is less definitive than one would have thought and is somewhat disappointing in its support of the conclusions derived from theory". In a more recent survey of the findings of tax and welfare policies on employment, Disney (2000) arrives at similar conclusions. Some authors, like Daveri and Tabellini (2000) found a negative effect of higher labour taxes on employment and growth. Other studies, however, that estimate the effect of taxation on growth fail to find any significant effect (e.g. Easterly and Rebelo (1993) experimented with thirteen different measures of the tax burden and found only one to be statistically significant in explaining growth14. Stokey and Rebelo (1995) also fail to find a significant link between taxes and growth. In 1997, Mendoza, Milesi-Ferretti and Asea found support for the thesis that tax policy only marginally affects economic growth.
29. Given the above, it is not surprising that there is also no unanimity in the literature on the merits of a shift towards indirect taxes. We have already mentioned above the findings of Layard, Nickell and Jackman (known to be amongst the best experts on unemployment) that cast doubts about whether such a tax shift
14 This was, however, an estimated marginal income tax derived from regressing income tax revenue on GDP, which
may be relevant to our problem.

11
could have significant and lasting employment effects. They argue that because labour supply (and therefore wages) depends on the total tax burden of a worker household, one should not expect a favourable shift in labour supply if labour taxes are lowered and consumption taxes are increased at roughly similar rates. This argument of course assumes that tax policy is not successful in shifting the burden of taxation away from worker households. These authors also report empirical evidence from estimated wage equations which suggest that there is only a short run but no long run impact of payroll taxes on real (gross) wages. In their view, labour taxes do not have a long run effect on gross wages, as they are all eventually shifted onto workers. More recently, also Bovenberg (2003) seems to come to similar conclusions ("changes in the tax structure, i.e. replacing payroll taxes by consumption taxes, do not affect equilibrium unemployment") and links success of a tax reform to the possibility of shifting part of the tax burden away from the active workers ("A change in the tax structure thus succeeds in alleviating unemployment if it replaces a tax that is borne by workers only by a tax that is also paid by the unemployed"). Accordingly, a 2005 Centraal Plan Bureau (CPB) simulation of a limited tax shift (1 percent point of VAT increase financing a cut in the personal income tax) for the Netherlands found no positive effect in the long run as the income distribution was unaffected by the measure. This argument echoes the general result that most employment gains seem to be linked to the possibility of really shifting the incidence of the tax burden away from labour. Bartlett (2004) recalls the lesser disincentive effect of social security contributions on employment and considers that "the impact on economic growth of replacing the payroll tax with a VAT is likely to be minimal".
30. As Roeger (1997) puts it, "these criticisms suggest that though the idea of shifting the tax burden away from labour is theoretically appealing, the uncertain nature on who is eventually carrying the burden of taxation, the distributional consequences associated with it and the corrective social policies that are likely to accompany such a tax shift cast doubt on the potential employment gains that can be achieved with this type of reform".
31. Nevertheless, other results support the idea that labour taxes are detrimental to employment15 and that a budgetary-neutral shift to indirect taxes would be beneficial.
32. The 1997 study by W. Roeger, which forms the basis of the updated Quest model simulations presented in the following section, finds positive growth and employment effects from such a shift even in the case of full compensation of price increases to recipients of transfers and benefits.
33. Dahlby (2001) provides a comprehensive discussion of the theoretical arguments underpinning a shift towards indirect taxes. An important focus of that paper is on the distinction between the static efficiency gains made possible by a revenue-neutral shift, which would result in a temporary (though possibly of a long duration) increase in the growth rate, and dynamic efficiency gains that would instead lead to a permanent increase in the growth rate. Echoing to some extent the Layard-Nickell argument that [for workers] a consumption tax is in many respects similar to a wage tax, because the lifetime consumption tax base is equal to the present value of labour income plus inheritances and net of bequests, he concludes that from a theoretical standpoint the static efficiency gains are ambiguous and uncertain. However, he reaches the conclusion that there are significant chances that a shift from income to consumption taxes is likely to have a significant positive effect on growth. Applying an endogenous growth model, he estimates the possible growth effects at around 0.2% per annum, which is roughly in line with the QUEST simulations. This author also discusses empirical studies by Mendoza et al. (1997), Kneller et al. (1997) and Widmalm (2001) and finds that they successfully overcome many of the problems which plagued the earlier literature and make a convincing case for the existence of dynamic effects – i.e., the growth rate would not be boosted temporarily owing to the removal of an inefficiency in factor allocation, but would be increased permanently. This is linked to the fact that taxation of consumption instead of income removes the fiscal disadvantage from saving
15 See Daveri and Tabellini (2000) and, for a short review, Wyplosz (2003).
12
(as savings are untouched by consumption taxes). According to this author, this would lead to a permanently higher accumulation of capital in the long run and thus permanently higher growth rates.
34. From a Belgian perspective, Burggraeve and Du Caju (2003), simulating a cut in social security contributions financed through an increase in indirect taxes, find that net positive job creation can still be possible under certain conditions, but caution that the effect is small and can only be a part of an overall labour market strategy16.
35. As for ex-post analyses, a 2004 IMF paper utilising panel data from 18 OECD countries between 1970 and 2002, found that a higher ratio of direct to indirect taxes has a negative impact on real GDP growth, investment and unemployment. The estimates suggests that lowering the share of direct taxes in total revenues by 3 percentage points while raising the share of indirect taxes by the same amount would raise growth by ¼ percentage point, an order of magnitude similar to the one found by the Quest simulation (with constant benefits) and by the growth regressions presented in section 3. A notable result of this study is that the impact of taxes on corporations and social security contributions is similar to the impact of taxes on income of individuals.
36. Finally, the ex-post analysis based on growth regressions, presented in the next section of this paper, also finds some evidence for a positive effect on growth of a higher share of indirect taxes. The coefficient has the expected sign and yields a growth boost in per capita income of about 2% after ten years, which is in the same order of magnitude as the results from other studies and from the Quest simulation. The coefficient, however, is only marginally significant.
Redistributional implications
37. Tax shifts have some problematic redistributive aspects. A reduction in income taxes coupled with an increase in VAT tends to reduce the tax burden on higher incomes while increasing it on poor or middle-income households. The redistributive properties of direct income taxes have indeed been, historically, an important reason for their introduction and considerable expansion during the XX century17. Recent experience seems to suggest that this aspect would receive public attention: in Slovakia, whose tax reform, besides introducing a flat income tax, increased reliance on indirect taxation, the discussion centred on the redistributive implications of the reform. This eventually led to compensations for low-income households. The study presented in Section 3, however, shows that this reduces the positive impact from the reform. The political acceptability of a tax shift is also weakened by the fact that the middle class –the largest group of voters - would inevitably lose out, as well as by the recently heightened attention in many countries to (real or imagined) price hikes following the introduction of the euro.
38. Apart from equity considerations, the redistributive implications of the proposal might prima facie further undermine the stimulus to take up work amongst the so-called marginal workers, i.e. low-skilled workers whose wages are only marginally above social security benefits. If we assume that the low EU labour participation is due to low-productivity workers, rather than high-income retirees, the effect on labour participation rates might be limited: while high-productivity workers would indeed gain much from a cut in direct taxes, and conceivably increase their participation, low-productivity workers might gain little from a reduction of payroll taxes, because these are, in their case, low anyway. Hence they would perhaps not be meaningfully more inclined to increase their working hours while at the same time losing out in equity terms.
16 The simulation is done for Belgium. On account of the specifities of the Belgian labour market, i.e. wage
indexation and the wage norm, the results may be less positive than for other countries. 17 Pre-1900 tax systems relied heavily on indirect taxes. These are still a typical feature of fiscal systems in less
developed countries.
13
Actually, given that low labour market participation is often linked to the smallness of the gap between social security payments (which are indexed to prices and hence would not decline in real terms after the reform) and take—home pay, labour supply might even fall instead of increasing.
39. The study contained in Section 3 of this note unfortunately cannot shed much light on this issue because it does not include a breakdown of the worker population according to income and/or productivity.
40. The models used also cannot evaluate the sectoral impact of an overall increase in indirect taxes. In general, that an increase in excise duties will tend to have greater sectoral effect than a wide hike in VAT; even a VAT hike however might have an differential impact, for instance, on big-ticket items. The Belgian authorities report that for instance the construction sector opposes a reduction in employer social security contributions financed by a VAT increase.
41. Another difficulty is linked with the intertemporal profile of expenditure. In principle, revenue taxation affects both the consumption and the savings component of revenue (even though in practice the taxation of the savings component is much less heavy). Reducing direct taxation and increasing consumption taxation would be normally expected to stimulate savings which would become comparatively less taxed. In the short run, this could, in theory, have a contractionary effect on GDP given that consumption demand, unlike savings, translates one-to-one in aggregate demand.
42. Apart from this problem, concentrating taxation on consumption would spare from taxes the highest-income taxpayers who are likely to have a very low propensity to consume. Their accumulated wealth is likely never to be consumed but rather bequeathed to future generations. Hence, considering the low effective take from inheritance taxes, this wealth would largely be taxed only in the very long run or never, aggravating the negative redistributional effects mentioned above18. On the other hand, holders of non-indexed bonds would be subject to an implicit inflation tax on their net worth (see paragraph 48).
Problems associated with the induced price increases
43. An additional problem is linked with the one-time increase in the price level. This aspect is likely to have a perceptible effect on consumer sentiment, despite the concurrent decrease in direct taxation, given that sizeable parts of the population may conclude that they are worse off in net terms. This could result in a short-term negative impact on consumption and GDP as consumers attempt to save more to face the uncertainty on permanent income (so-called precautionary saving). The experience in Italy, in Germany and in the Netherlands after the introduction of the euro also seems to indicate that consumers are very sensitive to general price increases, even when official price statistics are reassuring.
44. This would be aggravated, in case of a sharp (anticipated) increase of indirect taxes, by the possibility that consumers bring forward expenditure on durables to before the date of the VAT increase to avoid higher taxation (see also the simulation results in section 3 which indeed foresee a decline in GDP in the first year).
45. If unions react to negative consumer sentiment by demanding countervailing wage increases despite the cuts in direct taxes, there is a danger of a wage-price spiral, that would transform a one-off price increase in an increase in the inflation rate likely to last for a few years. This would likely elicit a monetary policy restriction and a deceleration of GDP growth, at least in the short run.
18 On the other hand, the partial removal of the distortion against future consumption inherent in a shift away from
income taxation would have a non-negligible welfare effect which arguably might partly compensate for the negative redistributive implications. See Dahlby (2001).

14
46. The tax-induced increase in the general price level would, however, lead to a fall of the real value of debt (only a tiny portion of debt is indexed to the price level). This would benefit all debtors, notably governments, for some of which the relief would be significant at 1 to 2% of GDP. This would however reduce the value of non-indexed bonds accumulated by would-be retirees to finance their retirement; pensioners and older workers would therefore be likely to oppose any increase in VAT.

15
Section 3: QUEST MODEL SIMULATIONS OF A TAX SHIFT FROM DIRECT TAXES TO INDIRECT
TAXES AND RESULTS FROM GROWTH REGRESSIONS
47. QUEST is a macroeconomic model whose foundations can be characterised as a modern version of the neoclassical-Keynesian synthesis. Behavioural equations in the model are based on intertemporal optimisation of households and firms with forward-looking expectations. Prices adjust sluggishly and the nominal wages response is delayed because of overlapping wage contracts. The model has Keynesian features in the short run, but the effectiveness of fiscal policy is more limited than in the traditional econometric models because of the built-in intertemporal budget constraints. However, since planning horizons are finite there is no complete tax discounting and Ricardian equivalence does not hold.
48. The model has been used to analyse the macroeconomic effects of various shifts in taxation towards indirect taxes; notably the measure put forward in the proposal contained in the Pentathlon for Europe document presented by Belgian Prime Minister Verhofstadt in 2005. The scenario analysis described in this note includes stylised tax shifts of 1% of GDP from labour income tax to value added taxes, as well as an increase of the share of indirect taxes in total taxes to 40 and 50 percent respectively. The simulations could not be extended to all 25 EU Member States, so the analysis reported here refers to the EU15.
49. The QUEST model contains various government revenue categories for each of the EU15 member states, but for the purpose of this exercise, the focus is on labour income tax and value-added taxes only, i.e. the shift from direct taxation to indirect taxation is modelled as a shift from labour income tax to value-added taxes. Social security contributions are included in labour income taxes and not modelled separately in the model, while corporate taxes are kept unchanged in this exercise. Labour income taxes are borne by the working population, while value added taxes, proportional to consumption expenditure, are borne by both the working and non-working population. Table A in the Annex describes the shares of direct and indirect taxation for the EU member states in 2002.
Standardised tax shocks
50. In order to analyse the macro economic effects of a shift in taxation, we first describe the effects of a shift from income tax to indirect tax of 1 per cent of GDP. In this scenario, labour income taxes are reduced by 1 per cent of baseline GDP and this is accompanied by an increase in value added taxes of also 1 per cent of GDP such that the shift is ex-ante budgetary neutral19. Unemployment benefits are not indexed to after-tax wages or consumer prices, but linked to gross wages in the first scenario considered here, which means a decline in relative incomes for benefit recipients. The widening gap between (after tax) wages and benefits
19 In addition a tax rule operates that adjusts value added taxes so as to stabilise the debt to GDP ratio in the long
run. This guarantees that the scenarios are as close as possible budgetary neutral ex post , taking into account the second round positive effects from higher growth on tax revenues and government budgets. Monetary policy is assumed to follow a standard Taylor-type rule with the ECB targeting the output gap and (expected) inflation.

16
(the reservation wage ) puts downward pressure on wages and this scenario gives the maximum employment effect in the model20
51. Table 1 shows the macro economic effects of this stylised tax shift for the EU15. The increase in indirect taxes (roughly 1.5 percentage points on impact) has an immediate impact on consumers’ spending and reduces consumption. Wage earners pay less income tax and are partly compensated by an increase in disposable income, but non-wage earners are not compensated for the increase in indirect taxes and see their income decline. The reduction in income tax is partly shifted onto workers and gross wages decline in the short run. This leads to positive employment effects as firms expand their workforce and after 10 years employment has risen by 0.9 per cent. The rise in employment is accompanied by an increase in the capital stock, i.e. a rise in investment. The overall effect on output in the EU15 is only negative in the first year (-0.05 per cent below baseline) but turns positive in the second year and GDP is 0.7 per cent above baseline after 10 years.
Table 1 Macro economic effects of a 1% of GDP shift from direct taxes to indirect taxes (scenario 1: benefits not indexed to consumer prices)
Year: 1 2 3 4 5 10 TOTAL.GDP_PCER -0.05 0.30 0.48 0.56 0.60 0.72 EMPLOYMENT_PCER 0.15 0.56 0.71 0.76 0.78 0.88 REAL.WAGE.COSTS_PCER -0.67 -0.70 -0.34 -0.23 -0.19 -0.16 NOM.WAGES_PCER -0.74 -0.78 -0.40 -0.24 -0.15 0.17 BENEFITS_PCER -0.61 -0.63 -0.29 -0.21 -0.22 -0.48 UNEMPL.RATE_ER -0.14 -0.52 -0.66 -0.70 -0.73 -0.84 VAT_ER 1.50 1.24 1.07 0.99 0.95 0.94 TL_ER -1.70 -1.70 -1.71 -1.71 -1.71 -1.73 TRADE.BAL.TO.GDP_ER -0.04 -0.16 -0.18 -0.19 -0.19 -0.17 52. The above scenario implies large losses in income for the unemployed, who face higher indirect taxes but are not compensated like wage earners by higher after-tax wages. An alternative scenario, in which unemployment benefits are indexed to consumer prices, is shown in Table 2. Here, benefits are raised in line with the rise in consumer prices caused by the increase in value added taxes, and benefit recipients are partly compensated for the rise in indirect taxes (note however that benefits are not indexed to after-tax wages and the gap between after-tax wages (not shown in table) and benefits still increases, although by less than in the first scenario). In this case wage costs fall by less than in the previous scenario, but there is still a significant employment effect, of 0.5 per cent after 10 years. The increase in GDP after 10 years is smaller than in the first scenario, but still positive at 0.4 per cent.
20 Wages in the model depend on the reservation wage (unemployment benefits) , labour productivity and labour
market tightness (unemployment rate). Workers care about net after tax wages, and a reduction in labour income taxes has the effect of lowering gross wages if the ‘reservation wage’ is unchanged.
17
Table 2 Macro economic effects of a 1% of GDP shift from direct taxes to indirect taxes: EU15 (scenario 2: benefits indexed to consumer prices)
Year: 1 2 3 4 5 10
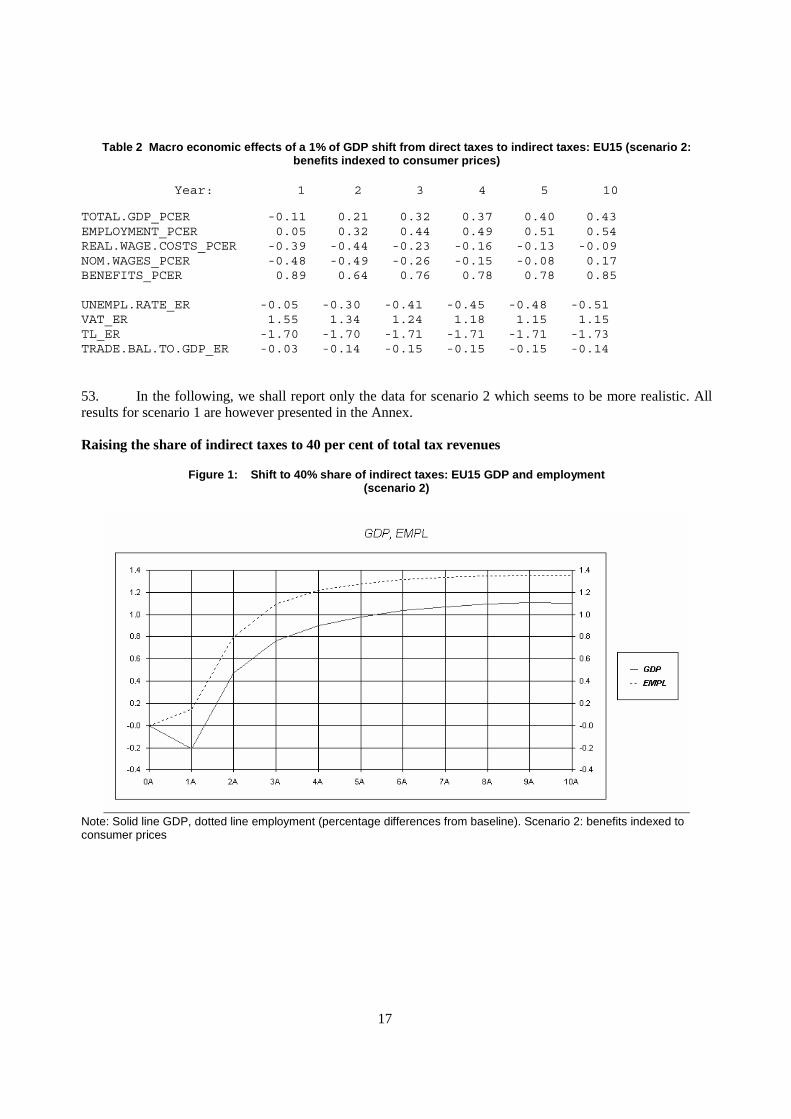
TOTAL.GDP_PCER -0.11 0.21 0.32 0.37 0.40 0.43 EMPLOYMENT_PCER 0.05 0.32 0.44 0.49 0.51 0.54 REAL.WAGE.COSTS_PCER -0.39 -0.44 -0.23 -0.16 -0.13 -0.09 NOM.WAGES_PCER -0.48 -0.49 -0.26 -0.15 -0.08 0.17 BENEFITS_PCER 0.89 0.64 0.76 0.78 0.78 0.85 UNEMPL.RATE_ER -0.05 -0.30 -0.41 -0.45 -0.48 -0.51 VAT_ER 1.55 1.34 1.24 1.18 1.15 1.15 TL_ER -1.70 -1.70 -1.71 -1.71 -1.71 -1.73 TRADE.BAL.TO.GDP_ER -0.03 -0.14 -0.15 -0.15 -0.15 -0.14
53. In the following, we shall report only the data for scenario 2 which seems to be more realistic. All results for scenario 1 are however presented in the Annex.
Raising the share of indirect taxes to 40 per cent of total tax revenues
Figure 1: Shift to 40% share of indirect taxes: EU15 GDP and employment (scenario 2)
Note: Solid line GDP, dotted line employment (percentage differences from baseline). Scenario 2: benefits indexed to consumer prices
18
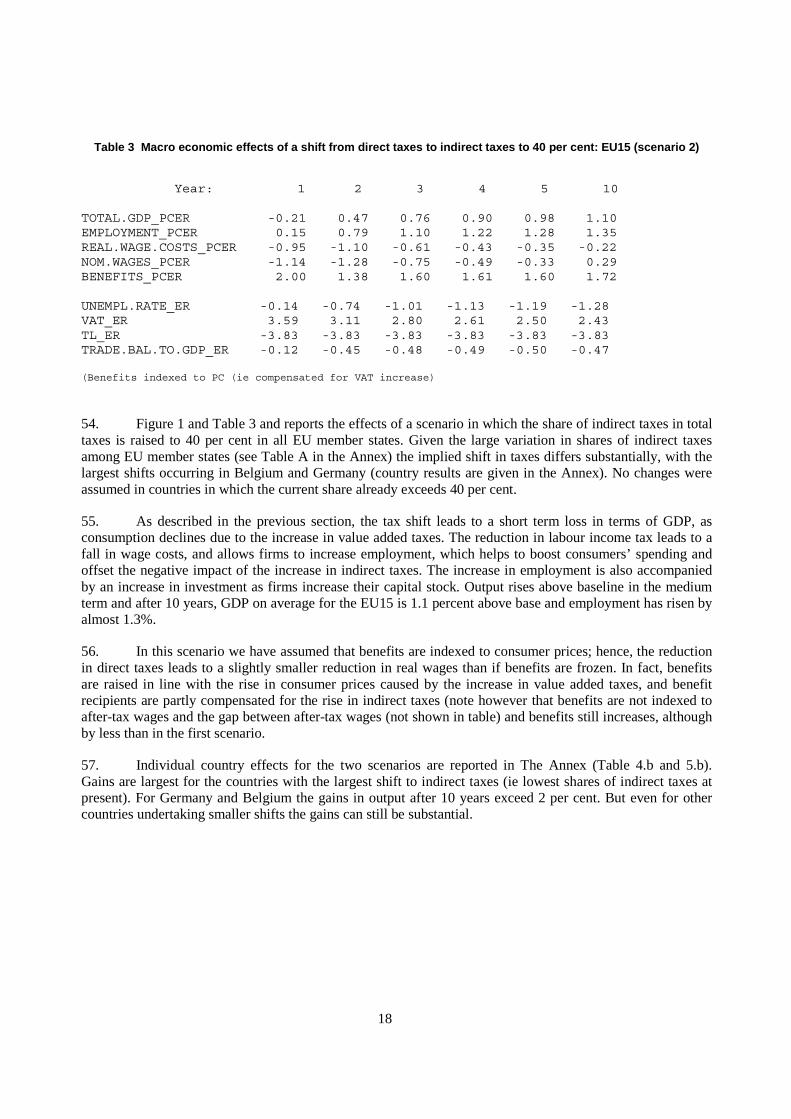
Table 3 Macro economic effects of a shift from direct taxes to indirect taxes to 40 per cent: EU15 (scenario 2)
Year: 1 2 3 4 5 10 TOTAL.GDP_PCER -0.21 0.47 0.76 0.90 0.98 1.10 EMPLOYMENT_PCER 0.15 0.79 1.10 1.22 1.28 1.35 REAL.WAGE.COSTS_PCER -0.95 -1.10 -0.61 -0.43 -0.35 -0.22 NOM.WAGES_PCER -1.14 -1.28 -0.75 -0.49 -0.33 0.29 BENEFITS_PCER 2.00 1.38 1.60 1.61 1.60 1.72 UNEMPL.RATE_ER -0.14 -0.74 -1.01 -1.13 -1.19 -1.28 VAT_ER 3.59 3.11 2.80 2.61 2.50 2.43 TL_ER -3.83 -3.83 -3.83 -3.83 -3.83 -3.83 TRADE.BAL.TO.GDP_ER -0.12 -0.45 -0.48 -0.49 -0.50 -0.47 (Benefits indexed to PC (ie compensated for VAT increase)
54. Figure 1 and Table 3 and reports the effects of a scenario in which the share of indirect taxes in total taxes is raised to 40 per cent in all EU member states. Given the large variation in shares of indirect taxes among EU member states (see Table A in the Annex) the implied shift in taxes differs substantially, with the largest shifts occurring in Belgium and Germany (country results are given in the Annex). No changes were assumed in countries in which the current share already exceeds 40 per cent.
55. As described in the previous section, the tax shift leads to a short term loss in terms of GDP, as consumption declines due to the increase in value added taxes. The reduction in labour income tax leads to a fall in wage costs, and allows firms to increase employment, which helps to boost consumers’ spending and offset the negative impact of the increase in indirect taxes. The increase in employment is also accompanied by an increase in investment as firms increase their capital stock. Output rises above baseline in the medium term and after 10 years, GDP on average for the EU15 is 1.1 percent above base and employment has risen by almost 1.3%.
56. In this scenario we have assumed that benefits are indexed to consumer prices; hence, the reduction in direct taxes leads to a slightly smaller reduction in real wages than if benefits are frozen. In fact, benefits are raised in line with the rise in consumer prices caused by the increase in value added taxes, and benefit recipients are partly compensated for the rise in indirect taxes (note however that benefits are not indexed to after-tax wages and the gap between after-tax wages (not shown in table) and benefits still increases, although by less than in the first scenario.
57. Individual country effects for the two scenarios are reported in The Annex (Table 4.b and 5.b). Gains are largest for the countries with the largest shift to indirect taxes (ie lowest shares of indirect taxes at present). For Germany and Belgium the gains in output after 10 years exceed 2 per cent. But even for other countries undertaking smaller shifts the gains can still be substantial.

19
Raising the share of indirect taxes to 50 per cent of total tax revenues.
Figure 2 Shift to 40% share and 50% share: EU15 GDP and employment (scenario 2)
Note: Solid line GDP, dotted line employment (percentage difference from baseline). Shift to indirect tax share of 40% in year 1 and to 50% in year 5. Scenario 2: benefits indexed to consumer prices
58. Table 4 and figure 2 show the effects of a scenario in which the share of indirect taxes in total taxes is raised from current levels to 40 per cent of total taxes immediately and to 50 per cent 5 years later. This implies a much larger shift than the previous scenarios and has larger macroeconomic effects. It is assumed that the second tax shift occurs in the 6th year of the simulation, but is announced and fully anticipated by consumers. The effect of an announced increase in value added taxes in the model is a sharp front loading of consumers’ spending to the year before the tax increase, and lower consumption in the year after the increase in indirect taxes. This explains the large swing in the 5th and 6th year in Figure 2, with GDP growing by close to 4 per cent above base, but falling back to a level of slightly more than 1 per cent above base in the following year.
59. Beside this temporary effect of the announced second tax increase, the output and employment gains of a tax shift to a 50 per cent share of indirect taxes are permanent, and much larger than for the shift to a 40 per cent share. After 10 years GDP for the EU15 is more than 2 above baseline. Employment also increases by more, and after 10 years is 3 per cent above base. All these gains are, of course, much higher in the scenario with no adjustment of benefits (for which results are given in The Annex).
20
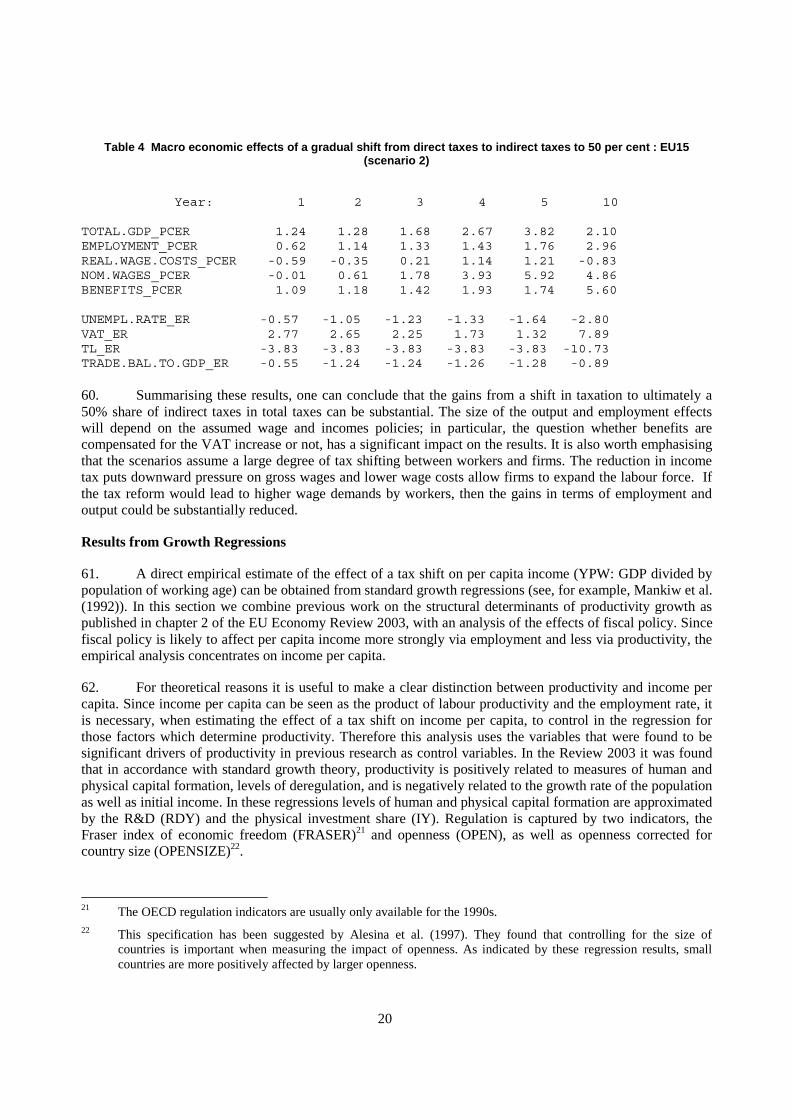
Table 4 Macro economic effects of a gradual shift from direct taxes to indirect taxes to 50 per cent : EU15 (scenario 2)
Year: 1 2 3 4 5 10 TOTAL.GDP_PCER 1.24 1.28 1.68 2.67 3.82 2.10 EMPLOYMENT_PCER 0.62 1.14 1.33 1.43 1.76 2.96 REAL.WAGE.COSTS_PCER -0.59 -0.35 0.21 1.14 1.21 -0.83 NOM.WAGES_PCER -0.01 0.61 1.78 3.93 5.92 4.86 BENEFITS_PCER 1.09 1.18 1.42 1.93 1.74 5.60 UNEMPL.RATE_ER -0.57 -1.05 -1.23 -1.33 -1.64 -2.80 VAT_ER 2.77 2.65 2.25 1.73 1.32 7.89 TL_ER -3.83 -3.83 -3.83 -3.83 -3.83 -10.73 TRADE.BAL.TO.GDP_ER -0.55 -1.24 -1.24 -1.26 -1.28 -0.89 60. Summarising these results, one can conclude that the gains from a shift in taxation to ultimately a 50% share of indirect taxes in total taxes can be substantial. The size of the output and employment effects will depend on the assumed wage and incomes policies; in particular, the question whether benefits are compensated for the VAT increase or not, has a significant impact on the results. It is also worth emphasising that the scenarios assume a large degree of tax shifting between workers and firms. The reduction in income tax puts downward pressure on gross wages and lower wage costs allow firms to expand the labour force. If the tax reform would lead to higher wage demands by workers, then the gains in terms of employment and output could be substantially reduced.
Results from Growth Regressions
61. A direct empirical estimate of the effect of a tax shift on per capita income (YPW: GDP divided by population of working age) can be obtained from standard growth regressions (see, for example, Mankiw et al. (1992)). In this section we combine previous work on the structural determinants of productivity growth as published in chapter 2 of the EU Economy Review 2003, with an analysis of the effects of fiscal policy. Since fiscal policy is likely to affect per capita income more strongly via employment and less via productivity, the empirical analysis concentrates on income per capita.
62. For theoretical reasons it is useful to make a clear distinction between productivity and income per capita. Since income per capita can be seen as the product of labour productivity and the employment rate, it is necessary, when estimating the effect of a tax shift on income per capita, to control in the regression for those factors which determine productivity. Therefore this analysis uses the variables that were found to be significant drivers of productivity in previous research as control variables. In the Review 2003 it was found that in accordance with standard growth theory, productivity is positively related to measures of human and physical capital formation, levels of deregulation, and is negatively related to the growth rate of the population as well as initial income. In these regressions levels of human and physical capital formation are approximated by the R&D (RDY) and the physical investment share (IY). Regulation is captured by two indicators, the Fraser index of economic freedom (FRASER)21 and openness (OPEN), as well as openness corrected for country size (OPENSIZE)22.
21 The OECD regulation indicators are usually only available for the 1990s. 22 This specification has been suggested by Alesina et al. (1997). They found that controlling for the size of
countries is important when measuring the impact of openness. As indicated by these regression results, small countries are more positively affected by larger openness.

21
63. The regressions distinguish effects from fiscal policy on the expenditure and the revenue side. On the expenditure side, the size of the government is measured by the share of government consumption in GDP (CGY). On the revenue side we concentrate on the structure of financing, and we use the ratio of indirect to direct taxation (TAXID) as an indicator. Adding both the government share and the structure of financing is important, since both could be systematically related.
Table: Growth regression (OECD countries)
Dependent variable: Real GDP growth per capita Variable Coeff T-Stat Signif
1. log (YWP) -0.062 -4.32 0.00 2. log (TAXID) 0.012 1.59 0.11 3. log (CGY) -0.073 -3.88 0.00 4. log (OPEN 0.118 1.08 0.28 5. log (OPENSIZE) -0.032 -0.85 0.39 6. log (FRASER) 0.054 3.14 0.00 7. log (IY) 0.033 2.59 0.01 8. log (RDY) 0.029 3.23 0.00 9. log (gpop+delta) -0.26 -1.19 0.23 Observations: 98 Adjusted R-squared -48
Panel regression with fixed time and country effects, Panel data with five year averages, 1975-2000.
64. As can be seen from the table, both additional variables have the expected sign. Government consumption has a negative effect on income per capita in the long run, which is highly significant23. The ratio of indirect to direct taxation is marginally significant (at the 11% level). The estimated coefficients suggests that after 10 years a change in the share of indirect taxation from currently 35% to 40% would lead to an increase in per capita income of about 2% in the EU. Thus over a period of 10 years higher growth of about .2% p. a. could be expected from a move towards a higher share of indirect taxation. The significance of the lagged level of income per capita in the regression does however suggest that the growth rate effect would only be temporary with the economy ending up at a level of income which would be about 4% higher in the long run.
23 Despite the strong significance of this effect one must be cautious in interpreting this result. Due to national
accounting conventions the output effect of government expenditure is biased downwards.

22
Section 4: CONCLUSIONS
65. The tax shift policy proposals reflect the desire to boost Europe's growth and employment performance. Given the difficulty encountered in many EU countries in financing a cut in the tax burden on labour through an overall expenditure reduction policy, it is currently being debated whether a shift in taxation from direct to indirect taxes might exert a beneficial effect on employment levels and GDP even at unchanged overall revenue levels.
66. Some of the existing economic literature and the simulation presented in this paper, carried out by the services of the Commission services on the QUEST model seem to suggest that such a taxation shift might indeed strengthen economic growth and increase employment. A number of studies examined in this note give similar results, pointing at an order of magnitude of around one quarter of a point in additional annual growth. The paper presents also results from growth regressions cautiously supporting the hypothesis that countries with a higher share of indirect taxation have tended to grow faster in the last decades.
67. It has nevertheless to be pointed out that no consensus exists in the economic profession on the usefulness of tax shifts. A strand of the literature represented notably by Layard-Nickell consider that the burden of indirect taxation is ultimately borne entirely by workers, so that the labour market reaction to the measure would render the shift ineffective in the long term. The reason for the ineffectiveness is directly linked to the unchanged real level of tax burden for workers.
68. Although it is impossible to summarise in a few lines the subtle differences in the models yielding the different results, this highlights the essential nature of the conundrum: whether hiking indirect taxation would be effective in shifting at least partly the tax burden on other taxpayers, i.e. benefit recipients, pensioners, but in particular recipients of capital income. It seems likely that the distribution of national income, the degree of tax avoidance and the specificities in capital taxation play a role in this respect.
69. Another area where country specificities may play a role is the fact that the specific institutional characteristics of the labour market, such as the degree of centralisation of wage bargaining, influence –most likely in the short term but possibly even in the long term- the labour market reaction to a hike or decline in taxes (degree of so-called real wage resistance).
70. Finally, the effect of increasing indirect taxes, particularly in the short term, varies according to the specific tax being increased. This is true in particular with regards to the effect on growth. Therefore, it would be useful to define more precisely what combination of increases would be optimal. In this paper it has been assumed that a VAT hike would constitute the bulk of the increase.
71. Another important issue, which is found to have an important bearing on the effects on growth and employment, is the choice of what direct taxes would be cut (personal income tax, corporate income tax or social contributions) and in which combination. The paper argues that a cut in employers' social security contributions financed by an increase in VAT, possibly complemented by other measures, may be one of the most attractive options in light of the stronger effects on employment and of a more direct impact on production costs, which should lead to more limited increases in the Consumer Price Index.

23
72. One problematic aspect of the tax shift proposal is that, in practice, it is likely to have substantial redistributive effects. Taxpayers with high incomes would probably benefit substantially, particularly when capital income is taxed within the personal income tax, while medium and low incomes might well face an increase in the tax burden. On the other hand, for the shift to be effective in increasing employment, it must have some positive redistributive effects particularly at the lower end of the wage distribution.
73. Another somewhat problematic consequence of a tax shift is that it would result in a one-off increase in the price level. This could lead to a wage-price spiral, particularly in countries with extensive price and wage indexation, or to negative effects on consumer and saver confidence. Earners of non-indexed income streams such as (long-term non-indexed) bond holders would lose out from the price increase, as would recipients of social security payments in the (not very realistic) hypotheses that these were not fully indexed to the price level. The simulations show clearly that in the case of non-indexation of social security payments, the resulting decline in the overall real burden of taxation would yield a strong positive effect in terms of employment and growth.
74. Finally, a shift to indirect taxation would –while introducing a one-off capital tax on bondholders- implicitly reduce taxation of future savings (assuming that the capital income is taxed within the personal income tax system). This would lead to greater capital accumulation and thereby to a series of effects on productivity; a part of the literature suggests that the effects from this would be dynamic, not static yielding large gains in the long run.
75. Summing up, the proposal to rebalance fiscal policy towards indirect taxation seems unlikely to constitute a panacea, but may in some countries represent a useful element in an overall strategy to improve growth performance, by means of a reduction of the fiscal charge on labour.

24
REFERENCES
Arpaia, A., Carone, G., Do labour taxes (and their composition) affect wages in the short and the long run?, European Economy Economic Paper N°216, October 2004.
Bassilière, Bossier, Bracke, Vanhorebeeck, Impacts économiques des finances publiques: quanification des effets des politiques affectant différentes categories de recettes et de dépenses, in Les finances publiques:défis à moyen et à long termes, CIFOP, Charleroi 2005
Bartlett, B., Tax reform and economic growth, 2004, Ripon Society
Bovenberg, A.L., Tax Policy And Labor Market Performance, Cesifo Working Paper no. 1035, September 2003
Brou, D., Collins, K. Winning at Hide and Seek: The Tax Mix and the Informal Economy, Canadian Tax Journal, Vol. 49 No. 6, (2001)
Burggraeve, K., Du Caju, P., The Labour Market And Fiscal Impact Of Labour Tax Reductions:The case of reduction of employers' social security contributions under a wage norm regime with automatic price indexing of wages, National Bank of Belgium Working Paper N° 36, March 2003
Caragata, P. and Giles, D., Simulating the Relationship Between the Hidden Economy and the Tax Level and Tax Mix in New Zealand, in Gerald W. Scully and Patrick J. Caragata, eds., Taxation and the Limits of Government, Boston, Kluwer, 2000
Centraal Plan Bureau, CPB Notitie 5 September 2005, Labour-market effects of the BEPA reform package.
Daveri, F. and Tabellini, G., Unemployment, Growth and Taxation in Industrial countries, Economic Policy 30, p. 47-104, (2000).
Feldstein, M., Krugman, P., International Trade Effects of Value Added Taxation, in Taxation and the Global Economy, ed. Assaf Raim and Joel Slemrod, pp. 263-278, University of Chicago press, 1990.
Gwartney, J., Lawson, R., Holcombe, R., The size and functions of government and economic growth, paper presented to the U.S. Joint Economic Committee, Washington D.C., April 1998
Hill, Roderick and Muhammed Kabir: Tax rates, the tax mix, and the growth of the underground economy in Canada: What can we infer? Canadian Tax Journal/ Revue Fiscale Canadienne, 44/ 6, pp. 1552-1583. (1996)
IMD, World Competitiveness Yearbook 2005, Lausanne
IMF Article IV Review of Austria, Selected Issues: The Impact of Government Size and the Composition of Revenue and Expenditure on Growth, Washington D.C., July 2004

25
Koskela, E., Schöb, R., Alleviating unemployment: The case for green tax reforms, European Economic Review, Vol. 43 issue 9, Oct. 1999
Lee, Y., Gordon, R., Tax structure and economic growth, Journal of public economics, Journal of Public Economics 89 (2005) 1027–1043
Layard, Nickell and Jackman, “Combatting Unemployment: Is Flexibility enough?” In OECD: Macroeconomic Policies and Structural Reform, Paris, 1996
Mendoza E., Milesi-Ferretti G.-M. and Asea, P., On the ineffectiveness of tax policy in altering long-run growth: Harberger's superneutrality conjecture, Jornal of Public Economics, Vol. 66 issue 1, October 1997
Schneider, F. and Neck, R., The development of the shadow economy under changing tax systems and structures: Some theoretical and empirical results for Austria, Finanzarchiv, 1993, 50 (3), 344-369.
Wyplosz, C., Economic Growth and the Labour Markets: Europe's Challenge, iNational Bank of Belgium Working Paper No. 8, May 2000

26
Annex SIMULATION ON THE BASIS OF THE QUEST MODEL: DETAILED RESULTS
This annex contains additional tables and graphs resulting from the simulation exercise in Section 3.
Table A Shares of indirect and direct taxes in total tax revenues (2002)
Country Indirect taxes Direct taxes Country Indirect taxes Direct taxes
Germany 0.30 0.70 Denmark 0.37 0.63
France 0.35 0.65 Ireland 0.34 0.66
Italy 0.31 0.69 Portugal 0.36 0.64
UK 0.42 0.58 Greece 0.43 0.57
Spain 0.37 0.63 Finland 0.35 0.65
Netherlands 0.36 0.64 Sweden 0.36 0.64
Belgium 0.28 0.72 Austria 0.36 0.64
Direct taxes include social contributions. Source: Commission services
Figure 1.a Shift to to 40% share of indirect taxes: EU15 GDP and employment (scenario 1)
27
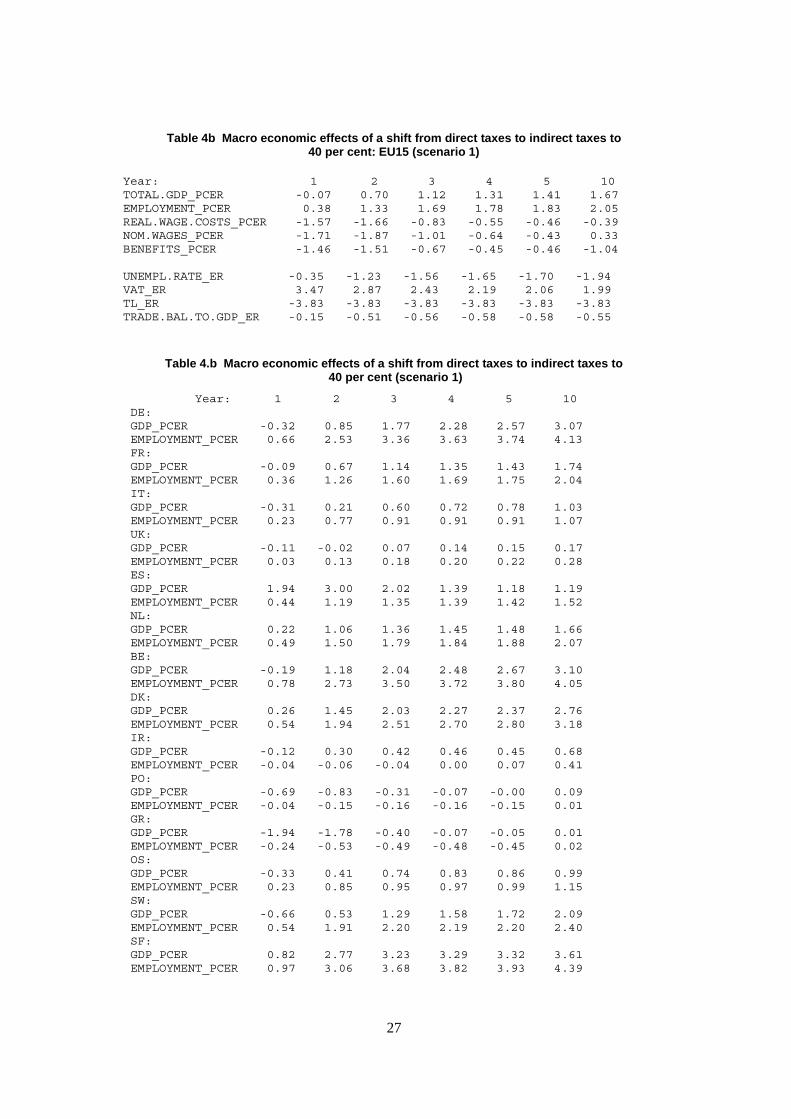
Table 4b Macro economic effects of a shift from direct taxes to indirect taxes to 40 per cent: EU15 (scenario 1)
Year: 1 2 3 4 5 10 TOTAL.GDP_PCER -0.07 0.70 1.12 1.31 1.41 1.67 EMPLOYMENT_PCER 0.38 1.33 1.69 1.78 1.83 2.05 REAL.WAGE.COSTS_PCER -1.57 -1.66 -0.83 -0.55 -0.46 -0.39 NOM.WAGES_PCER -1.71 -1.87 -1.01 -0.64 -0.43 0.33 BENEFITS_PCER -1.46 -1.51 -0.67 -0.45 -0.46 -1.04 UNEMPL.RATE_ER -0.35 -1.23 -1.56 -1.65 -1.70 -1.94 VAT_ER 3.47 2.87 2.43 2.19 2.06 1.99 TL_ER -3.83 -3.83 -3.83 -3.83 -3.83 -3.83 TRADE.BAL.TO.GDP_ER -0.15 -0.51 -0.56 -0.58 -0.58 -0.55
Table 4.b Macro economic effects of a shift from direct taxes to indirect taxes to 40 per cent (scenario 1)
Year: 1 2 3 4 5 10 DE: GDP_PCER -0.32 0.85 1.77 2.28 2.57 3.07 EMPLOYMENT_PCER 0.66 2.53 3.36 3.63 3.74 4.13 FR: GDP_PCER -0.09 0.67 1.14 1.35 1.43 1.74 EMPLOYMENT_PCER 0.36 1.26 1.60 1.69 1.75 2.04 IT: GDP_PCER -0.31 0.21 0.60 0.72 0.78 1.03 EMPLOYMENT_PCER 0.23 0.77 0.91 0.91 0.91 1.07 UK: GDP_PCER -0.11 -0.02 0.07 0.14 0.15 0.17 EMPLOYMENT_PCER 0.03 0.13 0.18 0.20 0.22 0.28 ES: GDP_PCER 1.94 3.00 2.02 1.39 1.18 1.19 EMPLOYMENT_PCER 0.44 1.19 1.35 1.39 1.42 1.52 NL: GDP_PCER 0.22 1.06 1.36 1.45 1.48 1.66 EMPLOYMENT_PCER 0.49 1.50 1.79 1.84 1.88 2.07 BE: GDP_PCER -0.19 1.18 2.04 2.48 2.67 3.10 EMPLOYMENT_PCER 0.78 2.73 3.50 3.72 3.80 4.05 DK: GDP_PCER 0.26 1.45 2.03 2.27 2.37 2.76 EMPLOYMENT_PCER 0.54 1.94 2.51 2.70 2.80 3.18 IR: GDP_PCER -0.12 0.30 0.42 0.46 0.45 0.68 EMPLOYMENT_PCER -0.04 -0.06 -0.04 0.00 0.07 0.41 PO: GDP_PCER -0.69 -0.83 -0.31 -0.07 -0.00 0.09 EMPLOYMENT_PCER -0.04 -0.15 -0.16 -0.16 -0.15 0.01 GR: GDP_PCER -1.94 -1.78 -0.40 -0.07 -0.05 0.01 EMPLOYMENT_PCER -0.24 -0.53 -0.49 -0.48 -0.45 0.02 OS: GDP_PCER -0.33 0.41 0.74 0.83 0.86 0.99 EMPLOYMENT_PCER 0.23 0.85 0.95 0.97 0.99 1.15 SW: GDP_PCER -0.66 0.53 1.29 1.58 1.72 2.09 EMPLOYMENT_PCER 0.54 1.91 2.20 2.19 2.20 2.40 SF: GDP_PCER 0.82 2.77 3.23 3.29 3.32 3.61 EMPLOYMENT_PCER 0.97 3.06 3.68 3.82 3.93 4.39
28
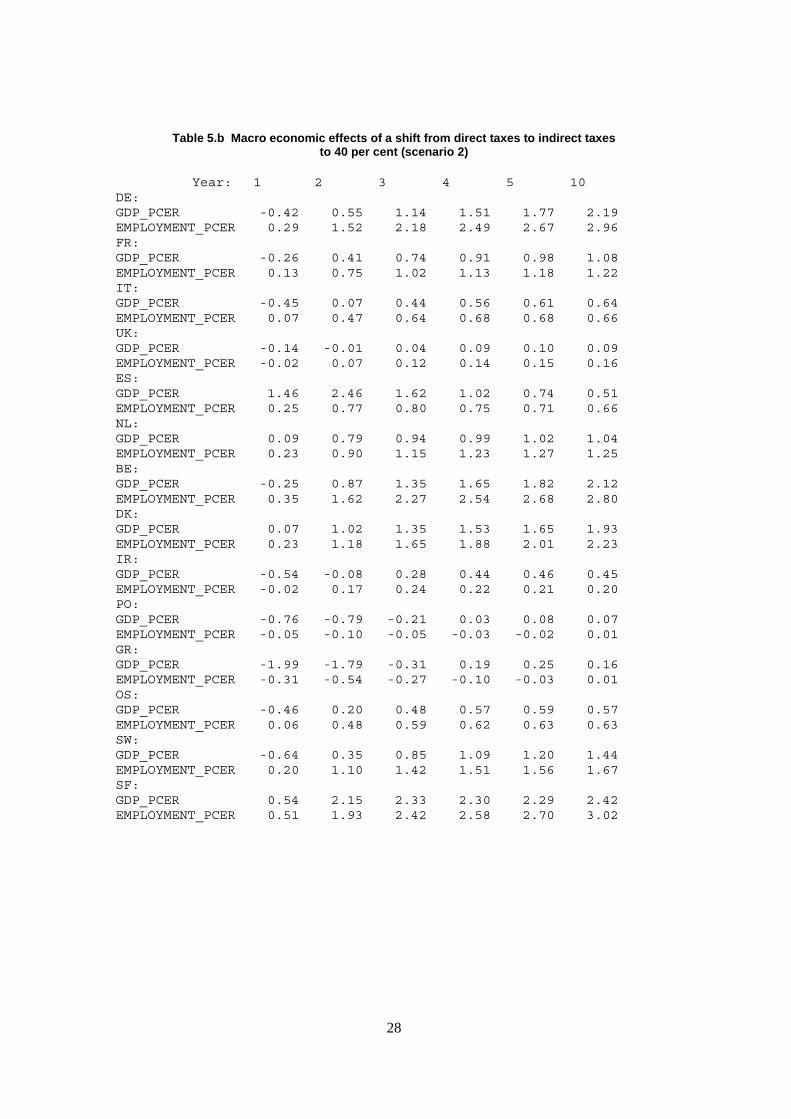
Table 5.b Macro economic effects of a shift from direct taxes to indirect taxes to 40 per cent (scenario 2)
Year: 1 2 3 4 5 10 DE: GDP_PCER -0.42 0.55 1.14 1.51 1.77 2.19 EMPLOYMENT_PCER 0.29 1.52 2.18 2.49 2.67 2.96 FR: GDP_PCER -0.26 0.41 0.74 0.91 0.98 1.08 EMPLOYMENT_PCER 0.13 0.75 1.02 1.13 1.18 1.22 IT: GDP_PCER -0.45 0.07 0.44 0.56 0.61 0.64 EMPLOYMENT_PCER 0.07 0.47 0.64 0.68 0.68 0.66 UK: GDP_PCER -0.14 -0.01 0.04 0.09 0.10 0.09 EMPLOYMENT_PCER -0.02 0.07 0.12 0.14 0.15 0.16 ES: GDP_PCER 1.46 2.46 1.62 1.02 0.74 0.51 EMPLOYMENT_PCER 0.25 0.77 0.80 0.75 0.71 0.66 NL: GDP_PCER 0.09 0.79 0.94 0.99 1.02 1.04 EMPLOYMENT_PCER 0.23 0.90 1.15 1.23 1.27 1.25 BE: GDP_PCER -0.25 0.87 1.35 1.65 1.82 2.12 EMPLOYMENT_PCER 0.35 1.62 2.27 2.54 2.68 2.80 DK: GDP_PCER 0.07 1.02 1.35 1.53 1.65 1.93 EMPLOYMENT_PCER 0.23 1.18 1.65 1.88 2.01 2.23 IR: GDP_PCER -0.54 -0.08 0.28 0.44 0.46 0.45 EMPLOYMENT_PCER -0.02 0.17 0.24 0.22 0.21 0.20 PO: GDP_PCER -0.76 -0.79 -0.21 0.03 0.08 0.07 EMPLOYMENT_PCER -0.05 -0.10 -0.05 -0.03 -0.02 0.01 GR: GDP_PCER -1.99 -1.79 -0.31 0.19 0.25 0.16 EMPLOYMENT_PCER -0.31 -0.54 -0.27 -0.10 -0.03 0.01 OS: GDP_PCER -0.46 0.20 0.48 0.57 0.59 0.57 EMPLOYMENT_PCER 0.06 0.48 0.59 0.62 0.63 0.63 SW: GDP_PCER -0.64 0.35 0.85 1.09 1.20 1.44 EMPLOYMENT_PCER 0.20 1.10 1.42 1.51 1.56 1.67 SF: GDP_PCER 0.54 2.15 2.33 2.30 2.29 2.42 EMPLOYMENT_PCER 0.51 1.93 2.42 2.58 2.70 3.02

29
Figure 2.a Shift to 40% share and 50% share: EU15 GDP and employment (scenario 1)
Table 6 Macro economic effects of a gradual shift from direct taxes to indirect taxes to 50 per cent: EU15 (scenario 1)
Year: 1 2 3 4 5 10 TOTAL.GDP_PCER 2.09 1.86 2.63 4.03 5.46 4.99 EMPLOYMENT_PCER 1.06 1.84 2.20 2.54 3.36 6.65 REAL.WAGE.COSTS_PCER -0.98 -0.73 0.08 1.03 0.41 -1.51 NOM.WAGES_PCER 0.00 0.67 2.31 4.88 6.56 6.09 BENEFITS_PCER -1.99 -2.18 -2.17 -2.75 -5.46 -8.56 UNEMPL.RATE_ER -0.99 -1.70 -2.04 -2.35 -3.13 -6.29 VAT_ER 2.37 2.39 1.74 1.03 0.50 5.92 TL_ER -3.83 -3.83 -3.83 -3.83 -3.83 -10.73 TRADE.BAL.TO.GDP_ER -0.75 -1.53 -1.56 -1.59 -1.60 -1.29